Abstract
Vulnerability assessment is of great significance to highway traffic system. As the widespread cascading failure may cause serious damage, factor identification is necessary to improve the security level of highway system. In this paper, the Dematel method is applied to identify the vulnerability priorities of important factors, and a new assessment method for highway system vulnerability is presented by considering system cascading failure. The traffic allocation and reallocation are then optimized under user equilibrium assignment model in different scenarios. Finally, the methodology is applied to the Heilongjiang highway network and the results shows that vulnerable sections in highway networks can be determined efficiently in our proposed process.
1. Introduction
In China, the highway traffic system provides a comfortable and speedy transport function to all citizens, trade and industry nationwide. However, incidents, such as vehicle crashes, road construction, lane blockages, and extreme weather, can make parts of the highway traffic system impassable and thus lead to widespread cascading failure. Taking the low-temperature frost and snow disaster in southern China in 2008 as an example, highway traffic was hindered in many provinces and direct losses of up to 159.5 billion yuan and 162 lifelines were resulted [1]. Taking the low-temperature frost and snow disaster in southern China in 2008 as an example, highway traffic was hindered in many provinces and direct losses of up to 159.5 billion yuan and 162 lifelines were resulted. In order to implement suitable policy to reduce the serious loss caused by congestion effects and delays, there is a need for an assessment of the highway traffic system vulnerability.
The concept of a vulnerable system is first defined as a system that operates with a “reduced level of security that renders it vulnerable to the cumulative effects of a series of moderate disturbances” [2]. Timmerman regards vulnerability as affected degree on system performance caused by disasters and other incidents [3]. Up to now, the vulnerability concept has been applied to different research fields, however there is not a fully recognized definition for transport system vulnerability. Deep research about transport vulnerability under extreme climate change is far from comprehensive development [4]. Transportation vulnerability is fit for traffic network analysis because it considers not only the probability but also the consequences of disasters. vulnerability can be regarded as an essential indication of the highway traffic system prone to cascading failures.
The methods of assessment for the transport system vulnerability can be divided into two categories: software simulation methods and mathematical modeling methods.
Software simulation methods assess the vulnerability of transport systems by simulating real-life scenarios and what-if scenarios through simulation software. Berdica etc. simulated the different flow-delay sections of Stockholm transport system and analyzed the main evaluation indicators including the average travel time, speed changes and total travel costs [5]. Lin used graph theory to establish rules of vulnerability system, and simulated vulnerability behavior [6]. Song proposed a new method by embedding the Delphi survey into geographic information system, and assessed regional ecological vulnerability using Monte Carlo simulation [7]. Guardo proposed a software system that can preload Environmental and pesticide data to evaluate potential groundwater vulnerability to pesticides [8]. Ferber simulated different attack strategies by removing different nodes and analyzed the consequence severity of these strategies [9]. Software simulation methods generally consider a particular case. Longer time is needed for simulation under more conditions.
Mathematical modeling methods assess the vulnerability and identify the vulnerable sections of transport systems by constructing mathematical models. Asadabadi formulated an investment optimization framework by considering uncertain climate impacts and studied different climate change impacts on roadway networks [10]. Gabriele Landucci developed an analytical approach for risk assessment in transportation system [11]. Matisziw constructed an objective programming model to analyze the potential traffic flow change between the start and end point and identify important sections of the system [12]. A complex transportation system vulnerability model is established by combining fuzzy analytic hierarchy process and the maximum entropy principle [13]. Han developed a new hypercube queuing model to evaluate the vulnerability of urban fire emergency system [14]. Zhang explored the chain rear-end accident mechanism of freeway, and established vulnerability structural models [15]. Yang combined hierarchy analytic process with fuzzy comprehensive evaluation theory, and selected the single vulnerability evaluation index [16]. In the problem of complex traffic system vulnerability assessment, mathematical modeling methods have unique advantages for the accurate and logical characteristics. However, the modeling or solving process is difficult as well as the reasonable assumptions of the vulnerability assessment model.
Despite all the efforts in the above areas, no previous study on the highway vulnerability assessment has captured the system cascading failure factors based on general method like Dematel method. Specially, the relationship and interaction of heterogeneous factors causing highway cascading failures have generally been ignored in the vulnerability literature. Separate consideration of the factors may result in inaccurate estimations. Therefore, in this study we using Dematel method to assess the vulnerability of system cascading failure, and then presents a user equilibrium assignment model to optimize the traffic allocation and reallocation.
The remainder of this paper is organized as follows. The vulnerability of highway traffic system are analyzed on in Section 2. Vulnerability assessment system is established based on our proposed assessment method in Section 3. Then the algorithm design under user equilibrium assignment model is illustrated in Section 4. A case study of Heilongjiang highway network vulnerability assessment is applied in Section 5. Finally the conclusion is drawn in Section 6.
2. Analysis on Highway Traffic System Vulnerability
2.1. Vulnerability Factor Structure
Highway transportation system is a complex system which is open, non-linear, and self-adaptive. The subsystem of highway traffic system could be divided into four types (shown in Figure 1): Road, Vehicle, Human and Environment. Vulnerability factors of the first two subsystems are essential factors, and others are classified into external factors.
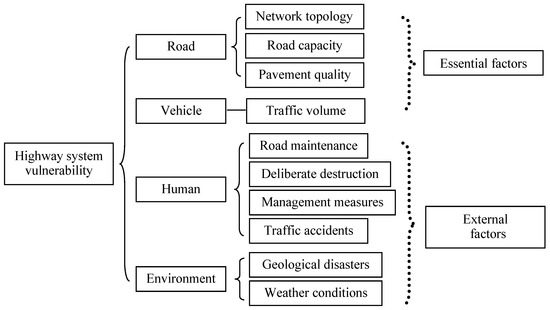
Figure 1.
Analysis of highway traffic system vulnerability.
2.2. Identification and Analysis of Vulnerability Factors by DEMATEL Method
The factors in a complex system may be mutually related in direct or indirect ways. As interferences with one of the factor may affects the others, sometimes it is difficult to find priorities for factor importance. Decision-makers may fail in obtaining a specific objective if the disruptions caused by the rest of the system cannot be avoided. The DEMATEL method, proposed by Fontela and Gabus from the Battelle Memorial Institute of Geneva, can be used to find priorities of various factors in an interdependent system [17]. Factors of the highway traffic system are the critical subsystem of a complex highway system, and mutually related, directly or indirectly. Its collapse will seriously interfere other sections. Therefore, the identification and analysis of vulnerability factors is essential to improve the highway traffic safety. The DEMATEL method studies the mutual influence relationship among multiple factors from the perspective of graph theory, analyzes the logical relationship among the system influencing factors, and derives the direct influence matrix through the empirical discrimination method. It is a method of analyzing the influencing factors of the system. The method performs matrix operations on the direct influence matrix, eliminates the mutual influence between them, and obtains the degree of influence of various factors on the system. The purpose of applying the DEMATEL method is to analyze components structure of vulnerability factors which includes essential factors and external factors to avoid the “overfitting” for decision-making.
The steps of the DEMATEL method are described as follows [18]:
- Step 1:
- Calculate the average matrix.
- Step 2:
- Calculate the initial direct influence matrix.
- Step 3:
- Derive the full direct/indirect influence matrix.
- Step 4:
- Set threshold value and obtain the impact-digraph-map.
According the steps of the DEMATEL method, the factor identification processes are conducted as follows.
(i) Determining the significant factors of the system. By doing literature review, information collection and field research on the expressway traffic system, we initially determine the possible vulnerability factor of the system and establish a system of possible vulnerability factor sets.
(ii) Establishing relationship matrix. We design surveys and summarize the results before establishing an initial direct impact relationship matrix. Expert experience method is used to judge the relationship between any two influencing factors. The influence of one influencing factor on itself is zero.
(iii) Calculating the indirect influence relationship matrix. Normalizing the directly influence matrix to ensure the influence degree of any two factors is within the range [0, 1). Using the matrix conversion method to calculate the comprehensive impact matrix, the indirect influence relationship of each factor can be obtained.
(iv) Drawing a causality diagram. We take the centrality of the influencing factor as the abscissa and the cause of the influencing factor as the ordinate to analyze the influencing factors of the system. In this way, we obtained the importance of every vulnerability factor of highway traffic system and the diagram of relationship between centrality degree and reason degree, which are shown in Table 1 and Figure 2 respectively.

Table 1.
Importance of every vulnerability factors of highway traffic system.
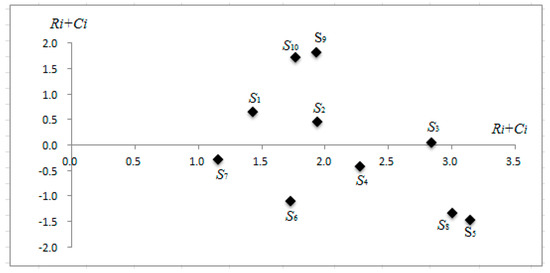
Figure 2.
Relationship between centrality degree and reason degree.
According to the results by DEMATEL method, the combined effect of the matrix, Table 1and Figure 2 were analyzed:
(1) Essential factors
Essential factors which impact on the highway transportation system vulnerability were ordered by descending importance as follow: traffic volume, road capacity, network topology, management measures, pavement quality. We regard these factors as direct reasons which lead to vulnerability excitation.
Among these results, the centrality degree of S5 (traffic volume factor) and S8 (road capacity factor) is respectively 3.1467 and 3.0025, which indicates the degree of their influence is important in the system. In the course of the actual operation of the road network, traffic volume and road capacity are equivalent to traffic demand and supply for transport. Interactions of both factors determine whether the vulnerability can be stimulated. The centrality degree of S6 (network topology factor) is 1.7229 and its reason degree is −1.103 degrees, which means that the importance of S6 cannot be ignored. Once the network topology of the system is changed, the internal system traffic redistribution would generated, which leads to traffic volume disturbance and vulnerability excitation
(2) External factors
External factors were also ordered by descending importance as follow: geological disasters, weather conditions, road maintenance, deliberate destruction, traffic accidents. The reason degree of these factors is greater than 0, indicating that influence on the system from external factors is greater than the influence on external factors from the system. External factors are the direct external causes of the system vulnerability. Vulnerability of these five factors is analyzed.
The reason degrees of S10 (Geological disasters factor) is 1.7077, the most significant importance of external factors, which is consistent with our perception. Once the geological disaster occurs, it will have a serious impact on the highway system. However, geological disasters have lower frequencies and some of them are predictable and preventable, therefore S10 is not considered as vulnerability influencing factor in the conventional highway network design, management and operation. The centrality degree and reason degree of S9 (weather conditions) and S1 (Road maintenance) is not higher than other external factors except S10, which means that they are main vulnerability factors of highway traffic system. The reason degree of S2 (deliberate destruction) is not relatively high, indicating deliberate destruction rarely happen in China. Therefore S2 is not regarded as the main vulnerability factor. As for S3 (traffic accidents), although the reason degree is not high, its centrality degree is 2.845, which is greatest among all of the external factors. Therefore, we regard it as the main vulnerability factor. To sum up, the main vulnerability factors are S9 (weather conditions), S1 (Road maintenance) and S3 (traffic accidents).
3. Vulnerability Assessment System Establishment
3.1. Vulnerability Assessment System Establishment
In order to assess the vulnerability of highway transport system based on cascading failure phenomenon, we must identify the status of vulnerable sections. If the traffic volume is less than or equal to the maximum highway capacity, the section is in a normal status; On the contrary, if the traffic flow is more than the maximum highway capacity, the section is in a failed status.
In the latter status, traffic flow is reallocated, and an alternative route is chosen by users who have selected the vulnerable section of highway transport system. If the traffic flow is more than the maximum highway capacity after flow redistribution, the other sections would convert from a normal status to a failed status, which causes more serious congestion. As a result, another reallocation of traffic flow is necessary. The cascading failure would not end out until the traffic flow is less than the maximum highway capacity.
Traffic flow reallocation is a repeated iteration step which is critical to vulnerability assessment of highway transport system. User equilibrium assignment model (UE model) and system optimal allocation model (SUE model) are widely used in traffic flow reallocation. When the vulnerable section is exposed, users who have selected the vulnerable section need to choose an alternative route. Note that the users cannot fully understand real-time traffic information and other travelers’ choice before making decisions, and they seek to select the optimal path to minimize their transportation cost. Therefore, the UE model can be used to evaluate methods of vulnerability.
The equivalent mathematical formulation is
where, is the number of trips between the O-D pair (i, j) that uses path , is the cost of flow using link , is the flow in link , and equal to one if part of path between and belongs to link and zero otherwise.
Some measure indices are frequently used in complex network assessment. They include point degree, degree distribution, average distance, shortest distance, effectiveness, clustering coefficients, betweenness and so on.
As static indices of complex systems, they are often used to compare the effectiveness of different networks. However, the vulnerability excitation of highway network system is a dynamic, concatenate and time-delay process, the static indices cannot accurately measure the vulnerability excitation impact to users in the system. Therefore, we consider the congestion-caused failure process and attempt to define vulnerability measure indices of highway network system.
Cascading failure of highway network system caused by vulnerable sections may bring impact to users in two ways. If users at vulnerable sections cannot find an alternative route to reach the destination, their travel demands could not be met, which will result in delays in travel. For another, if users at vulnerable sections reach the destination through a detour on a trip, they would spend more travel time and travel costs to meet their travel demand.
In case of vulnerable section failure, if the demand of travelling to destination could not be met, the users have to wait until the vulnerable section becomes normal, or exit the highway and enter other low grade road. Then the traffic supply of the section drops to 0 due to the vulnerable section failure. In this issue, assessment formula proposed by Jenelius is used for failure section [19].
If the users have to detour to meet their travel demands, the economic costs of travel can be measured by the total cost of travel, see Equation (3). And the travel time cost can be measured by total travel time in highway network, see Equation (4).
where, is the total travel cost after traffic flow allocation due to section failure, is the Length of section , is the toll station costs per kilometer, is the fuel costs per kilometer. According to the highway toll station fees standard of Heilongjiang Province, is set to be 0.5 Yuan. is set to be 0.6 Yuan due to the average fuel consumption of vehicles.
where, is the total travel time after traffic flow allocation due to section failure, represents the scenario that section is in failure status, is the traffic flow allocated for section before iterations, is the traffic flow allocated for section after iterations, is the section travel time, and we use BPR function , where we set 0.15 for , and 4 for .
The total cost of travel is
where, is time value per hour, and we set 20 for it here.
Considering these two factors, we defined vulnerability value as follow,
where, is the total cost of travel without UE equilibrium process.
After dimensionless, the vulnerability assessment indices of highway network system are represented as a value between 0 and 1, the formula as follows:
where, is the dimensionless vulnerability value, is the original vulnerability value, is the maximal vulnerability value and is the minimal vulnerability value for each highway section.
The levels of vulnerability are graded as shown in Table 2.
Table 2.
Vulnerability Index Ranking.
3.2. Vulnerability Assessment Process
We firstly collect information (including highway network length, number of lanes, the node population of the existing road network, mark the numbers of nodes and links newly created. Then we generate the network topology of the actual system through link information statistics.
By applying the UE traffic assignment model to traffic flow reallocation, we can obtain the initial traffic flow. The impedance of failure sections is set to ∞, and the number of iterations k is set to 1. Before each time traffic flow is reallocated, we judge whether the OD traffic demand is met. If so, a separate record of this traffic demand is made, and the traffic demand of the OD matrix is changed to 0. If not, the traffic flow is directly reallocated. The next step is OD traffic matrix redistribution. Through that we judge whether there is a section in which the traffic flow is more than its traffic capacity. The impedance of this section is set to ∞, and the number of iterations k is added by 1. Then the traffic flow based on the new impedance matrix is reallocated. Repeat the step until the traffic flow is less than its traffic capacity in sections whose impedance is not ∞. As soon as the congestion propagation does not continue, effects iterations come to the end. Figure 3 shows the algorithm flow.
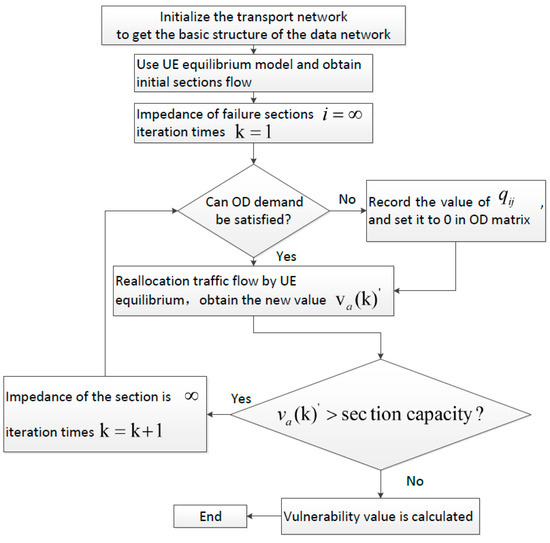
Figure 3.
System vulnerability assessment flowchart.
4. Algorithm Design
According to vulnerability assessment indices and process of highway network system, we programmed algorithm for our model by Matlab software. UE equilibrium model was solved by using the steepest descent method, in which the basic step is to find the descent direction and the step size [20]. According to the basic principles and steps of the steepest descent method, solving methods for UE balanced distribution model are shown in Figure 4.
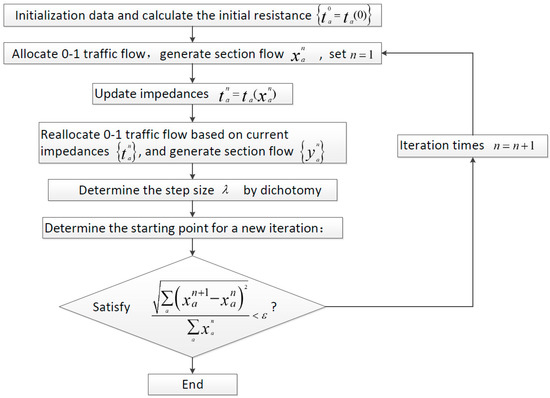
Figure 4.
Solving flowchart for user equilibrium allocation model.
The basic formula for the steepest descent method is as shown in Equation (8).
where, is the traffic flow vector of the n-th iteration. is the step size to be determined.
Solving equation for iteration step is as follow:
5. Case Study
We test our methodology on a transportation network of Heilongjiang Province, China (see Figure 5). Heilongjiang locates in the northeastern part of the country and contains China’s northernmost point and easternmost point. Its network consists in a total of 19 links and 17 nodes. Every node can be the origin or the destination. Node No. and City Information are shown in Table 3.
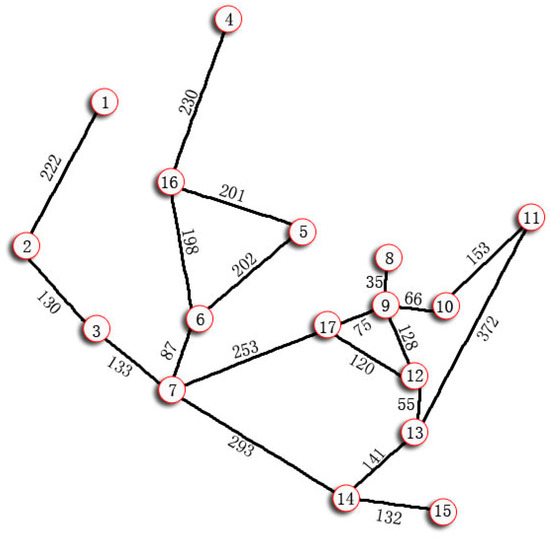
Figure 5.
Highway network topology of Heilongjiang Province.
Table 3.
Node No. and City Information.
To investigate the traffic volume of Heilongjiang Provincial highway is difficult, thus we use unconstrained gravity model to analysis the OD matrix which is shown in Table 4.
where, is the traffic flow from to , , are population of and .
Table 4.
Traffic Demand Matrix.
We used Matlab software to program and run the algorithm of vulnerability assessment. The result is shown in Table 5.
Table 5.
Result of Section Vulnerability Value.
In the assessment S3 (traffic accident factor) is chosen for its main vulnerability character. Assuming that the weather is in normal conditions, highway closure is caused by an accident, which leads to cascading failures. According to Formula (9), the results are shown in Table 6.
Table 6.
Dimensionless Result of Section Vulnerability Value.
Table 7 shows that Section 7 and 8 are ranked in High Vulnerability Level. In other words, once the vulnerable section in High Level suffered from incidents including vehicle crashes and severe weather, cascading failures probably happen. Section 2 is ranked in Medium Level, and its vulnerability is less serious than Section 7 and 8. Section 5, 11, 14, 9 and 19 have the least extent of vulnerability. The remaining sections are not attributed to the three vulnerability levels above, which means that incidents have little effect to these sections. The results demonstrate that our method is effective to determine vulnerable sections in highway networks.
Table 7.
Section Vulnerability Level Classification.
6. Conclusions
This paper by identifies the importance priority of highway transportation system vulnerability factors by applying Dematel method. A new assessment method for highway vulnerability is presented under system cascading failure. We establish vulnerability assessment system by considering different situations and UE equilibrium, and propose the location and reallocation model based on vulnerability assessment process. Finally, this methodology is applied to Heilongjiang highway network and the results demonstrate that the method is effective for the vulnerable sections identification in highway networks.
Due to the limitation of insufficient data, for the evaluation index of brittle sources, this paper only considered the consequences of failure, but did not include the probability of brittle failure. In future studies, the assessment of brittle sources can be performed by considering these two effects.
Author Contributions
Prof. Jian Wang conceived and designed the experiments; Han Liu performed the experiments, analyzed the data. Both of the authors wrote the paper.
Funding
National Natural Science Foundation of China (51578199). Theoretical Research on Traffic Network Design under the Background of Auto-Driven Cloud Plan.
Conflicts of Interest
The authors declare no conflict of interest.
References
- National Bureau of Statistics. Statistical Communiqué of the People’s Republic of China on the 2008 National Economic and Social Development. Available online: http://www.stats.gov.cn/tjgb/ndtjgb/qgndtjgb/t20090226_402540710.htm (accessed on 4 June 2018).
- Fink, L.H.; Carlsen, K. Power/energy: Operating under stress and strain. IEEE Spectr. 1978, 15, 48–53. [Google Scholar] [CrossRef]
- Timmerman, P. Vulnerability Resilience and Collapse of Society; Institute for Environmental Studies: Toronto, ON, Canada, 1981. [Google Scholar]
- Committee on Climate Change and U.S. Transportation. Transportation Research Board, and Division on Earth and Life Studies (2008) Potential Impacts of Climate Change on U.S. Transportation; Transportation Research Board of the National Academics: Washington, DC, USA, 2008. [Google Scholar]
- Berdica, K.; Mattsson, L.G. Vulnerability: A model-based case study of the road network in Stockholm. In Critical Infrastructure; Springer: Berlin/Heidelberg, Germany, 2007; Volume 31, pp. 81–106. [Google Scholar]
- Lin, D.; Jin, H.; Xue, P. Reseach on Brittleness of Traffic System Based on Adaptive Agent Digraph. J. Syst. Simul. 2008, 20, 733–737. [Google Scholar]
- Song, G.; Li, Z.; Yang, Y.; Semakula, H.M.; Zhang, S. Assessment of ecological vulnerability and decision-making application for prioritizing roadside ecological restoration: A method combining geographic information system, Delphi survey and Monte Carlo simulation. Ecol. Indic. 2015, 52, 57–65. [Google Scholar] [CrossRef]
- Di Guardo, A.; Finizio, A. A client–server software for the identification of groundwater vulnerability to pesticides at regional level. Sci. Total Environ. 2015, 530, 247–256. [Google Scholar] [CrossRef] [PubMed]
- Von Ferber, C.; Holovatch, T.; Holovatch, Y. Attack vulnerability of public transport networks. In Traffic and Granular Flow; Springer: Berlin/Heidelberg, 2009; pp. 721–731. [Google Scholar]
- Asadabadi, A.; Miller-Hooks, E. Assessing strategies for protecting transportation infrastructure from an uncertain climate future. Transp. Res. Part A: Policy Pract. 2017, 105, 27–41. [Google Scholar] [CrossRef]
- Landucci, G.; Antonioni, G.; Tugnoli, A.; Bonvicini, S.; Molag, M.; Cozzani, V. HazMat transportation risk assessment: A revisitation in the perspective of the Viareggio LPG accident. J. Loss Prev. Process Ind. 2017, 49, 36–46. [Google Scholar] [CrossRef]
- Matisziw, T.C.; Murray, A.T. Modeling s–t path availability to support disaster vulnerability assessment of network infrastructure. Comput. Oper. Res. 2009, 36, 16–26. [Google Scholar] [CrossRef]
- Yang, X. Reseach on Brittleness Theory Based on Complex Traffic System; Haibin University of Science and Technology: Harbin, China, 2009; pp. 27–32. [Google Scholar]
- Liu, H.; Wang, J.; Ouyang, Y. Responder Planning Under Hypercube Queuing Equilibrium, Cooperation and Disruptions. In Proceedings of the Annual Meeting of INFORMS, Huston, TX, USA, 22–25 October 2017. [Google Scholar]
- Zhang, J. The Research on Risk of Automobile Rear-End Chain on Freeway; Changsha University of Science and Technology: Changsha, China, 2012; pp. 41–49. [Google Scholar]
- Yang, J.; Sun, H.; Wang, L.; Li, L.; Wu, B. Vulnerability Evaluation of the Highway Transportation System against Meteorological Disasters. Procedia-Soc. Behav. Sci. 2013, 96, 280–293. [Google Scholar] [CrossRef]
- Gabus, A.; Fontela, E. Perceptions of the World Problem Atique: Communication Procedure, Communicating with Those Bearing Collective Responsibility; Battelle Geneva Research Centre: Switzerland, Geneva, 1973; Volume 19, pp. 179–186. [Google Scholar]
- Tzeng, G.H.; Chiang, C.H.; Li, C.W. Evaluating intertwined effects in e-learning programs: A novel hybrid MCDM model based on factor analysis and DEMATEL. Expert Syst. Appl. 2007, 32, 1028–1044. [Google Scholar] [CrossRef]
- Jenelius, E.; Petersen, T.; Mattsson, L.-G. Importance and exposure in road network vulnerability analysis. Transp. Res. Part A 2006, 40, 537–560. [Google Scholar] [CrossRef]
- Tsitsiklis, J.N.; Bertsekas, D.P.; Athans, M. Distributed asynchronous deterministic and stochastic gradient optimization algorithms. IEEE Trans. Autom. Control 1986, 31, 803–812. [Google Scholar] [CrossRef]


© 2018 by the authors. Licensee MDPI, Basel, Switzerland. This article is an open access article distributed under the terms and conditions of the Creative Commons Attribution (CC BY) license (http://creativecommons.org/licenses/by/4.0/).