Article

System Dynamics Analysis of Evolutionary Game Strategies between the Government and Investors Based on New Energy Power Construction Public-Private-Partnership (PPP) Project

Beijing Key Laboratory of New Energy and Low-Carbon Development, School of Economics and Management, North China Electric Power University, Changping, Beijing 102206, China
*
Author to whom correspondence should be addressed.
Sustainability 2018, 10(7), 2533; https://doi.org/10.3390/su10072533
Submission received: 26 June 2018 / Revised: 14 July 2018 / Accepted: 16 July 2018 / Published: 19 July 2018
(This article belongs to the Section Energy Sustainability)

Abstract

:
The public-private-partnership (PPP) is a new mode for the government and social capital to jointly invest in public infrastructure projects. In particular, PPP projects for new energy power construction have been strongly supported in some countries in recent years, because it can not only reduce financial pressure on the government, but also promote the development of new energy. Current scholars study the economic benefits of PPP projects for new energy power construction from a macro perspective, and they rarely study behavioral strategies of the government and social capital as a game process of project construction from a micro perspective. This paper will fill this gap. This study firstly built an evolutionary game model of the government and investors based on new energy power construction PPP projects. Secondly, taking China’s typical new energy power construction PPP project–waste incineration power generation as an example, the system dynamics (SD) model was proposed to simulate the evolutionary process of game players’ behavioral strategies. Finally, the effects of key factors in the construction of PPP project on the strategies’ stability were studied. The results show that: (1) there is no evolutionarily stable strategy (ESS) in the game system between the government and investors, and system evolution is characterized by periodic behavior. (2) When the government implements dynamic bounty measures, the system evolution process is still a closed loop with periodic motion. However, when the government implements dynamic punishment measures, there is a stable ESS in the hybrid strategy of the game system. (3) The government can increase unit fines when making dynamic strategic adjustments, which will not only promote the active cooperation of investors, but also reduce the probability of government supervision, thereby reducing costs.

1. Introduction

A public-private-partnership (PPP) is a partnership between the government and social capital in the field of infrastructure and public services. Social capital is mainly responsible for the design, construction, operation, and maintenance of the project, and the government department is responsible for supervising the price and quality of the project, thereby ensuring the maximum social benefits of the PPP project [1]. The National Energy Administration of China issued the Notice on Actively Promoting the Cooperation Model of Government and Social Capital in the Energy Sector on 31 March 2016 which explicitly encourages social capital to enter the field of new energy power construction, actively enriches PPP energy projects, and increases project initiation efforts [2]. Since then, provincial governments have successively issued corresponding supporting policies to encourage the development of new energy power PPP projects [3]. The government encourage the development of PPP through the top-level mechanism design for the reason that the construction of new energy power under the PPP model can enable the government and social capital (such as new energy power construction investors) to exert their own characteristics, advantages and expertise, thereby relying on considerable project investment benefits and risk-dispersion mechanisms to form a cooperative alliance body. This will not only alleviate the financial pressure, but also increase the efficiency of the government to promote the development of national infrastructure and public services.
Many scholars have conducted extensive research on PPP projects for new energy power construction. The current research mainly focuses on two aspects. One is the economic benefits and development of PPP projects. Yang et al. [4] analyzed the relevant tax policies of China’s electric vehicle charging infrastructure PPP projects, and found that the main problems are a low legislative level, unfairness, lack of mechanism, poor pertinence, and low policy coordination. Arbulú et al. [5] studied the impact of tourism on waste incineration power generation PPP projects, and found that it largely affected the management costs, and a PPP project should adapt to local electricity pricing policies to increase the economic benefits of the projects. Akcay et al. [6] constructed a method for estimating net present value, and considered risk factors to predict the investment profitability of Turkish PPP hydropower projects. Nikitenko and Goosen [7] explored the possibility of using instruments of PPP for a paradigm shift in subsoil use in the fuel and energy complex of Russia. Fantozzi et al. [8] presented a method for developing an agricultural energy business using a PPP model in Greece and Italy, and assessed the economic feasibility of the project. The other aspect is research on the risk management of a PPP project. Wu et al. [9] established an evaluation index system and a risk-assessment framework of the overall risk level of China’s waste incineration power generation PPP project. Emmanuel and Long [10] analyzed the practice of some successful PPP projects in the international renewable energy field, and provided risk control supports for the construction of PPP projects. Song et al. [11] investigated the main risks of China’s waste incineration power generation PPP projects, and explored strategies to deal with these risks through lessons learned. Liu and Wei [12] explored risk factors through questionnaire surveys, and used a comprehensive approach to fuzzy order preference to calculate the overall risk level of an electric vehicle charging infrastructure PPP project.
Existing literature has undertaken useful explorations on the economic benefits and risk assessment and control of new energy power construction PPP projects. They not only studied the impact of PPP projects on national economic development and social development, but also revealed the key factors in the process of cooperation between the government and investors. However, the current study also has some deficiencies. During the construction of a PPP project, since the investment and return of a given project are relatively fixed, and the government and investors are relatively rational, both parties hope to obtain high returns at a low cost. There is a dynamic adjustment process for both parties’ behavioral decision-making, that is, the dynamic game process. This study firstly analyzes the mechanism of PPP project from the perspective of game theory, and then analyzes the behavioral strategies of the government and investors in the process of the evolutionary game by proposing an evolutionary game model. Finally, the evolution process of the two strategies is simulated through a system dynamics (SD) model taking China’s waste incineration power generation as an example. The combination of evolutionary game and SD in our study not only clearly reveals the complex dynamic evolution process of the game model under the condition of limited rationality, but also provides a qualitative and quantitative simulation platform to analyze the dynamic game process between the government and investors during the construction of a new energy power PPP project, thereby providing effective theoretical support for government decision-making.

2. Methodology

In traditional game theory, it is often assumed that the participants are completely rational and enjoy complete information conditions. However, the participants’ complete rationality and complete information conditions are difficult to achieve in real economic life. Unlike traditional game theory, evolutionary game theory does not require full information and participants to be completely rational. The evolutionary game is based on “limited rationality”. It compares the human economic behavior in economic activities with biological evolution theory, and believes that humans usually achieve a game equilibrium through trial and error; and it emphasizes the dynamic process of constant change, adjustment, and convergence of behavioral decision making, and finally achieves a balanced and stable state. It is a theory combining game theory analysis with dynamic evolution process analysis. In methodology, it emphasizes dynamic equilibrium rather than static equilibrium. It originated from the theory of biological evolution, and successfully explained some phenomena in the process of biological evolution. Nowadays, economists use evolutionary game theory to analyze the influencing factors of social habits, norms, and systems, explaining their formation processes.
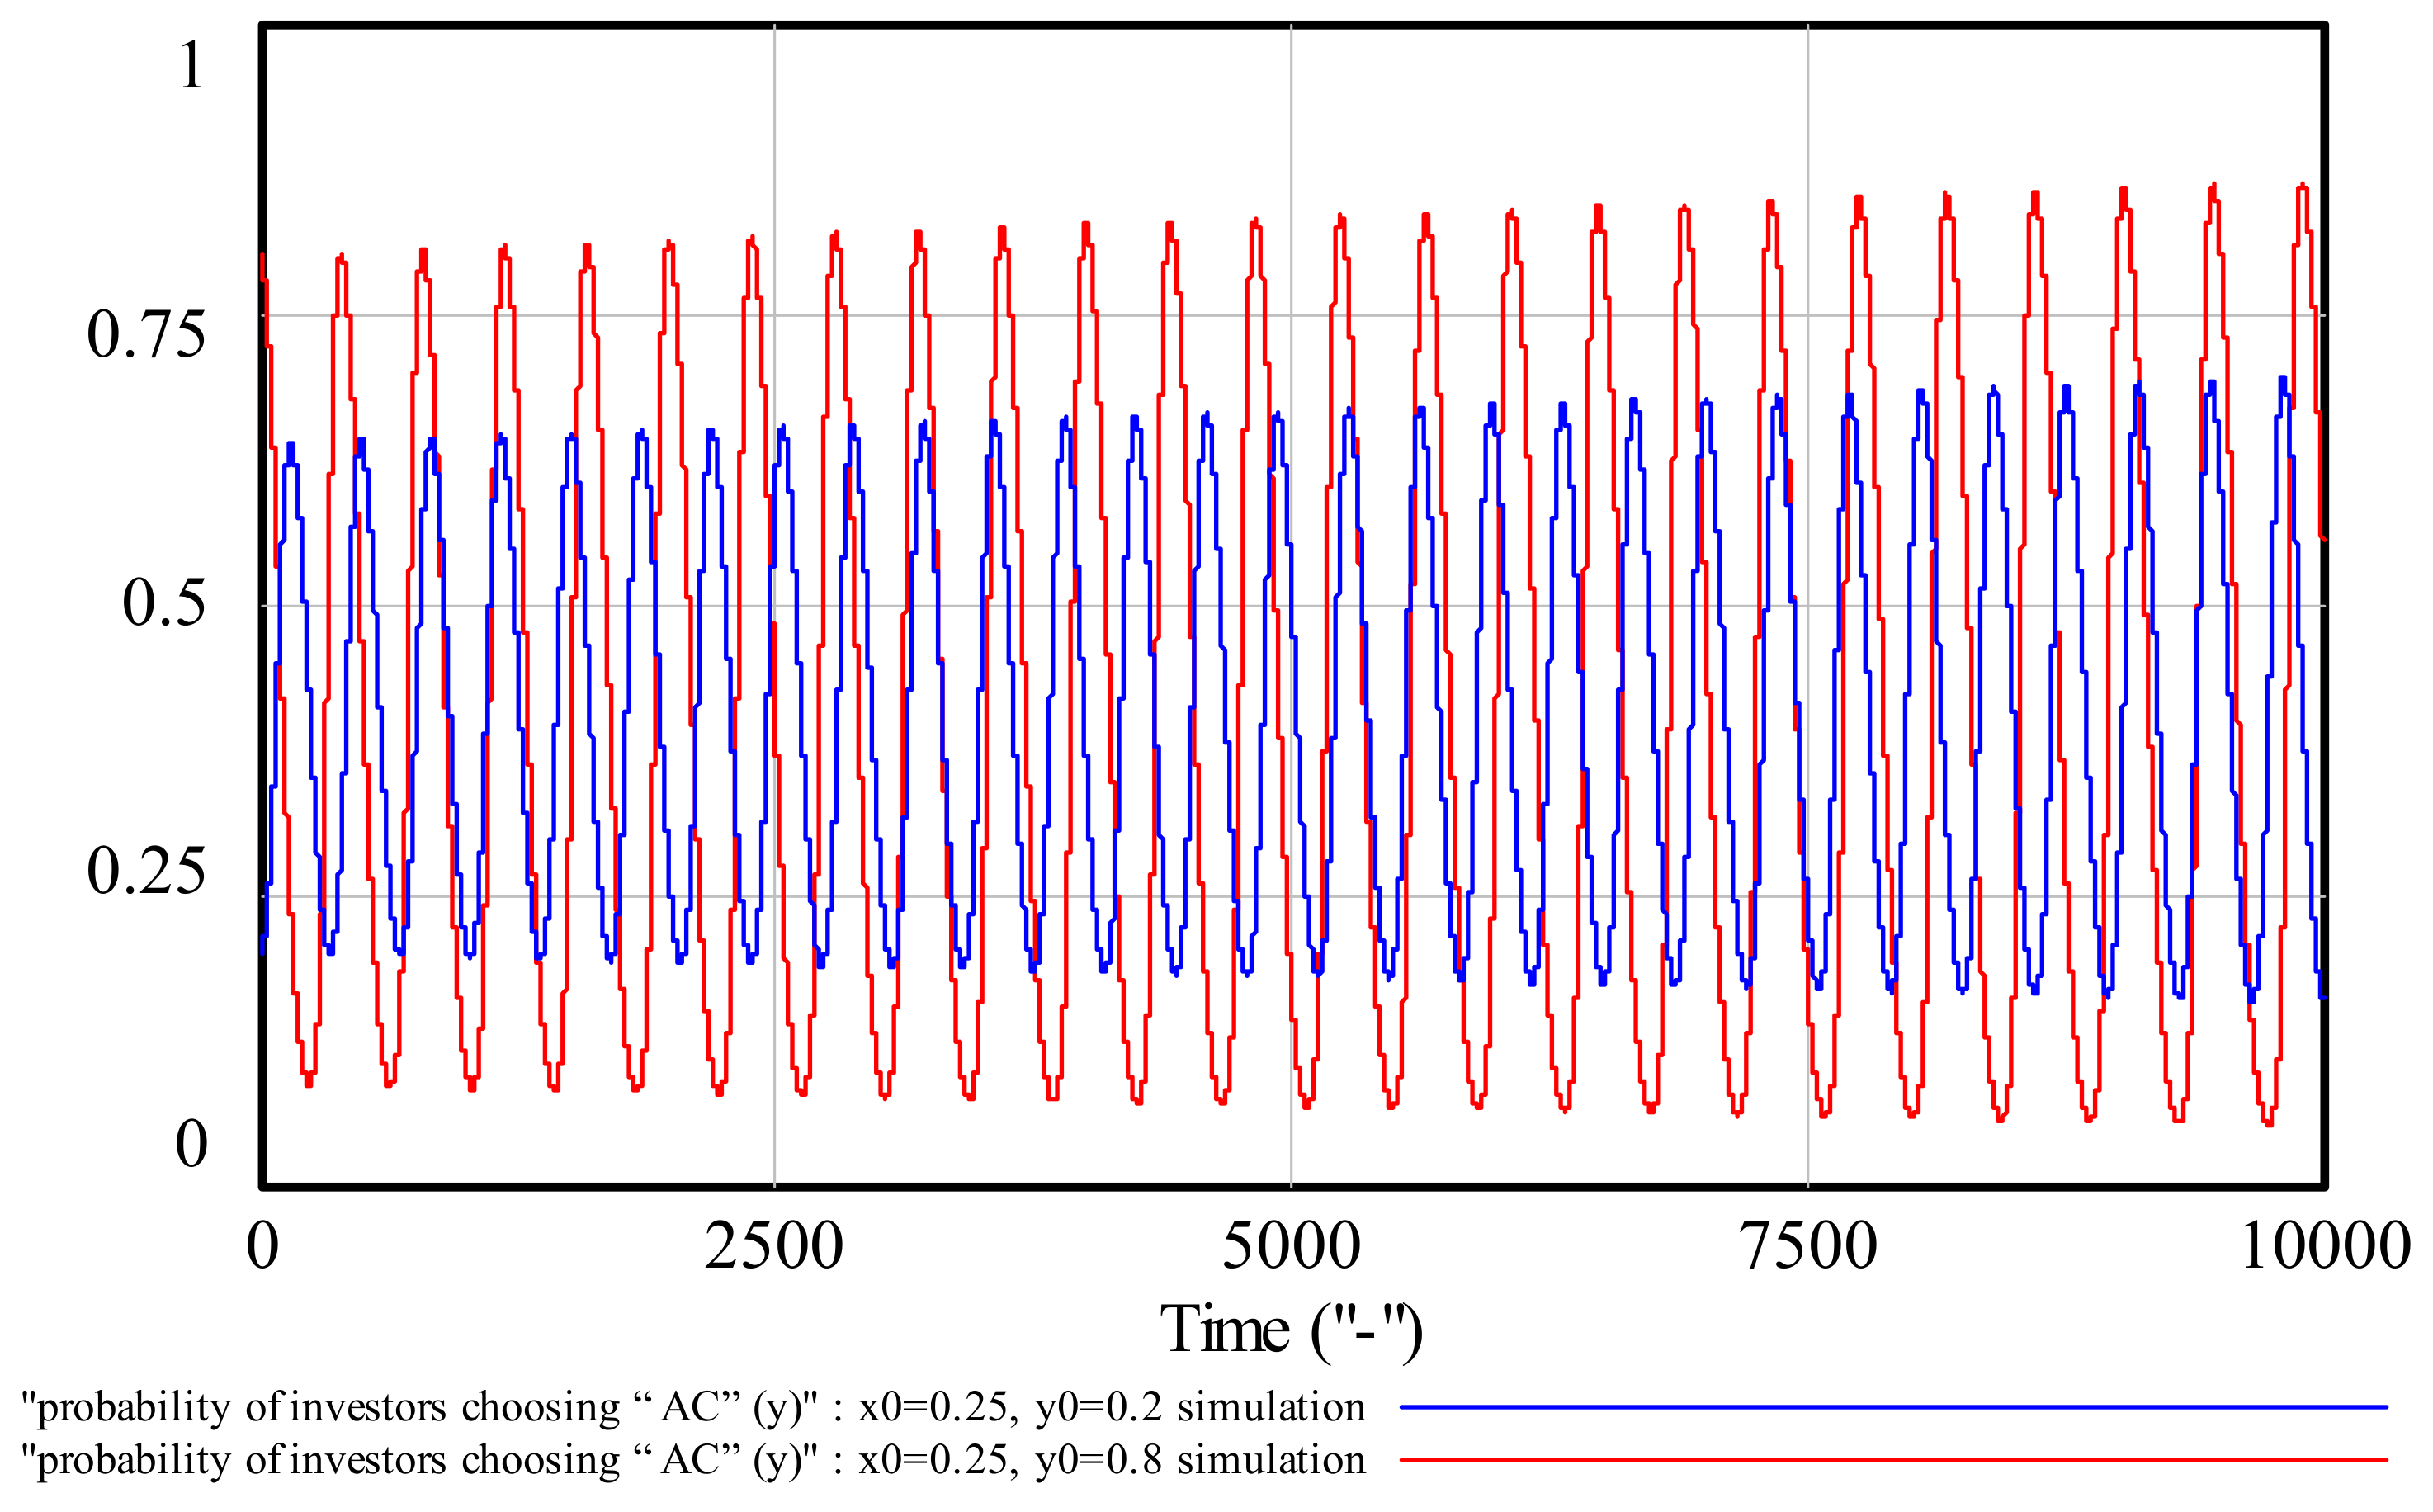
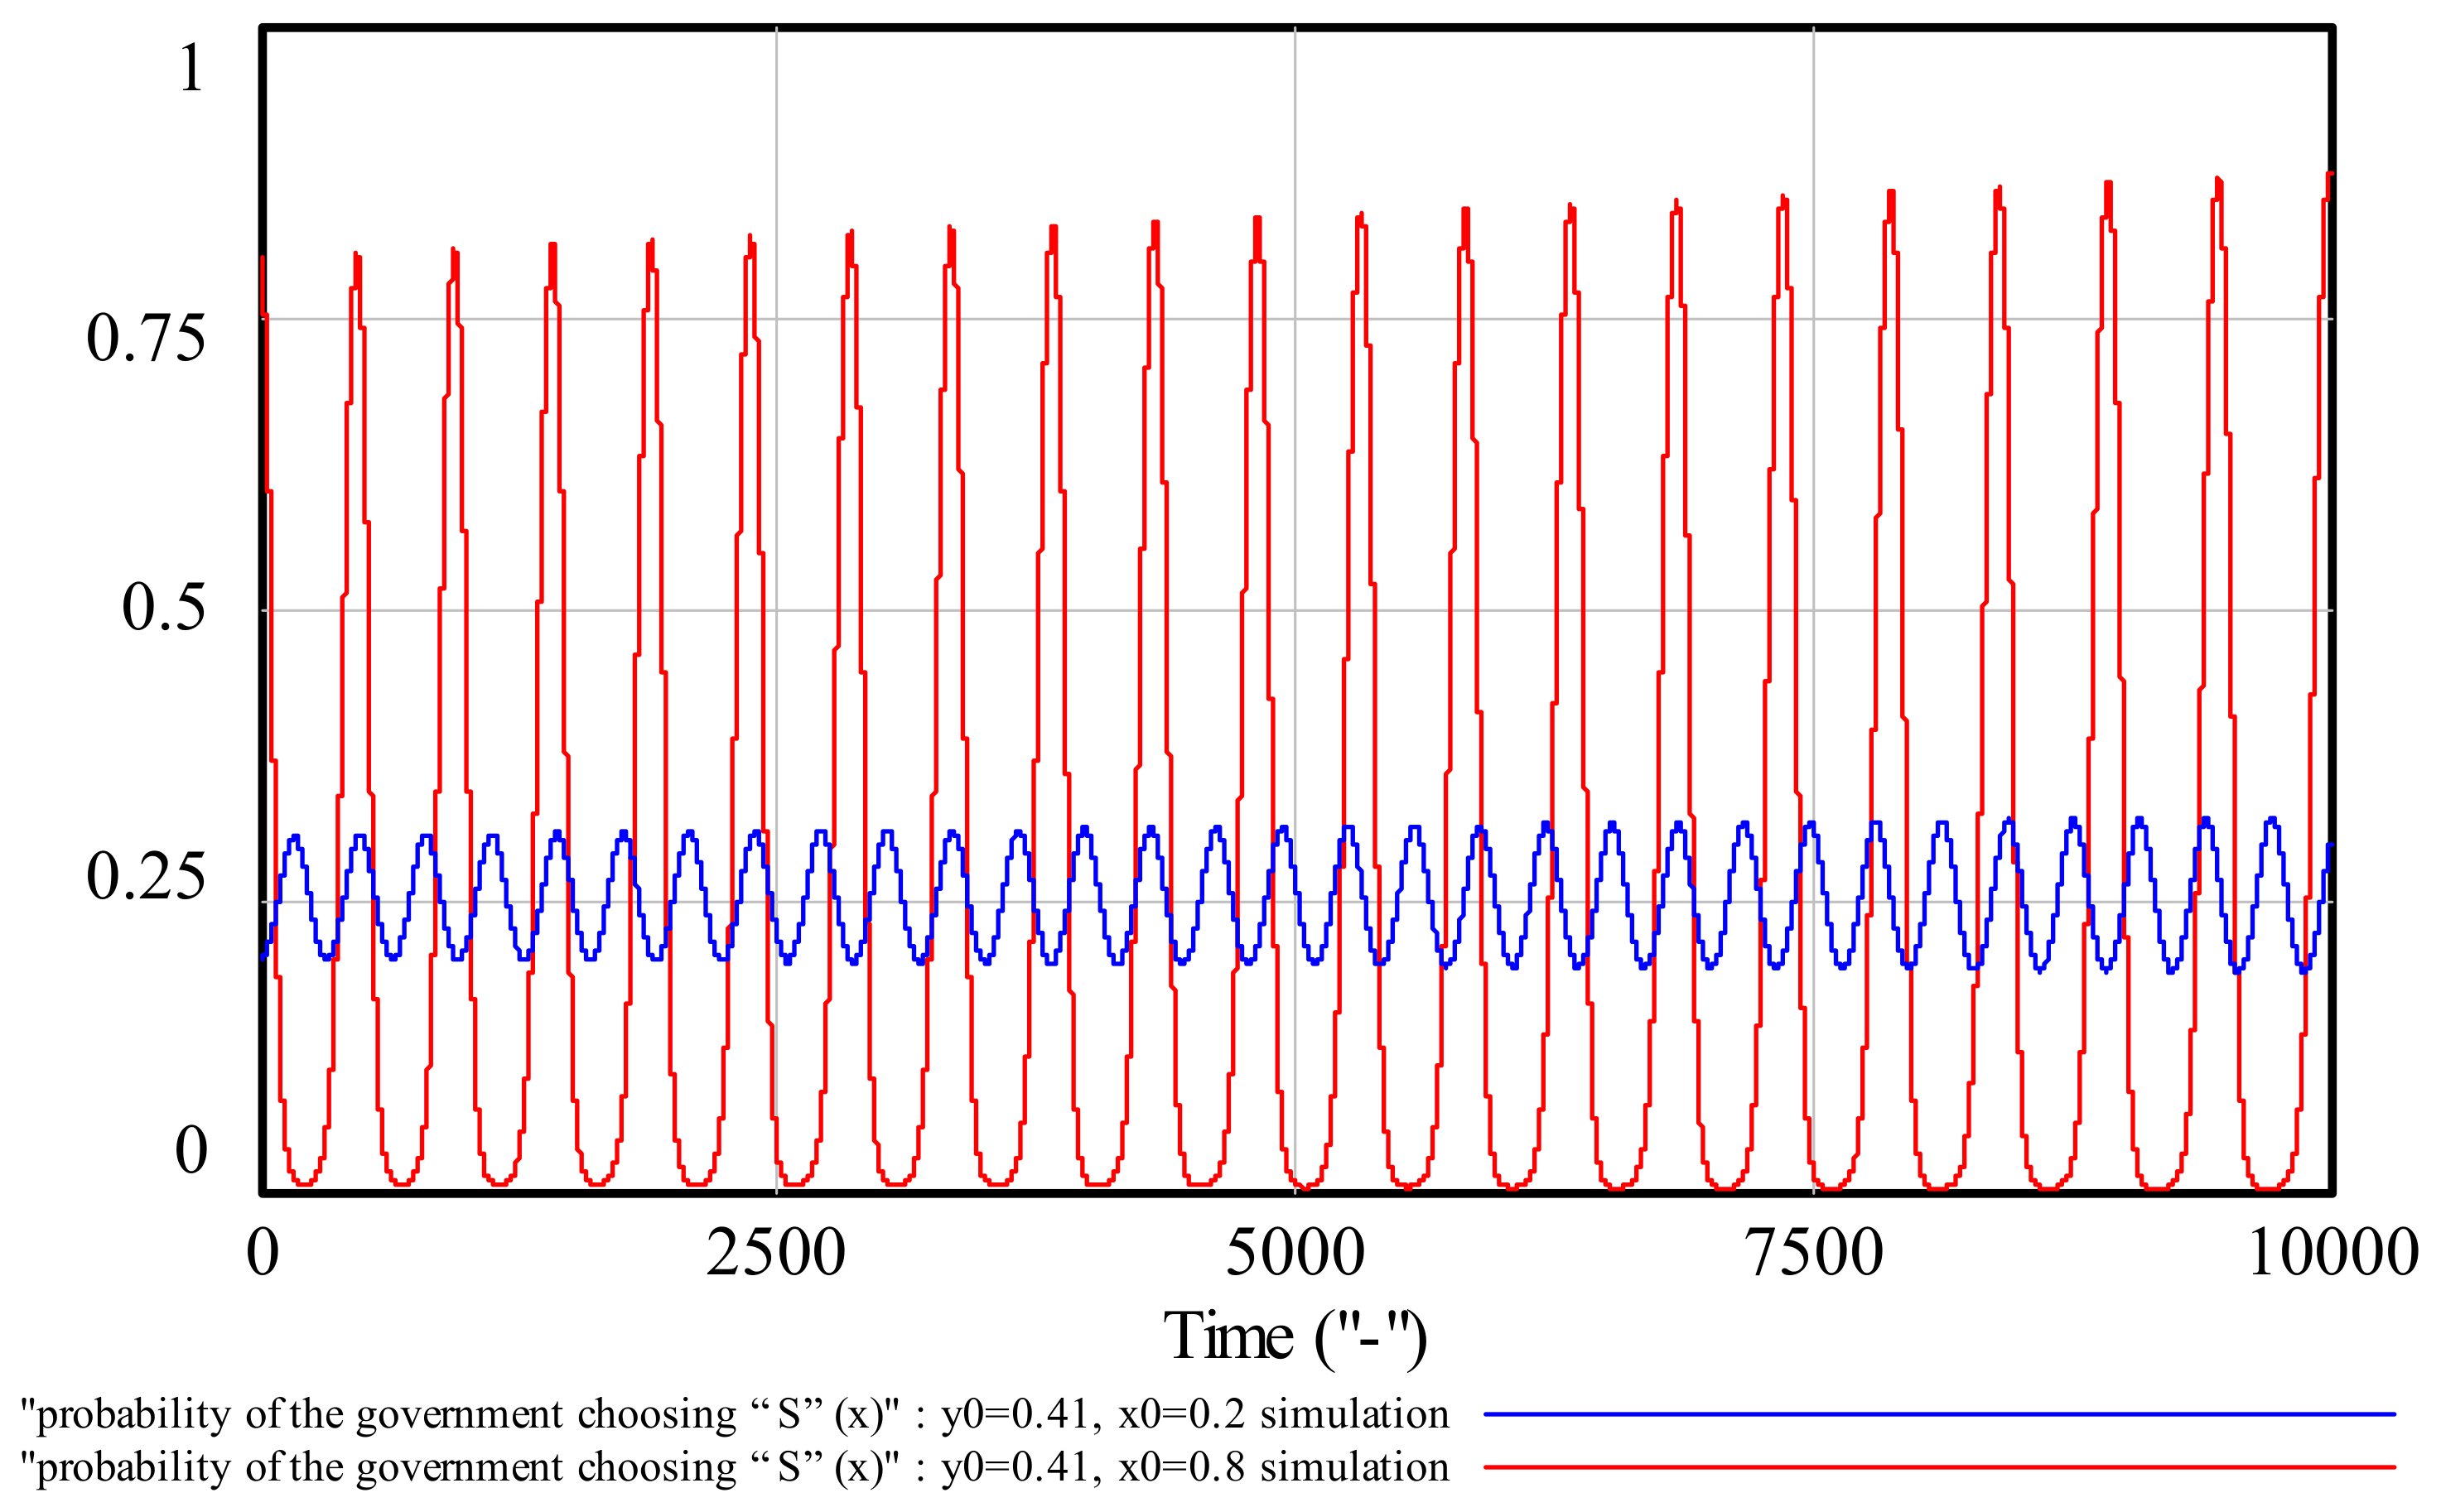
The significance of evolutionary game analysis under bounded rationality is not to predict one-off game outcomes or short-term game equilibrium, but to analyze and compare the long-term stability trend of certain game relationships in a stable environment, which is consistent with the simulation characteristics of SD [13]. SD is a method of system modeling and dynamic simulation that is mainly used to study the dynamic complexity of socio-economic and biophysical systems with long-term periodicity and low accuracy requirements [14]. The research method of combining the evolutionary game and SD has been applied to project management. For example, Peng et al. [15] established an evolutionary game model for stakeholders in the governance of service-oriented manufacturing projects, and used SD to simulate the dynamic game process of stakeholder strategy selection. Shen et al. [16] combined an evolutionary game and SD simulation to study the cooperation mechanism of a government outsourcing public services. It can be seen that SD provides an effective aid for studying the complex dynamic process of evolutionary games in incomplete information conditions [17].

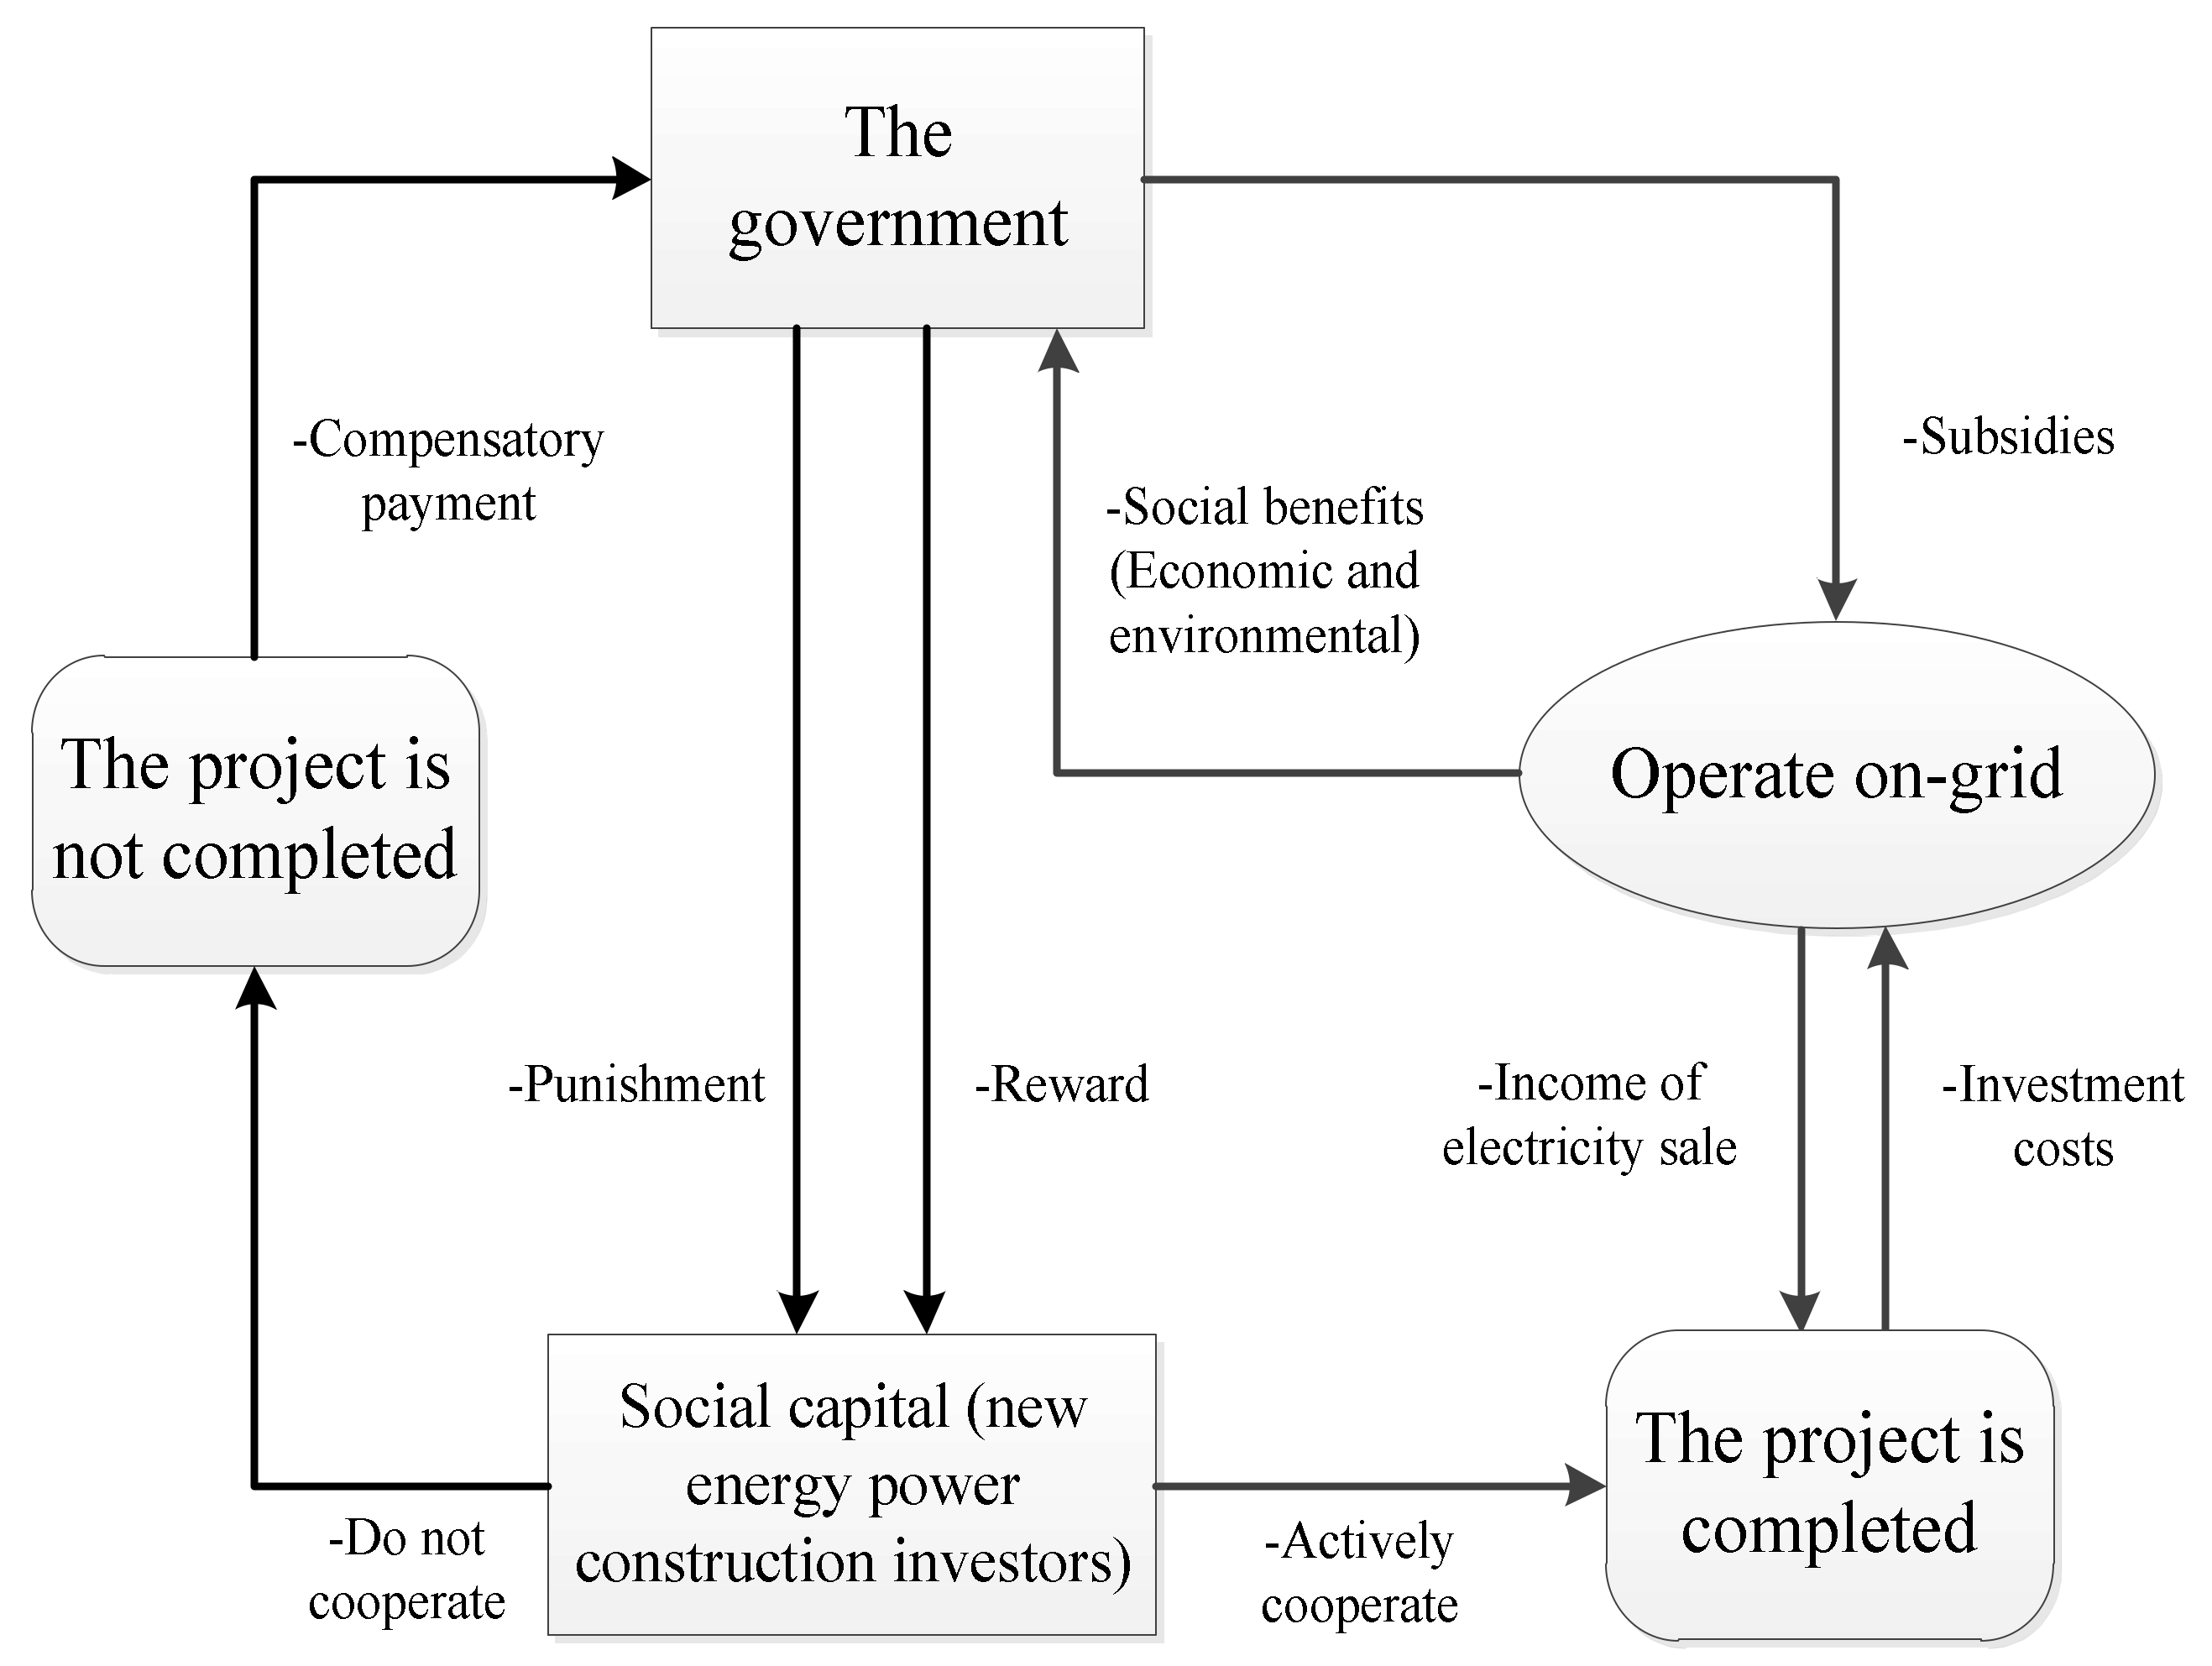
2.1. The Mechanism of a Public-Private-Partnership (PPP) from the Game Perspective

Although the government is constantly encouraging social capital to participate in the construction of a PPP project, some reasons have discouraged social capital such as low returns on capital, long return period, and high trading costs for the finished project. In the process of cooperation with the government, social capital also fears that the government will shift too much risk. Therefore, it is necessary to find a reasonable distribution between the government and social capital in interests and risks, and maximize the interests of both parties in order to attract social capital into infrastructure construction projects.
We assume that the government’s annual budget for power construction PPP projects is b . The government’s goal is to maximize project benefits, which is denoted by U , under the established budget constraints. The government has to carry out N projects every year. For the specific project i , the government needs to invest b e in order to meet the needs of society. Since the government is unable to make sufficient investment in each project, the capital invested in a single project i is b i when the total utility reaches the maximum.
When the government does not introduce social capital, the government invests in project i as b i , and the utility for society is U i ( b i ) . At this time, the utility of the capital invested in the remaining projects is U i ( b b i ) . The total utility of the PPP project can be obtained as U i ( b i ) + U i ( b b i ) . When the government introduces social capital, the government and social capital can provide sufficient funds b for the specific project i . At this time, the capital invested by the government in the project is b e , and the capital invested by the social capital is b b m . The benefit of the project i is U i ( b e ) , and the total benefit of the PPP project is U i ( b e ) + U i ( b b m ) .
For investors in social capital, their aim is to maximize profits. Assume that the investment return function is Y ( k ) , and the total investment amount of social capital is K . Social capital needs to spend the costs of application, research, and negotiation in the process of cooperation with the government, which are the sunk costs c . If social capital does not reach an agreement after consultation with the government, the return on social capital is Y i ( k ) c . If the consultation is successful, the social capital investment is b e b m . Social capital will enjoy the tax incentives t x given by the government while participating in the construction of PPP projects. There is a certain risk that social capital will participate in long-term infrastructure construction. We set the risk factor to ϕ . At this time, the income function of social capital is ( 1 ϕ ) Y i ( b e b m ) + Y i [ k ( b e b m ) c ] c + t x 
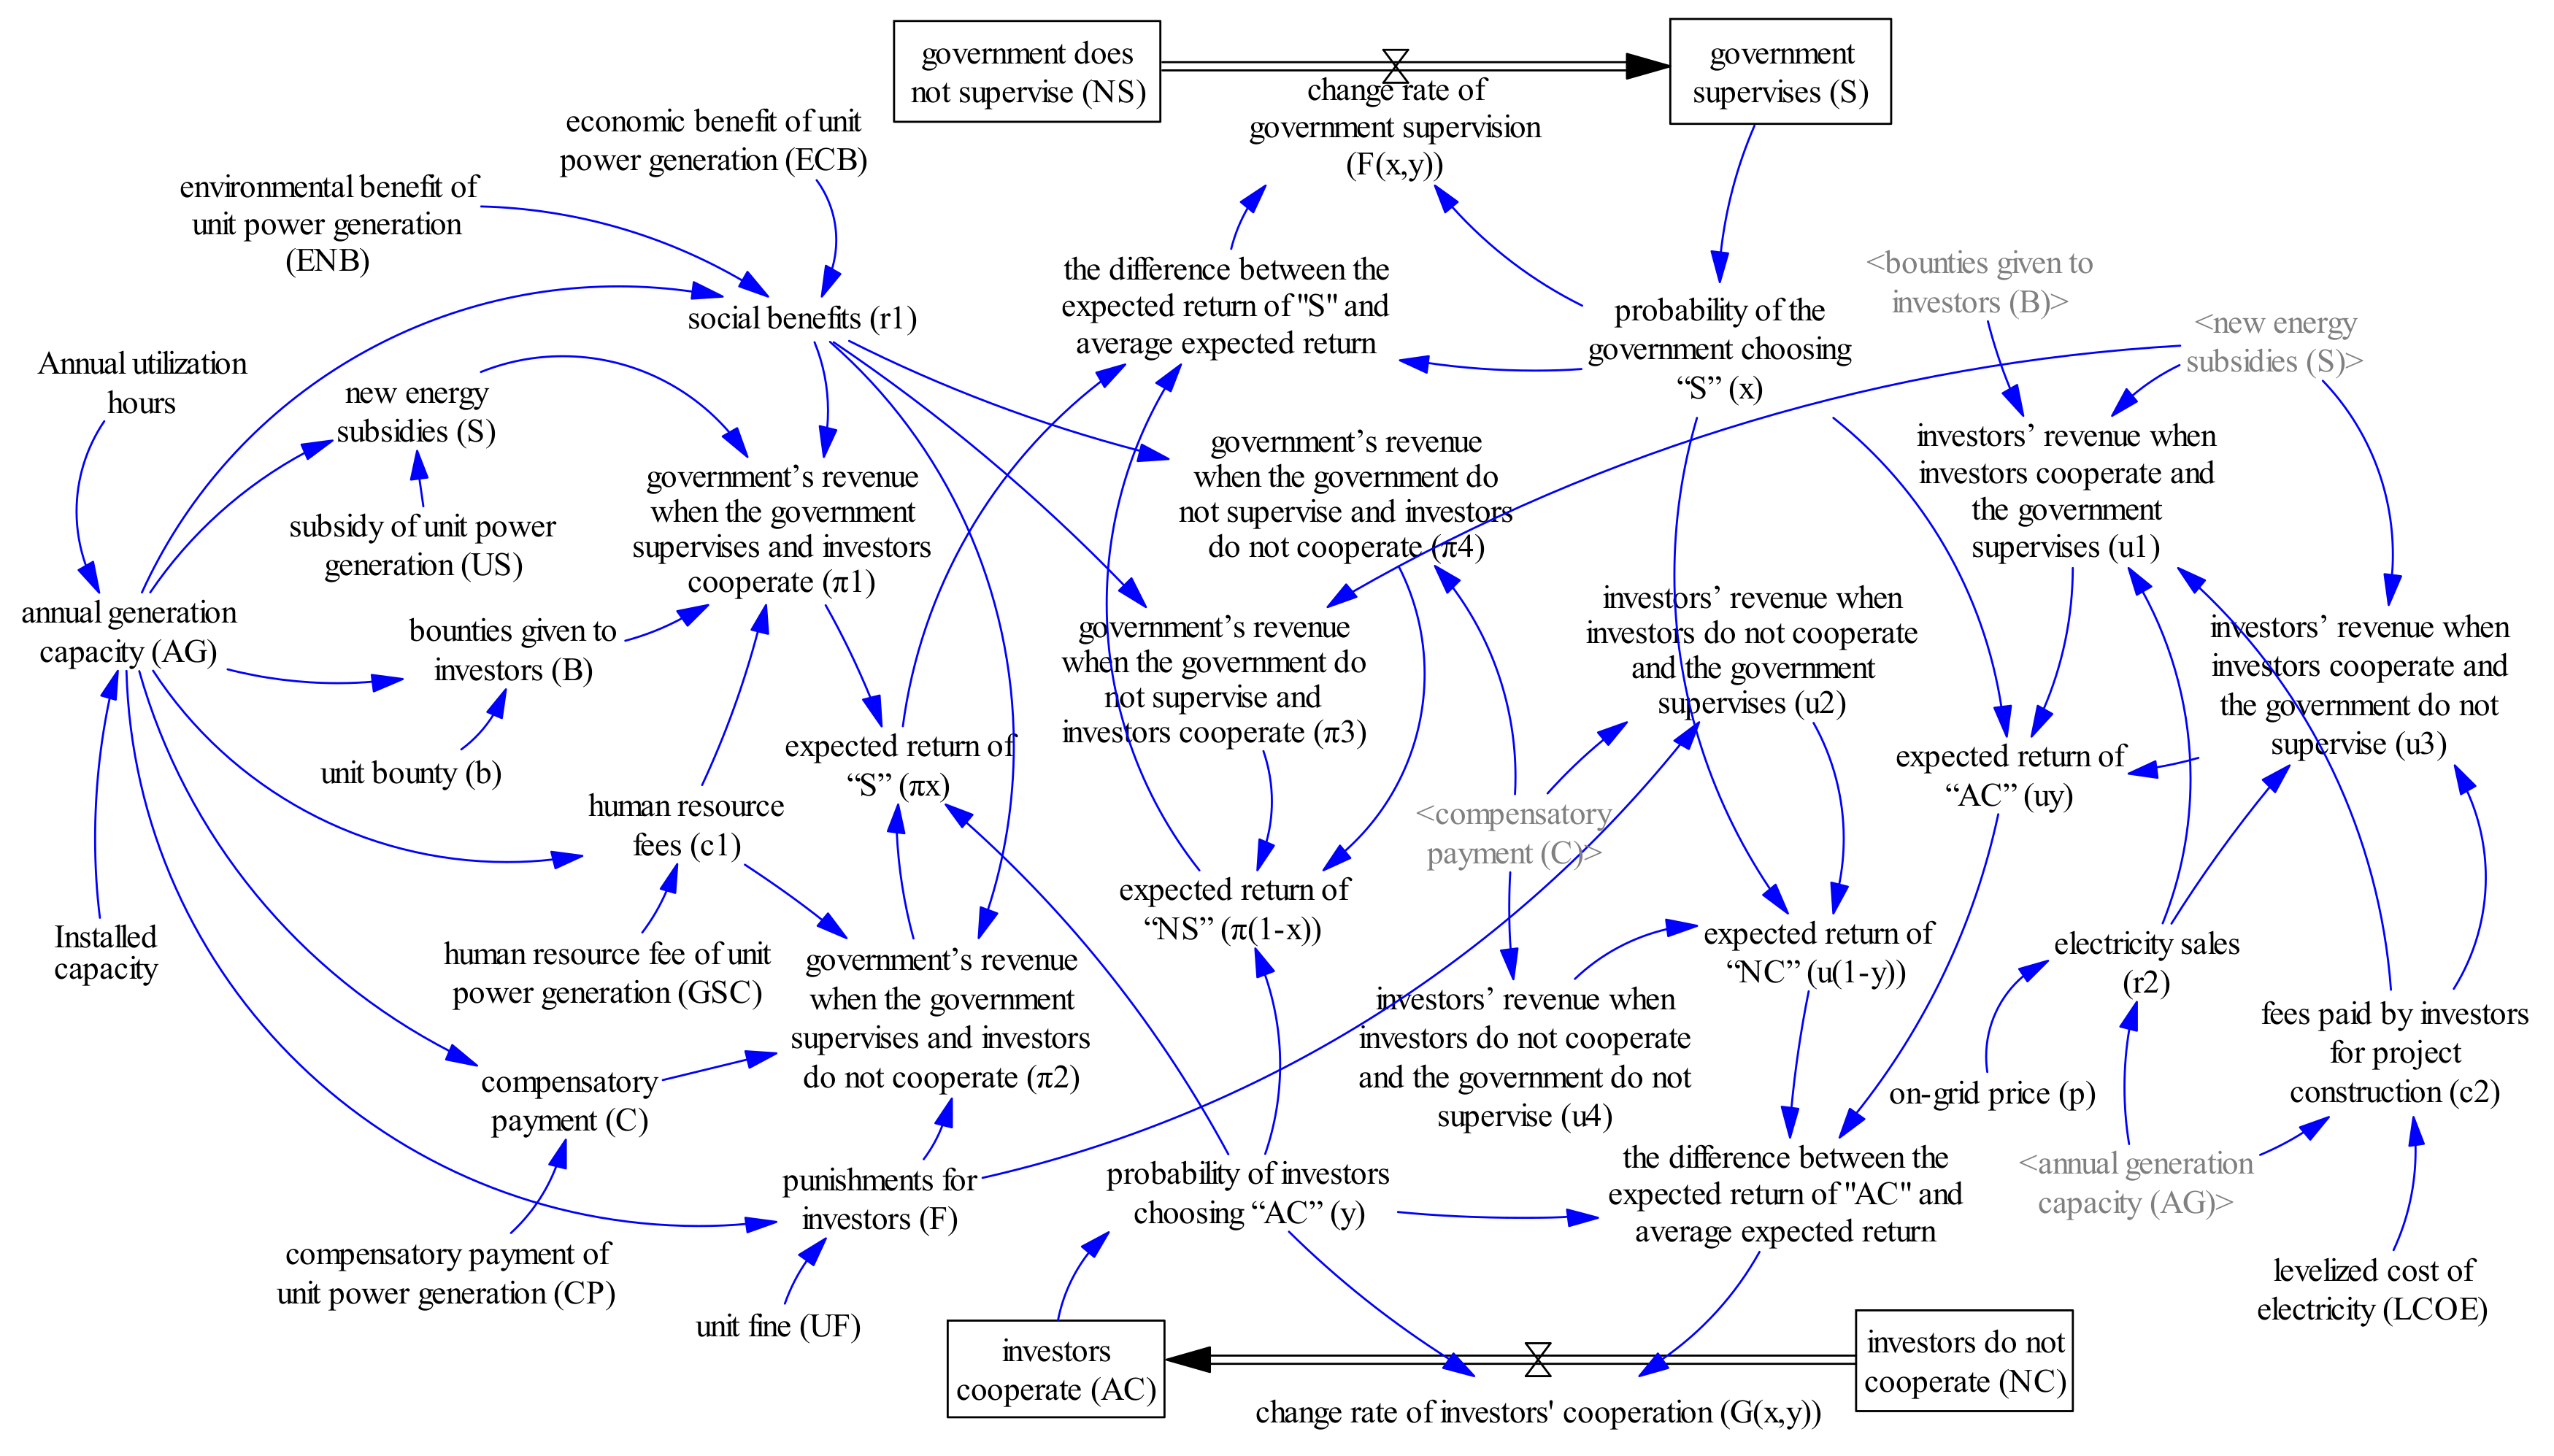
. Thus, we can get the game matrix of government and social capital, as shown in Table 1.
According to Table 1, if U i ( b i ) + U i ( b b i ) > U i ( b e ) + U i ( b b m ) , the social benefit of the sole proprietorship investment is greater than that of the PPP mode. If this is the case, the government will adopt the sole proprietorship model instead of the PPP model, at this time, b m must be greater than b i , that is, after the use of the PPP mode, the government invested more money, and after the social capital investment, the increase in the benefit of project i cannot make up for the reduction of funds in other projects due to the government investment. The reason for this is that the proportion of the share of the project investment is unreasonable, and the project design plan is beyond the expectation, and the possibility of its occurrence is relatively low.
If U i ( b e ) + U i ( b b m ) > U i ( b i ) + U i ( b b i ) , PPP mode brings great social utility to the government, and U i ( b e ) > U i ( b i ) . Because of the participation of the social capital, the investment of the project i is greater, the utility is greater, the government’s finance is relieved, and more funds can be invested in other projects; thus, it is reasonable for the government to take the PPP model in this case. At this point, we analyze the income of social capital under such circumstances. When ( 1 ϕ ) Y i ( b e b m ) + Y i [ k ( b e b m ) c ] c + t x < Y i ( k ) , the corresponding payment solution is ( Y i ( k ) , U i ( b e ) + U i ( b b m ) ) , this is an invalid solution; when ( 1 ϕ ) Y i ( b e b m ) + Y i [ k ( b e b m ) c ] c + t x > Y i ( k ) , Nash equilibrium is { Social capital participation ,   PPP mode } , and the solution at this time is ( ( 1 ϕ ) Y i ( b e b m ) + Y i [ k ( b e b m ) c ] c + t x , U i ( b e ) + U i ( b b m ) ) .
The benefits of social capital participation in the PPP project are related to the risk of the project, the cost of the agreement, the rate of return on the project, and the tax relief provided by the government. From the analysis of game theory above, the Nash equilibrium exists. Therefore, the cooperation between social capital and government can achieve the growth of mutual benefits.

2.2. Theoretical Framing Analysis

Before establishing the evolutionary game model, it is necessary to explain the relationship between the main stakeholders, the government and social capital (new energy power construction investors), in the new energy power construction PPP project and the process of project operation, as shown in Figure 1. Investors are responsible for investing in and building new energy power projects. The government will reward or punish investors according to project construction in the supervision process. If investors actively cooperate with the government and ensure that the project can be completed successfully, the power project begins to operate. The income of investors includes two parts, one part is the sale of electricity generated to the power grid company, and the other part is the new energy subsidies granted by the government. The benefits to the government of the project are social benefits, which include the economic benefits generated by power plants for industrial and commercial production or for the needs of residents, and the environmental benefits of energy saving and reduced carbon emissions generated by new energy generation under the same generation capacity. If investors do not cooperate actively and the project finally cannot be completed, they need to pay compensation to the government, resulting in no social benefits for the government.

2.3. Evolutionary Game Model

2.3.1. Game Payment Function

(1)
Participants in the game: the two participants in the evolution game of a new energy power construction PPP are the government and investors, and both of them have bounded rationality.
(2)
Participants’ behavior strategies: investors have two strategies, which are to actively cooperate and not to cooperate. An “active cooperation” (AC) strategy means that investors can cooperate with the government with a positive attitude to ensure the safety and smooth completion of projects, such as actively discussing construction plans, risk management, and regular maintenance of equipment. “Do not cooperate” (NC) refers to the inability of the project to go on-grid due to improper construction or management, resulting in social and economic losses. At the same time, the government has the duty to supervise and inspect investors, and it has two strategies that are, it supervises (S) and does not supervise (NS) whether investors actively cooperate. It can be seen as a result of the game between the government and investors whether investors actively cooperate with the government or not.
(3)
Probabilities of behavioral strategy: in the initial stage of the game between the government and investors, we suppose that the probability of the government choosing “S” is x ( 0 x 1 ) , and then the probability of choosing “NS” is 1 x . The probability of investors choosing “AC” is y ( 0 y 1 ) , and then the probability of choosing “NC” is 1 y . The game strategy combination is shown in Table 2.
(4)
Game payment functions: the revenue of the game matrix between the government and investors is shown in Table 3. The payment function of each strategy on game players are as follows.
π 1 = r 1 c 1 S B = A G × ( E C B + E N B ) A G × G S C A G × U S A G × b
π 2 = F + C c 1 r 1 = A G × U F + A G × C P A G × G S C A G × ( E C B + E N B )
π 3 = r 1 S = A G × ( E C B + E N B ) A G × U S
π 4 = C r 1 = A G × C P A G × ( E C B + E N B )
π 1 is government’s revenue when the government supervises and investors cooperate. The income is the social benefits ( r 1 ), and the costs are the human resource fees ( c 1 ), new energy subsidies granted by the government after the project operates on-grid ( S ), and the bounties given to investors ( B ) during the government supervision process. Where A G is the annual generation capacity of the project, and A G = Installed Capacity × Annual utilization hours . E C B is the economic benefit of unit power generation. E N B is the environmental benefit of unit power generation. G S C is the human resource fee of unit power generation. U S is the subsidy of unit power generation. b is the unit bounty. π 2 is government’s revenue when the government supervises and investors do not cooperate. The incomes are the punishments for investors in the process of government supervision ( F ) and compensation paid by investors due to uncompleted projects ( C ). The costs are c 1 and the loss of social benefits ( r 1 ) due to the inability of new energy power going on-grid. Where, U F is the unit fine, C P is the compensatory payment of unit power generation, π 3 is government’s revenue when the government do not supervise and investors cooperate, the income is r 1 , and the cost is S . π 4 is government’s revenue when the government do not supervise and investors do not cooperate. The income is C , and the cost is r 1 .
u 1 = r 2 + S + B c 2 = A G × p + A G × U S + A G × b A G × L C O E
u 2 = F C = A G × U F A G × C P
u 3 = r 2 + S c 2 = A G × p + A G × U S A G × L C O E
u 4 = C = A G × C P
u 1 is investors’ revenue when investors cooperate and the government supervises. The incomes are electricity sales after completion and operation of power construction ( r 2 ), subsidies ( S ), and bounties ( B ). The cost is the fees paid by investors for project construction’s investment, operation and maintenance, and labor costs ( c 2 ). Where, p is the on-grid price of the project. L C O E is the levelized cost of electricity of the project. u 2 is investors’ revenue when investors do not cooperate and the government supervises. There is no income, and the costs are the punishments F and compensatory payment C . u 3 is investors’ revenue when investors cooperate and the government do not supervise. The incomes are r 2 and S , and the cost is c 2 . u 4 is investors’ revenue when investors do not cooperate and the government do not supervise. There is no income, and the cost is C .

2.3.2. Evolutionarily Stable Strategy (ESS)

According to Table 1 and Table 2, the expected return of “S” ( π x ), the expected return of “NS” ( π 1 x ), and average expected return ( π ¯ ) are as follow [18]:
π x = y × π 1 + ( 1 y ) × π 2 = y × ( 2 r 1 S F B C ) + F + C c 1 r 1
π 1 x = y × π 3 + ( 1 y ) × π 4 = y × ( 2 r 1 S C ) + C r 1
π ¯ = x × π x + ( 1 x ) × π 1 x = x × y × ( B + F ) + x × ( F c 1 ) + y × ( 2 r 1 S C ) + C r 1
Thus, the replicated dynamic equation of the government’s evolutionary strategy is:
F ( x , y ) = d x d t = x × ( π x π ¯ ) = x × ( 1 x ) × ( F c 1 y × B y × F ) = x × ( 1 x ) × A G × [ U F G S C y × ( b + U F ) ]
Similarly, the expected return of “AC” ( u y ), the expected return of “NC” ( u 1 y ), and average expected return ( u ¯ ) are as follows:
u y = x × u 1 + ( 1 x ) × u 3 = x × B + r 2 + S c 2
u 1 y = x × u 2 + ( 1 x ) × u 4 = x × F C
u ¯ = y × u y + ( 1 y ) × u 1 y = x × y × ( B + F ) + y × ( r 2 + S + C c 2 ) x × F C
Thus, the replicated dynamic equation of investors’ evolutionary strategy is:
G ( x , y ) = d y d t = y × ( u y u ¯ ) = y × ( 1 y ) × ( x × B + x × F + r 2 + S + C c 2 ) = y × ( 1 y ) × A G × [ x × ( U F + b ) + p + U S + C P L C O E ]
The two-dimensional dynamic autonomy system consists of formulas (12) and (16) can be expressed as:
{ F ( x , y ) = d x d t = x × ( 1 x ) × A G × [ U F G S C y × ( b + U F ) ] G ( x , y ) = d y d t = y × ( 1 y ) × A G × [ x × ( U F + b ) + p + C P + U S L C O E ]
According to the stability theorem of evolutionary dynamic equations based on the hybrid strategy and the nature of evolutionary stability strategy [19], if and only if 0 L C O E U S C P p U F + b 1 and 0 U F G S C U F + b 1 , the equilibrium points of the system above are ( 0 , 0 ) , ( 0 , 1 ) , ( 1 , 0 ) , ( 1 , 1 ) , and ( x , y ) , where, x = L C O E U S C P p U F + b and y = U F G S C U F + b .
According to the method proposed by Friedman [20], the stability of local equilibrium of dynamic differential equations can be analyzed by the system’s Jacobian of the system can be used to analyze. Thus, the stability of five equilibrium points described above can be analysis according to the Jacobian of Formula (17), which is:
J = [ F ( x , y ) x F ( x , y ) y G ( x , y ) x G ( x , y ) y ] = [ ( 1 2 x ) × ( F c 1 y × B y × F ) x × ( x 1 ) × ( B + F ) y × ( 1 y ) × ( B + F ) ( 1 2 y ) × ( x × B + x × F + r 2 + S + C c 2 ) ] = [ ( 1 2 x ) × A G × [ U F G S C y × ( b + U F ) ] x × ( x 1 ) × A G × ( b + U F ) y × ( 1 y ) × A G × ( b + U F ) ( 1 2 y ) × A G × [ x × ( U F + b ) + p + U S + C P L C O E ] ]
Both determinant ( det ( J ) ) and trace ( t r ( J ) ) determine the local stability of linear differential equations. When the equilibrium point satisfies det ( J ) = F ( x , y ) x × G ( x , y ) y F ( x , y ) y × G ( x , y ) x > 0 and t r ( J ) = F ( x , y ) x + G ( x , y ) y < 0 , this equilibrium point is the evolutionarily stable strategy (ESS). If det ( J ) < 0 , then this equilibrium point is a saddle point. According to the Jacobian matrix, the stability analysis results of these five equilibrium points are shown in Table 4.
It can be seen that the game model has and four saddle points as ( 0 , 0 ) , ( 0 , 1 ) , ( 1 , 0 ) , and ( 1 , 1 ) , and a central point as ( x , y ) = ( L C O E U S C P p U F + b , U F G S C U F + b ) . Therefore, the system does not have evolutionary stability and equilibrium, and any slight change may have a huge impact on the system’s behavior [13].

2.4. System Dynamics (SD) Simulation Model

Based on the theoretical framework of the relationship between the government and new energy power construction investors, and evolutionary game model above, we believe that there is a complex non-linear relationship between the game players. To clearly represent the dynamic evolution process of the game players’ behavioral strategies, we use the Vensim software of SD to establish a stock and flow diagram of the dynamic game between the government and investors based on the models above, as shown in Figure 2.
In this flow graph, there are about 30 functions used to represent the relationship between various factors. Since most of the functional relationships have been described in the evolutionary game model, only two expressions are explained here:
x = x 0 + F ( x , y ) d t
y = y 0 + G ( x , y ) d t
Formula (18) is the probability of government supervision, and x 0 is the initial probability of supervision. Similarly, Formula (19) is the probability of investors’ cooperation, and y 0 is the initial probability of cooperation.

3. Case Study

3.1. Data

This study takes China’s typical new energy power construction PPP project, waste incineration power generation, as an example, and put the relevant data into the SD model for simulation. As China produces more and more domestic waste every year, China’s waste incineration power generation industry is developing rapidly, which has been highly valued and supported by the government [21]. At present, China’s waste incineration power generation PPP project is mainly the build-operate-transfer (BOT) mode; that is, investors are responsible for the construction and operation of the project, and the contract is handed over to the government after the expiration of the contract. All the data are collated according to [22,23,24,25,26,27], and the main sources are relevant references, China Energy Statistical Yearbook, China Environmental Statistics Yearbook, and the government’s public documents. The values of the variables are shown as Table 5. In addition, we assume that the unit bounty b is 0.08 Yuan/kWh, and the unit fine U F is 0.24 Yuan/kWh.
Here, we explain the acquisition of the data. According to the data of the Statistical Yearbook [22,23], the annual utilization hours of waste incineration power generation vary little with time, thus, we calculate the average annual use hours for nearly 5 years. The values of installed capacity and electricity price can be obtained directly from Ref. [24]. The formula of L C O E is the total investment of the project divided by the total power generation, which can be obtained directly from [25,26]. C P , U S and G S C can be obtained through the Beihai municipal government procurement document [27]. E C B and E N B can obtain the economic value of the annual economic benefits of waste generation and the equivalent conversion of reduced carbon emissions from [24,25], according to which the values of these two variables can be calculated. In order to achieve the greatest benefit, the government should reduce the unit reward and raise the unit penalty as far as possible. To ensure the rationality of probability, we test the result repeatedly and assume that the values of the bounty and fine are 0.08 and 0.24, respectively.
Compared with the mature wind power technology, China’s waste incineration power generation is still in the initial stage of development, and its technology is not mature. The subsidy to the government is dependent, and the total investment, costs, and unit efficiency are relatively fixed, which have changed little in a certain period of time. Therefore, the simulation results are sufficiently robust against these values.

3.2. Results Analysis

According to the calculation, we obtain L C O E U S C P p U F + b = 0.25 and U F G S C U F + b = 0.41 , which meet the prerequisites of evolutionary equilibrium. Since the SD system in our study represents the probability of a behavioral strategy rather than predicting the actual value of each indicator, thus the “Time” in the simulation refers to the general time unit rather than the specific year, month, or day. We will study three scenarios to examine whether the game players will take the initiative to stabilize a saddle point. We compare the results of our study with that of [17,28,29], and find that the fluctuation trend of game players’ probability and the evolution process of mixed strategy are roughly the same as those in the relevant references. This shows that the simulation results of our study are consistent with those of relevant scholars, and proves the correctness and rationality of the model built in this study.
(1) Scenario 1: We assume that the initial probability of x is the equilibrium value of the mixed strategy, and that of y is random.
Let x 0 = L C O E U S C P p U F + b = 0.25 , and the initial probability of investors’ cooperation is y 0 = 0.2 and y 0 = 0.8 , respectively. The simulation results are shown as Figure 3. It shows that when the initial probability of x is set as the equilibrium value, and the initial value of y is given, there is a significant fluctuation in the probability of investors’ cooperation, and the system will not stabilize to the central point ( x , y ) . Furthermore, with the increase of the time and the number of games, the amplitude of fluctuation of y gradually increases, and the game process is difficult to reach a steady state.
(2) Scenario 2: We assume that the initial probability of y is the equilibrium value of the mixed strategy, and that of x is random.
Let y 0 = U F G S C U F + b = 0.41 , and the initial probability of the government supervision is x 0 = 0.2 and x 0 = 0.8 , respectively. The simulation results are shown as Figure 4. It shows that when the initial probability of y is set as the equilibrium value, and the initial value of x is given, there is a significant fluctuation in the probability of the government supervision, and the system will not stabilize to the central point ( x , y ) . Furthermore, with the increase of time and the number of games, the amplitude of fluctuation of x gradually increases, and it is difficult for the game process to reach a steady state.
(3) We assume that the game players use the same initial probability, which ranges from 0 to 1.
Let x 0 = 0.5 and y 0 = 0.5 . The simulation results are shown as Figure 5. It shows that the evolution process of the system is a closed-loop line with periodic motion around the starting point, which indicates that the two game players of the government and power producers show a periodic behavior pattern.

4. Discussion

According to the simulation results, the game system cannot achieve equilibrium under the premise of given parameters. In the process of simulation, the unit bounty and the unit fine are invariable, that is, the government rewards or punishes investors in the same amount regardless of the probability of the investors’ cooperation. Unit bounty and unit fine are two important variables controlled by the government. They can be dynamically changed according to the positive degree of investors’ actual cooperation. In this section, we will discuss the evolutionary game of the system under the condition of dynamic reward and punishment.

4.1. Dynamic Reward

When the probability of investors’ cooperation is high, investors can successfully complete or even exceed the target, and the government will give investors rewards. At this time, the unit bounty is high. On the contrary, if the probability of investors’ cooperation is low, the government rewards less or not, and the unit bounty is low. Thus, we assume that the government supervision is directly proportional to the probability of investors’ cooperation, that is, when the investors cooperate and the government supervises, the unit bounty changes from the constant b to y × b .
First, we study the effect of dynamic rewards on system stability based on the replicated dynamic equation and Jacobian matrix stability analysis. y × b is substituted into Formula (17), and we obtain:
{ F ( x , y ) = d x d t = x × ( 1 x ) × A G × [ ( 1 y 2 ) × U F y × b G S C ] G ( x , y ) = d y d t = y × ( 1 y ) × A G × [ x × y × U F + x × b + p + U S + C P L C O E ]
We obtain five equilibrium points as ( 0 , 0 ) , ( 0 , 1 ) , ( 1 , 0 ) , ( 1 , 1 ) and ( L C O E U S C P p U F + y × b , ( 1 y 2 ) × U F G S C b ) . The Jacobian matrix of the system is:
J = [ F ( x , y ) x F ( x , y ) y G ( x , y ) x G ( x , y ) y ] = [ ( 1 2 x ) × A G × [ ( 1 y 2 ) × U F y × b G S C ] x × ( x 1 ) × A G × [ 2 y × U F + b ] y × ( 1 y ) × A G × [ y × U F + b ] y × ( 2 3 y ) × A G × x × U F + ( 1 2 y ) × A G × ( x × b + p + U S + C P L C O E ) ]
The results of five equilibrium points’ stability are shown in Table 6. It can be seen that there is no ESS in the system.
Secondly, we use SD simulation to verify these results. The simulation results under dynamic rewards are shown in Figure 6a–c. We can see that the system’s up and down oscillation is more intense under the dynamic rewards system, and the fluctuation range is larger than the static reward, and it is more difficult for the game process to achieve stability. The evolutionary process of the mixed game is still a closed orbital loop around the starting point.

4.2. Dynamic Punishment

The government adopts the punishment mechanism to promote investors’ active cooperation in the opposite direction, thereby completing the project requirements. When the probability of investors’ cooperation is low, the government will punish the investors with high penalties. In this case, the unit fine is high. On the contrary, if the probability of investors’ cooperation is high, the punishment of the government is low, that is, the unit fine is low. Therefore, we assume that the punishment is inversely proportional to the probability of investors’ cooperation, that is, when investors do not cooperate and the government supervises, the unit fine changes from the constant U F to ( 1 y ) × U F .
First, ( 1 y ) × U F is substituted into Formula (17), and we obtain:
{ F ( x , y ) = d x d t = x × ( 1 x ) × A G × [ ( 1 + y 2 ) × U F y × ( b + U F ) G S C ] G ( x , y ) = d y d t = y × ( 1 y ) × A G × [ x × ( 1 y ) × U F + x × b + p + U S + C P L C O E ]
We obtain five equilibrium points as ( 0 , 0 ) , ( 0 , 1 ) , ( 1 , 0 ) , ( 1 , 1 ) and ( L C O E U S C P p ( 1 y ) × U F + b , ( 1 + y 2 ) × U F G S C U F + b ) . The system’s Jacobian matrix is:
J = [ F ( x , y ) x F ( x , y ) y G ( x , y ) x G ( x , y ) y ] = [ ( 1 2 x ) × A G × [ ( 1 + y 2 ) × U F y × ( b + U F ) G S C ] x × ( x 1 ) × A G × [ ( 1 2 y ) × U F + b ] y × ( 1 y ) × A G × [ ( 1 y ) × U F + b ] ( 1 + 3 y 2 4 y ) × A G × x × U F + ( 1 2 y ) × A G × [ x × b + p + U S + C P L C O E ] ]
The results of the points’ stability are shown in Table 7. It can be seen that there is an ESS in the system, which is ( L C O E U S C P p ( 1 y ) × U F + b , ( 1 + y 2 ) × U F G S C U F + b ) .
Secondly, we use SD simulation to verify the above results. The simulation results under dynamic punishment are shown in Figure 7a–c. We can see that the probabilities of investors’ cooperation y and the government supervision x fluctuate with the increase of time and the number of games when the punishment is static and U F = 0.24 . The game process is difficult to stabilize. However, when the punishment is dynamic and U F = 0.24 , x and y gradually converge and eventually tend to be stable, and ESS is ( 0.31 , 0.26 ) .
In addition, we study the effect of the change of U F on probability. If the unit fine increases, x and y gradually tend to be stable under the dynamic punishment and U F = 0.34 , and x decreases, and y increases. This shows that the improvement of the unit fine can not only promote the active cooperation of investors, but also reduce the supervision probability of the government.

5. Conclusions

The PPP project for new energy power construction has received strong support from the Chinese government in recent years, and as a result, it has developed rapidly because it can relieve government financial pressure and promote the development of new energy. In the process of PPP project implementation, it is of great significance to study the evolutionary game process of the government and investors’ behavioral strategies. This study first constructs the game evolution game model, then uses SD to simulate the evolutionary process of game players’ behavior strategies, and finally discusses system stability under the government’s dynamic strategy. This study combines qualitative and quantitative methods to provide theoretical guidance for the healthy development of PPP in new energy power construction. According to the simulation results, we conclude as follows:
(1)
The game system between the government and investors has four saddle points and one center point, and there is no ESS. System evolution is characterized by periodic behavior.
(2)
When the government implements dynamic bounty measures, the system evolution process is still a closed-loop with periodic motion. However, when the government implements dynamic punishment measures, the trajectory spiral of the evolution of game players tends to a stable focus, which indicates that the probability of the government supervision and investors’ cooperation gradually converge with the increase of time. Eventually, the equilibrium of ESS in the hybrid strategy can be reached.
(3)
The government can increase unit fine when making dynamic strategic adjustments, which will not only promote the active cooperation of investors, but also reduce the probability of government supervision, thereby reducing costs.
There are still some improvements to be made to this paper. This study holds that the government’s dynamic punishment is helpful to the stability of the system, but in reality it is difficult for the government to adjust the size of the fine at any time. Therefore, in future research, scholars can study the specific implementation process and the punishment mechanism of the dynamic punishment policy in depth.

Author Contributions

L.G. was mainly responsible for the writing of the full text; Z.-Y.Z. conceived and designed the experiments.

Funding

This research was funded by the Fundamental Research Funds for the Central Universities, grant number 2017XS109.

Acknowledgments

This paper is supported by the Fundamental Research Funds for the Central Universities (No. 2017XS109).

Conflicts of Interest

The authors declare no conflict of interest.

References

  1. Cui, C.; Liu, Y.; Hope, A.; Wang, J. Review of studies on the public-private partnerships (PPP) for infrastructure projects. Int. J. Proj. Manag. 2018, 36, 773–794. [Google Scholar] [CrossRef]
  2. National Energy Administration. Notice on Actively Promoting the Cooperation Model of Government and Social Capital in the Energy Sector. 2016. Available online: http://zfxxgk.nea.gov.cn/auto81/201604/t20160413_2232.htm?keywords (accessed on 31 March 2016).
  3. BJX Net. PPP Project Work Plan of China’s Provinces and Cities in 2018. 2018. Available online: http://huanbao.bjx.com.cn/news/20180314/885398.shtml (accessed on 14 March 2018).
  4. Yang, T.; Long, R.; Li, W. Suggestion on Tax Policy for Promoting the PPP Projects of Charging Infrastructure in China. J. Clean. Prod. 2017, 174, 133–138. [Google Scholar] [CrossRef]
  5. Arbulú, I.; Lozano, J.; Rey-Maquieira, J. The challenges of tourism to waste-to-energy public-private partnerships. Renew. Sustain. Energy Rev. 2017, 72, 916–921. [Google Scholar] [CrossRef]
  6. Akcay, E.C.; Dikmen, I.; Birgonul, M.T.; Arditi, D. Estimating the profitability of hydropower investments with a case study from Turkey. J. Civ. Eng. Manag. 2017, 23, 1002–1012. [Google Scholar] [CrossRef]
  7. Nikitenko, S.M.; Goosen, E.V. Socio-economic development of territories based on the principles of public-private partnership in the sphere of comprehensive mineral exploration. In Proceedings of the International Scientific and Research Conference on Knowledge-Based Technologies in Development and Utilization of Mineral Resources, Novokuznetsk, Russia, 6–9 June 2017. [Google Scholar]
  8. Fantozzi, F.; Bartocci, P.; D’Alessandro, B.; Arampatzis, S.; Manos, B. Public-private partnerships value in bioenergy projects: Economic feasibility analysis based on two case studies. Biomass Bioenergy 2014, 66, 387–397. [Google Scholar] [CrossRef]
  9. Wu, Y.; Xu, C.; Li, L.; Wang, Y.; Chen, K.; Xu, R. A risk assessment framework of PPP waste-to-energy incineration projects in China under 2-dimension linguistic environment. J. Clean. Prod. 2018, 183, 602–617. [Google Scholar] [CrossRef]
  10. Emmanuel Cedrick, B.Z.; Long, W. Investment Motivation in Renewable Energy: A PPP Approach. Soc. Sci. Electron. Publ. 2017, 115, 229–238. [Google Scholar]
  11. Song, J.; Song, D.; Zhang, X.; Sun, Y. Risk identification for PPP waste-to-energy incineration projects in China. Energy Policy 2013, 61, 953–962. [Google Scholar] [CrossRef]
  12. Liu, J.; Wei, Q. Risk evaluation of electric vehicle charging infrastructure public-private partnership projects in China using fuzzy TOPSIS. J. Clean. Prod. 2018, 189, 211–222. [Google Scholar] [CrossRef]
  13. Cai, L.R. System Dynamics Model for a Mixed-strategy Game of Environmental Pollution. Comput. Sci. 2009, 36, 234–238. [Google Scholar]
  14. Kamarzaman, N.A.; Tan, C.W. A comprehensive review of maximum power point tracking algorithms for photovoltaic systems. Renew. Sustain. Energy Rev. 2014, 37, 585–598. [Google Scholar] [CrossRef]
  15. Peng, B.; Gu, X.; Lu, Q. Analysis of Evolutionary Game of Stakeholders in Service-oriented Manufacturing Project Governance. J. Syst. Simul. 2017, 29, 595–608. [Google Scholar]
  16. Shen, L.; Wang, Y. Collaboration of Public Service Contracting: An Evolutionary Game Analysis. Manag. Rev. 2017, 29, 219–230. [Google Scholar]
  17. Zhao, X.; Zhang, Y. The System Dynamics (SD) Analysis of the Government and Power Producers’ Evolutionary Game Strategies Based on Carbon Trading (CT) Mechanism: A Case of China. Sustainability 2018, 10, 1150. [Google Scholar] [CrossRef]
  18. Friedman, D. Evolutionary games in economics. Econometrica 1991, 59, 637–666. [Google Scholar] [CrossRef]
  19. Ginits, H. Game Theory Evolving, 2nd ed.; Princeton University Press: Princeton, NJ, USA, 2009. [Google Scholar]
  20. Friedman, D. On economic applications of evolutionary game theory. J. Evol. Econ. 1998, 8, 15–43. [Google Scholar] [CrossRef] [Green Version]
  21. Zhao, X.G.; Jiang, G.W.; Li, A.; Li, Y. Technology, cost, a performance of waste-to-energy incineration industry in China. Renew. Sustain. Energy Rev. 2016, 55, 115–130. [Google Scholar]
  22. State Statistical Bureau. China Energy Statistical Yearbook 2016; China Statistics Press: Beijing, China, 2017.
  23. State Statistical Bureau. China Environmental Statistics Yearbook 2016; China Statistics Press: Beijing, China, 2017.
  24. Zhao, X.G.; Zhang, Y.Z.; Ren, L.Z.; Zuo, Y.; Wu, Z.G. The policy effects of feed-in tariff and renewable portfolio standard: A case study of China’s waste incineration power industry. Waste Manag. 2017, 68, 711–723. [Google Scholar]
  25. Song, J.; Sun, Y.; Jin, L. PESTEL analysis of the development of the waste-to-energy incineration industry in China. Renew. Sustain. Energy Rev. 2017, 80, 276–289. [Google Scholar] [CrossRef]
  26. Li, Y.; Zhao, X.; Li, Y.; Li, X. Waste incineration industry and development policies in China. Waste Manag. 2015, 46, 234–241. [Google Scholar] [CrossRef] [PubMed]
  27. CCGP Net. Pre-Confirmation of PPP Project for Waste Incineration Power Generation in Beihai City. 2017. Available online: www.ccgp.gov.cn/cggg/dfgg/cjgg/201711/t20171102_9099322.htm (accessed on 11 February 2017).
  28. Fan, R.; Dong, L. The dynamic analysis and simulation of government subsidy strategies in low-carbon diffusion considering the behavior of heterogeneous agents. Energy Policy 2018, 117, 252–262. [Google Scholar] [CrossRef]
  29. Fang, G.; Tian, L.; Fu, M.; Sun, M. Government control or low carbon lifestyle? Analysis and application of a novel selective-constrained energy-saving and emission-reduction dynamic evolution system. Energy Policy 2014, 68, 498–507. [Google Scholar] [CrossRef]
Figure 1. The relationship between the government and new energy power construction investors.
Sustainability 10 02533 g001
Figure 2. The stock and flow diagram of the dynamic game between the government and investors.
Sustainability 10 02533 g002
Figure 3. The evolution of the probability of investors’ cooperation under different initial values.
Sustainability 10 02533 g003
Figure 4. The evolution of the probability of the government supervision under different initial values.
Sustainability 10 02533 g004
Figure 5. The game evolution process of the mixed strategy.
Sustainability 10 02533 g005
Figure 6. The system’s game process under dynamic reward. (a) The probability of the government supervision under different rewards; (b) the probability of investors’ cooperation under different rewards; (c) the mixed game under dynamic rewards.
Sustainability 10 02533 g006aSustainability 10 02533 g006b
Figure 7. The system’s game process under dynamic punishment. (a) The probability of the government supervision under different punishments; (b) the probability of investors’ cooperation under different punishments; (c) the mixed game under dynamic punishments.
Sustainability 10 02533 g007
Table 1. The game matrix of government and social capital.
Government’s Sole ProprietorshipPublic-Private-Partnership (PPP) Mode
Social capital participation Y i ( k ) c , U i ( b i ) + U i ( b b i ) ( 1 ϕ ) Y i ( b e b m ) + Y i [ k ( b e b m ) c ] c + t x , U i ( b e ) + U i ( b b m )
Social capital does not participate Y i ( k ) , U i ( b i ) + U i ( b b i ) Y i ( k ) , U i ( b e ) + U i ( b b m )
Table 2. The game strategy combination of the government and investors.
Game PlayersInvestors
AC ( y ) NC ( 1 y )
The governmentS ( x ) ( x , y ) ( x , 1 y )
NS ( 1 x ) ( 1 x , y ) ( 1 x , 1 y )
Table 3. The revenue of the game matrix between the government and investors.
Game PlayersInvestors
AC ( y ) NC ( 1 y )
The governmentS ( x ) ( π 1 , u 1 ) ( π 2 , u 2 )
NS ( 1 x ) ( π 3 , u 3 ) ( π 4 , u 4 )
Table 4. The stability analysis of equilibrium points.
Local Equilibrium Point det ( J ) t r ( J ) Stability
( 0 , 0 ) -±Saddle Point
( 0 , 1 ) -±Saddle Point
( 1 , 0 ) -±Saddle Point
( 1 , 1 ) -±Saddle Point
( x , y ) -0Center Point
Table 5. Values of variables.
VariablesValueUnit
The economic benefit of unit power generation ( E C B )0.66Yuan/kWh
The environmental benefit of unit power generation ( E N B )0.68Yuan/kWh
The human resource fee of unit power generation ( G S C )0.11Yuan/kWh
The subsidy of unit power generation ( U S )0.04Yuan/kWh
The compensatory payment of unit power generation ( C P )0.14Yuan/kWh
The levelized cost of electricity of the project ( L C O E )0.91Yuan/kWh
The on-grid price of the project ( p )0.65Yuan/kWh
Installed capacity5.4 × 106kW
Annual utilization hours6000Hour
Table 6. The stability analysis of equilibrium points under dynamic reward.
Local Equilibrium Point det ( J ) t r ( J ) Stability
( 0 , 0 ) -±Saddle Point
( 0 , 1 ) -±Saddle Point
( 1 , 0 ) -±Saddle Point
( 1 , 1 ) -±Saddle Point
( L C O E U S C P p U F + y × b , ( 1 y 2 ) × U F G S C b ) -0Center Point
Table 7. The stability analysis of equilibrium points under dynamic punishment.
Local Equilibrium Point det ( J ) t r ( J ) Stability
( 0 , 0 ) -±Saddle Point
( 0 , 1 ) -±Saddle Point
( 1 , 0 ) -±Saddle Point
( 1 , 1 ) -±Saddle Point
( L C O E U S C P p ( 1 y ) × U F + b , ( 1 + y 2 ) × U F G S C U F + b ) +-ESS

