Article

Toward a New Cycle: Short-Term Population Dynamics, Gentrification, and Re-Urbanization of Milan (Italy)

by
Margherita Carlucci
1,*,
Francesco Maria Chelli
2 and
Luca Salvati
3
1
Department of Social and Economic Sciences, Sapienza University of Rome, Building CU002, Piazzale Aldo Moro 5, I-00185 Rome, Italy
2
Department of Economics and Social Sciences, Polytechnic University of Marche, Piazzale Martelli 8, I-60121 Ancona, Italy
3
Council for Agricultural Research and Economics (CREA), Viale S. Margherita 80, I-52100 Arezzo, Italy
*
Author to whom correspondence should be addressed.
Sustainability 2018, 10(9), 3014; https://doi.org/10.3390/su10093014
Submission received: 4 August 2018 / Revised: 20 August 2018 / Accepted: 22 August 2018 / Published: 24 August 2018

Abstract

:
After sequential cycles of urbanization and suburbanization, European cities underwent a (more or less intense) re-urbanization wave. The present study analyzes short-term population dynamics in the core of a large metropolitan region (Milan, northern Italy), providing evidence of spatially-heterogeneous re-urbanization characterized by spatially-complex population growth (or shrinkage) at a local scale. Population dynamics over 1999–2017 were assessed in 88 urban districts partitioning Milan′s municipal area and projected up to 2036 for the same spatial units. Empirical results identify spatially-complex and temporally non-linear dynamics with expanding or declining districts distributed heterogeneously across the study area. Multivariate analysis outlines a generalized population decline during 1999–2008 and an opposite pattern afterward (2008–2017), with spatially-homogeneous population expansion expected in the near future. Spatial analysis finally highlights that local-scale population growth rates were more clustered in 2008–2017 than in 1999–2008. While the population decreased continuously in the inner districts (<1 km from the city centre), sub-central districts (1–5 km far from the city centre) experienced mixed patterns of population growth and stability. These results confirm the relevance of local-scale policies managing urban renewal and rehabilitation and promoting metropolitan expansion in a spatially-coordinated manner.

1. Introduction

Economic expansion and recession have influenced population dynamics in different ways across Europe, stimulating (or reducing) the attractiveness of central cities and promoting gentrification, increased immigration, and the compact expansion of residential settlements on peripheral land [1,2,3,4]. Earlier studies have sometimes outlined a transition towards distinctive dynamics of urban expansion in recent decades [5], featuring specific forms of exurban development, polycentric growth, and spatially-heterogeneous patterns of population expansion or shrinkage [6,7,8,9]. In this framework, demographic processes had a powerful transformative effect on inner cities, diversifying urban landscapes and producing relevant changes in housing markets and economic structures [10,11,12]. Empirical evidence for re-urbanization has recently been documented in Europe [13,14,15,16], with inner cities re-attracting populations and suburbs experiencing demographic stability or moderate decline [17,18,19]. Together with the long-term demographic transitions and short-term effects of the 2007 economic recession, different factors were demonstrated to contribute to re-urbanization, depending on local conditions [20,21,22] that have determined spatial heterogeneity in population growth rates [23]. In these regards, drivers of re-urbanization include (i) rehabilitation and renewal of inner districts of central cities through re-development projects ameliorating the condition of housing, public spaces, and transportation; (ii) a (more or less) rapid decline in house prices; (iii) the rising cost of transportation from peri-urban areas to inner cities; (iv) changes in the economic structure with the expansion of high-tech, finance, and business sectors; and finally, (v) a generalized attitude toward urban lifestyles induced by demographic changes, including the increase of mono-nuclear families [24,25,26].
Despite an increasing interest manifested by planners and policy-makers, relatively few studies have analyzed the aforementioned processes in the light of a comprehensive assessment of population dynamics and processes, distinguishing short-term from long-term demographic changes [27,28,29,30,31]. Empirical studies are still required to ascertain latent relationships between population dynamics and re-urbanization processes, discussing the role of social changes—including (but not limited to) aspects of social segregation, immigration, gentrification, and transformation of traditional family structures [22,32,33,34]. In these regards, Haase et al. [35] argued that re-urbanization “relates more to city-mindedness as a housing preference rather than to the actual return of suburbanites to the city”. Moreover, re-urbanization processes have been reported to reflect spatially-heterogeneous and socially-fragmented patterns of metropolitan expansion [36].
Based on these premises, our study analyzes short-term population dynamics and their impact on urban expansion, discussing the relevance of social processes leading to gentrification, demographic change, and re-urbanization, using an exploratory spatial data analysis of local-scale population growth (or decline) in inner Milan (northern Italy) over the last two decades (1999–2017). Milan is exemplificative of urban agglomerations attracting populations and jobs due to intense economic growth and diversification in the production base, specialized in advanced services. Since the 1960s, the dense city underwent a slow transition towards suburbanization (1960s–1990s) with a slow decline of core nodes and emerging sub-centers. An increasingly competitive environment oriented to globalization, finance, real estate, and creative industries—including fashion—drove these dynamics. Our study debates on the present and future expansion of contemporary cities, adopting a geo-demographic approach for understanding metropolitan transitions in urban Europe. Results of this study are commented upon in the light of sustainable urban management, evidencing the intimate link between re-urbanization and urban containment in metropolitan regions [37].

2. Materials and Methods
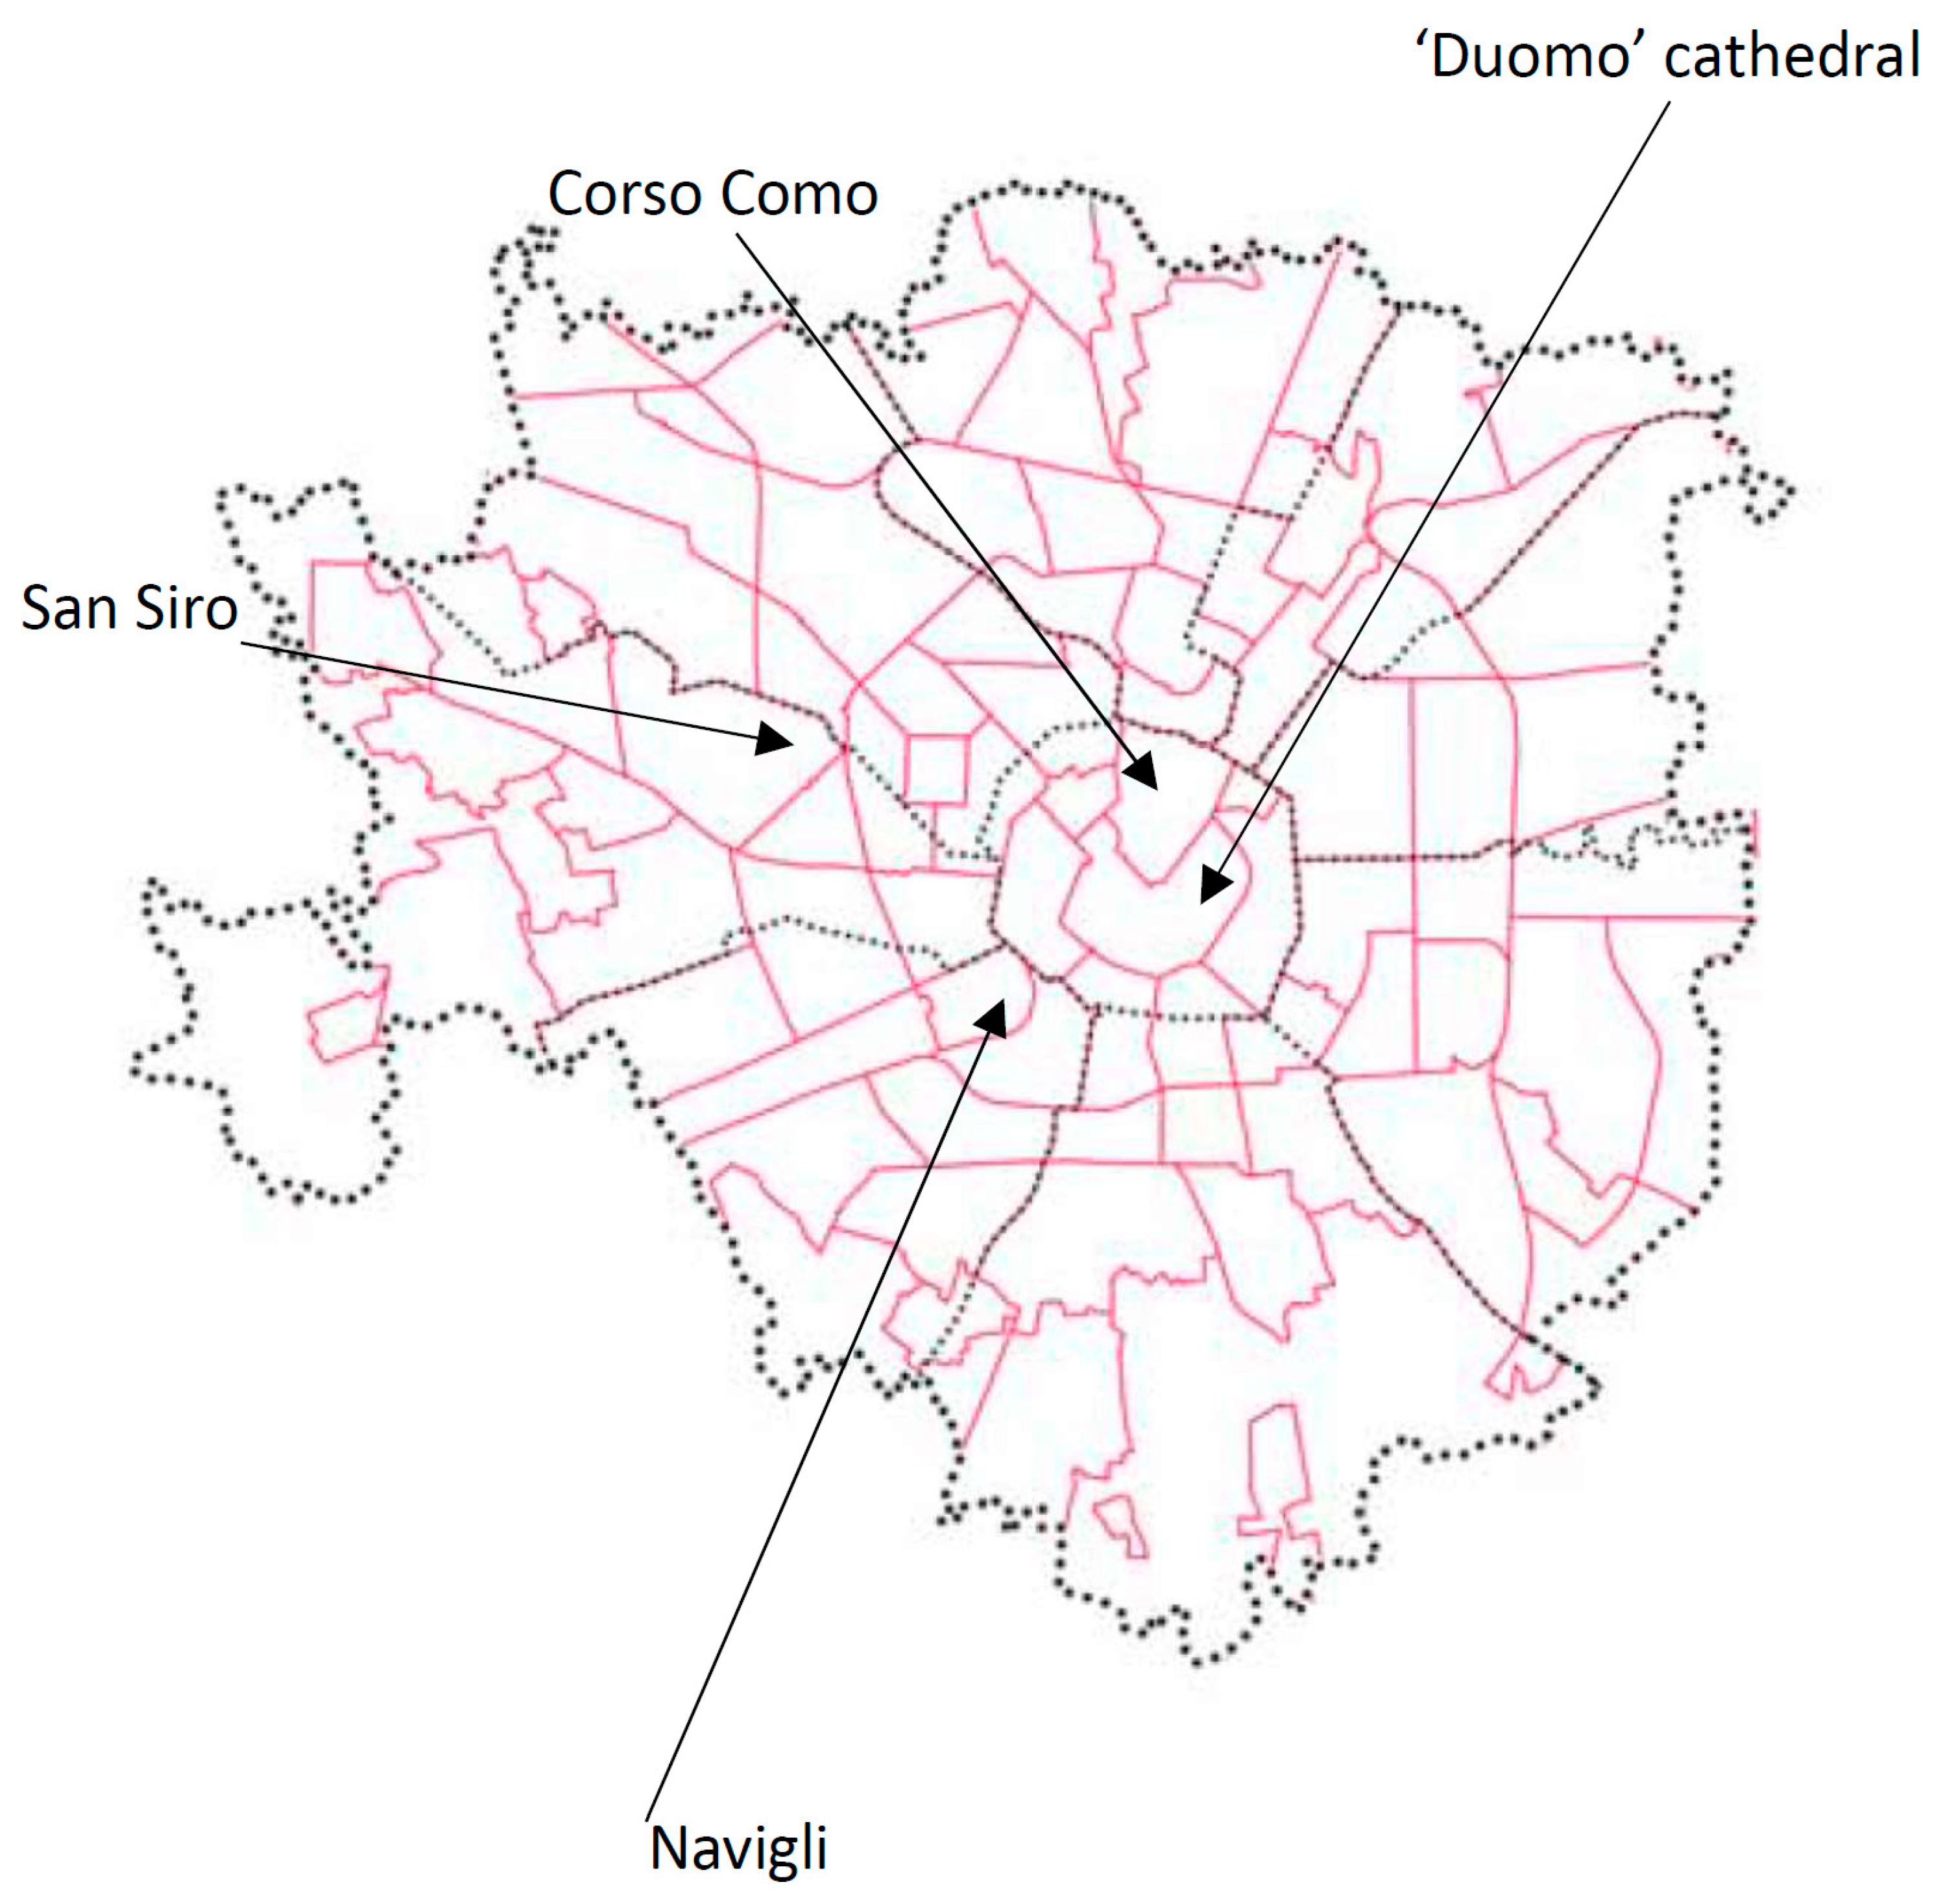
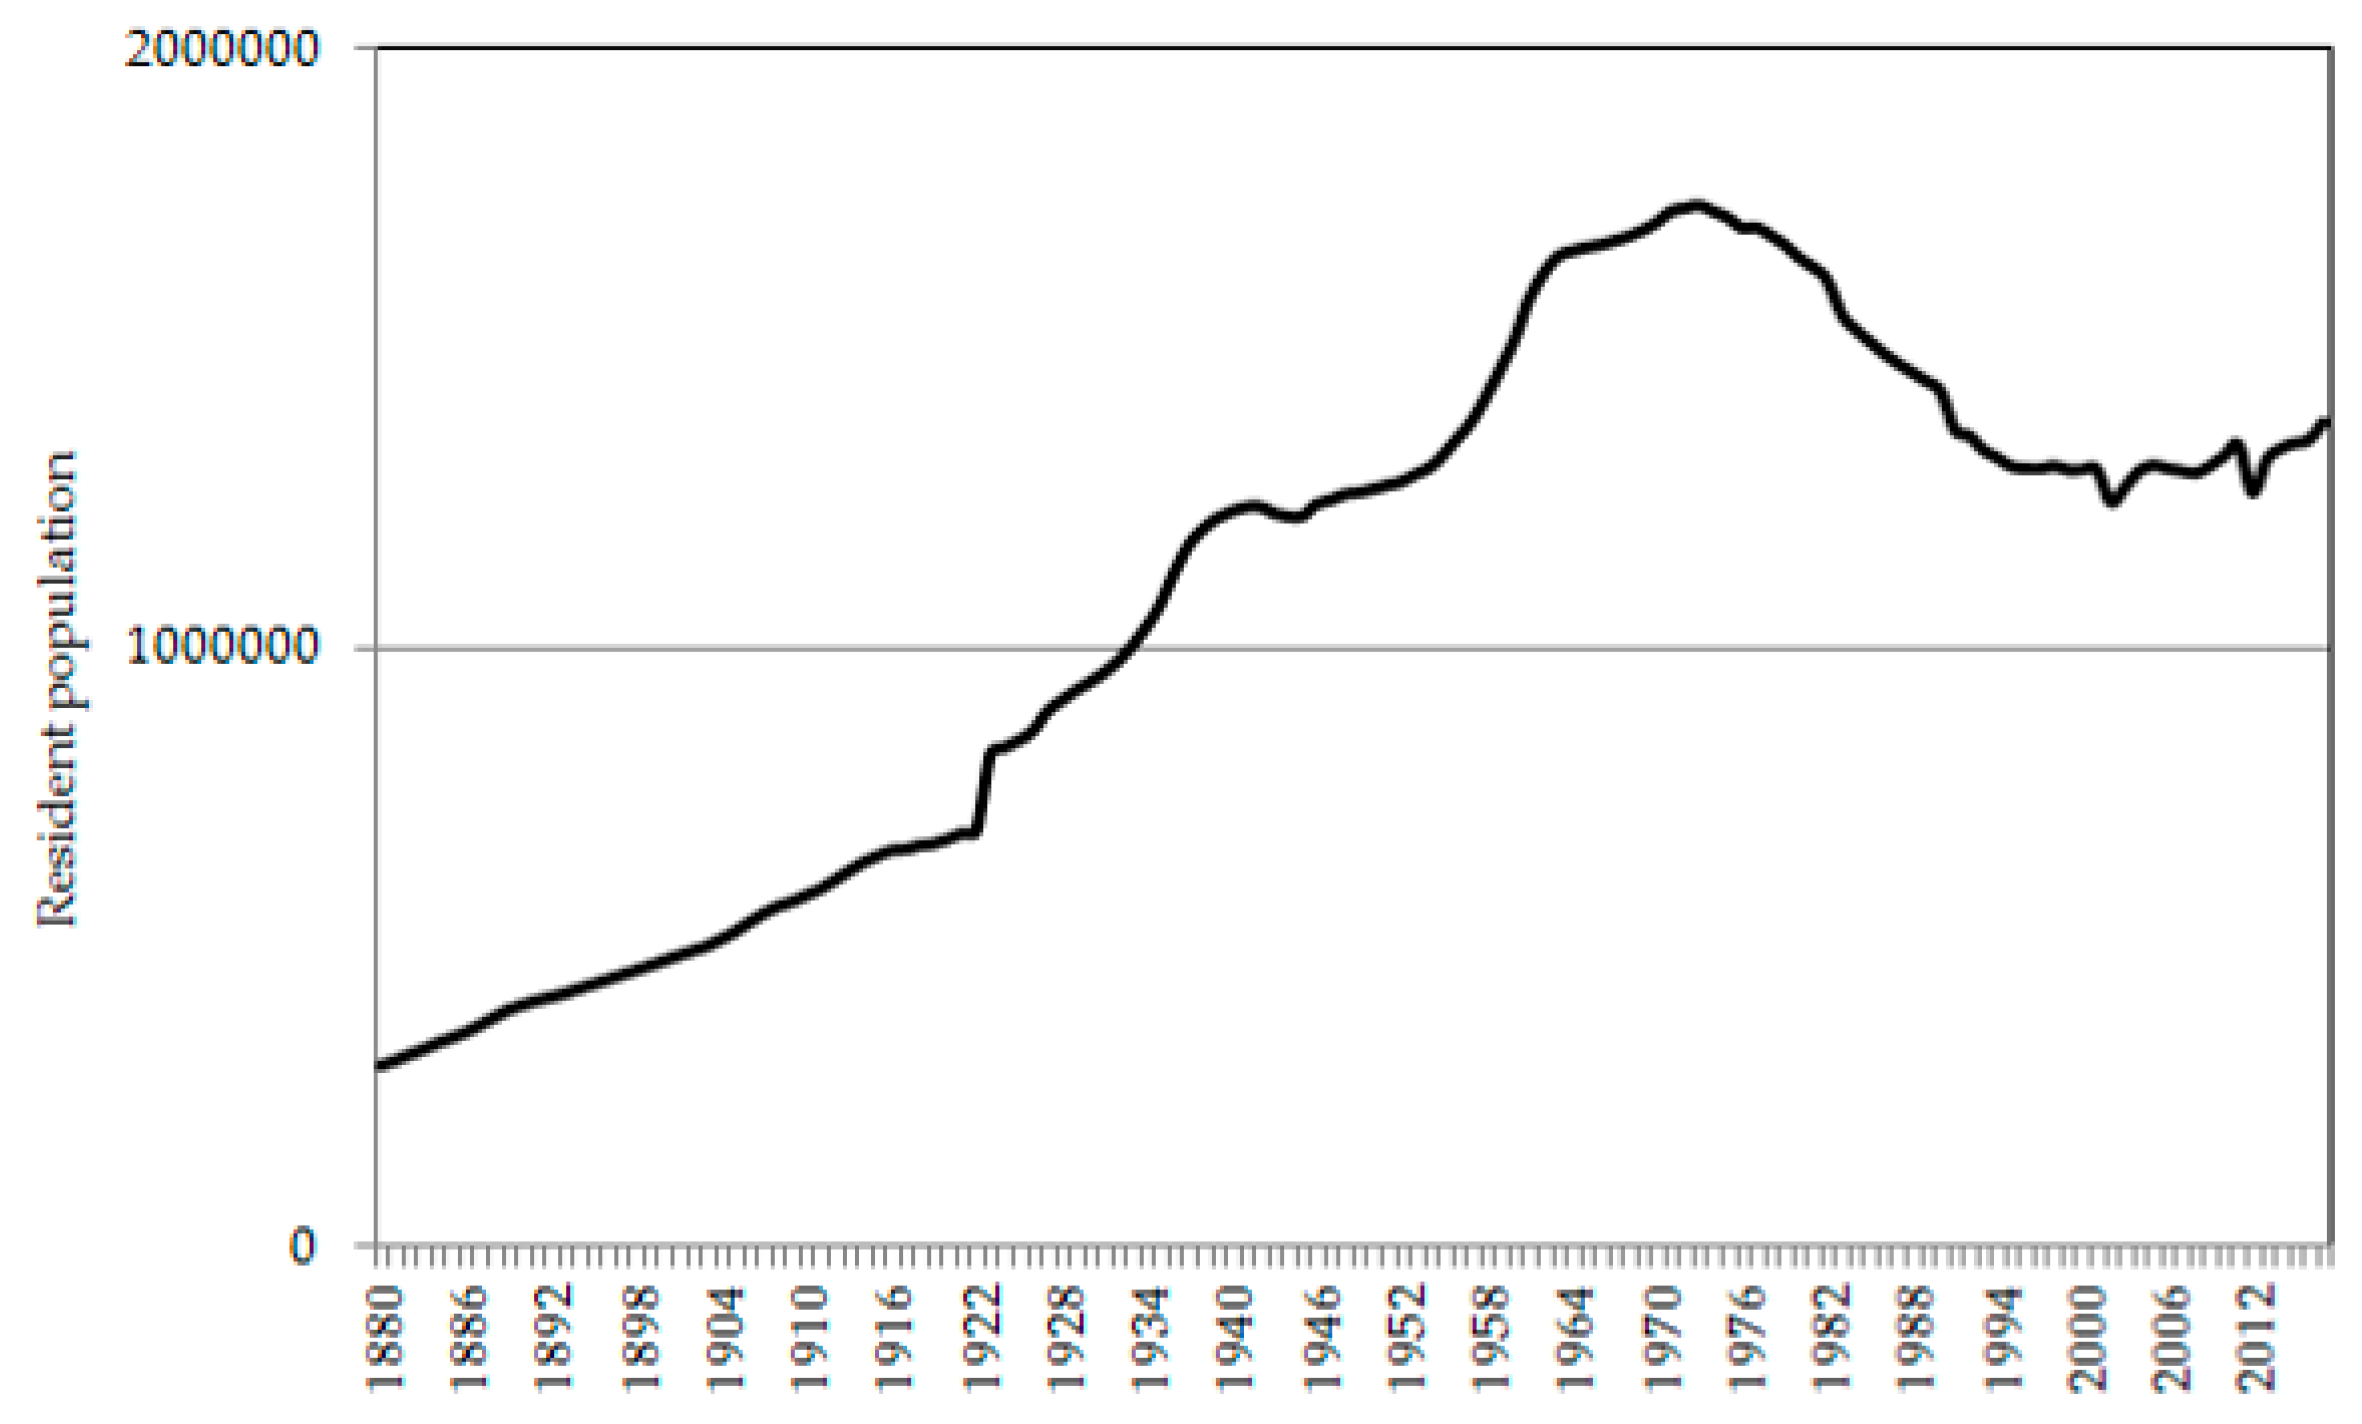
2.1. Study Area

The investigated area includes Milan′s municipality extending 181 km2 of flat land up to nearly 5 km farther away from the historical centre of the city (identified by the ‘Duomo’ cathedral). This area represents the inner core of the largest Italian urban agglomeration (‘metropolitan area of Milan’), involving 134 municipalities in the Lombardy region (northern Italy), with a total population of nearly 3.2 million residents, a total surface area of 1576 km2, and a population density overpassing 2000 inhabitants/km2. Milan is one of the most developed and productive cities in Europe, thriving in terms of fashion, banking, commerce, business, design, trade, and industry. The study area was sub-divided into 88 urban districts (the so called ‘nuclei di identità locale’ or ‘local identity districts’, NIL) classified into distance zones from ‘Piazza del Duomo’ (the Church′s square taken as the centre of Milan) and representing homogeneous neighborhoods in terms of social composition and economic structure (Figure 1). Urban districts were identified by Milan′s municipality statistical office with the aim of providing homogeneous spatial units for the local-scale demographic and economic analysis of metropolitan transformations. The concept of urban identity was reflective of similarity in basic socioeconomic structures, such as social composition, population age, job specialization, and income/wealth profile of the resident population.

2.2. Demographic Indicators

The latest annual population data at the urban district scale released for the time period 1999-2017 by the statistical office of Milan′s municipality were used in this study. As derived from the official population register, a percent annual rate of population growth was calculated at the district scale, obtaining 17 variables (population growth rate over 1999–2000, 2000–2001, …, 2016–2017). Contributions of population dynamics to a city′s expansion may assume positive (population growth) or negative (population decline) values. Population forecasts covering a time interval from 2018 to 2036 were derived from a local-scale projection model developed by the statistical office of Milan′s municipality. Three scenarios were produced considering recent population dynamics (high, central, low) characterized by distinct population growth rates. A central scenario was assumed in this study as the most reliable prediction for future local-scale population dynamics. Three background variables providing a basic description of the local socioeconomic context were calculated for each district: (i) population density (inhabitants/km2), reflecting urban agglomeration and economic concentration; (ii) distance (km) of the centroid of each spatial unit (NIL) from Piazza del Duomo, reflecting accessibility as a result of the urban gradient in Milan; and (iii) percent share of university graduates in the total resident population, reflecting economic conditions for each examined neighborhood. A greater percentage of resident graduates is usually associated with better jobs and higher wages.

2.3. Data Analysis

Descriptive statistics analyzing annual rates of population growth were computed by urban districts. A non-parametric Principal Component Analysis (PCA) was run for the data matrices composed of 17 variables quantifying percent annual population growth for each district (NIL), using a simplified non-parametric approach with the aim of exploring non-linear relationships among variables and to improve the performances of standard PCA [38]. Non-parametric PCA was applied to the data matrix illustrating population dynamics at each district using a correlation matrix based on Spearman rank coefficients instead of Pearson moment correlation coefficients. Non-parametric approaches are promising tools in the analysis of large datasets characterized by complex, non-linear relationships between variables. Non-parametric PCA has multiple aims: (i) to remove the scaling effect typically associated with covariance matrices; and (ii) to consider both linear and non-linear correlation patterns among variables. Spearman’s rank correlation coefficient is a non-parametric, rank measure of statistical dependence between two variables [39]. Spearman correlation is less sensitive than Pearson correlation to outliers, since Spearman’s coefficient limits the outlier to the value of its rank, and considerable deviation from normality. The number of significant components was chosen according to the scree-plot criterion fixing the minimum eigenvalue threshold to 1.
A global Moran’s spatial autocorrelation index (z-score) computed on four bandwidths (from 1 km to 8 km) was run on the rate of population growth using districts as the elementary analysis’ domain. Global Moran′s coefficients of spatial autocorrelation provide a coherent analysis of clustering or randomness in the spatial distribution of percent annual population growth rates. A non-parametric Spearman analysis was run to define significant pair-wise correlations between the annual rate of population growth and each contextual variable (population density, distance from the city center, and rate of university graduates in total population). Significance was set up at p < 0.05 after Bonferroni′s correction for multiple comparisons.

3. Results

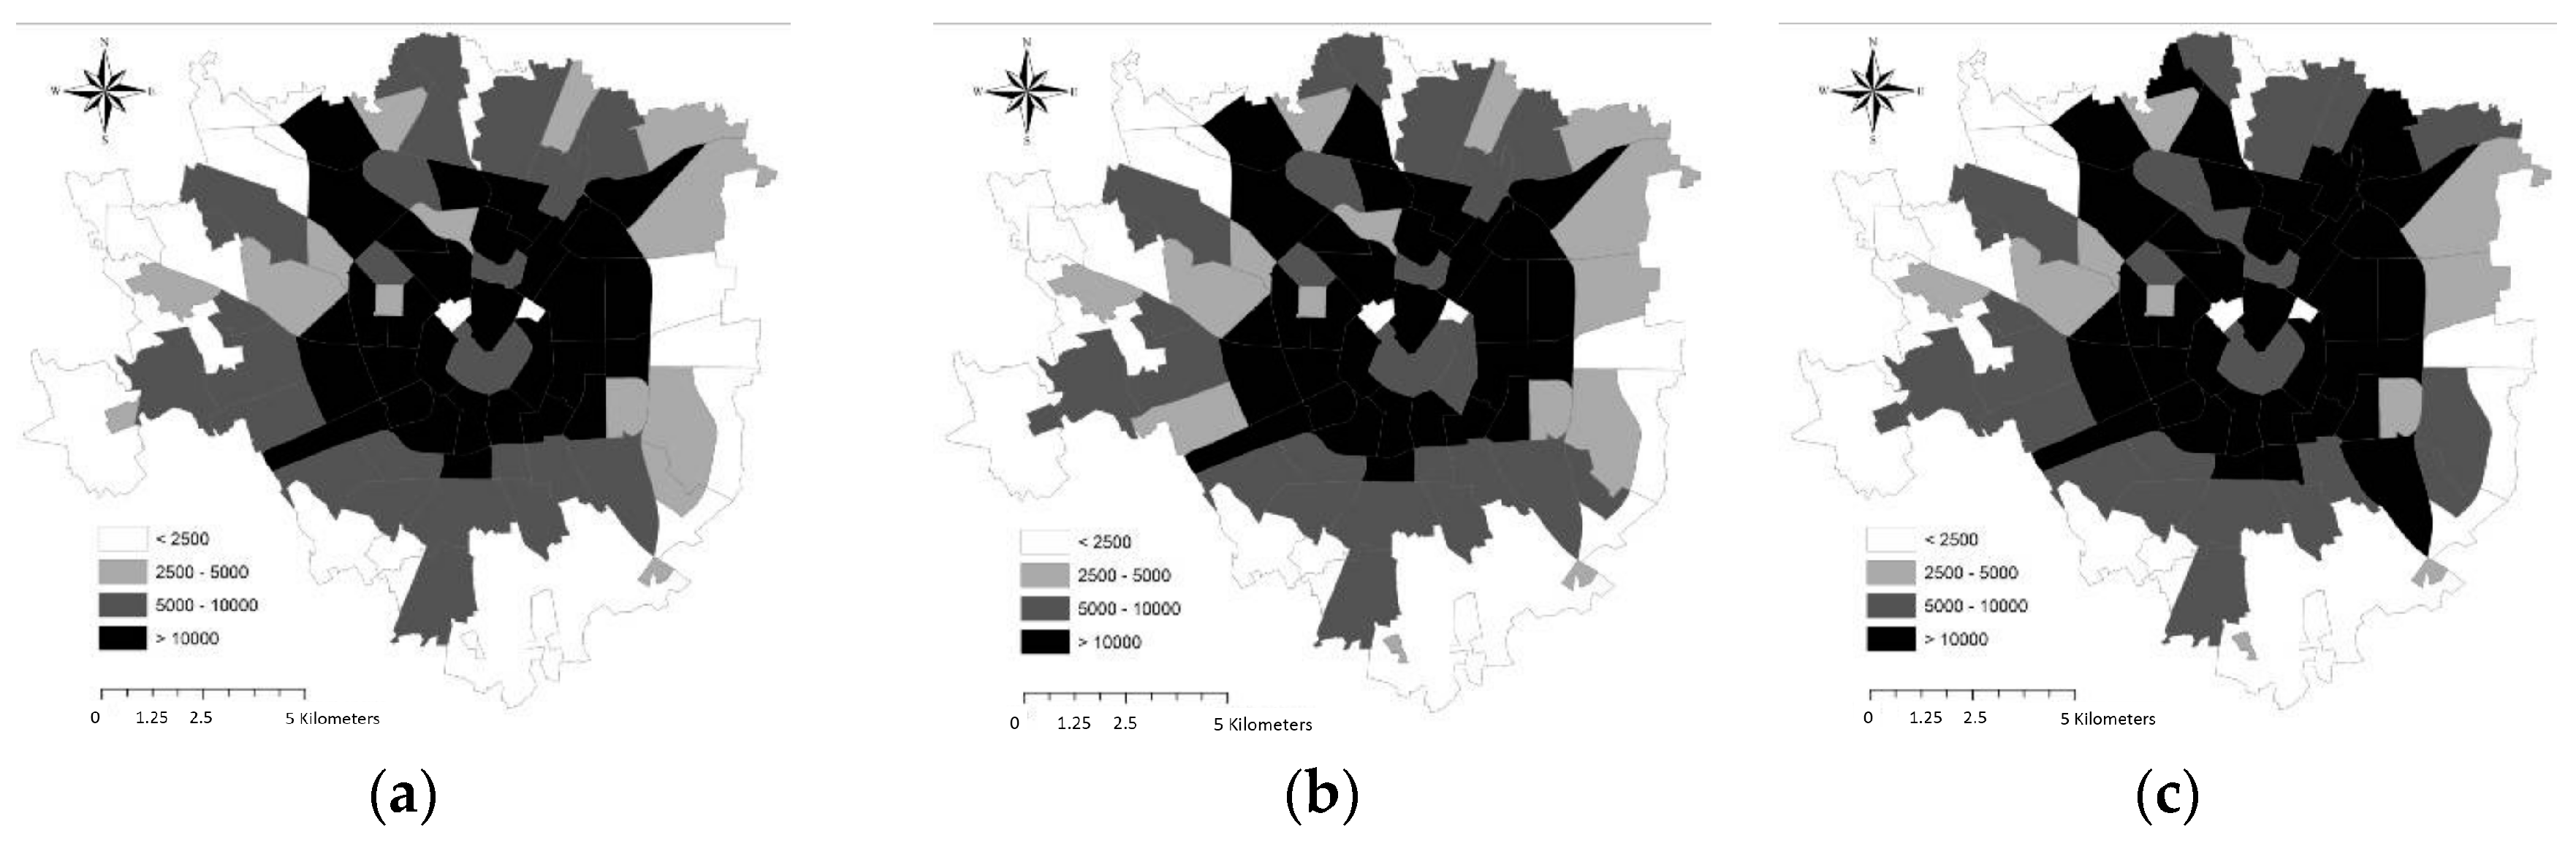
3.1. Population Dynamics in Milan (1999–2017)

The resident population increased continuously in Milan between 1880 and 1975, reaching 1.7 million inhabitants (Figure 2). From 1976 onwards, the population decreased rapidly to 1.2 million inhabitants in the early 2000s. In the most recent years, a moderate population growth occurred with a relatively heterogeneous time pattern. The three periods described above correspond to distinct phases of Milan′s urban cycle, including: (i) early urbanization of central districts; (ii) a subsequent suburbanization of fringe districts; and (iii) a moderate re-urbanization of semi-central districts.
Milan′s urban districts showed a rather homogeneous population density over space, which was relatively stable over time (Figure 3) and follows a radio-centric distribution, with higher densities observed in central districts and lower densities in more peripheral places. A few exceptions are related to urban districts with parks, gardens, water bodies, and non-urban, protected land—as in the southern part of Milan′s municipalities, the location of a Regional Agricultural Park (‘Parco Agricolo Sud Milano′). In this framework, the population density increased moderately during the study period, and especially over 2008–2017, thanks to spatially-heterogeneous processes of urban recovery, economic re-polarization, and new residential developments in the few empty areas around the centre.
The annual percent population growth rate (Figure 4) shows two different spatial patterns when comparing the 1999–2008 and 2008–2017 time intervals. In the first period, the population mainly increased in peripheral urban districts south and north of the city centre (>1%), while consolidated urban districts displayed negative growth rates, often below −1% per year. The second period reflected more homogeneous demographic dynamics, with a substantial re-polarization of consolidated urban districts and a strong population increase in more peripheral districts. Only inner districts (<1 km farther away from the cathedral) experienced a stable or moderately decreasing population. This spatial pattern is predicted to consolidate in the future decades, with the largest population increase being concentrated in central and eastern Milan.
The spatial structure of population dynamics (Figure 5) shows a significant, non-linear relationship between the population growth rate (rs = 0.56, p < 0.05, n = 88) during the two time intervals (1999–2008 vs. 2008–2017).
Moreover, a Moran′s analysis of global spatial autocorrelation (Table 1) revealed some differences between the spatial structure of the population growth rate in the two time intervals investigated in this study, being relatively more clustered in the second interval (2008–2017) compared with the first one (1999–2008).
Overall, the empirical evidence may indicate more heterogeneous demographic trends over time and spatially-complex population dynamics, distinguishing homogeneous urban clusters experiencing population expansion or decrease. Taken together, spatio-temporal dynamics in Milan′s population outline a moderate re-densification of semi-central districts based on a mosaic of locally-differentiated processes of growth and decline.

3.2. Multivariate Analysis

A non-parametric Principal Component Analysis extracted four relevant axes explaining nearly 68% of the total matrix variance, outlining the most relevant temporal and spatial structures of population dynamics in Milan (Table 2). Component 1 (33% of total variance) was mainly associated with population increase in two time periods (2001–2004 and 2007–2012). The distribution of component 1 scores over space indicates that a substantially radio-centric expansion of population occurred in those two periods, with the highest growth rates concentrated in peripheral urban districts south, east, and north of Milan (Figure 6). Component 2 (16% of total variance) outlines diverging dynamics observed in 2005–2006 (positive loadings) and 2013–2016 (negative loadings) in the study area. The first period gives evidence of sprawl, as the population increased in peripheral locations, mainly south and north-west of Milan, remaining stable or decreasing slightly in more central locations. Component 3 (10% of total variance) outlines similar dynamics for the first and the last observation years based on a marked increase of the resident population in semi-central districts forming the consolidated city. Finally, component 4 (8% of total variance) was negatively correlated with the population growth rate in a single year (2014) and identified a different spatial regime characterizing population dynamics in Milan, with the population in semi-central districts north and south of the inner cities expanding the most.

3.3. Background Correlation Analysis

A pair-wise correlation analysis between the spatial distribution of annual population growth rates and the three contextual variables (population density, distance from downtown, and percent share of graduated in total inhabitants) was run separately in two time intervals (1999–2008 and 2008–2017) for Milan′s urban districts using both parametric and non-parametric coefficients (Table 3). The population growth rate decreased significantly during 1999–2008 with population density and the percentage of graduated people in each districts. In the following period, population growth rates decreased moderately with the distance from downtown, providing evidence of anti-sprawl movements. In all cases, pair-wise significant correlations assumed a non-linear form. Individual PCA 1 scores for each district were correlated negatively with all background variables, displaying linear relationships among variables. PCA 2 scores decreased moderately with the distance from downtown in a mostly non-linear manner.

4. Discussion

This contribution has studied short-term changes in the spatial distribution of annual rates of population growth in a large city in Europe taken as a local-scale indicator evaluating the speed and direction of urban expansion during distinct economic phases, namely expansion (1999–2008) and recession (2008–2017). The results of this study are rather mixed, indicating intense re-urbanization (at least in semi-central districts) after 2008, as a possible result of recession and the spatial restructuring of economic activities. Demographic trends in Milan reflect the simultaneous action of sequential urban waves of suburbanization and economic re-polarization, intended as an early sign of re-urbanization [40,41,42,43,44]. In the most recent decade, spatially-heterogeneous population growth characterized peripheral areas, in contrast with the moderate increase of population observed in semi-central districts. In this regard, districts placed in-between the inner city and the suburbs had specific socio-demographic characteristics with a stable or slightly increasing resident population. At the same time, the historical center (within the ancient walls, namely ′Cerchia dei Bastioni′) was experiencing a long-lasting decline associated with the de-centralization of economic activities in semi-central districts and more peripheral areas.
Population shrinkage in historical districts also reflected a recent slowdown of exurban development, with semi-dense settlements expanding preferentially into vacant land in already urbanized areas. Following urban renewal and regeneration, early signs of re-urbanization were a result of economic re-polarization typical of semi-central districts [45]. In these regards, public and private investments toward rehabilitation programs and initiatives were demonstrated to attract specific population segments and/or economic groups (as specifically observed in ‘Navigli’ district for students, in ′Tortona′ district for architects and fashion design, and in ′Corso Como/Garibaldi′ for offices/advanced services and entertainment). At the same time, factors underlying urban recovery were rather differentiated in semi-central areas thanks to their diverging social characteristics [17,46,47,48]. Trends toward re-urbanization in Milan seem to be related to specific patterns of residential mobility of defined population segments (e.g., immigrants, native singles, and divorced people), consolidating social segregation within the historical city [49]. Demographic and economic recovery of this part of the city in the coming future may depend on multiple factors, e.g., the continued decrease of housing prices. Urban rehabilitation measures, as the so-called ‘Bosco verticale′—one of the biggest green redevelopment projects in Italy—as well as an improved cultural centrality compared with the surrounding districts—is a key driver of residential mobility, especially in leading the native population to come back to downtown [50,51]. Immigration is acting as another force of re-urbanization, consolidating (or altering) the social structure of fringe districts [52].
The empirical results of our study indicate how gentrification and migration represent two sides of the same medal, leading to class segregation [28]. The evidence is in line with the findings of Haase et al. [35], suggesting that—although driven by similar underlying factors—the contribution of social processes such as gentrification, immigration, segregation, and filtering to re-urbanization is, in a qualitative sense, still distinctive [32]. Spatially-heterogeneous patterns of re-urbanization make policy analysis more tricky [18,53,54]. Exurban development and re-urbanization have divergent impacts on strategies of urban containment and settlement densification. In this sense, an improved comprehension of mechanisms of population redistribution across metropolitan regions should be better linked to short-term changes in the demographic structure [30]. Moreover, understanding re-densification processes should be better re-connected with regional and national spatial planning [54]. After long-lasting suburbanization and counter-urbanization, re-urbanization led to mixed urban outcomes [55], indicating that a unique explanation of forces determining urban re-densification and economic re-polarization is only partly adequate for representing the inherent complexity of Italian cities, and possibly those of other European countries [32,56,57]. The most recent economic crisis has deeply influenced patterns of urban expansion, shaping population dynamics, influencing building cycles, and depressing housing and labor markets [58,59,60]. Unravelling impacts of the 2007–2008 financial crisis on demographic dynamics and urban expansion, is particularly relevant in countries and regions greatly affected by recession [61].

5. Conclusions

After a long period of suburbanization, evidence of a new attractiveness of cities is gaining strength in Europe. A comparative analysis of statistical data integrating demographic dynamics, settlement characteristics, and land-use is useful to document new patterns of urban expansion in Europe underlying distinct processes of social change and economic transformations. Homogeneous statistical sources documenting urban growth and change in contemporary cities are particularly important in demographic studies. Analyzing recent population dynamics and future demographic trends will contribute to the sustainable management of late suburbanization and early re-urbanization of European cities.

Author Contributions

Conceptualization, F.M.C.; Methodology, M.C.; Formal Analysis, L.S.; Writing—Original Draft Preparation, L.S.; Writing—Review & Editing, M.C.

Funding

The APC was funded by Sapienza University of Rome under the research project CRISIS.

Conflicts of Interest

The authors declare no conflict of interest.

References

  1. Villa, P. Mapping urban growth using Soil and Vegetation Index and Landsat data: The Milan (Italy) city area case study. Landsc. Urban Plan. 2012, 107, 245–254. [Google Scholar] [CrossRef]
  2. Salvati, L. Urban expansion and high-quality soil consumption—An inevitable spiral? Cities 2013, 31, 349–356. [Google Scholar] [CrossRef]
  3. De Rosa, S.; Salvati, L. Beyond a ‘side street story’? Naples from spontaneous centrality to entropic polycentricism, towards a ‘crisis city’. Cities 2016, 51, 74–83. [Google Scholar] [CrossRef]
  4. Rontos, K.; Grigoriadis, S.; Sateriano, A.; Syrmali, M.; Vavouras, I.; Salvati, L. Lost in Protest, Found in Segregation: Divided Cities in the Light of the 2015 ‘Oki’ Referendum in Greece. City Cult. Soc. 2016, 7, 139–148. [Google Scholar] [CrossRef]
  5. Masini, E.; Barbati, A.; Bencardino, M.; Carlucci, M.; Corona, P.; Salvati, L. Paths to Change: Bio-Economic Factors, Geographical Gradients and the Land-Use Structure of Italy. Environ. Manag. 2018, 61, 116–131. [Google Scholar] [CrossRef] [PubMed]
  6. Catalàn, B.; Sauri, D.; Serra, P. Urban sprawl in the Mediterranean? Patterns of growth and change in the Barcelona Metropolitan Region 1993–2000. Landsc. Urban Plan. 2008, 85, 174–184. [Google Scholar]
  7. Arapoglou, V.P.; Sayas, J. New facets of urban segregation in southern Europe—Gender, migration and social class change in Athens. Eur. Urban Reg. Stud. 2009, 16, 345–362. [Google Scholar] [CrossRef]
  8. Andersen, H.T.; Møller-Jensen, L.; Engelstoft, S. The end of urbanization? Towards a new urban concept or rethinking urbanization. Eur. Plan. Stud. 2011, 19, 595–611. [Google Scholar] [CrossRef]
  9. Zitti, M.; Ferrara, C.; Perini, L.; Carlucci, M.; Salvati, L. Long-term Urban Growth and Land-use Efficiency in Southern Europe: Implications for Sustainable Land Management. Sustainability 2015, 7, 3359–3385. [Google Scholar] [CrossRef]
  10. Gargiulo Morelli, V.; Rontos, K.; Salvati, L. Between suburbanisation and re-urbanisation? Revisiting the Urban Life Cycle in a Mediterranean Compact City. Urban Res. Pract. 2014, 7, 74–88. [Google Scholar] [CrossRef]
  11. Carlucci, M.; Grigoriadis, E.; Rontos, K.; Salvati, L. Revisiting an Hegemonic Concept: Long-term ‘Mediterranean Urbanization’ in between city re-polarization and metropolitan decline. Appl. Spat. Anal. Policy 2017, 10, 347–362. [Google Scholar] [CrossRef]
  12. Cuadrado-Ciuraneta, S.; Durà-Guimerà, A.; Salvati, L. Not only tourism: Unravelling suburbanization, second-home expansion and “rural” sprawl in Catalonia, Spain. Urban Geogr. 2017, 38, 66–89. [Google Scholar] [CrossRef]
  13. Rae, A. English urban policy and the return to the city: A decade of growth, 2001–2011. Cities 2013, 32, 94–101. [Google Scholar] [CrossRef]
  14. Kabisch, N.; Haase, D.; Haase, A. Evolving reurbanisation? Spatio-temporal dynamics as exemplified by the East German city of Leipzig. Urban Stud. 2010, 47, 967–990. [Google Scholar] [CrossRef]
  15. Kabisch, N.; Haase, D. Diversifying European agglomerations: Evidence of urban population trends for the 21st century. Popul. Space Place 2011, 17, 236–253. [Google Scholar] [CrossRef]
  16. Kroll, F.; Kabisch, N. The Relation of Diverging Urban Growth Processes and Demographic Change along an Urban–Rural Gradient. Popul. Space Place 2012, 18, 260–276. [Google Scholar] [CrossRef]
  17. Salvati, L.; Gargiulo Morelli, V. Unveiling Urban Sprawl in the Mediterranean Region: Towards a Latent Urban Transformation? Int. J. Urban Reg. Res. 2014, 38, 1935–1953. [Google Scholar] [CrossRef]
  18. Pili, S.; Grigoriadis, E.; Carlucci, M.; Clemente, M.; Salvati, L. Towards Sustainable Growth? A Multi-criteria Assessment of (Changing) Urban Forms. Ecol. Indic. 2017, 76, 71–80. [Google Scholar] [CrossRef]
  19. Duvernoy, I.; Zambon, I.; Sateriano, A.; Salvati, L. Pictures from the Other Side of the Fringe: Urban Growth and Peri-Urban Agriculture in a Post-Industrial City (Toulouse, France). J. Rural Stud. 2018, 57, 25–35. [Google Scholar] [CrossRef]
  20. Rérat, P. The new demographic growth of cities: The case of reurbanisation in Switzerland. Urban Stud. 2012, 49, 1107–1125. [Google Scholar] [CrossRef]
  21. Munafò, M.; Salvati, L.; Zitti, M. Estimating soil sealing at country scale—Italy as a case study. Ecol. Ind. 2013, 26, 36–43. [Google Scholar] [CrossRef]
  22. Kazemzadeh-Zow, A.; Zanganeh Shahraki, S.; Salvati, L.; Neisani Samani, N. A Spatial Zoning Approach to Calibrate and Validate Urban Growth Models. Int. J. Geogr. Inf. Sci. 2017, 31, 763–782. [Google Scholar] [CrossRef]
  23. Gutierrez-Posada, D.; Rubiera-Morollon, F.; Vinuela, A. Heterogeneity in the determinants of population growth at the local level: Analysis of the Spanish case with a GWR approach. Int. Reg. Sci. Rev. 2017, 40, 211–240. [Google Scholar] [CrossRef]
  24. Lever, W.F. Reurbanisation—The policy implications. Urban Stud. 1993, 30, 267–284. [Google Scholar] [CrossRef]
  25. Leontidou, L. Repolarization of the Mediterranean: Spanish and Greek cities in neo-liberal Europe. Eur. Plan. Stud. 1995, 3, 155–172. [Google Scholar] [CrossRef]
  26. Pacione, M. Urban Geography: A Global Perspective; Routledge: London, UK, 2005. [Google Scholar]
  27. Ogden, P.E.; Hall, R. Households, reurbanisation and the rise of living alone in the principal French cities 1975–1990. Urban Stud. 2000, 37, 367–390. [Google Scholar] [CrossRef]
  28. Buzar, S.; Ogden, P.E.; Hall, R.; Haase, A.; Kabisch, S.; Steinführer, A. Splintering urban populations: Emergent landscapes of reurbanisation in four European cities. Urban Stud. 2007, 44, 651–677. [Google Scholar] [CrossRef]
  29. Martinez-Fernandez, C.; Audirac, I.; Fol, S.; Cunningham-Sabot, E. Shrinking cities: Urban challenges of globalization. Int. J. Urban Reg. Res. 2012, 36, 213–225. [Google Scholar] [CrossRef] [PubMed]
  30. Rink, D.; Haase, A.; Grossmann, K.; Couch, C.; Cocks, M. From long-term shrinkage to re-growth? The urban development trajectories of Liverpool and Leipzig. Built Environ. 2012, 38, 162–178. [Google Scholar] [CrossRef]
  31. Zambon, I.; Benedetti, A.; Ferrara, C.; Salvati, L. Soil Matters? A Multivariate Analysis of Socioeconomic Constraints to Urban Expansion in Mediterranean Europe. Ecol. Econ. 2018, 146, 173–183. [Google Scholar] [CrossRef]
  32. Van Criekingen, M. Gentrifying the re-urbanisation debate, not vice versa: The uneven socio-spatial implications of changing transitions to adulthood in Brussels. Popul. Space Place 2010, 16, 381–394. [Google Scholar] [CrossRef]
  33. López-Gay, A. Population growth and re-urbanization in Spanish inner cities: The role of internal migration and residential mobility. Revue Quetelet 2014, 2, 67–92. [Google Scholar] [CrossRef] [Green Version]
  34. Zambon, I.; Serra, P.; Sauri, D.; Carlucci, M.; Salvati, L. Beyond the ‘Mediterranean City’: Socioeconomic Disparities and Urban Sprawl in Three Southern European Cities. Geogr. Ann. B 2017, 99, 319–337. [Google Scholar] [CrossRef]
  35. Haase, A.; Kabisch, S.; Steinführer, A.; Bouzarovski, S.; Hall, R.; Ogden, P. Emergent spaces of reurbanisation: Exploring the demographic dimension of inner-city residential change in a European setting. Popul. Space Place 2010, 16, 443–463. [Google Scholar] [CrossRef]
  36. Bouzarovski, S.; Haase, A.; Hall, R.; Steinführer, A.; Kabisch, S.; Ogden, P.E. Household Structure, Migration Trends, and Residential Preferences in Inner-city León, Spain: Unpacking the Demographies of Reurbanization. Urban Geogr. 2010, 31, 211–235. [Google Scholar] [CrossRef]
  37. Lauf, S.; Haase, D.; Kleinschmit, B. The effects of growth, shrinkage, population aging and preference shifts on urban development—A spatial scenario analysis of Berlin, Germany. Land Use Policy 2016, 52, 240–254. [Google Scholar] [CrossRef]
  38. Salvati, L.; Sabbi, A.; Carlucci, M. Exploring Complex Relationships using non-parametric Principal Components Analysis: A Case Study with Land-Use Data. Int. J. Ecol. Econ. Stat. 2014, 33, 90–97. [Google Scholar]
  39. Salvati, L.; Gargiulo-Morelli, V.; Rontos, K.; Sabbi, A. Latent exurban development: City expansion along the rural-to-urban gradient in growing and declining regions of Southern Europe. Urban Geogr. 2013, 34, 376–394. [Google Scholar] [CrossRef]
  40. Cheshire, P. A new phase of urban development in Western Europe? The evidence for the 1980s. Urban Stud. 1995, 32, 1045–1063. [Google Scholar] [CrossRef]
  41. Dura-Guimera, A. Population deconcentration and social restructuring in Barcelona, a European Mediterranean city. Cities 2003, 20, 387–394. [Google Scholar] [CrossRef]
  42. Couch, C.; Petschel-Held, G.; Leontidou, L. Urban Sprawl in Europe: Landscapes, Land-Use Change and Policy; Blackwell: London, UK, 2007. [Google Scholar]
  43. Détang-Dessendre, C.; Goffette-Nagot, F.; Piguet, V. Life cycle and migration to urban and rural areas: Estimation of a mixed logit model on French data. J. Reg. Sci. 2008, 48, 789–824. [Google Scholar] [CrossRef]
  44. Ceccarelli, T.; Bajocco, S.; Perini, L.; Salvati, L. Urbanisation and Land Take of High Quality Agricultural Soils-Exploring Long-term Land Use Changes and Land Capability in Northern Italy. Int. J. Environ. Res. 2014, 8, 181–192. [Google Scholar]
  45. Savini, F. What happens to the urban periphery? The political tensions of postindustrial redevelopment in Milan. Urban Aff. Rev. 2014, 50, 180–205. [Google Scholar] [CrossRef]
  46. Mudu, P. Patterns of segregation in contemporary Rome. Urban Geogr. 2006, 27, 422–440. [Google Scholar] [CrossRef]
  47. Allegretti, G.; Cellamare, C. The ambiguous renaissance of Rome. In Whose Urban Renaissance? Porter, L., Shaw, K., Eds.; Routledge: London, UK, 2009. [Google Scholar]
  48. Di Feliciantonio, C.; Salvati, L. ‘Southern’ alternatives of urban diffusion: Investigating settlement characteristics and socioeconomic patterns in three Mediterranean regions. Tijdschr. Econ. Soc. Geogr. 2015, 106, 453–470. [Google Scholar] [CrossRef]
  49. Savini, F.; Majoor, S.; Salet, W. Urban peripheries: Reflecting on politics and projects in Amsterdam, Milan, and Paris. Environ. Plan. C 2015, 33, 457–474. [Google Scholar] [CrossRef]
  50. Sacco, P.; Tavano Blessi, G. The social viability of culture-led urban transformation processes: Evidence from the Bicocca District, Milan. Urban Stud. 2009, 46, 1115–1135. [Google Scholar] [CrossRef]
  51. Balducci, A.; Fedeli, V.; Pasqui, G. Strategic Planning for Contemporary Urban Regions: City of Cities: A Project for Milan; Ashgate: Aldershot, UK, 2011. [Google Scholar]
  52. Savini, F.; Aalbers, M.B. The de-contextualisation of land use planning through financialisation: Urban redevelopment in Milan. Eur. Urban Reg. Stud. 2016, 23, 878–894. [Google Scholar] [CrossRef]
  53. Siedentop, S.; Fina, S. Who sprawls most? Exploring the patterns of urban growth across 26 European countries. Environ. Plan. A 2012, 44, 2765–2784. [Google Scholar] [CrossRef]
  54. Colantoni, A.; Grigoriadis, E.; Sateriano, A.; Venanzoni, G.; Salvati, L. Cities as selective land predators? A Lesson on Urban Growth, (Un)effective planning and Sprawl Containment. Sci. Total Environ. 2016, 545–546, 329–339. [Google Scholar] [CrossRef] [PubMed]
  55. Allen, J.; Barlow, J.; Leal, J.; Maloutas, T.; Padovani, L. Housing in Southern Europe; Blackwell: London, UK, 2004. [Google Scholar]
  56. Garcia, M. The breakdown of the Spanish urban growth model: Social and territorial effects of the global crisis. Int. J. Urban Reg. Res. 2010, 34, 967–980. [Google Scholar] [CrossRef]
  57. Pérez, J.M.G. The real estate and economic crisis: An opportunity for urban return and rehabilitation policies in Spain. Sustainability 2010, 2, 1571–1601. [Google Scholar] [CrossRef]
  58. Gil-Alonso, F.; Bayona-i-Carrasco, J.; Pujadas-i-Rúbies, I. From boom to crash: Spanish urban areas in a decade of change (2001–2011). Eur. Urban Reg. Stud. 2013, 23. [Google Scholar] [CrossRef]
  59. Haase, A.; Wolff, M.; Špačková, P.; Radzimski, A. Reurbanisation in Postsocialist Europe—A Comparative View of Eastern Germany, Poland, and the Czech Republic. Comp. Popul. Stud. 2017, 42, 353–390. [Google Scholar]
  60. Haase, A. Reurbanisation—An analysis of the interaction between urban and demographic change: A comparison between european cities. Die Erde 2008, 139, 309–332. [Google Scholar]
  61. Salvati, L.; Sateriano, A.; Grigoriadis, S. Crisis and the City: Profiling Urban Growth under Economic Expansion and Stagnation. Lett. Spat. Resour. Sci. 2016, 9, 329–342. [Google Scholar] [CrossRef]
Figure 1. Milan’s municipality by urban districts (hereafter ‘Nuclei di identità urbana’, NIL, identified by Milan statistical office; arrows indicate sites cited below in the article; 1:500,000 scale; map oriented toward a north-south axis).
Sustainability 10 03014 g001
Figure 2. Resident population in Milan by year, 1880–2017.
Sustainability 10 03014 g002
Figure 3. Population density in Milan municipality by urban district: (a) 1999 real data; (b) 2017 real data; (c) 2036 forecast.
Sustainability 10 03014 g003
Figure 4. Annual population growth rate (%) in Milan municipality by urban district: (a) 1999–2008 real data; (b) 2008–2017 real data; (c) 2017–2036 forecast.
Sustainability 10 03014 g004
Figure 5. Relationship between annual rates of population growth (%) in 1999–2008 and 2008–2017 in Milan urban districts.
Sustainability 10 03014 g005
Figure 6. District scores of the Principal Component Analysis: (a) Axis 1; (b) Axis 2; (c) Axis 3; (d) Axis 4.
Sustainability 10 03014 g006aSustainability 10 03014 g006b
Table 1. Global Moran′s spatial autocorrelation coefficient of population growth rate (%) by time interval.
Time Interval1 km2 km4 km8 km
1999–20081.42.3 *2.7 *2.9 *
2008–20173.6 *4.0 *4.5 *4.6 *
(* indicates significant at p < 0.01).
Table 2. Loadings of a Principal Component Analysis on axis 1 to 4.
YearAxis 1Axis 2Axis 3Axis 4
2000 0.53
20010.88
20020.56
20030.86
20040.63
2005 0.82
2006 0.66
20070.60
20080.58
20090.68
20100.69
20110.63
20120.72
2013 −0.51
2014 −0.65
20150.54
2016 −0.59
2017 0.53
Variance (%)32.715.69.98.3
Table 3. Pair-wise Pearson product moment correlation coefficients between the population growth rate (or component score) and selected background variables in Milan (only significant coefficients at p < 0.05 after Bonferroni′s correction for multiple comparisons were shown; the respective, non-parametric Spearman rank correlation coefficients were reported in brackets when significant).
VariablePopulation Growth (%)Non Parametric PCA
1999–20082008–2017Axis 1Axis 2
Population density(−0.29) −0.26(−0.34)
Distance from downtown −0.26−0.30(−0.42)(−0.27)
Per cent share of graduated(−0.41) −0.29

