Article

Assessment of Advanced Natural Ventilation Space Cooling Potential across Southern European Coastal Region

by
Nikola Pesic
1,*,
Jaime Roset Calzada
2 and
Adrian Muros Alcojor
1
1
Department of Architectural Technology, Barcelona School of Architecture (ETSAB), Polytechnic University of Catalonia (UPC), Avinguda Diagonal, 649, 08028 Barcelona, Catalonia, Spain
2
Department of Physics, Barcelona School of Architecture (ETSAB), Polytechnic University of Catalonia (UPC), Avinguda Diagonal, 649, 08028 Barcelona, Catalonia, Spain
*
Author to whom correspondence should be addressed.
Sustainability 2018, 10(9), 3029; https://doi.org/10.3390/su10093029
Submission received: 28 July 2018 / Revised: 17 August 2018 / Accepted: 24 August 2018 / Published: 26 August 2018
(This article belongs to the Special Issue Sustainability Indicators for Renewable Energy Transition)

Abstract

:
Analyzing the Köppen–Geiger climate classification and available climate data for the southern European Mediterranean coast, eight reference geolocations were selected for this analysis: the cities of Valencia, Barcelona, Marseille, Rome, Koper, Split, Athens and Nicosia. The first part of the research applies the climate potential for natural ventilation (CPNV) methodology that evaluates the theoretical availability of natural ventilation (NV) for each city location corresponding to human hygrothermal conditions. The second part of the article evaluates possible cooling energy savings (ES) applying the advanced natural ventilation (ANV) space-cooling strategy. A hypothetical four-story atrium office building model is designed for the building performance simulation (BPS) using mixed-mode (or hybrid-mode) and night-time natural ventilation (NNV) approaches. The objective is to present a comparison overview of possible space cooling ES between chosen geolocations. In the context of the current European Union’s (EU) energy transition (ET) process, the article displays ANV possibilities, as a renewable energy source (RES), in the reduction of building space cooling energy demands (ED) on the electricity grid.

1. Introduction

The world’s building sector, comprising residential and service sectors, consumes about 35% of total global final energy [1], and at the European Union (EU) level it accounts about 59% of the gross total energy demands (ED) [2]. According to the World Energy Council’s set of scenarios, world electricity demand will double to 2060, comparing to 2014 reference data. The estimation is based on the future expansion of enabling technologies and the growth of the world’s middle class with its improved standard of living [3].
Since the consideration for the environmental impact and energy efficiency (EE) arose at the world level, the EU defined action plans for managing building ED and the extended use of renewable energy resources (RES). Passive natural ventilation (NV) cooling strategies have a long tradition in vernacular architecture and today are revised according to new researches in the field of human thermal comfort (TC). Such revalorized techniques are introduced in the modern building concept in accordance with today’s normatives and so became associated with the main principles in the contemporary sustainable building design. Natural ventilative features are applied in passive and low or zero-energy buildings concepts and are characterized by the possibility to maintain the indoor TC level with entire or partial reduction of building cooling ED.
Today’s EE objectives among EU member states are decreasing progressively heating and cooling (HC) ED while expanding the distribution of RES [4]. Currently in the EU, 45% of energy for HC is used in the residential sector, 37% in industry and 18% in service sector. Each building sector has an ability to decrease ED and to increase EE and supply from RES [5]. In 2015, the EU’s share of RES in the total final ED was 16.4%, and approximately 8% was deployed for buildings HC [6,7].
The Mediterranean basin is marked by rapid urban development that has led to a heavy concentration of population across the coastal urban settlements with common over-development effect. Regarding the southern European Mediterranean coast, the most populated regions are the coastline of the Iberian Peninsula, the western Adriatic coast and the Aegean coastal region [8]. The EU member states, as developed and high-income countries, have a high level of ED with a proportionally large ecological footprint [9].
The objective of this research is to present a survey of the climatic capacity and useful data for the application of advanced natural ventilation (ANV) principles in contemporary EE building design. In this respect, eight southern European geolocations are selected along the Mediterranean coast, situated in seven EU countries (Spain, France, Italy, Slovenia, Croatia, Greece and Cyprus) and within four climate zones.
Several recent works that evaluated NV cooling possibilities are also related to the Mediterranean region. Chen et al. [10] computed NV potential in 1854 world geolocations applying the “NV hour” indicator. The work, furthermore, provides a comparison overview of energy savings (ES) for 60 of the world’s largest cities. Chiesa and Grosso [11,12] defined the “Cooling Degree Hour”, a synthetic parameter, analysing 50 reference cities across the Mediterranean region and 55 major European cities. Kolokotroni and Heiselberg [13] presented contemporary NV possibilities with an overview of a broad range of innovative techniques and evaluation tools. The publication also includes a survey of numerous reference-built projects. Pesic et al. [14] conducted an analysis for three reference geolocations on the Catalonian coastline, evaluating hygrothermal potential for generating NV principles and building space cooling ES based on the cross-ventilation approach.

2. Aspects of Energy Systems of Southern European Union (EU) Countries

2.1. Energy Balance Overview

Analysing seven EU member states that are chosen for this study, gross electricity production by fuel shows that coal power source dominates in Greece (51%) and Slovenia (21.6%) while the electricity generated from gas prevails in Italy (33.5%), Spain (17%) and Greece (13.4%) (Figure 1a). Electricity produced from nuclear power is present in France (77.5%), Slovenia (36.5%) and Spain (20.6%) [15]. Although Spain has banned construction of new nuclear reactors and those existing should be dismantled by 2022, France has plans to expand nuclear capacities in the future [16].
RES gross electricity production by energy carrier displays each member state’s EE development policy, which also largely reflects a country’s available natural resources (Figure 1b). Spain and Italy show a wide spectre of renewable energy forms while conventional hydropower remains the main RES in Slovenia (92.5%) and Croatia (90.8%) [15].

2.2. Energy Dependency and Annual Change in Final Electricity Consumption

Since 2004, the EU’s imports of energy from non-member countries have been greater than its primary production, so that in 2015 it reached a 54% dependency level [17]. Among the group of seven Mediterranean countries, the highest energy dependence level is in Cyprus (96.2%), while the levels of Spain, Italy and Greece are in the range between 70% and 80% (Figure 2a). France, Slovenia and Croatia have energy dependence rates below 50%.
In relation to the average annual change in the final ED at the country level, the highest growth rates are in Cyprus (3.4%), Spain (2.5%) and Greece (2.3%), while Croatia keeps the lowest level (0.5%) in this group of countries (Figure 2b) [18].

2.3. Space Cooling Energy Demands

Today’s buildings’ cooling and ventilation systems are mainly powered by electricity [19], and as electric air-conditioning technology prevails in the current buildings cooling market, space cooling ED are mostly hidden in the overall electricity consumption data [20]. In this regard, the gross final space cooling ED at the EU level are largely unknown so that such data mainly rely on the assumptions from related studies.
Pardo et al. [21] mapped space HC energy loads at the EU level by each building sector. The report includes analysis divided into different groups of member states with a closer look at the United Kingdom, France and Germany. Tvärne et al. [22] conducted an analysis about the district cooling market, displaying current and future estimated trends of ED. Kemna and Acedo [23] calculated space cooling loads for 28 EU members’ capital cities in order to obtain an estimated gross cooling demands at the EU level. Pezzutto et al. [24] evaluated HC demands for residential and service sectors systemizing data for two groups of countries. Person and Werner [25] presented an overview of current cooling supplies for each EU country. The report includes a comparison of gross cooling consumption with other relevant works. Werner [26] estimated annual electricity consumption for space cooling divided by the service and residential building sector for each member state. This research is based for the first time on actual measurements of cooling loads. Connolly [27] conducted an analysis calculating economic values of electricity and contrasting ED in HC sectors and electricity for each EU country. The analysis is later focused on the energy overview and peak-loads in the Czech Republic, Italy, Romania and United Kingdom.
Jakubcionis and Carlsson [28] carried out two analyses quantifying annual building space cooling loads for the residential and service sector by each EU country. The following chart displays the share of published results in the total annual electricity demands by each of seven EU countries—as minimum, average and maximum estimated annual electricity load deployed in the service sector space cooling (Figure 3a). The same article evaluated additional annual final electricity consumption for cooling of service sector buildings by each EU country. The highest increases are likely to occur in Italy (3.0 TWh/a), France (2.1 TWh/a) and Spain (1.6 TWh/a), compared to rates in Slovenia, Croatia, Greece and Cyprus which are all below 0.5 TWh/a (Figure 3b).
The electricity loads for space cooling at the EU level are constantly intensifying [29]. This refers particularly to the southern European region as a result of general comfort cooling requirements, which are additionally increased by global warming effects [30]. With regard to these facts, such growth in air-conditioning (AC) intensity during summer cooling period (in the northern hemisphere) may produce so called peak-loads in electricity network [31], which occur during day-time when the solar irradiation level is the highest [32]. Energy systems are commonly designed to meet such demands but in cases when loads are unexpectedly high, electricity generators run relatively inefficient and high-pollutant auxiliary power plants [33]. With respect to these facts, appropriate measures and methods for the reduction of buildings’ overall cooling loads should be applied with active and passive cooling strategies by increasing the overall potential for ES [34].

3. Climate Classification and Weather-Based Indexing

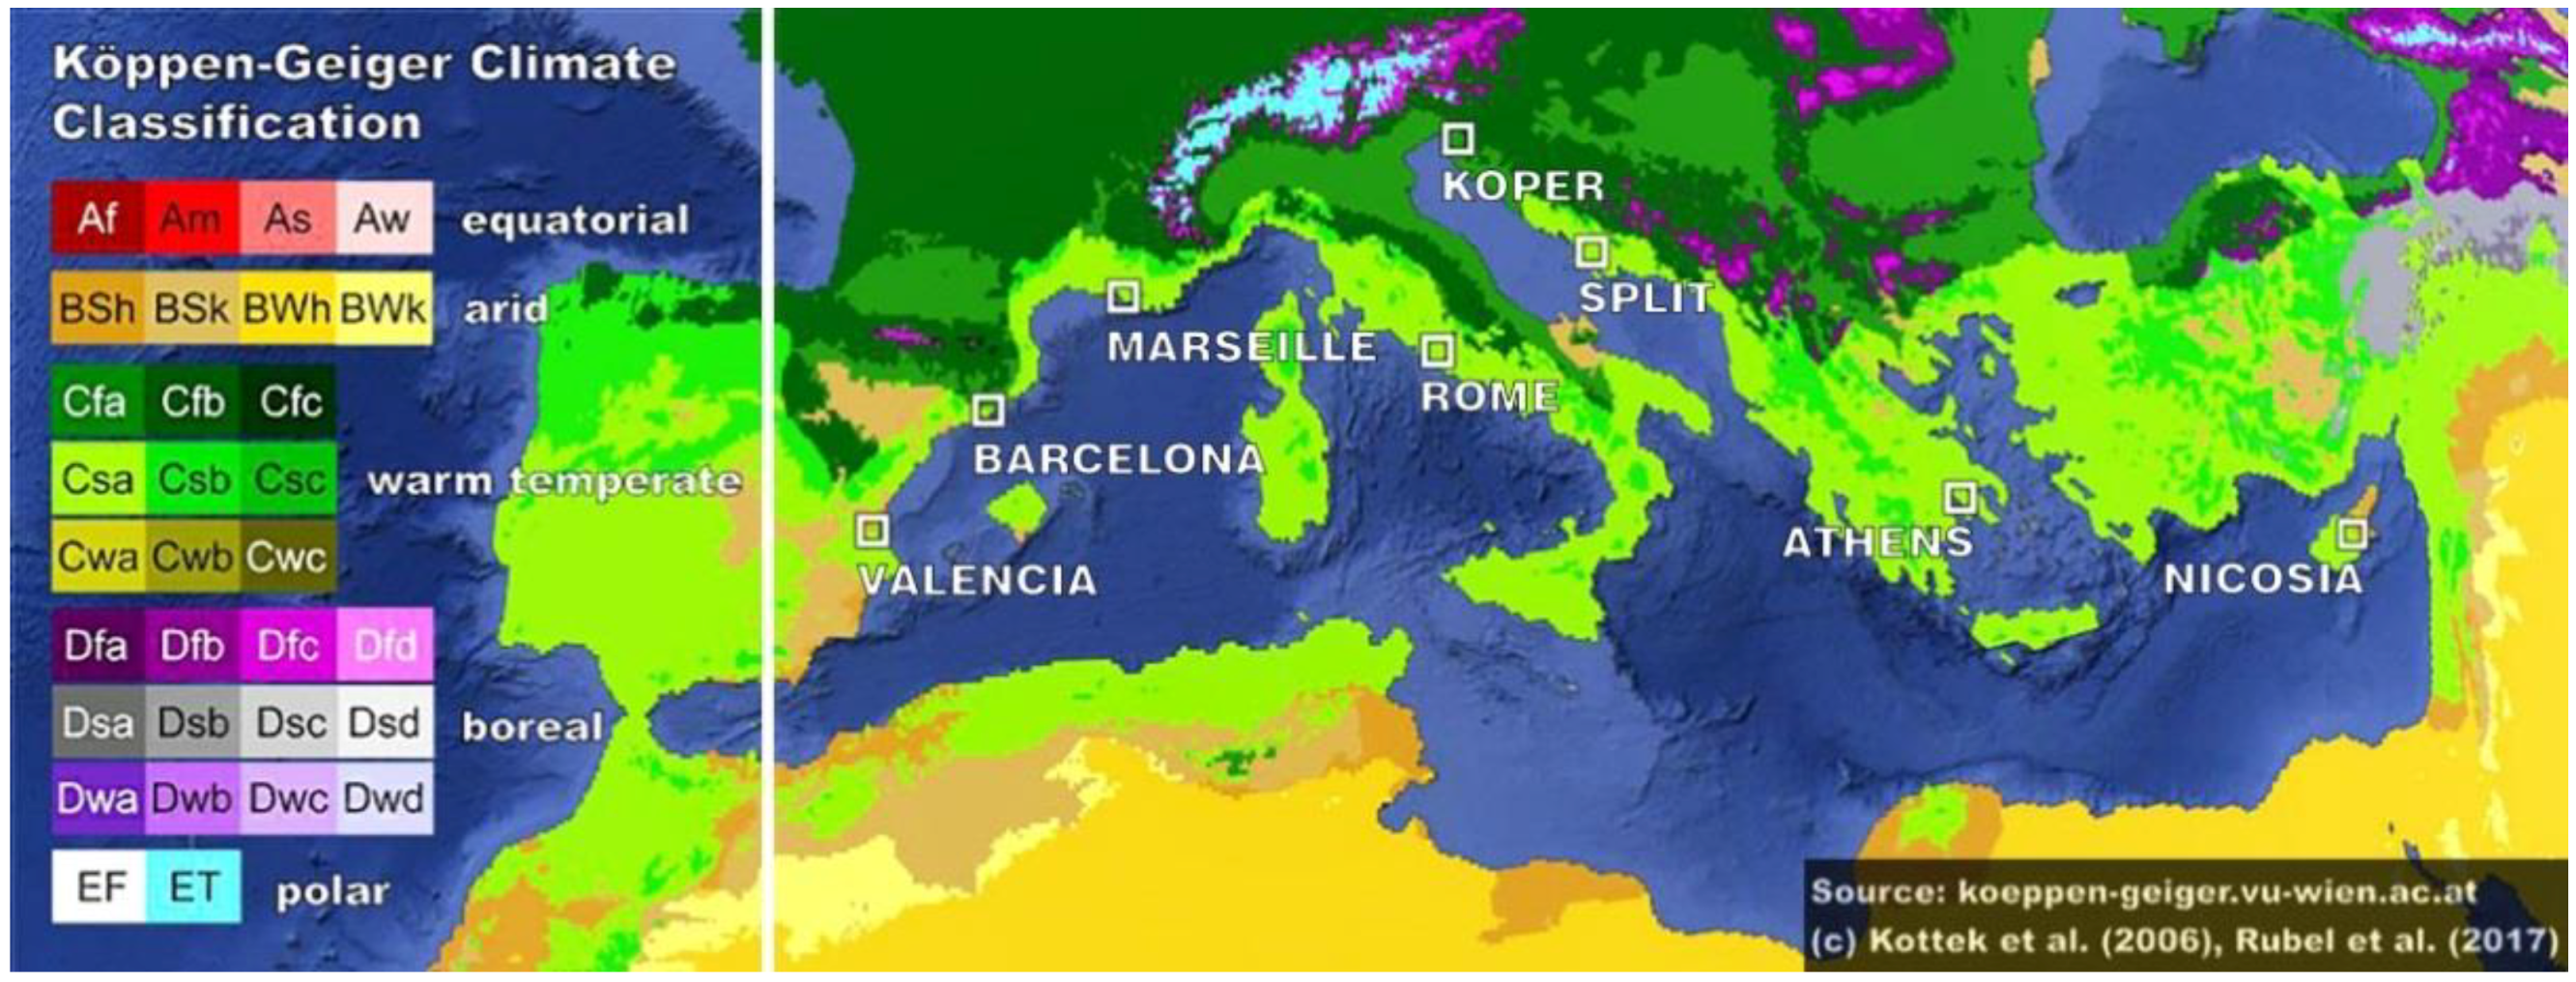
3.1. Köppen–Geiger Climate Classification

Analysing the updated Köppen–Geiger climate classification world map [35], four climate types are most represented along the northern Mediterranean coastline: “Csa” (hot-summer Mediterranean climate); “Cfa” (humid subtropical climate); “Bsh” (hot semi-arid climate); and “Bsk” (cold semi-arid climate) (Figure 4). “Csa” is the typical climate in the Mediterranean region, “Bsh” type covers isolated areas along the Iberian coastline and a large part of Cyprus, while parts affected with the inland weather conditions are identified as type “Bsk”. Mainly continental and lower mountain range areas along the coastline are classified as “Cfa”. Eight geolocations in seven EU countries are chosen for this analysis, principally as major regional port-cities: Valencia (Spain), Barcelona (Spain), Marseille (France), Rome (Italy), Koper (Slovenia), Split (Croatia), Athens (Greece) and Nicosia (Cyprus) (Figure 4, Table 1).

3.2. Cooling Degree Day (CDD)

Cooling degree day (CDD) is a weather-based technical index designed to describe the need for the cooling (air-conditioning) requirements of buildings. The calculation of CDD relies on the base temperature, defined as the highest daily mean air temperature not leading to indoor cooling (definition: EUROSTAT [36]).
The following chart displays the comparison of CDD values for the five-year period (2013–2017) by each country (Figure 5) [37]. Climate conditions in Cyprus show the highest values, followed by CDD rates for Greece, Spain and Italy.

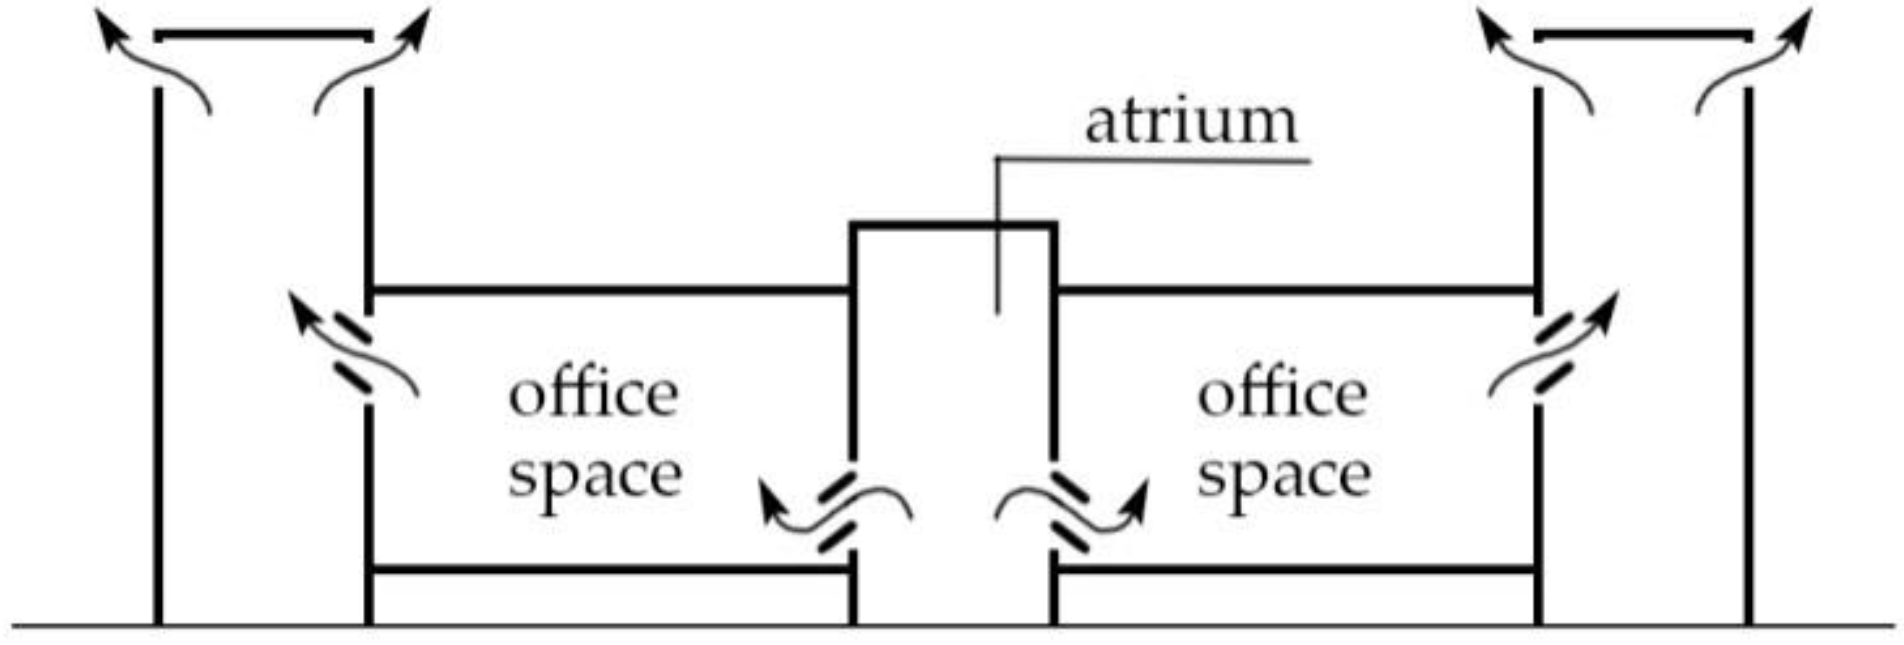
4. Advanced Natural Ventilation (ANV) Principles

Kevin J. Lomas [38] defined a class of ventilative space cooling systems as the ANV principle that is based on the air movement forced by the stack-pressure (or chimney) effect. Four different ANV forms are specified with respect to the indoor air-flow direction. This analysis evaluates a specific type named “centre-in, edge-out” (C–E) where the outdoor fresh air is introduced through a “central” distribution area, usually through an atrium or a light-well, and afterwards is drawn-out on the building perimeter, which is considered as an “edge” zone (Figure 6).
The advantages of ANV systems are that the air-flow is more stable compared to basic single-side or cross-ventilation methods that rely on the wind force and, furthermore, the uncertainty factor for maintaining the TC level is significantly lower [39]. Such a method allows generating NV in deep-plan spaces and the entire system is better protected from direct negative environmental effects, in terms of outdoor noise, air pollution etc. The ANV system is completely controlled by a building management system (BMS) in order to keep the designed levels of indoor air-quality, human TC and reduced cooling ED.

5. Natural Ventilative Space Cooling Approach in Southern Europe

According to numerous relevant studies, NV is an effective passive cooling strategy in Mediterranean vernacular architecture. Although day-time natural cooling ventilation has a limited potential due to unfavourable periods of elevated outdoor temperatures, night-time natural ventilation (NNV) can reduce interior air temperature peaks and improve overall TC by cooling down the exposed building high thermal mass structure [40]. NNV is applicable as a common cooling strategy in regions with high day-time temperature ranges and where nocturnal temperatures are not too low to overcool the indoor thermal mass [41]. Such a ventilative cooling method is especially useful for a class of office buildings that are generally vacant in the night so that elevated air-flow speeds can be generated for achieving the highest possible cooling effect [42].
For the purpose of cooling down the building’s high thermal mass during the night, an indoor flow of air can be generated by passive principles or by mechanical means, so that the cooled down structure is thermally capable of absorbing the heat gains throughout the next-day occupancy time. NNV affects indoor conditions in the following key aspects: reduction of air temperatures during the day, reduction of peak air temperatures, reduction of building structure temperature, and postponement of the peak cooling loads. [43]. Furthermore, NNV cooling potential depends primarily on: weather conditions, indoor air-flow speed, building heat capacity and the designed principle for a proper thermal convection between thermal mass and flow of air [44]. Thereby, the increased use of high thermal mass in contact with the indoor air flow is recommended which means avoiding the use of common office dropped (or suspended) ceiling type, considering its low thermal conductivity. [45].
In Mediterranean Europe, space comfort cooling is required during both summer and transition seasons. As a result of regional global warming effects, night-time passive cooling ventilation could become gradually ineffective in summer, but still can remain an efficient strategy throughout transition seasons [46]. In view of these effects, the predicted climate change temperature increase will certainly produce the unfavourable effects on the general NV capacity, particularly in July and August when certain diurnal NV cooling modes could become inefficient. It should be considered as well that one of the consequences of world climate change is the shift in the timing of seasons, so that the present-day common building cooling period could begin earlier in springtime and end later in fall (in the northern hemisphere) [13]. If during short periods of time lower TC levels are not acceptable, then running additional mechanical cooling systems is required. In this sense, the NNV space cooling approach can still be effective but as a part of hybrid ventilation system [47] that serves to cut the ED of the full mechanical cooling system [48].
Nevertheless, the computer-based BMS is considered for maintaining the calculated TC level and also for controlling the ventilation system’s operation during the building’s unoccupied period [49], ensuring that the facade opening will be performed as scheduled and according to climate conditions [13,50].
In office-type buildings that are located in warm climates, a passive cooling NNV approach combined with a mechanical cooling system is often applied, so that cooling ES are therefore relevant to consider [51]. Today, the main obstacles for implementing passive NV techniques come from legislation and norms, as only hybrid and MV systems are accepted. Still, NV-based cooling principles are feasible EE tools for the reduction of buildings’ cooling ED and CO2 emissions in the Mediterranean region [52].

6. Methodology

The first part of this analysis applies the climate potential for natural ventilation (CPNV) methodology developed by Francesco Causone (2016) [53]. Respecting local climate conditions and without taking into account the wind force, the objective of this approach is to present an assessment of the theoretical availability of NV, which can be used for both building space ventilation and cooling.
The second methodology is based on the BPS of a hypothetical office-building model and displays a comparison overview of possible annual cooling ES. For this purpose, four cooling modes are defined that are operating from April to October, which is the defined cooling period for this research.

6.1. Climate Potential for Natural Ventilation (CPNV)

The CPNV [53] is an evaluation tool that analyses weather data for a specific geolocation. The CPNV coefficient is determined by the total annual number of hours when NV can be theoretically performed ( h NV , i ), divided by the total annual number of 8760 h ( h tot ) (1).
CPNV = i = 1 n h NV , i h tot
Based on hourly weather data, two parameters are determined: the ambient temperature ( t o u t ) and the ambient humidity ratio ( W o u t ). In order that the occupants find the building indoor space acceptable from the aspect of hygrothermal comfort, the boundary values’ conditions are defined as follows—it is required that the ambient temperature value is in the range between the lower and upper acceptable indoor temperature ( t i n , l ;   t i n , u ) (2) and that the humidity ratio value is in the range between the lower and upper acceptable indoor humidity ratio rates ( W i n ,   l ;   W i n , u ) (3) (Figure 7).
t i n , l t o u t t i n , u
W i n , l W o u t W i n , u
This analysis uses the “adaptive model” of TC for 80% acceptability range, according to the ASHRAE (American Society of Heating, Refrigerating and Air-Conditioning Engineers) Standard 55-2017 [54]. Respecting this, the building lower and upper acceptable interior space temperature limits ( t l ; t u ) are calculated according to the following Equations (4) and (5):
t l = t c o m f 3.5   ° C
t u = t c o m f + 3.5   ° C
t l and t u are defined with the comfort ambient temperature ( t c o m f ) , which is determined with the following Equation (6), where the prevailing mean outdoor air temperature ( t p m a ( o u t ) ) is calculated as an arithmetic mean of seven sequential days prior to the day in question (according to ASHRAE 55-2017 standard).
t c o m f = 17.8 + 0.31 × t p m a ( o u t )
Air supply temperatures are set as follows: t i n , l limit is set at 12 °C (7), while t i n , u limit is equivalent to t u , but less than 33.5 °C, which is the highest acceptable air supply temperature (8).
t i n , l = 12   ° C
t i n , u = t u ;   t i n , u < 33.5   ° C
According to the CPNV methodology and other relevant sources, the commonly acceptable interior air relative humidity (RH) level is generally within 30% and 70%. However, CEN (Comité Européen de Normalisation) Standard EN15251 stated that the RH level has a minor effect on the human TC in “sedentary occupancy” building space type [55]. A further work about adaptive TC proposed that if higher RH levels are acceptable for NV space, in that case the interior materials and fittings should be moisture-resistant [56]. Furthermore, another research that analyses NV systems in hot and humid climates stated that the indoor upper RH limit is not required [57].
For this particular analysis, and considering that among eight selected cities the highest average RH is in Rome (75%) (Table 1), the upper RH limit ( R H u ) is set to 80% and the lower RH limit ( R H l ) is maintained at 30%.
The lower and upper humidity ratio limits ( W i n , l ;   W i n , u ) for the outdoor air supply are determined with the following Equations (9) and (10). The saturated vapor pressure ( p w s ) is a function of t l :
W i n , l = 0.621945 × p w s × 0.3 p ( p w s × 0.3 ) ;   p w s = f ( t l )
W i n , l = 0.621945 × p w s × 0.8 p ( p w s × 0.8 ) ;   p w s = f ( t l )
The following equation is considered for calculating p w s value (11):
p w s = 610.7 × 10 7.5 × t l / ( 237.3 + t l )
The 24 h day is split in two periods: the assumed work-time schedule 8:00–17:00 and the rest of the day 17:00–8:00, which is considered as the NNV operation period.

6.2. Building Performance Simulation (BPS)

6.2.1. Building Model

The BPS is carried out with DesignBuilder software [58] with the objective of simulating possible cooling ES using the ANV method in eight different reference geolocations. TC parameters are set up according to the “adaptive model” for 80% acceptability range (ASHRAE Standard-55) that allows achieving the maximum estimated level of building ES.
The BPS model represents a four-story open plan office-building with footprint dimensions 24.0 m × 24.0 m and the story height h = 4.0 m (Figure 8a). The central atrium has a full four-story height with base dimensions 5.2 m × 5.2 m. Gross floor area is 576 m2 and the total calculated office area covered with the ANV system is 2089 m2. The window area is 30%, the façade is designed as a “sealed” type and has installed an external “louvre” sun-protection system. The air leakage (or air-infiltration) is set as a constant annual value at 0.3 ac/h. Total heat gains are 50 W/m2 and calculated number of occupants is 232 (Table 2).
The interior air-flow is generated by the buoyancy effect through continuously connected building space (Figure 8b). The supply-air is introduced into the under-floor plenum and afterward is driven into the base level of the central atrium. Thereby, by the effect of atrium’s height stuck-pressure, the fresh air is distributed further through openings located just above the floor level of each of four stories. On the opposite side of the office space, on the façade plane, openings underneath the ceiling level drain warmed exhaust air through eight exterior exhausting air-shafts positioned on the building perimeter. The shafts serve the first three floors and although the top floor receives the fresh air from the central atrium, its ambient air is separately driven out through four roof top shafts. It is considered that all building ventilation openings, exterior and interior, are fully controlled by the BMS, that is to say, without any control by the occupants.
The local wind effects are not taken into consideration for this analysis. The reference AC system for the ES calculation is the variable air volume (VAV) type. The cooling system seasonal coefficient of performance (CoP) is set at 3.5 and the economizer function is switched off. The space heating operative temperature is set at 21 °C while the cooling temperature is 24 °C. The indoor humidification and dehumidification measures are not applied. The building model envelope is designed in accordance with “Passivhaus” recommendations for the “warm climate” zone with the following thermal heat transfer coefficient (U): exterior opaque envelope: U = 0.50 W/(m2K); vertical exterior glazing: U = 1.25 W/(m2K); roof glazing: U = 1.40 W/(m2K) and interior partitions: U = 0.75 W/(m2K). The flat roof is set U = 0.22 W/(m2K). The occupancy schedule is 8:00–17:00 (continuous occupancy with no lunch breaks) and the heating, ventilation and air-conditioning (HVAC) operation is 7:00–17:00 (Table 3). The ventilative cooling is set to be operational equally for all eight geolocations from April 1 to October 31, from Monday to Friday including also that the NNV mode operates every Sunday night 21:00–0:00 as the cooling process for the next-day.
As in most common BPS, the office area is modelled as an empty open space. However, for a more detailed simulation, spatial organization with office furniture disposition should be considered as it affects significantly the overall efficiency of the NV cooling process [59].

6.2.2. Ventilation Modes

Four cooling modes are programmed during the 24 h period (Table 3):
  • Full air-conditioning (FullAC) mode: set as the reference model for cooling ES calculations. The model is designed as a “sealed” office building that is completely covered with the HVAC system (without NV function). Operation is set from 7:00–17:00.
  • Day-time natural ventilation (DNV) mode: a hybrid system defined as the “concurrent mode”. AC and NV are operating parallel in the “same time and in the same space”. The NV operation is switched off when the external weather conditions are unfavourable and vice versa. The hybrid system operation is set from 7:00–17:00, while the basic NV operating time is set from 6:00–7:00.
  • Night-time natural ventilation (NNV) mode: the “night-purge” operation is a passive natural ventilative technique and is set from 21:00–7:00 (including the Sunday period from 21:00–0:00).
  • Day-time and night-time natural ventilation (DNNV) mode: combining two previous modes (DNV and NNV), it covers the day-time occupancy schedule and the night-time, set as a 20 h continuous ventilation process from 21:00–17:00 (next day), including Sunday night operation from 21:00–0:00.

6.2.3. Ceiling Types

The interior ceilings are defined as “light-weight” and “heavy-weight” types (Table 4, Figure 9). The “light-weight” model is the commonly used office-building suspended ceiling with low thermal conductivity designed for diurnal operations of FullAC and DNV modes. The “heavy-weight” or dense concrete ceiling is designed for generating thermal convection between exposed high thermal mass and the interior flow of air during the NNV and DNNV operations. Both ceiling types are with U = 0.75 W/(m2K).

7. Results

7.1. CPNV

Regarding the generated results, the heat maps can be classified in three groups. The first group is characterized in the annual periods with higher RH levels throughout a 24 h day: in Valencia it is from July to October and in Barcelona from June to October (Figure 10 and Figure 11). The results for Marseille, Rome and Koper can be considered as the second group where day-time during spring and summer is marked with favourable weather conditions for generating NV but with short intervals of elevated RH and/or elevated outdoor air temperatures (Figure 12, Figure 13 and Figure 14). The annual CPNV is reduced due to lower temperatures during winter, compared to other geolocations with milder climate conditions throughout the year. The third group is categorized by the cities of Split, Athens and Nicosia, where day-time weather conditions are unfavourable from June to September or October due to overall higher temperatures and in the case of Nicosia including higher RH levels throughout a 24 h day (Figure 15, Figure 16 and Figure 17). For the most locations, this calculated CPNV contrast between day and night periods is considerably higher from April to October (Figure 18b, Figure 19b, Figure 20b, Figure 21b, Figure 22b, Figure 23b, Figure 24b), with the exception of generally unfavourable weather conditions in Nicosia during July and August (Figure 25b). However, annual CPNV is not significantly reduced in the third group (Split, Athens and Nicosia) as the day-time NV principle is generally more available throughout spring, autumn and winter as a consequence of milder weather conditions. With the exception of Barcelona’s geolocation, all CPNV values are higher during night-time compared to the day-time rates, which is considered as a typical NV feature of the Mediterranean climate system (Figure 26).
CPNV output displays the annual theoretical availability of NV approach for each selected geolocation. In this case, the NV function is considered for both cooling and ventilation effects in the building space and the wind force is excluded in this analysis. The outcome shows that the favourable period for NV application is primarily from April to October, while the period from November to March is mainly considered for periodical space ventilation, whose availability depends on specific weather conditions for each geolocation. As previously mentioned, the exception is Nicosia, where NV can be generated throughout the year in the day-time, but with a very restrictive weather conditions from mid-June to mid-September (Figure 17).

7.2. Cooling Energy Savings

The BPS results demonstrate the differences between weather conditions in eight geolocations which are reflected in the general ANV cooling potential (Figure 27 and Figure 28). Respecting the determined cooling modes, DNV shows the lowest cooling capacity due to overall higher daily outdoor temperatures from June to August, where in the case of Split, Athens and Nicosia even higher AC loads are calculated in July and August, between +2% and +5% (Figure 27). Consequently, the overall DNV annual cooling capacity has the lowest EE level, within 6% and 30% (Figure 28). The following is NNV mode, as a passive cooling technique that can considerably reduce the building’s next-day cooling demands, between 21% and 45% at the annual level. Ultimately, the highest level of cooling ES, in the range within 22% and 52%, can be achieved combining the previous two cooling modes, that is to say with the DNNV operation.
With the focus on DNNV as the most effective cooling mode, and comparing the outputs for each city location, the ES levels can be classified in three groups (Figure 28). The highest potential of ES, between 48% and 52%, are calculated in the locations of Barcelona, Marseille, Rome and Koper. The second level is in Valencia, 41%. The third group of cities, Split, Athens and Nicosia, show the lowest EE, in the range of 22% and 28%.
The applied ventilative techniques demonstrate also the potential of reduction of building CO2 emission, which is presented as a comparison overview by each cooling mode (Figure 29).
This region is characterised with mild winter weather conditions when ANV could extend its function, namely from October to March, but that kind of ventilative systems would require a certain pre-heat process during outdoor air intake. Such a ventilative model can be analysed in future research regardless of the cooling ES. Additionally, to maintain or increase ANV cooling potential, the use of low-energy fans is recommended during the periods of absence of sufficient stack-pressure force, which can improve overall ventilation efficiency [60].

8. Conclusions

In the first part of this work, the CPNV approach has provided an overview with visualisation of annual NV availability for both space cooling and ventilation, taking into account particular weather conditions for each reference geolocation. As a preliminary design tool, the methodology is focused on the theoretical use of NV and the main hydrothermal comfort parameters are in this case relatively adapted to the Mediterranean climate.
In the second section of this research, the BPS results display that the ANV C–E form is capable in reducing the building cooling electricity consumption from April to October, with a different capacity, which is related to the particular weather conditions (Figure 27). Regarding the EE overview of analysed geolocations, the presented data outcome displays certain systems’ advantages and weaknesses. The cooling capacity of DNV has a higher efficiency during transition seasons and combined with the NNV passive cooling technique (as the DNNV mode) such a system can operate throughout the entire annual cooling period. On the other side, the disadvantageous weather conditions for the DNV function are mainly during July and August, when is the lowest ES potential that in cases of Split, Athens and Nicosia is even negligible as a result of elevated summer outdoor temperatures.
The overall output demonstrates the potential of building cooling ES using particular ANV modes based on hybrid or passive cooling approaches or a combination of both these principles. The evaluated ANV C–E form could take a part in the overall building ES together with other relevant EE techniques. The ANV C–E is a suitable cooling EE technique for the southern European coastal region and can be summarized in the following primary assessments:
  • Quality: natural ventilative principle; improved indoor environment conditions;
  • Efficiency: annual cooling ES in the range of min 6% and max 51% (Figure 28);
  • Impact: contribution in the ET process of southern European region as a RES.
Future analyses of NV principles for this region should apply the available scenarios of climate change in order to estimate EE under different weather conditions in comparison with present-day weather data. Taking into account the generated output and the Mediterranean climate conditions, consideration should also be given to a definition of a particular building type system with its spatial organization that is designed to generate NV principles efficiently based on buoyancy and/or wind-driven force for the maximum possible ES.
The summary of this research is useful for an early design stage as a preliminary valorisation of ANV use. The aim of the analysis that has been presented is to promote the application of ANV systems from currently isolated projects to a large-scale scenarios for the purpose of obtaining a more effective ES factor in the current ET process at both local member states’ and the EU level.

Author Contributions

Investigation, N.P.; Supervision, J.R.C.; A.M.A.

Funding

This research received no external funding

Conflicts of Interest

The authors declare no conflict of interest

Abbreviations

ACair-conditioning
ANVadvanced natural ventilation
ASHRAEAmerican Society of Heating, Refrigerating and Air-Conditioning Engineers
BMSbuilding management system
BPSbuilding performance simulation
CDDcooling degree day
CENComité Européen de Normalisation (European Committee for Standardization)
C–Ecentre-in, edge-out
COPcoefficient of performance
CPNVclimate potential for natural ventilation
DNNVday-time and night-time natural ventilation
DNVday-time natural ventilation
EDenergy demands
EEenergy-efficiency
ESenergy savings
ETenergy transition
EUEuropean Union
FullACfull air-conditioning
HCheating and cooling
HVACheating, ventilation and air-conditioning
MAMSLmetres above mean sea level [m]
MVmechanical ventilation
NNVnight-time natural ventilation
NVnatural ventilation
RESrenewable energy source(s)
RHrelative humidity [%]
TCthermal comfort
Uthermal heat transfer coefficient [W/(m2K)]
VAVvariable air volume

References

  1. International Energy Agency (IEA). Transition to Sustainable Buildings: Strategies and Opportunities to 2050; International Energy Agency (IEA): Paris, France, 2013.
  2. European Environment Agency (EEA). Overview of Electricity Production and Use in Europe. Figure 3: Final Energy Consumption of Electricity by Sector. European Environment Agency (EEA), 15 December 2016. Available online: https://www.eea.europa.eu/data-and-maps/indicators/overview-of-the-electricity-production-2/assessment (accessed on 26 June 2018).
  3. World Energy Council (WEC). World Energy Scenarios 2016. The Grand Transition; World Energy Council (WEC): London, UK, 2016. [Google Scholar]
  4. European Parliament; Council of the European Union. Directive 2009/28/EC of the European Parliament and of the Council of 23 April 2009 on the promotion of the use of energy from renewable sources and amending and subsequently repealing Directives 2001/77/EC and 2003/30/EC. Off. J. Eur. Union 2009, L140, 16–62. [Google Scholar]
  5. European Commission. An EU Strategy on Heating and Cooling; European Commission: Brussels, Belgium, 2016.
  6. Directorate-General for Energy, European Commission. Report from the Commission to the European Parliament, the Council, the European Economic and Social Committee and the Committee of the Regions—Renewable Energy Progress Report; Directorate-General for Energy, European Commission: Brussels, Belgium, 2017.
  7. Öko-Institut e.V. Study on Technical Assistance in Realisation of the 2016 Report on Renewable Energy, in Preparation of the Renewable Energy Package for the Period 2020–2030 in the European Union (“RES-Research”); ENER/C1/2014; Öko-Institut e.V.: Freiburg, Germany, 2017. [Google Scholar]
  8. United Nations Environment Programme/Mediterranean Action Plan (UNEP/MAP). State of the Mediterranean Marine and Coastal Environment, UNEP/MAP—Barcelona Convention; UNEP/MAP—Barcelona Convention: Athens, Greece, 2012. [Google Scholar]
  9. Global Footprint Network. Mediterranean Ecological Footprint Trends; Global Footprint Network: Chatelaine, Switzerland; Oakland, CA, USA, 2012. [Google Scholar]
  10. Chen, Y.; Tong, Z.; Malkawi, A. Investigating natural ventilation potentials across the globe: Regional and climatic variations. Build. Environ. 2017, 122, 386–396. [Google Scholar] [CrossRef]
  11. Chiesa, G.; Grosso, M. Geo-climatic applicability of natural ventilative cooling in the Mediterranean area. Energy Build. 2015, 107, 376–391. [Google Scholar] [CrossRef]
  12. Chiesa, G.; Grosso, M. Cooling potential of natural ventilation in representative climates of central and southern Europe. Int. J. Vent. 2017, 16, 84–98. [Google Scholar] [CrossRef]
  13. Kolokotroni, M.; Heiselberg, P. Ventilative Cooling. State-of-the-Art Review. IEA—EBC Programme—Annex 62 Ventilative Cooling; Department of Civil Engineering, Aalborg University: Aalborg, Denmark, 2015. [Google Scholar]
  14. Pesic, N.; Calzada, J.R.; Alcojor, A.M. Natural ventilation potential of the Mediterranean coastal region of Catalonia. Energy Build. 2018, 169, 236–244. [Google Scholar] [CrossRef]
  15. International Energy Agency (IEA). Statistics—Electricity and Heat. 2015. International Energy Agency (IEA). Available online: http://www.iea.org/statistics/statisticssearch/ (accessed on 26 June 2018).
  16. European Environment Agency (EEA). Overview of Electricity Production and Use in Europe; European Environment Agency (EEA): Copenhagen, Denmark, 2017.
  17. Statistical Office of the European Union (Eurostat). Energy Production and Imports. Statistical Office of the European Union (Eurostat). June 2017. Available online: http://ec.europa.eu/eurostat/statistics-explained/index.php/Energy_production_and_imports#More_than_half_of_EU-28_energy_needs_are_covered_by_imports (accessed on 26 June 2018).
  18. European Environment Agency (EEA). Overview of Electricity Production and Use in Europe. Figure 4: Average Annual Percentage Change in Final Electricity Consumption. European Environment Agency (EEA), 25 December 2016. Available online: https://www.eea.europa.eu/data-and-maps/indicators/overview-of-the-electricity-production-2/assessment (accessed on 26 June 2018).
  19. Directorate-General for Energy, European Commission. Mapping and Analyses of the Current and Future (2020–2030) Heating/Cooling Fuel Deployment (Fossil/Renewables); Directorate-General for Energy, European Commission: Brussels, Belgium, 2016.
  20. Kenkmann, T.; Bürger, V. Contribution of Renewable Cooling to the Renewable Energy Target of the EU (Policy Report); Öeko-Institut e.V.: Freiburg, Germany, 2012. [Google Scholar]
  21. Garcia, N.P.; Vatopoulos, K.; Krook-Riekkola, A.; Rivera, J.A.M.; Lopez, A.P. Heat and Cooling Demand and Market Perspective; Publication Office of the European Union: Luxembourg, 2012. [Google Scholar]
  22. Swedblom, M.; Tvärne, A.; Frohm, H.; Rubenhag, A. Renewable Smart Cooling for Urban Europe (RESCUE). District Cooling Customer Measurement Analysis Verification of and ECI for Market Assessment; Rescue WP2.1 Report; Capital Cooling Energy Service AB: Stockholm, Sweden, 2014. [Google Scholar]
  23. Kemna, R.; Acedo, J.M. Average EU Building Heat Load for HVAC Equipment; Van Holsteijn en Kemna B.V. (VHK): Delft, The Netherlands, 2014. [Google Scholar]
  24. Pezzutto, S.; Toleikyte, A.; De Felice, M. Assessment of the Space Heating and Cooling Market in the EU28: A Comparison between EU15 and EU13 Member States. Int. J. Contemp. Energy 2015, 1. [Google Scholar] [CrossRef]
  25. Persson, U.; Werner, S. STRATEGO Work Package 2. Background Report 4. Quantifying the Heating and Cooling Demand in Europe; Halmstad Univesity: Halmstad, Sweden, 2015. [Google Scholar]
  26. Werner, S. European space cooling demands. Energy 2016, 110, 148–156. [Google Scholar] [CrossRef]
  27. Connolly, D. Heat Roadmap Europe: Quantitative comparison between the electricity, heating, and cooling sectors for different European countries. Energy 2017, 193, 580–593. [Google Scholar] [CrossRef]
  28. Jakubcionis, M.; Carlsson, J. Estimation of European Union service sector space cooling potential. Energy Policy 2018, 113, 223–231. [Google Scholar] [CrossRef]
  29. Euroheat & Power. Ecoheatcool Work Package 2. The European Cold Market; Final Report; Euroheat & Power: Brussels, Belgium, 2006. [Google Scholar]
  30. Kalz, D.E.; Pfafferott, J. Thermal Comfort and Energy-Efficient Cooling of Nonresidential Buildings; Springer: London, UK, 2014. [Google Scholar]
  31. European Environment Agency (EEA). Heating and Cooling Degree Days. Indicator Assessment. Data and Maps; European Environment Agency (EEA): Copenhagen, Denmark, 2016.
  32. Jakubcionis, M.; Carlsson, J. Estimation of European Union residential sector space cooling potential. Energy Policy 2017, 101, 225–235. [Google Scholar] [CrossRef]
  33. Wenz, L.; Levermann, A.; Auffhammer, M. North–south polarization of European electricity consumption under future warming. Proc. Natl. Acad. Sci. USA 2017, 114, E7910–E7918. [Google Scholar] [CrossRef] [PubMed]
  34. Staller, H.; Tisch, A. New Technical Solutions for Energy Efficient Buildings. State of the Art Report. Innovative Cooling Concepts for Office Buildings; SCI-Network: Freiburg, Germany, 2011. [Google Scholar]
  35. Kottek, M.; Grieser, J.; Beck, C.; Rudolf, B.; Rubel, F. World Map of the Köppen-Geiger Climate Classification Updated. High Resolution Map and Data (Version March 2017). KMZ File for Google Earth (High Res): Global_1986-2010_KG_5m.kmz. Climate Change and Infectious Diseases Group, Institute for Veterinary Public Health, University of Veterinary Medicine Vienna. March 2017. Available online: http://koeppen-geiger.vu-wien.ac.at/present.htm (accessed on 26 June 2018).
  36. Statistical Office of the European Union (EUROSTAT). Energy Statistics—Cooling and Heating Degree Days (nrg_chdd). Reference Metadata in Euro SDMX Metadata Structure (ESMS). Statistical Office of the European Union (EUROSTAT), 16 October 2017. Available online: http://ec.europa.eu/eurostat/cache/metadata/en/nrg_chdd_esms.htm (accessed on 26 June 2018).
  37. Statistical Office of the European Union (EUROSTAT). Cooling and Heating Degree Days by Country—Annual Data. Statistical Office of the European Union (EUROSTAT), 19 February 2018. Available online: http://appsso.eurostat.ec.europa.eu/nui/submitViewTableAction.do (accessed on 26 June 2018).
  38. Lomas, K.J. Architectural design of an advanced naturally ventilated building form. Energy Build. 2007, 39, 166–181. [Google Scholar] [CrossRef]
  39. Breesch, H.; Janssens, A. Performance evaluation of passive cooling in office buildings based on uncertainty and sensitivity analysis. Sol. Energy 2010, 84, 1453–1467. [Google Scholar] [CrossRef]
  40. Michael, A.; Demosthenous, D.; Philokyprou, M. Natural ventilation for cooling in mediterranean climate: A case research in vernacular architecture of Cyprus. Energy Build. 2017, 144, 333–345. [Google Scholar] [CrossRef]
  41. Santamouris, M.; Wouters, P. (Eds.) Ventilation for Comfort and Cooling: The State of the Art. In Building Ventilation. The State of the Art; Earthscan: London, UK; Sterling, VA, USA, 2006; pp. 217–235. [Google Scholar]
  42. Kolokotroni, M.; Webb, B.C.; Hayes, S.D. Summer cooling with night ventilation for office buildings in moderate climates. Energy Build. 1998, 27, 231–237. [Google Scholar] [CrossRef]
  43. Kolokotroni, M.; Aronis, A. Cooling-energy reduction in air-conditioned offices by using night ventilation. Appl. Energy 1999, 63, 241–253. [Google Scholar] [CrossRef]
  44. Santamouris, M.; Sfakianaki, A.; Pavlou, K. On the efficiency of night ventilation techniques applied to residential buildings. Energy Build. 2010, 42, 1309–1313. [Google Scholar] [CrossRef]
  45. Artmann, N.; Manz, H.; Heiselberg, P. Parameter research on performance of building cooling by night-time ventilation. Renew. Energy 2008, 33, 2589–2598. [Google Scholar] [CrossRef]
  46. Artmann, N.; Gyalistras, D.; Manz, H.; Heiselberg, P. Impact of climate warming on passive night cooling potential. Build. Res. Inf. 2008, 36, 111–128. [Google Scholar] [CrossRef]
  47. Artmann, N.; Manz, H.; Heiselberg, P. Climatic potential for passive cooling of buildings by night-time ventilation in present and future climates in Europe. Appl. Energy 2007, 84, 187–201. [Google Scholar] [CrossRef]
  48. Artmann, N.; Manz, H.; Heiselberg, P. Potential for passive cooling of buildings by night-time ventilation in present and future climates in Europe. In Proceedings of the PLEA2006 23rd Conference on Passive and Low Energy Architecture, Geneva, Switzerland, 6–8 September 2006. [Google Scholar]
  49. Heiselberg, P. Design of Natural and Hybrid Ventilation; Department of Civil Engineering, Aalborg University: Aalborg, Denmark, 2006. [Google Scholar]
  50. Santamouris, M.; Kolokotsa, D. Passive cooling dissipation techniques for buildings and other structures: The state of the art. Energy Build. 2013, 57, 74–94. [Google Scholar] [CrossRef]
  51. Ramponi, R.; Angelotti, A.; Blocken, B. Energy saving potential of night ventilation: Sensitivity to pressure coefficients for different European climates. Appl. Energy 2014, 123, 185–195. [Google Scholar] [CrossRef]
  52. Mora-Pérez, M.; Guillen-Guillamón, I.; López-Patiño, G.; López-Jiménez, P.A. Natural Ventilation Building Design Approach in Mediterranean Regions. A Case Research at the Valencian Coastal Regional Scale (Spain). Sustainability 2016, 8, 855. [Google Scholar] [CrossRef]
  53. Causone, F. Climatic Potential for Natural Ventilation (CPNV). Archit. Sci. Rev. 2016, 59, 212–228. [Google Scholar] [CrossRef]
  54. American Society of Heating, Refrigerating and Air-Conditioning Engineers (ASHRAE). ANSI/ASHRAE Standard 55-2017. Thermal Environmental Conditions for Human Occupancy; American Society of Heating, Refrigerating and Air-Conditioning Engineers (ASHRAE): Atlanta, GA, USA, 2017. [Google Scholar]
  55. Comité Européen de Normalisation (CEN). CEN Standard EN15251: Indoor Environmental Input Parameters for Design and Assessment of Energy Performance of Buildings—Addressing Indoor Air Quality, Thermal Environment, Lighting and Acoustics; Comité Européen de Normalisation (CEN): Brussels, Belgium, 2007. [Google Scholar]
  56. Emmerich, S.J.; Polidoro, B.; Axley, J.W. Impact of adaptive thermal comfort on climatic suitability of natural ventilation. Energy Build. 2011, 43, 2101–2107. [Google Scholar] [CrossRef]
  57. Toe, D.H.C.; Kubota, T. Development of an adaptive thermal comfort equation for naturally ventilated buildings in hot–humid climates using ASHRAE RP-884 database. Front. Archit. Res. 2013, 2, 278–291. [Google Scholar] [CrossRef]
  58. DesignBuilder Software Ltd. DesignBuilder v5.4. DesignBuilder Software Ltd.. 7 September 2016. Available online: https://www.designbuilder.co.uk (accessed on 26 June 2018).
  59. Artmann, N.; Rasmus Jensen, L.; Manz, H.; Heiselberg, P. Experimental investigation of heat transfer during night-time ventilation. Energy Build. 2010, 42, 366–374. [Google Scholar] [CrossRef]
  60. Loftness, V.; Haase, D. (Eds.) Donald Watson: Bioclimatic Design de Sustainable Built Environments; Springer: New York, NY, USA, 2013; pp. 1–31. [Google Scholar]
Figure 1. (a) Gross electricity production by fuel, by country (source: International Energy Agency—IEA, year 2014 data); (b) Gross renewable energy sources (RES), by country (source: International Energy Agency—IEA, year 2014 data).
Sustainability 10 03029 g001
Figure 2. (a) Energy dependence, by country (source: Statistical office of the European Union—EUROSTAT, year 2016 data); (b) average annual percentage change in final electricity consumption, by country (source: European Environment Agency—EEA, year 2014 data).
Sustainability 10 03029 g002
Figure 3. (a) Estimated service sector annual space cooling demands (%)—minimum, average and maximum value, in total annual electricity demand, by country (data sources: M. Jakubcionis, J. Carlsson. 2018. “Estimation of European Union service sector space cooling potential”; Energy Policy; International Energy Agency—IEA, year 2014 data, chart generated by author); (b) estimated additional final electricity for space cooling of the building service sector, by country (data source: M. Jakubcionis, J. Carlsson. 2018. “Estimation of European Union service sector space cooling potential”, chart generated by author).
Sustainability 10 03029 g003
Figure 4. Geographical map of Mediterranean region with Köppen–Geiger climate classification (source: Kottek, M., J. Grieser, C. Beck, B. Rudolf, and F. Rubel. 2006. “World Map of the Köppen-Geiger climate classification updated”. Meteorol. Z., no. 15: 259–263; map “High-resolution map and data (version March 2017)”; image generated by “Google Earth” software, adapted image, with authors’ permission).
Sustainability 10 03029 g004
Figure 5. Cooling degree day (CDD) values for five year period (2013–2017), by country (source: Statistical office of the European Union—EUROSTAT, year 2013–2017 data).
Sustainability 10 03029 g005
Figure 6. Advanced natural ventilation (ANV) principle—schematic diagram of stack ventilation form “centre-in, edge-out” (C–E).
Sustainability 10 03029 g006
Figure 7. The boundary conditions: time of year subdivided in nine areas according to temperature and humidity ratio thresholds (source: “Climate Potential for Natural Ventilation (CPNV)”, Francesco Causone, 2016; adapted image, with author’s permission).
Sustainability 10 03029 g007
Figure 8. (a) DesignBuilder building performance simulation (BPS) model; (b) ANV air-flow directions, building cross-section.
Sustainability 10 03029 g008
Figure 9. Schematic presentation of ceiling types, cross-section: (a) “light-weight” suspended ceiling; (b) “heavy-weight” exposed concrete ceiling, thermal exchange process during NV operation.
Sustainability 10 03029 g009
Figure 10. Valencia: annual climate “heat-map” and CPNV results.
Sustainability 10 03029 g010
Figure 11. Barcelona: annual climate “heat-map” and CPNV results.
Sustainability 10 03029 g011
Figure 12. Marseille: annual climate “heat-map” and CPNV results.
Sustainability 10 03029 g012
Figure 13. Rome: annual climate “heat-map” and CPNV results.
Sustainability 10 03029 g013
Figure 14. Koper: annual climate “heat-map” and CPNV results.
Sustainability 10 03029 g014
Figure 15. Split: annual climate “heat-map” and CPNV results.
Sustainability 10 03029 g015
Figure 16. Athens: annual climate “heat-map” and CPNV results.
Sustainability 10 03029 g016
Figure 17. Nicosia: annual climate “heat-map” and CPNV results.
Sustainability 10 03029 g017
Figure 18. Valencia: (a) annual boundary conditions; (b) monthly NV availability.
Sustainability 10 03029 g018
Figure 19. Barcelona: (a) annual boundary conditions; (b) monthly NV availability.
Sustainability 10 03029 g019
Figure 20. Marseille: (a) annual boundary conditions; (b) monthly NV availability.
Sustainability 10 03029 g020
Figure 21. Rome (a) annual boundary conditions; (b) monthly NV availability.
Sustainability 10 03029 g021
Figure 22. Koper: (a) annual boundary conditions; (b) monthly NV availability.
Sustainability 10 03029 g022
Figure 23. Split: (a) annual boundary conditions; (b) monthly NV availability.
Sustainability 10 03029 g023
Figure 24. Athens: (a) annual boundary conditions; (b) monthly NV availability.
Sustainability 10 03029 g024
Figure 25. Nicosia: (a) annual boundary conditions; (b) monthly NV availability.
Sustainability 10 03029 g025
Figure 26. Comparison of annual CPNV values by city for periods of day: 0:00–24:00, 8:00–17:00 and 17:00–8:00.
Sustainability 10 03029 g026
Figure 27. Cooling energy: monthly demands (Wh/m2), monthly ES, period April–October (%), total demands (kWh/m2) and total ES (%) during the ANV cooling period April–October.
Sustainability 10 03029 g027
Figure 28. Comparison of total cooling energy savings (ES) (%) by each city and by each ANV mode: cooling period April–October.
Sustainability 10 03029 g028
Figure 29. Comparison of building total annual CO2 production (kg/m2), by ventilation mode.
Sustainability 10 03029 g029
Table 1. Data for eight reference geolocations: city, country, population number, climate classification, average metres above mean sea level (MAMSL), annual average climate data: dry-bulb temperature (low, average, high), relative humidity (low, average, high).
CityCountryPopulationClimate ZoneAvg. MAMSL
(m)
Average Annual Climate Data
Dry Bulb Temperature (°C)Relative Humidity (%)
LowAvg.HighLowAvg.High
ValenciaSpain787,808Bsk1612.617.322.2476888
BarcelonaSpain1,620,809Csa1311.915.719.7567490
MarseilleFrance855,393Csa1211.515.619.9476585
RomeItaly2,873,494Csa3710.715.320.4527592
KoperSlovenia47,539Cfa911.014.718.6446684
SplitCroatia176,314Csa014.117.019.9425774
AthensGreece3,090,508Csa17014.217.921.7476177
NicosiaCyprus306,379Csa/Bsk22015.519.924.5466687
Table 2. Main Designbuilder BPS model parameters.
Footprint dim:24 m × 24 mHeating temp.:21 °COccupancy:8:00–17:00
Floor-to-floor:h = 4 mCooling temp.:24 °CHeating, ventilation and
air-conditioning (HVAC) syst.:
7:00–17:00
Gross area:2089 m2Economizer:OffDaily natural ventilation (NV):6:00–17:00
MV fresh air:10 L/s per p.Hum./Dehum.:OffNight NV (NNV):21:00–7:00
Table 3. Occupancy schedule and ventilation mode operations during the 24 h period.
(hour)123456789101112131415161718192021222324(hour)
occup. occup.
FullAC FullAC
DNV DNV
NNV NNV
DNNV DNNV
occupancy HVAC NV+HVAC NV
Table 4. Building model ceiling types according to cooling ventilative operation modes.
“Light-weight” Ceiling
Suspended Office Ceiling Type
Cooling Modes: Full air-conditioning (FullAC) or day-time natural ventilation (DNV)
“Heavy-Weight” Ceiling
Exposed High-Density Concrete Ceiling Type
Cooling Modes: NNV or day-time and night-time natural ventilation (DNNV)
-plastic tiles d = 3 mm; cement screed d = 7 cm; XPS (extruded polystyrene) d = 20 mm; standard cast concrete d=20 cm (density: ρ = 1.200 kg/m3); air space h = 30 cm; suspended ceiling d = 12.5 mm-plastic tiles d = 3 mm; cement screed d = 7 cm; XPS (extruded polystyrene) d = 30 mm; heavy weight cast concrete d = 20 cm (density: ρ = 2.100 kg/ m3)

