Article

Performance Indicators Framework for Assessment of a Sanitary Sewer System Using the Analytic Hierarchy Process (AHP)

Department of Civil and Environmental Engineering, Chung-Ang University, 84 Heukseok-ro, Dongjak-gu, Seoul 06974, Korea
*
Authors to whom correspondence should be addressed.
Sustainability 2019, 11(10), 2746; https://doi.org/10.3390/su11102746
Submission received: 25 March 2019 / Revised: 30 April 2019 / Accepted: 1 May 2019 / Published: 14 May 2019
(This article belongs to the Section Environmental Sustainability and Applications)

Abstract

:
In this study, performance indicators (PIs) for assessing services of the sanitary sewer system in South Korea were evaluated based on general opinions collected from experts in the field. The analytic hierarchy process (AHP) was then carried out. The evaluated set of PIs consisted of five major criteria: management, operation and maintenance, service, environment, and finance. Using the experts’ survey incorporated into the AHP tool, the prioritization of the five criteria was performed, consisting of a total of 14 indicators and 34 checklists on three levels. Of the criteria groups, operation and maintenance was found to be the most important indicator, comprising 43% of all the scores. The AHP results showed that, of the 34 checklists, 13 indicators were explained as candidates of key PIs: on-the-job training and work role and responsibility from management, sewer condition inspection, pump, sewer maintenance, flow rate/water quality/odor monitoring from operation and maintenance, complaint resolution from service, inflow volume from environment, and operational cost in annual expenditures from finance. The PIs developed in this study are expected to be used by stakeholders involved in the provision of sewer services, such as undertaking companies, policy-making bodies, and financing agencies.

1. Introduction

Sanitary sewer systems (SSSs) are designed to collect and transport domestic, commercial, and industrial wastewater, and limited amounts of stormwater to a wastewater treatment plant. Sanitary sewers, also often called separate sewers, are different from combined sewer systems (CSSs), which transport domestic and industrial wastewater and stormwater runoff in the same sewer to treatment facilities. In contrast, in SSSs, wastewater and stormwater are collected and transported in separate pipes.
A standardized performance assessment for wastewater services was established by Matos et al. [1], based on a system of performance indicators (PIs) that cover all fundamental tasks of wastewater and sewerage services. Various international organizations, such as the International Water Association (IWA) [1], International Benchmarking Network for Water and Sanitation Utilities—World Bank (IBNET) [2], the Office of Water Services (OFWAT) [3], United States Environmental Protection Agency (US EPA) [4], and the American Water Works Association (AWWA) [5], have proposed different PIs covering all the fundamental tasks of wastewater systems. Other working groups in several countries have also proposed PIs that reflect the chief aspects of the management of a water and sewerage service [6,7,8,9]. In those systems, PIs to assess the performance of wastewater services were categorized into different groups depending on service attributes (e.g., environmental, physical, personal, operational, financial performance, reliability, and availability).
In South Korea, improvement of outdated sewer systems began in the 1970s in urban areas, while nationwide sewer system networks started to be installed in the 1980s. Currently, the domestic distribution rate of sewer systems in Korea is 93% of the population according to the 2014 Sewage Statistics [10], of which separate sewers account for 44% and combined sewer systems account for 56%. However, increased combined sewer overflows (CSOs) and subsequent contamination of water bodies due to discharges of untreated sewage, and decreases in the efficiency of wastewater services, have motivated public agencies to changes of CSSs toward SSSs.
Meanwhile, sewage services, from the collection to the discharge of treated wastewater, have mostly been constructed in the form of build-transfer-lease (BTL) projects, as a public and private partnership (PPP), in which the private partner constructs the facilities and transfers its ownership to the government at the completion time of construction projects. The private company, as concessionaire, has the right to operate the facility and receives government payments (including a lease payment and the operational cost) based on its operational performance for a specified period of time. Since 2006, for performance evaluation of sewer services, the Korean Ministry of Environment (MOE) has been using the BTL-focused PIs framework that consists of four categories (management, operation, maintenance, and quality of service) and a total of 149 evaluation checklists. However, the effectiveness and efficiency of the current set of PIs have been continually questioned because the existing PIs have too many checklists, some of which are redundant and insufficient to provide quantitative information on current performance. Furthermore, the current PIs do not cover all aspects and measures of the sustainability of sewer services.
In recent years, a growing number of studies focusing on sustainability indicators, i.e., indicators that cover the social, environmental, and economic aspects of water supply and wastewater service to ensure long-term service, have been performed [11,12,13,14,15]. Climate change is one of the important factors affecting the sustainable sewer service system. Zhou [16] stated that the volumes and patterns of precipitation would significantly affect the urban drainage system. Frequent and unexpected heavy rainfall can cause deterioration of a sewer due to failure of the sewer service and subsequent overflows. Also, climate changes can lead to changes in patterns of water consumption, especially in extended hot weather seasons [17]. In addition, changes to the population structure due to population decline should be taken into consideration when planning the sewer service, and assessing its future performance. According to the Population Projections for Korea 2015–2065 [18], the population of South Korea is expected to begin to continually decrease from 53 million in 2031 to 43 million in 2065, and the senior population (those above the age 65) will be over 10 million in 2025 (6.5 million in 2015) [18]. Changes in population size and structure (i.e., the shift towards an aged society) result in changes to rates and billing in sewer services. Reduced sewer consumption rates may lead to reduced investments for sewer maintenance and low quality of service in contrast to the increased demand for sewer services. Hence, several suggestions have been made that sewer services should be evaluated collectively according to technical, environmental, and socio-economic factors [13,19,20].
Considering the abovementioned issues, the existing PIs used in Korea would not be appropriate to reflect the variations caused by climate changes or change in population size because these were not considered at the point of development. Therefore, a new set of PIs needs to be developed for assessing the performance of sewer service systems appropriate for future domestic situations. Therefore, the objectives of this study are mainly (1) to develop a system of PIs for sanitary sewer systems suitable for domestic situations, and (2) to propose a set of key performance indicators (KPIs) for the performance evaluation of SSSs.

2. Research Methodology

2.1. Selection Criteria of Performance Indicators

As aforementioned in the introduction, in South Korea, a set of the existing PIs for sewer services is made up of four criteria: management, operation, maintenance, and quality of service. This set of PIs does not consider the effect of environmental pollution by sewer service failures or contamination accidents, such as sanitary sewer overflows. Indicators to evaluate financial sustainability are also included based on the literature survey, such as the IWA and AWWA frameworks and the pre-query by experts in undertaking companies in the field. Thus, the PIs for performance evaluation of SSSs have a hierarchical structure with four levels (i.e., main category, main group, sub-group, and calculation level) according to their thematic categories, as displayed in Figure 1. In this section, we only explain about three levels, and in the next section (Section 4) for KPIs.
Main category (level 1): this is the first layer of indicators and consists of the five main categories: management, operation and maintenance, service, environment, and finance. The composition of level 1 is defined as below (A1 to A5).
  • Management indicators (A1): evaluate the efficiency and effectiveness of personnel undertaking management activities for long-term sewer services; these indicators include functions, qualifications, and safety training.
  • Operation and maintenance indicators (A2): are used for assessment the performance of the undertaking related to the operation activities and maintenance programs for SSSs.
  • Service indicators (A3): determine the level of services provided to customers as well as customer satisfaction. Information on the sewer service and responses to complaints are measured to ensure quality of service.
  • Environmental indicators (A4): evaluate the performance of the sewer undertaking regarding environmental impacts, including sanitary sewer overflows and infiltration/inflow. The compliance with wastewater discharge standards and regulations is also assessed.
  • Financial indicators (A5): assess the financial status of the undertaking company, as well as the financial effort (such as reinvestment rate for a sewer system) to maintain the service life of the infrastructures.
Groups (level 2): this is the second layer of indicators that are distinguished by the major tasks in the upper level. In this study, a total of 14 indicators are separately contained in level 1, and each category in level 1 contains two to four working tasks groups.
Sub-groups (level 3): these contain 34 indicators to check the detail activities in terms of how they should be performed; each indicator assigns points to qualitatively and quantitatively evaluate the sewer service performance. Each group in level 2 contains one to four specific activities, resulting in 34 indicators in level 3.
Calculation level (level 4): this level includes the unit and measurement concept for each indicator, and provides a numeric expression for every PI.

2.2. Design of Survey Questionnaire for Experts’ Opinion

Subsequent to reviewing the literature and cases of PIs developed by international groups, a draft framework of PIs was initially prepared and sent to sewer service experts in multi-stakeholder forums to request identification of any problems that may arise as well as revisions reflecting domestic situations that do not necessarily fit other PIs, such as IWA or US EPA. Based on their feedback, the criteria and indicators in the draft framework were finalized and an online survey form was prepared in Google that was then distributed to various experts in sewer service companies. The panel of experts, consisting of engineers and managers with more than seven years of work experience in the field, were asked to provide their knowledge-based judgement on the questionnaire. A total of 45 responses were obtained from the 100 surveys sent, and the collected input data were used for analytic hierarchy process (AHP) implementation.

2.3. AHP Procedures

The analytic hierarchy process (AHP), introduced by Thomas Saaty (1980), is one of the most popular multiple-criteria decision-making (MCDM) tools for formulating and analyzing decisions. It can assist the decision-maker to set priorities and make the best decisions [21]. Based on a pairwise comparison, AHP can be described based on three principles, namely, decomposition, comparative judgement, and synthesis of priorities [22]. The advantage of using AHP is its ability to integrate the quantitative and qualitative factors obtained through experts’ opinions and categorize them into a multi-criteria ranking. The AHP is also flexible, has intuitive appeal to decision-makers, and the ability to judge inconsistencies. The AHP supports the capture of subjective and objective evaluation measures that are easy to use and are scalable. However, the AHP has several weaknesses, including problems due to the interdependence between the criteria and alternatives, inconsistencies between judgment and ranking criteria, and rank reversal. The application of AHP to a decision problem incorporates the following steps.

2.3.1. Step 1. Defining the Problem and Determining Its Goal

This step involves defining the decision problem and then determining the goal through AHP implementation. In the present study, the goal is to develop PIs for assessing a sanitary sewer system.

2.3.2. Step 2. Structuring the Decision Problem into the Hierarchy

In this step, the decision problem is decomposed from the top level to the next lower level (intermediate through to the lowest levels). The topmost level, i.e., the goal or the objective of the problem, is decomposed into the subsequent intermediate upper levels depending on the criteria. The lowest level usually contains the list of alternatives. In our study, five criteria (management, operation and maintenance, service, environment, and finance) have been chosen to evaluate the performance of the sanitary sewer system. Each of the five criteria is then further decomposed into decision alternatives (Table 1). Management (A1) consists of the three major groups (M1 to M3), i.e., ‘Laws, Regulations, and Required Manuals’, ‘Organizational Structure’, and ‘Employee Education and Training’. Operation and Maintenance (A2) is decomposed into ‘Operational Monitoring and Inspection (OM1)’ ‘Sewer System Maintenance (OM2)’, ‘Information Communication Facility Maintenance (OM3)’, and ‘Supplies and Equipment Maintenance (OM4)’. Service (A3) has two lower groups (S1 and S2), i.e., ‘Sewer Service Information’ and ‘Complaint and Response’. In the Environment (A4) criteria, ‘Sanitary Sewer Overflows (E1)’ and ‘Infiltration/Inflow (E2)’ are included in a major group. Finance (A5) comprises ‘Financial Soundness (F1)’, ‘Operation Service Cost (F2)’, and ‘Capital Investment Plan (F3)’. In the third level (Level 3), 34 indicators, labeled from C1 to C34, were constructed.

2.3.3. Step 3. Making Pairwise Comparisons and Obtaining the Judgmental Matrix

After arranging the problem and structuring it in hierarchical terms, the extent to which the different elements on one level influence those on the next higher level is determined. Thus, the elements of a particular level are compared with respect to a specific element, and the importance of each element in each level is assessed with respect to its upper (parent) level by pairwise comparisons between peer elements. In order to make the pairwise comparison, experts are asked to select one of two elements according to a scale that indicates the degree to which one element is more important, preferred, or dominant (Table S1). Saaty [23] stated that a nine-point scale could be sufficient to distinguish between two elements. Nine-point scales are explained in Table S1. Usually, an element that receives a higher rating is viewed as more important (or more critical) than an element that receives a lower rating. Each entry, aij of the pairwise comparison matrix is governed by the three rules: aij > 0, aij = 1/aji, and aii = 1 for all i. Thus, the diagonal values of the matrix are always ‘1’, and the values of aij are reciprocals of aji.
Table 2 displays the pairwise comparison matrix for the selection of importance of elements in the uppermost level (i.e., criteria), and a total of 18 pairwise comparison matrices were obtained in this study since the hierarchy is structured with five criteria (level 1), 14 major groups (level 2), and 34 sub-groups (level 3). Each entry is the input data obtained from the geometric mean calculated from the responses of 45 experts. For example, in the preferential selection between A1 (management) and A2 (operation and maintenance) criteria, the value of 3.153 was entered in the position of a21. This indicates that the experts deemed that the activities in regard to ‘operation and maintenance’ were moderately more important than those of ‘management’ for the successful performance of sanitary sewer system services. Meanwhile, the reciprocal of the value in a21 was input into the a12 position. Therefore, only the upper triangle of the matrix is input and all judgments below the diagonal are the reciprocal of those above the diagonal.

2.3.4. Step 4. Computation of Local Weights and Consistency of Comparisons

In this step, the local weights of the elements are computed using the eigenvector method. The normalized eigenvector corresponding to the principal eigenvalue of the judgmental matrix provides the weights of the corresponding elements [22]. The local weights, which can be obtained by summing each row and dividing each by the total sum of all rows, are priorities of the elements and are normalized within a 1% or 100% scale. This represents the typical method of reporting results. Priorities are only meaningful if derived from consistent or near-consistent matrices. Consistency can be checked using the consistency index (CI), which is a natural measure of the consistency yielded by the eigenvalue method [24]. The CI is defined as:
CI   =   ( λ m a x   n ) ( n 1 )
where λmax is the principal (maximal) eigenvalue of the matrix, and n is the size of each matrix. λmax is obtained by calculating the scalar product of the principal eigenvector and the vector of the column sums of the matrix [24]. Then, the obtained CI can be compared to an appropriate consistency index. The consistency ratio (CR), which is the ratio of CI and RI (random index, Table S2) (where RI is calculated from the mean CI value) is given by [25]:
CR   =   CI RI .
The CR is basically a measure of how a given matrix compares to a purely random matrix in regard to its consistency indices [24,25]. The CR is acceptable if it does not exceed 0.1, and consistent matrices with CR < 0.1 are considered to be those in which the responses were consistent and the priorities obtained are reliable. For a consistent matrix CR = 0, and if the CR for a matrix is more than 0.1, judgements should be elicited again from the decision-maker until they give a more consistent judgment. In this study, of the 18 CRs, nine were found to be less than 0.1, and we considered the results to be consistent; the remaining eight CRs consisted of 2 × 2 matrices that were not checked for CI because 2 × 2 matrices are always consistent [26].

2.3.5. Step 5. Aggregation of Weights across Various Levels to Obtain the Final Weights of Alternatives

Once the local weights of elements of different levels are obtained, they are aggregated to obtain the final weights of the decision alternatives (elements at the lowest level). The final weight of alternative L1 is computed using the following hierarchical aggregation rule:
Final   weight   of   L 1   =   j [ ( weight   of   L 1 with   respect   to   criterion   C j ) × ( importance   of   criterion   C j ) ] .
By definition, the weights of the alternatives and importance of criteria are normalized so that they sum to unity.

3. Analysis of the AHP Results

Based on the received 45% responses, results were analyzed in terms of local and global weights (scores) normalized to 1, and any checklist with higher weights is considered to be more prioritized. Figure 2 shows the order of the main criteria (level 1) depending on their weights (also shown in Table 2). As expected, the operation and maintenance indicators, comprising 0.430 of the entire scores, were ranked in the most important group for successful performance of sanitary sewer service. This indicated that experts in the field deemed that the tasks belonging to operation and maintenance are critical for effective and efficient performance assessment. The other four groups showed similar priorities, in the order of service (0.168) > environment (0.137) > finance (0.135) > management (0.131). Noticeably, environment and finance were selected to be more important indicators than management, implying that experts in the field agreed on the importance of sustainability in the sewer system.
Of the operation and maintenance indicators, sewer system maintenance (OM2), followed by operational monitoring and inspection (OM1), were believed to be preferentially important, with 43.2% (local weight 0.186) in the same group. Tasks in the sewer system maintenance include drainage (C13), manhole (C14), sewer (C15), and pump (C16) maintenances. As presented in Table 3, the pairwise comparison matrix revealed that sewer and pump maintenances are the two most important indicators in the sewer system maintenance selected by the experts’ group.
Figure 3 presents the local weights belonging to the major group with less than five criteria. Of the 14 indicators, the top two indicators (sewer system maintenance (OM2) and operational monitoring and inspection (OM1)) comprised 33% of the level. Complaint and response (S2) of service indictors was found to be the third most important in effective performance assessment. Of the environmental indicators, infiltration/inflow (E2) was considered to have a higher priority than sanitary sewer overflows (SSOs) (E1). This might be because infiltration/inflow have occurred more frequently than SSOs in Korea. Of the financial indicators, capital investment plan (F3), which includes tasks related to budget planning (C33), and medium- and long-term budget and business planning (C34), was the least important indicator, which might imply that the undertaking is reluctant to invest their expenditure in sewer system maintenance.
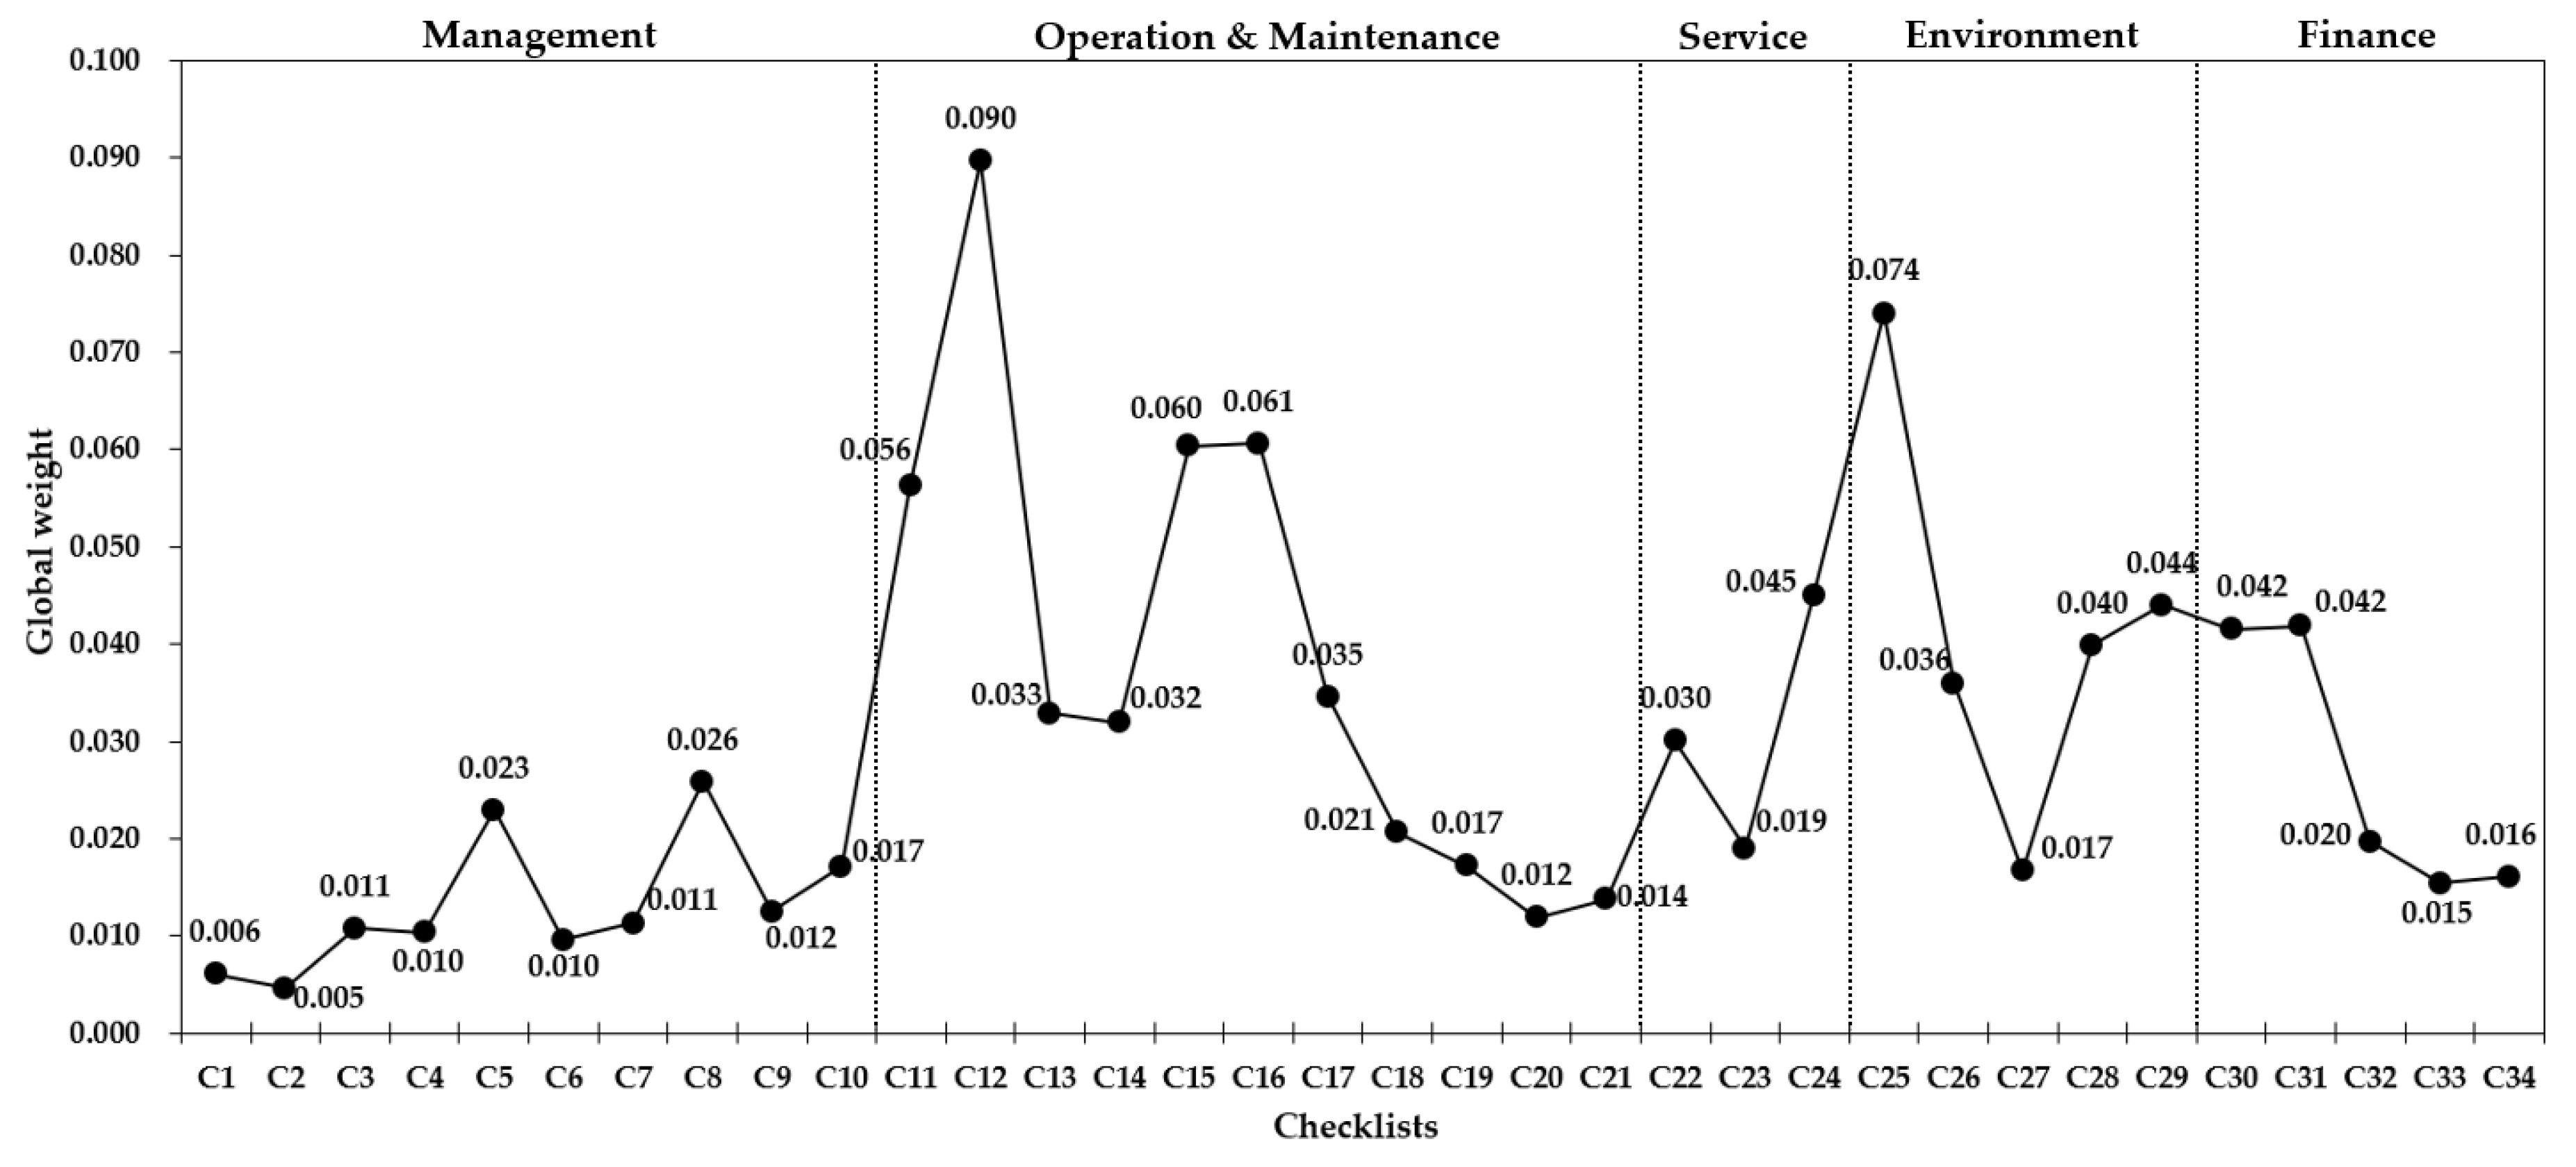
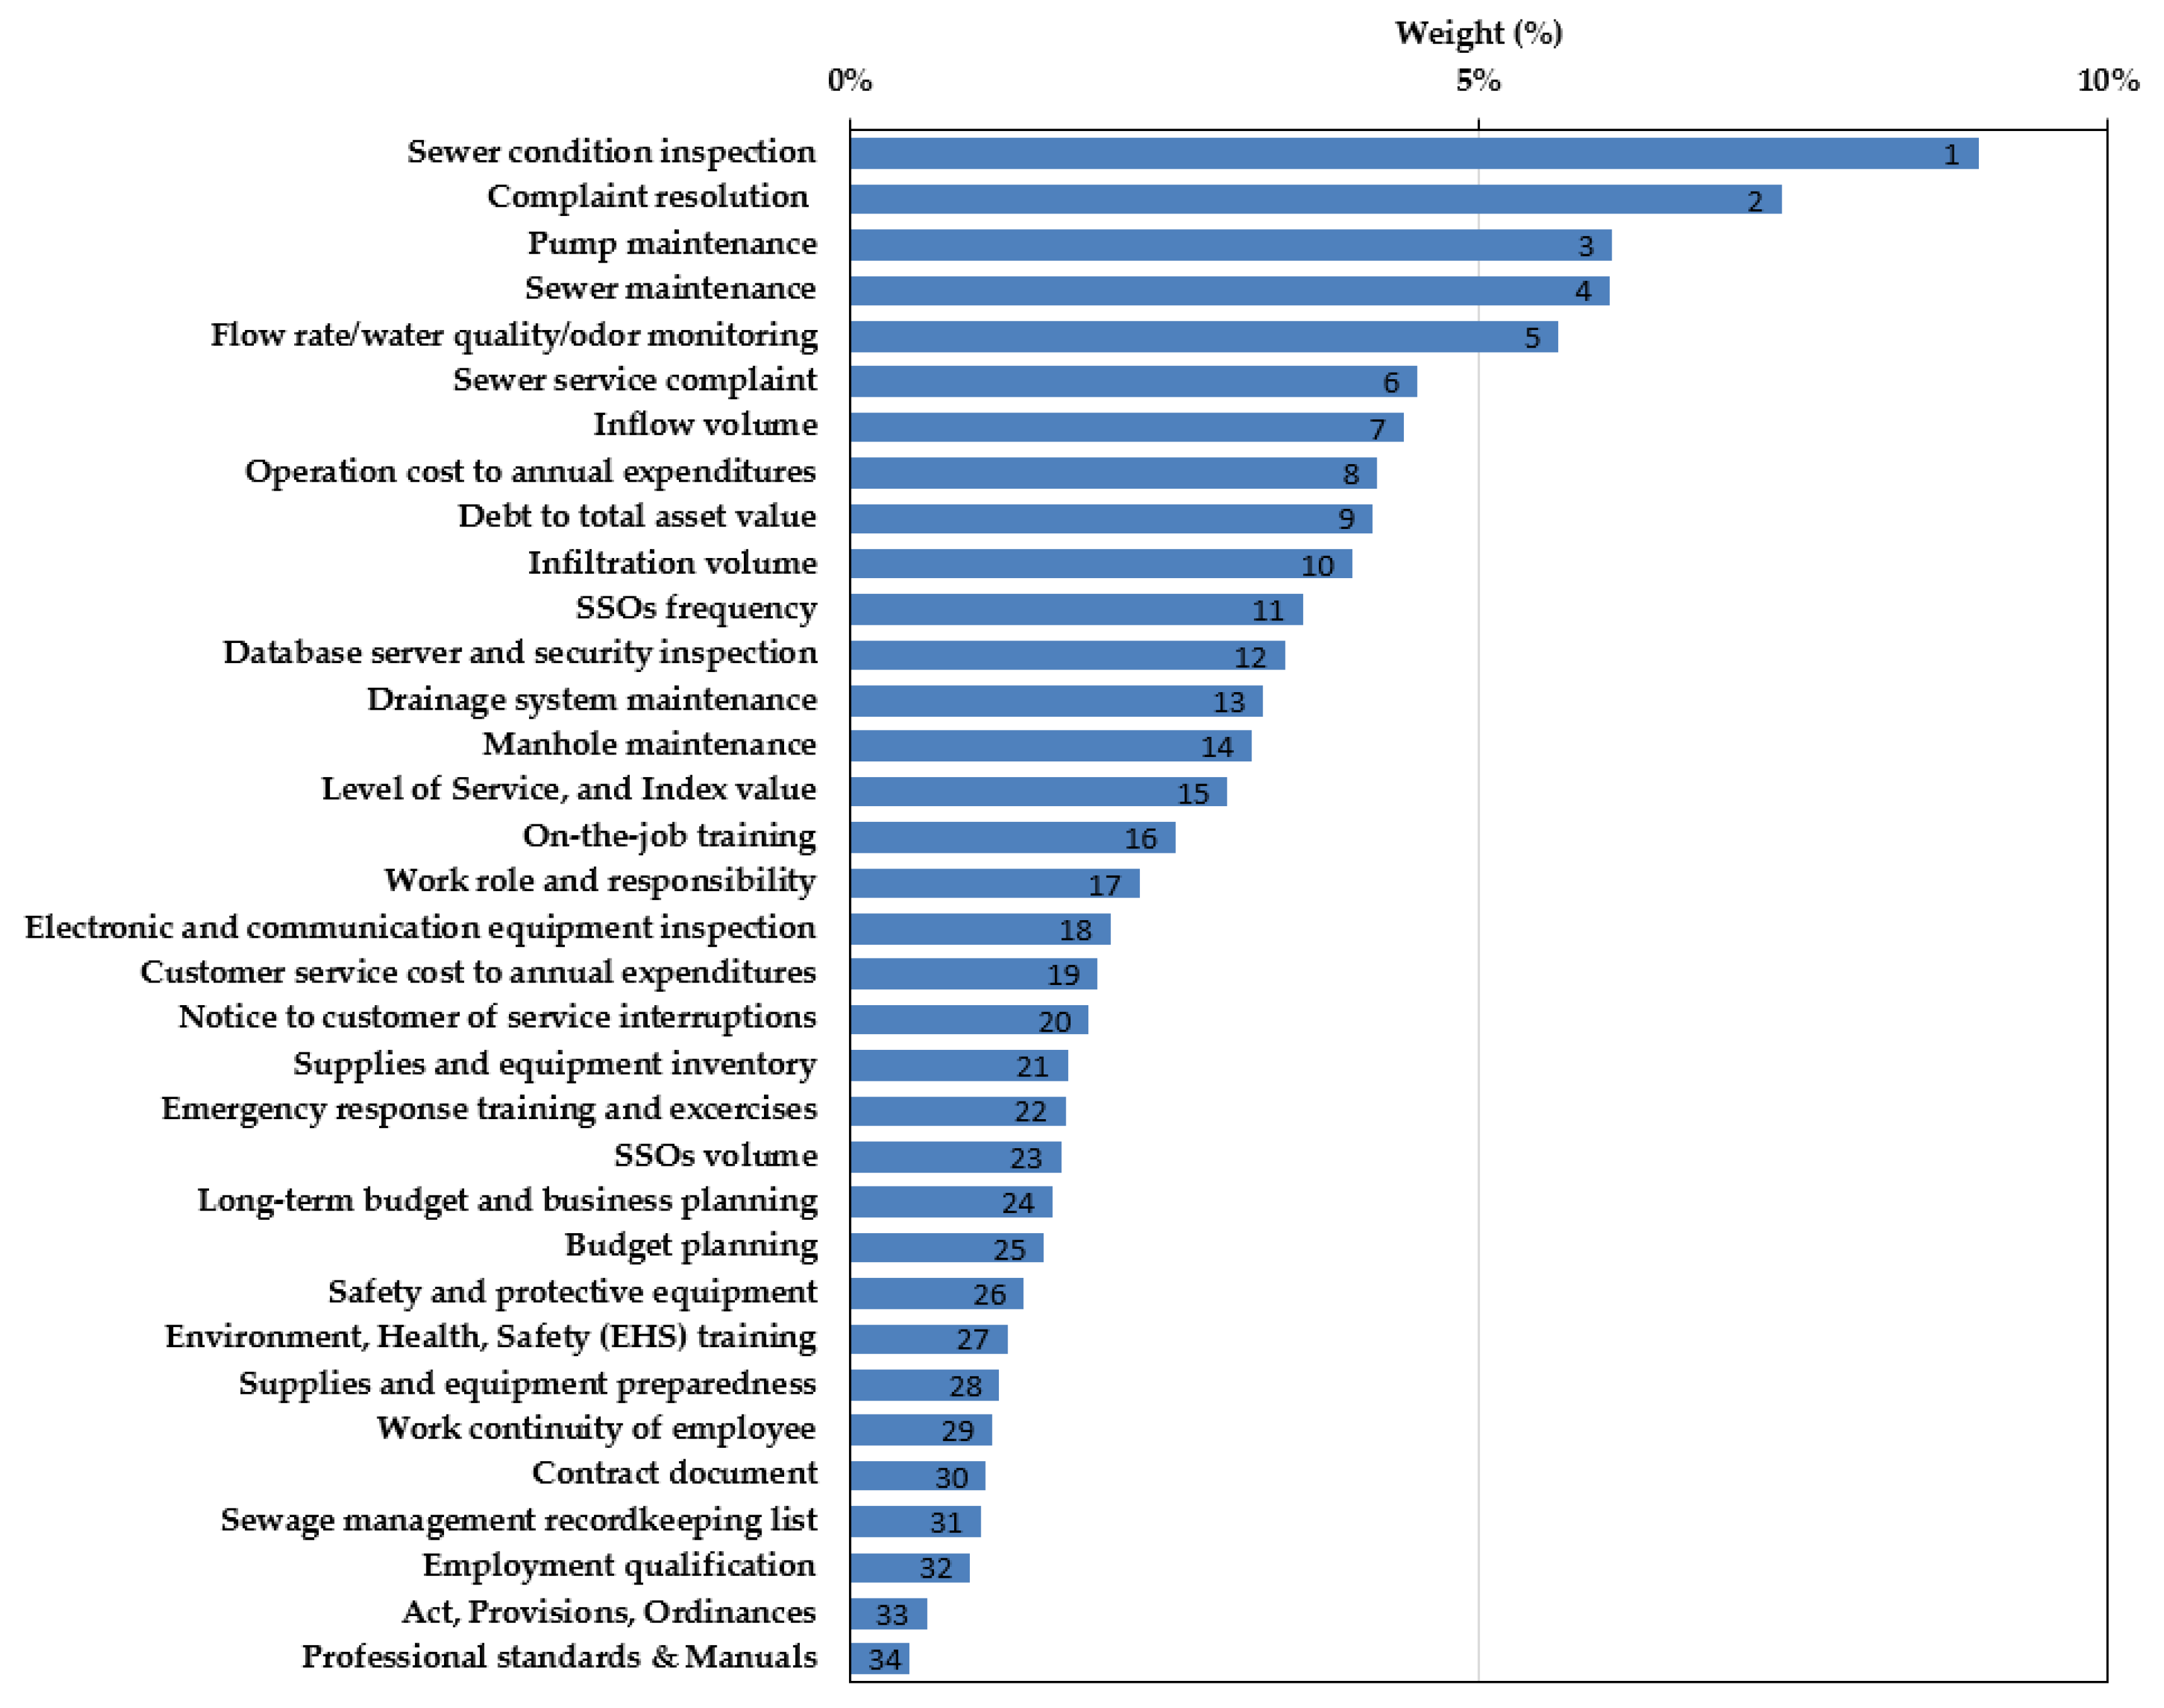
The distribution of the global weights obtained from the 34 checklists in level 3 is shown in Figure 4. As shown, the indicators of operation and maintenance (A2) have relatively high weights, which implies that tasks in this group are more prioritized. On the other hand, tasks in the management (A1) group showed overall less importance than those in other groups. Of the 10 checklists in the group, two indicators (on-the-job training (C8), and work role and responsibility (C5)) were positioned in relatively high weights, implying that these two indicators may be key PIs in this group. The overall prioritization of all 34 checklists is summarized according to their rankings as shown in Figure 5 and Table 4. The indicators ranked from 1 through 10 gained importance, reaching 55% of all indicators, and maintenance was not ranked in any of the 10 checklists. The indicators ranked from 11 to 34. Based on the overall weight results, sewer condition inspection (C12), pump (C16), sewer (C15) maintenance, and flow rate/water quality/odor monitoring (C11) belonging to A2 can be explained as key performance indicators. Of the service (A3) and environmental (A4) indicators, complaint resolution (C25) and inflow volume (C29) are the key PIs, respectively. Of the financial indicators (C5), the operational cost to annual expenditures (C31) would be a key PI. Of the 34 checklists, nine indicators could be possibly extracted as key performance indicators of the new PIs.

4. Extraction of Key Performance Indicators for Sanitary Sewer Systems

4.1. Proposed Set of KPIs

The new PI system includes 41 indicators that are categorized in accordance with five main criteria. The PI system is helpful in comparing the performance of wastewater utilities in a specific area; however, it cannot be used to compare the overall performance among utilities. On the other hand, the role and importance of each indicator in the PI system are different. Some indicators in the PI system will become the most important information source for improving performance, and for guiding wastewater utilities on a successful track. Thus, a set of key performance indicators (KPIs) that include the most important PIs from the new PI system is proposed for the SSSs in this study.
KPIs are measurable characteristics of products, services, processes, and operations, directly associated with the organization’s strategy, and provide a good indication of the success (or failure) in determining factors that are critical for the execution of this strategy [27]. According to Parmenter [27], “KPIs indicate what should be accomplished to obtain a significant increase in performance, and represent a set of measures focused on those aspects most critical to organizational success today and tomorrow”. KPIs are commonly defined in a way that is understandable, meaningful, measurable, and should follow the specific, measurable, attainable, relevant, and time-based criteria (SMART) (Figure S3 of Supplementary Materials). The use of KPIs in the performance appraisal of companies and organizations has become more and more popular to ensure that all employees can comply with their responsibilities to make the performance appraisal become transparent, clear, specific, more effective, and easier to implement. Today, KPIs are applied successfully in other sectors, such as the construction, public sector, social media, healthcare industry, business, and water sectors [2,3,4,5,6,7,8,9,10,11,12,13,14,15,16,17,18,19,20,21,22,23,24,25,26,27,28,29,30].
A set of KPIs proposed for performance assessment in this study has the following functions:
  • Provides measurements to compare the overall performance among wastewater utilities
  • Provides key information needed to determine the efficiency and effectiveness of delivered services, and focuses management attention on what matters most
  • Monitors asset management processes and provides a common language for communication
  • Identifies potential problems and areas for improving the performance of systems
  • Provides snapshots of systems’ performances focusing on goals and strategies
  • Evaluates the performance of systems in accordance with the classification categories of consistent, transparent, clear, specific, auditable, more effective, and easier to implement
  • Assigns responsibility and encourages accountability
  • Supports decision-making and provides a way to see if the strategic plan is working
  • Functions as a tool to drive desired behaviors.
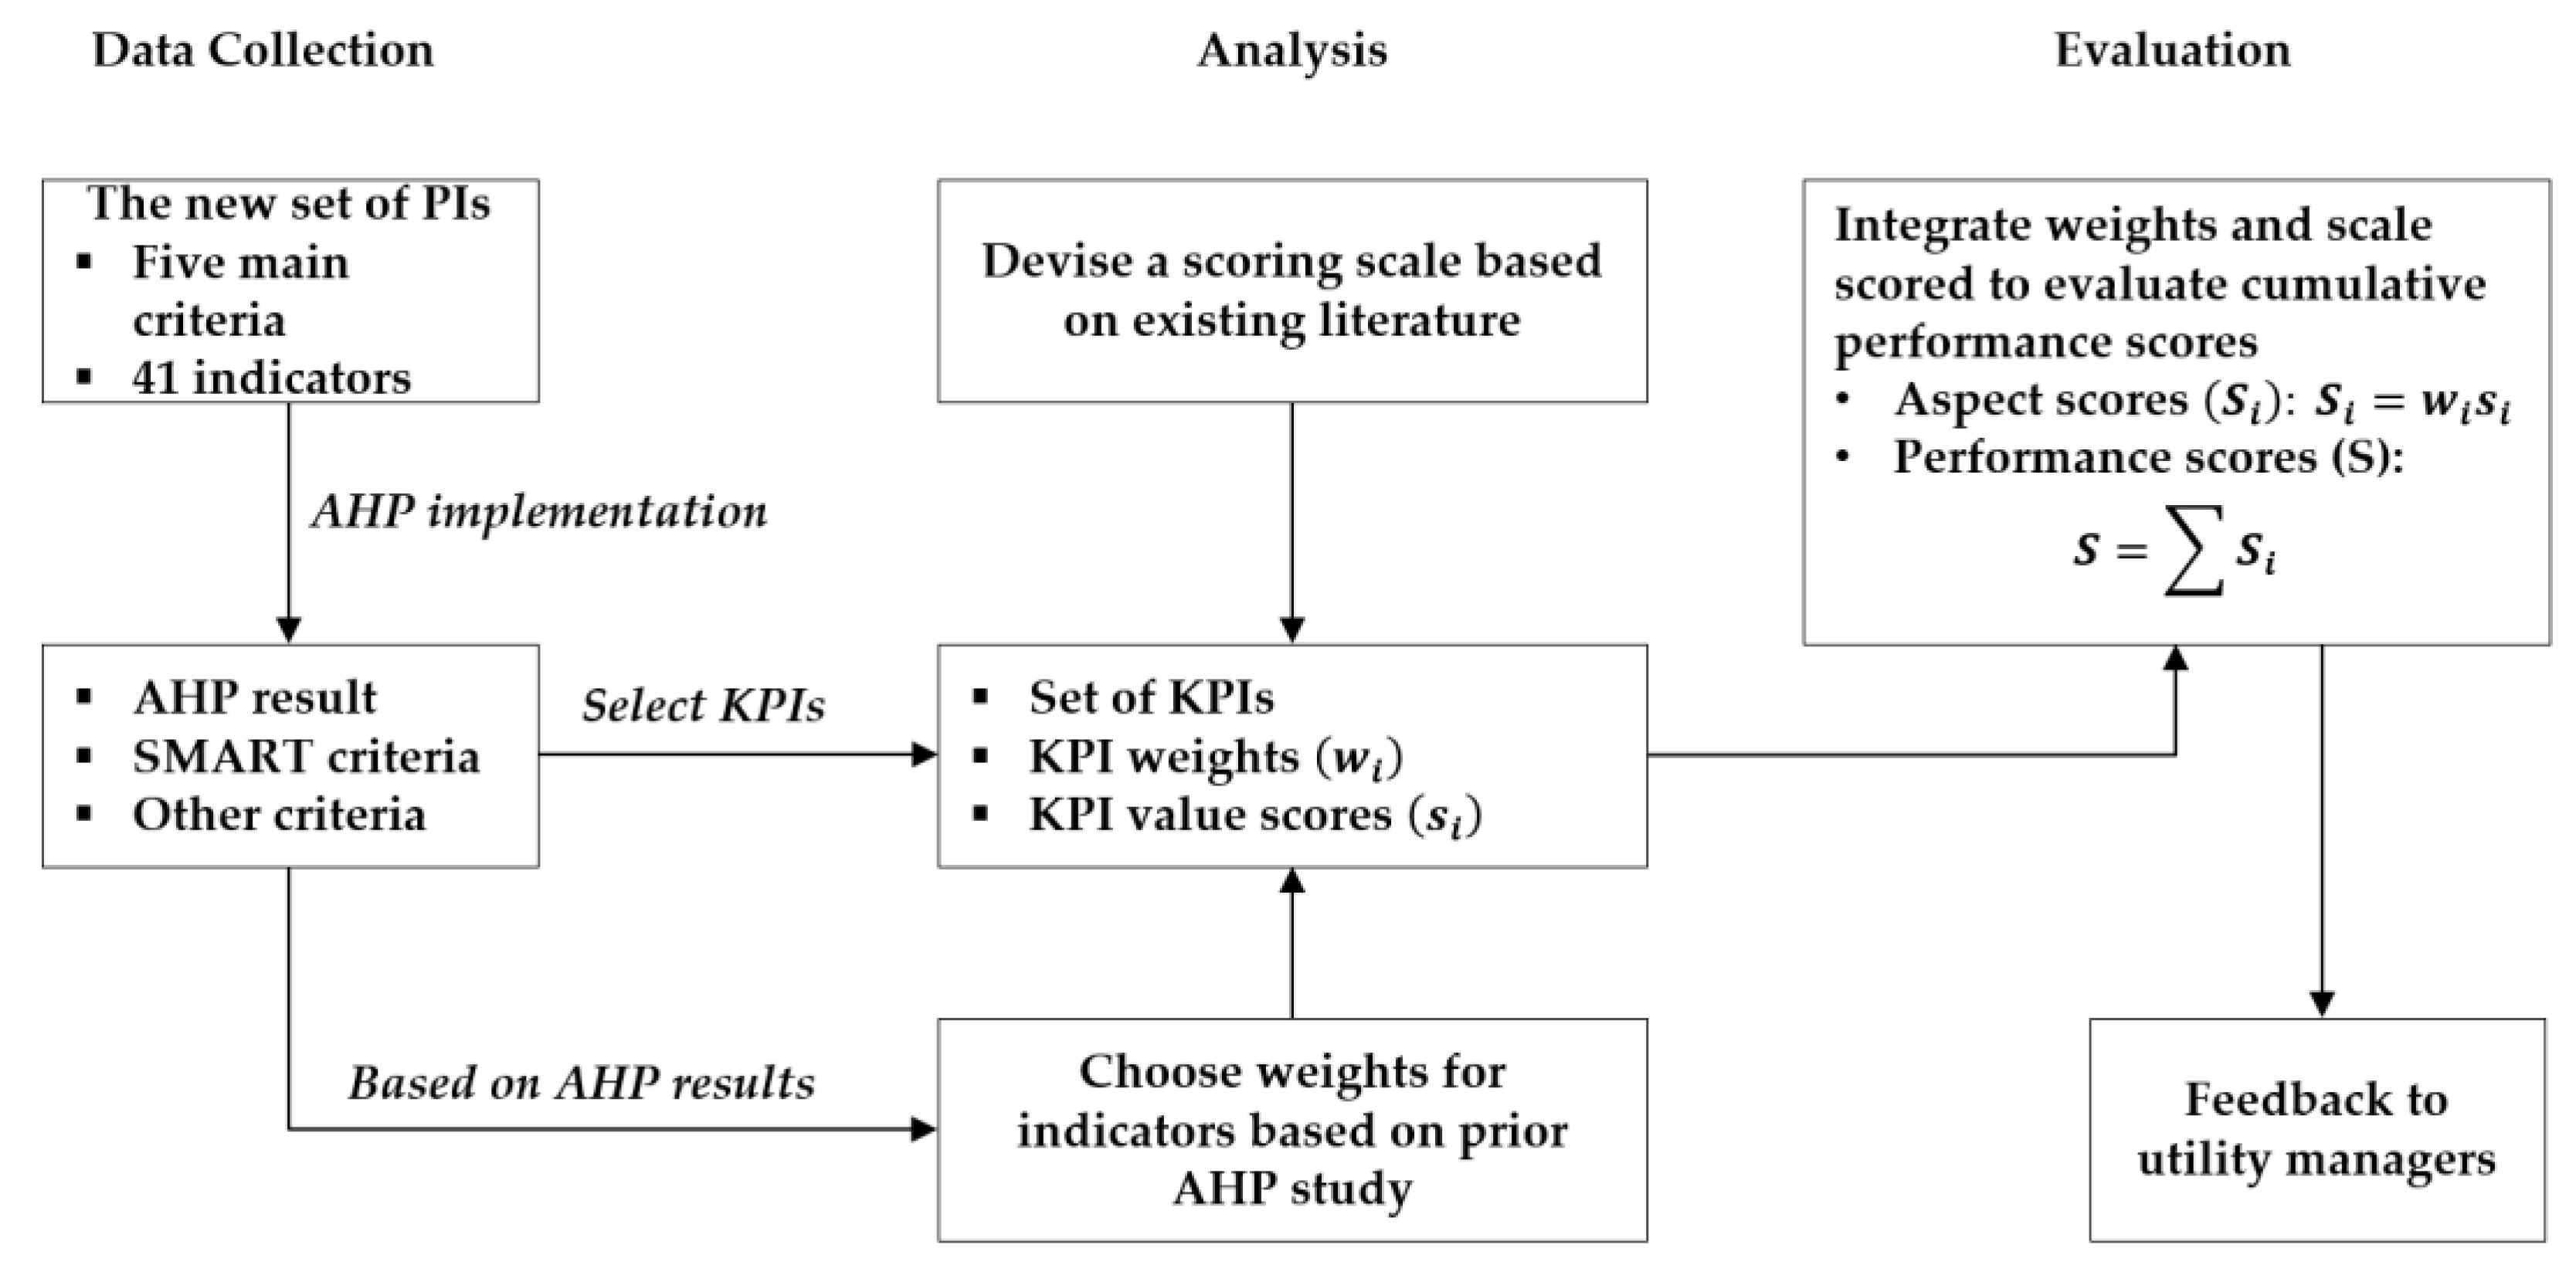
Figure 6 illustrates the process used to construct the set of KPIs. The work involves an identification of a set of KPIs together with their weights to obtain the overall score for the performance of SSSs.
KPIs for sanitary sewer systems were selected from the new PI system that was established in Section 3. Only a few carefully selected indicators may be adequate to convey the performance information simplistically and effectively. The KPIs are selected based on the following criteria:
  • The AHP result: the selected indicators must reflect the important indicators that were evaluated by experts (as expressed in Section 3)
  • The set of KPIs must include all important aspects when judging an SSS
  • KPIs should adhere to SMART criteria and other criteria to be directly relevant to objectives, should be as few as necessary, should be applicable to the options under consideration, should be comprehensive, meaningful, and relevant to all stakeholders, and applicable over time.
The selection criteria ensure that the indicators are useful and effective in terms of information to decision-makers. Based on the AHP results, the set of KPIs was devised under 10 indicators of rank 1 to 10 (Figure 5), contributing to 55% of the overall weight. The set of KPIs (Figure 7) includes 13 indicators, which are selected from entire 41 indicators in the new PI system, covering five main aspects. The unit and measurement concepts of 13 KPIs are shown in Table 5. The detailed explanations for all KPIs are listed in Table S3 (Supplementary Materials).

4.2. Performance Scores for Sanitary Sewer Systems

Comparison of each indicator individually is a relatively complicated task, and may not result in a useful evaluation to make further decisions. For example, a utility may perform poorly in terms of certain indicators, but may perform exceedingly well in terms of other indicators (e.g., poor financial status, but good operation and management practices). In such cases, evaluating, comparing, and rating the overall utility performances will not be easy and would require the integration of indicators to obtain an aggregated performance score (S). The aggregated performance score (S) is the sum of all weighted individual scores, and can be obtained as the following equation:
S =   w i s i
where w i is relative weights obtained from the AHP results, and s i is individual scores that are normalized to a range of [0, 10], are assigned to all KPIs.
Relative weights ( w i ): The indicator weights, which can be expressed in either % or a fractional scale, are obtained from the AHP study and were implemented in Section 3. Table 6 presents the final weights assigned to the KPIs.
Individual scores ( s i ): Each KPI has different units and scales. Therefore, a normalization process is needed to transform all the KPIs to a common reference scale. The scaled scores of KPIs used in this study are explained in Table S2 (Supplementary Materials). Based on Table 6 and Table S2, the aggregated performance score ( S =   w i s i ) has maximum value ( S m a x = 130 ) and minimum value ( S m i n = 0 ) . The evaluation of the performance of the system is provided as quartiles, as the following:
  • 0.0   S   32.5   ( o r   0 % S   25 % ) : Poor
  • 32.5   < S   65.0   ( o r   25 % < S   50 % ) : Average
  • 65.0   < S   97.5   ( o r   50 % < S   75 % )   : Good
  • 97.5   < S   130   ( o r   75 % < S   100 % )   : Excellent.
Therefore, the performance scores ( S =   w i s i ) are used to compare the overall performance among wastewater utilities. Moreover, the set of KPIs integrates financial and technical measures to better evaluate the implementation of strategy for utilities. Thus, this section attempts to develop a spreadsheet-based scorecard that employs a few indicators to assess the performance of wastewater utilities. The developed scorecard can rate the relative performance in terms of different aspects, and also provide a single utility performance score. These results may be utilized by decision-makers and utility managers to define the areas of shortcomings and flaws in the operation of the utilities, and to convey the performance results in a comprehensive numeric form to non-specialists and the user community. The methodology is simple and flexible enough to incorporate any number of indicators that may be representative of utility performance. Also, the scores or weights obtained from each subcategory can be further used to assess the risk of failures in functionalities of key assets or to estimate the serviceability of the sewer systems [31,32]. The incorporation of performance scores with artificial neural networks or machine learning techniques (e.g., self-organizing map, support vector machines) enable it to classify or predict the conditions of infrastructures, such as pumps or sewers, so that preventive measures for the failures can be implemented in a timely manner [32,33].

5. Conclusions

A new set of PIs for the performance assessment of sanitary sewer systems was developed in this study. Using the experts’ survey incorporated into the AHP tool, the prioritization of five criteria consisting of a total of 14 indicators, 34 checklists in level 3, and 41 indicators in level 4 (calculation level) was performed. Of the criteria groups, operation and maintenance was found to be the most important indicator for successful performance in sanitary sewer systems, with 43% of all scores. Indicators in environment and finance categories were considered as more important than management for the sustainability of sewer services.
Based on the AHP results and other criteria, a set of KPIs was proposed. The set of KPIs consisted of 13 indicators that were selected from 41 PIs in the new PI system, and the 13 KPIs cover 57% of the entire performance scores assessed from five major aspects of sewer services. The scores of each KPI with different units and scales were normalized into a common reference scale (i.e., the aggregated performance score, S) by incorporating the relative weight of indicators (i.e., w i ) with individual scores (i.e., s i ), thus enabling the application of KPIs to evaluate, compare, and rate the overall performances among service providers.
The advantages of this new PIs system are as follows. The performance scores of KPIs and PIs enable it to assess the performance of a single wastewater utility over time, and also to make direct comparisons or ratings among wastewater service utilities based on the performance results, so that decision-makers or utility managers can define the shortcomings and flaws in utilities operations. The comprehensive numeric form applied for PIs can be easily understood by non-specialists, such as customers or user communities, thus it is easy to convey the present status on service performances. Also, the evaluation scores or weights from criteria or categories in the PIs system can be practically used for risk analyses; specifically, the incorporation of PIs results into advanced data analyses, such as machine learning techniques, would enable it to predict and prevent failures in sewer services as well as to reliably manage infrastructure assets.
Of course, the new PIs system has limitations insofar as it would not fit into the performance evaluation of the combined sewer systems because the framework of PIs was developed for separate sewer systems. Also, the prioritization of PIs would be changed if variations due to climatic or cultural factors should be put into prior consideration, and in such cases, the PIs framework should be reconstructed in accordance with individual situations.
In conclusion, the authors encourage the set of PIs of this study to be actively used by stakeholders involved in the activity of sewer services, such as undertaking companies, policy-making bodies, and financing agencies, so that an assessment database would enable the comparison of performance at nation-wide or international levels, and, eventually, sewer services would be proceed into sustainable ways of operation.

Supplementary Materials

The following are available online at https://www.mdpi.com/2071-1050/11/10/2746/s1.

Author Contributions

S.-N.N. conceptualized the methodology and the PIs framework, and wrote the first draft. T.T.N. collected and analyzed the responses using the AHP, and performed the data analysis. J.O. acquired the funding and finalized the submitted version.

Funding

This research received no external funding.

Acknowledgments

This study was financially supported by a research project (Project No. 2016000200012) from the Korea Environmental Industry & Technology Institute (KEITI) through the Public Technology Program based on Environmental Policy, and by the Chung-Ang University Excellent Student scholarship for an international graduate student.

Conflicts of Interest

The authors declare no conflict of interest.

References

  1. Matos, R.; Cardoso, A.; Duarte, P.; Ashley, R.; Molinari, A.; Schulz, A. Performance Indicators for Wastewater Services; IWA Publishing: London, UK, 2003. [Google Scholar]
  2. Danilenko, A.; Berg, C.; Macheve, B.; Mofitt, L. The IBNET Water Supply and Sanitation Blue Book 2014; World Bank: Washington, DC, USA, 2014. [Google Scholar]
  3. OFWAT. Key Performance Indicators—Guidance; Water Services Regulation Authority: Birmingham, UK, 2013. Available online: https://www.ofwat.gov.uk/wp-content/uploads/2015/12/prs_web_kpiprintable.pdf (accessed on 8 May 2019).
  4. U.S. EPA. Guide for Evaluation Capacity, Management, Operation, and Maintenance (CMOM) Programs at Sanitary Sewer Collection Systems; United States Environmental Protection Agency: Cincinnati, OH, USA, 2005.
  5. AWWA. Benchmarking Performance Indicators for Water and Wastewater Utilities–2013 Survey Data and Analyses Report; American Water Works Association: Denver, CO, USA, 2015. [Google Scholar]
  6. Alegre, H.; Baptista, J.M.; Cabrera, E., Jr.; Cubillo, F.; Duarte, P.; Hirner, W.; Merkel, W.; Parena, R. Performance Indicators for Water Supply Services (Manual of Best Practice), 2nd ed.; IWA Publishing: London, UK, 2006. [Google Scholar]
  7. Alegre, H.; Hirner, W.; Baptista, J.M.; Parena, R.; Cubillo, F.; Cabrera, E.; Matos, R. The IWA Systems of Performance Indicators for Urban Water Services. In Proceedings of the Workshop Views and Experience Gained Through Implementing IWA Performance Indicators Project, Melbourne, Australia, 7–12 April 2002. [Google Scholar]
  8. Guérine-Schneider, L.; Brunet, E. Performance Indicators for the Regulation of the Water and Sewerage Services: The French Experience. In Proceedings of the Enviro 2002 IWA World Water Congress, Melbourne, Australia, 7–12 April 2002. [Google Scholar]
  9. Milutinovic, B. Benchmarking and Performance Indicators in Water Supply and Wastewater Services. Master’s Thesis, Postgraduate Program in Water Resources and Environmental Management, Faculty of Civil Engineering, University of Belgrade, Beograd, Serbia, 2013. Available online: https://www.slideshare.net/BorisavMilutinovic/benchmarking-and-performance-indicators-borisav-milutinovic (accessed on 25 March 2019).
  10. Ministry of Environment. Sewage Statistics 2014; South Korea, 2013. Available online: http://eng.me.go.kr/eng/web/index.do?menuId=310 (accessed on 8 May 2019).
  11. Mels, A.R.; Nieuwenhuijzen, A.F.; van der Graaf, J.H.J.M.; Klapwijk, B.; de Koning, J.; Rulkens, W.H. Sustainability indicators as a tool in the development of new sewage treatment methods. Water Sci. Technol. 1999, 39, 243–250. [Google Scholar] [CrossRef]
  12. Ashley, R.; Hopkinson, P. Sewer systems and performance indicators—Into the 21st century. Urban Water 2002, 4, 123–135. [Google Scholar] [CrossRef]
  13. Balkema, A.J.; Preisig, H.A.; Otterpohl, R.; Lambert, F.J. Indicators for the sustainability assessment of wastewater treatment systems. Urban Water 2002, 4, 153–161. [Google Scholar] [CrossRef]
  14. Milman, A.; Short, A. Incorporating resilience into sustainability indicators: An example for the urban water sector. Glob. Environ. Chang. 2008, 18, 758–767. [Google Scholar] [CrossRef]
  15. Ioris, A.R.; Hunter, C.; Walker, S. The development and application of water management sustainability indicators in Brazil and Scotland. J. Environ. Manag. 2008, 88, 1190–1201. [Google Scholar] [CrossRef] [PubMed] [Green Version]
  16. Zhou, Q. A Review of Sustainable Urban Drainage Systems Considering the Climate Change and Urbanization Impacts. Water 2014, 6, 976–992. [Google Scholar] [CrossRef] [Green Version]
  17. Shinde, V.R.; Hirayama, N.; Mugita, A.; Itoh, S. Revising the existing Performance Indicator system for small supply utilities in Japan. Urban Water J. 2013, 10, 377–393. [Google Scholar] [CrossRef]
  18. Statistics Korea. Population Projections for Korea (2015~2065); Statistics Korea: Daejeon, Korea, 2016.
  19. Fenner, R.A. Approaches to sewer maintenance: A review. Urban Water 2000, 2, 343–356. [Google Scholar] [CrossRef]
  20. Palme, U.; Tillman, A.-M. Sustainable development indicators: How are they used in Swedish water utilities? J. Clean. Prod. 2008, 16, 1346–1357. [Google Scholar] [CrossRef]
  21. Saaty, T.L. The Analytic Hierarchy Process. In Encyclopedia of Biostatistics, 2nd ed.; Armitage, P., Colton, T., Eds.; John Wiley & Sons, Inc.: Hoboken, NJ, USA, 2005. [Google Scholar]
  22. Subramanian, N.; Ramanathan, R. A review of application of Analytic Hierarchy Process in operations management. Int. J. Prod. Econ. 2012, 138, 215–241. [Google Scholar] [CrossRef]
  23. Saaty, T.L. Fundamentals of Decision Making and Priority Theory with Analytic Hierarchy Process, 1st ed.; RWS Publications: Pittsburgh, PA, USA, 2000; Volume 6. [Google Scholar]
  24. Saaty, T.L. Decision making with the analytic hierarchy process. Int. J. Services Sci. 2008, 1, 83–98. [Google Scholar] [CrossRef]
  25. Kurka, T. Application of the analytic hierarchy process to evaluate the regional sustainability of bioenergy developments. Energy 2013, 62, 393–402. [Google Scholar] [CrossRef]
  26. Saaty, T.L. Time dependent decision-making: Dynamic priorities in the AHP/ANP: Generalizing from points to functions and from real to complex variables. Math. Comput. Model. 2007, 46, 860–891. [Google Scholar] [CrossRef]
  27. Parmenter, D. Key Performance Indicators: Developing, Implementing, and Using Winning KPIs, 3rd ed.; John Wiley & Sons, Inc.: Hoboken, NJ, USA, 2015. [Google Scholar]
  28. Vilanova, M.R.N.; Filho, P.M.; Balestieri, J.A.P. Performance measurement and indicators for water supply management: Review and international cases. Renew. Sust. Energ. Rev. 2015, 43, 1–12. [Google Scholar] [CrossRef]
  29. Salvetti, M. The network efficiency rate: A key performance indicator for water services asset management? In Proceedings of the 7th IWA International Conference on Efficient Use and Management of Water, Paris, France, 22–25 October 2013. [Google Scholar]
  30. Water Supply Policy and Economics. Key Performance Indicators for Annual Performance Reporting for Queensland Urban Water Service Providers—Definitions Guide; Water Supply Regulation of Natural Resources, Department of Natural Resources, Mines and Energy: Queensland, Australia, 2016.
  31. Pietrucha-Urbanik, K.; Tchórzewska-Cieślak, B. Water supply system operation regarding consumer safety using Kohonen neural network. In Safety, Reliability and Risk Analysis: Beyond The Horizon, 1st ed.; Steenbergen, R.D.J.M., van Gelder, P.H.A.J.M., Miraglia, S., Vrouwenvelder, A.C.W.M., Eds.; CRC Press: Boca Raton, FL, USA, 2014; pp. 1115–1120. [Google Scholar]
  32. Pietrucha-Urbanik, K.; Tchórzewska-Cieślak, B. Approaches to failure risk analysis of the water distribution network with regard to the safety of consumers. Water 2018, 10, 1679. [Google Scholar] [CrossRef]
  33. Mashford, J.; Marlow, D.; Tran, D.; May, R. Prediction of sewer condition grade using support vector machines. J. Comput. Civ. Eng. 2011, 25, 283–290. [Google Scholar] [CrossRef]
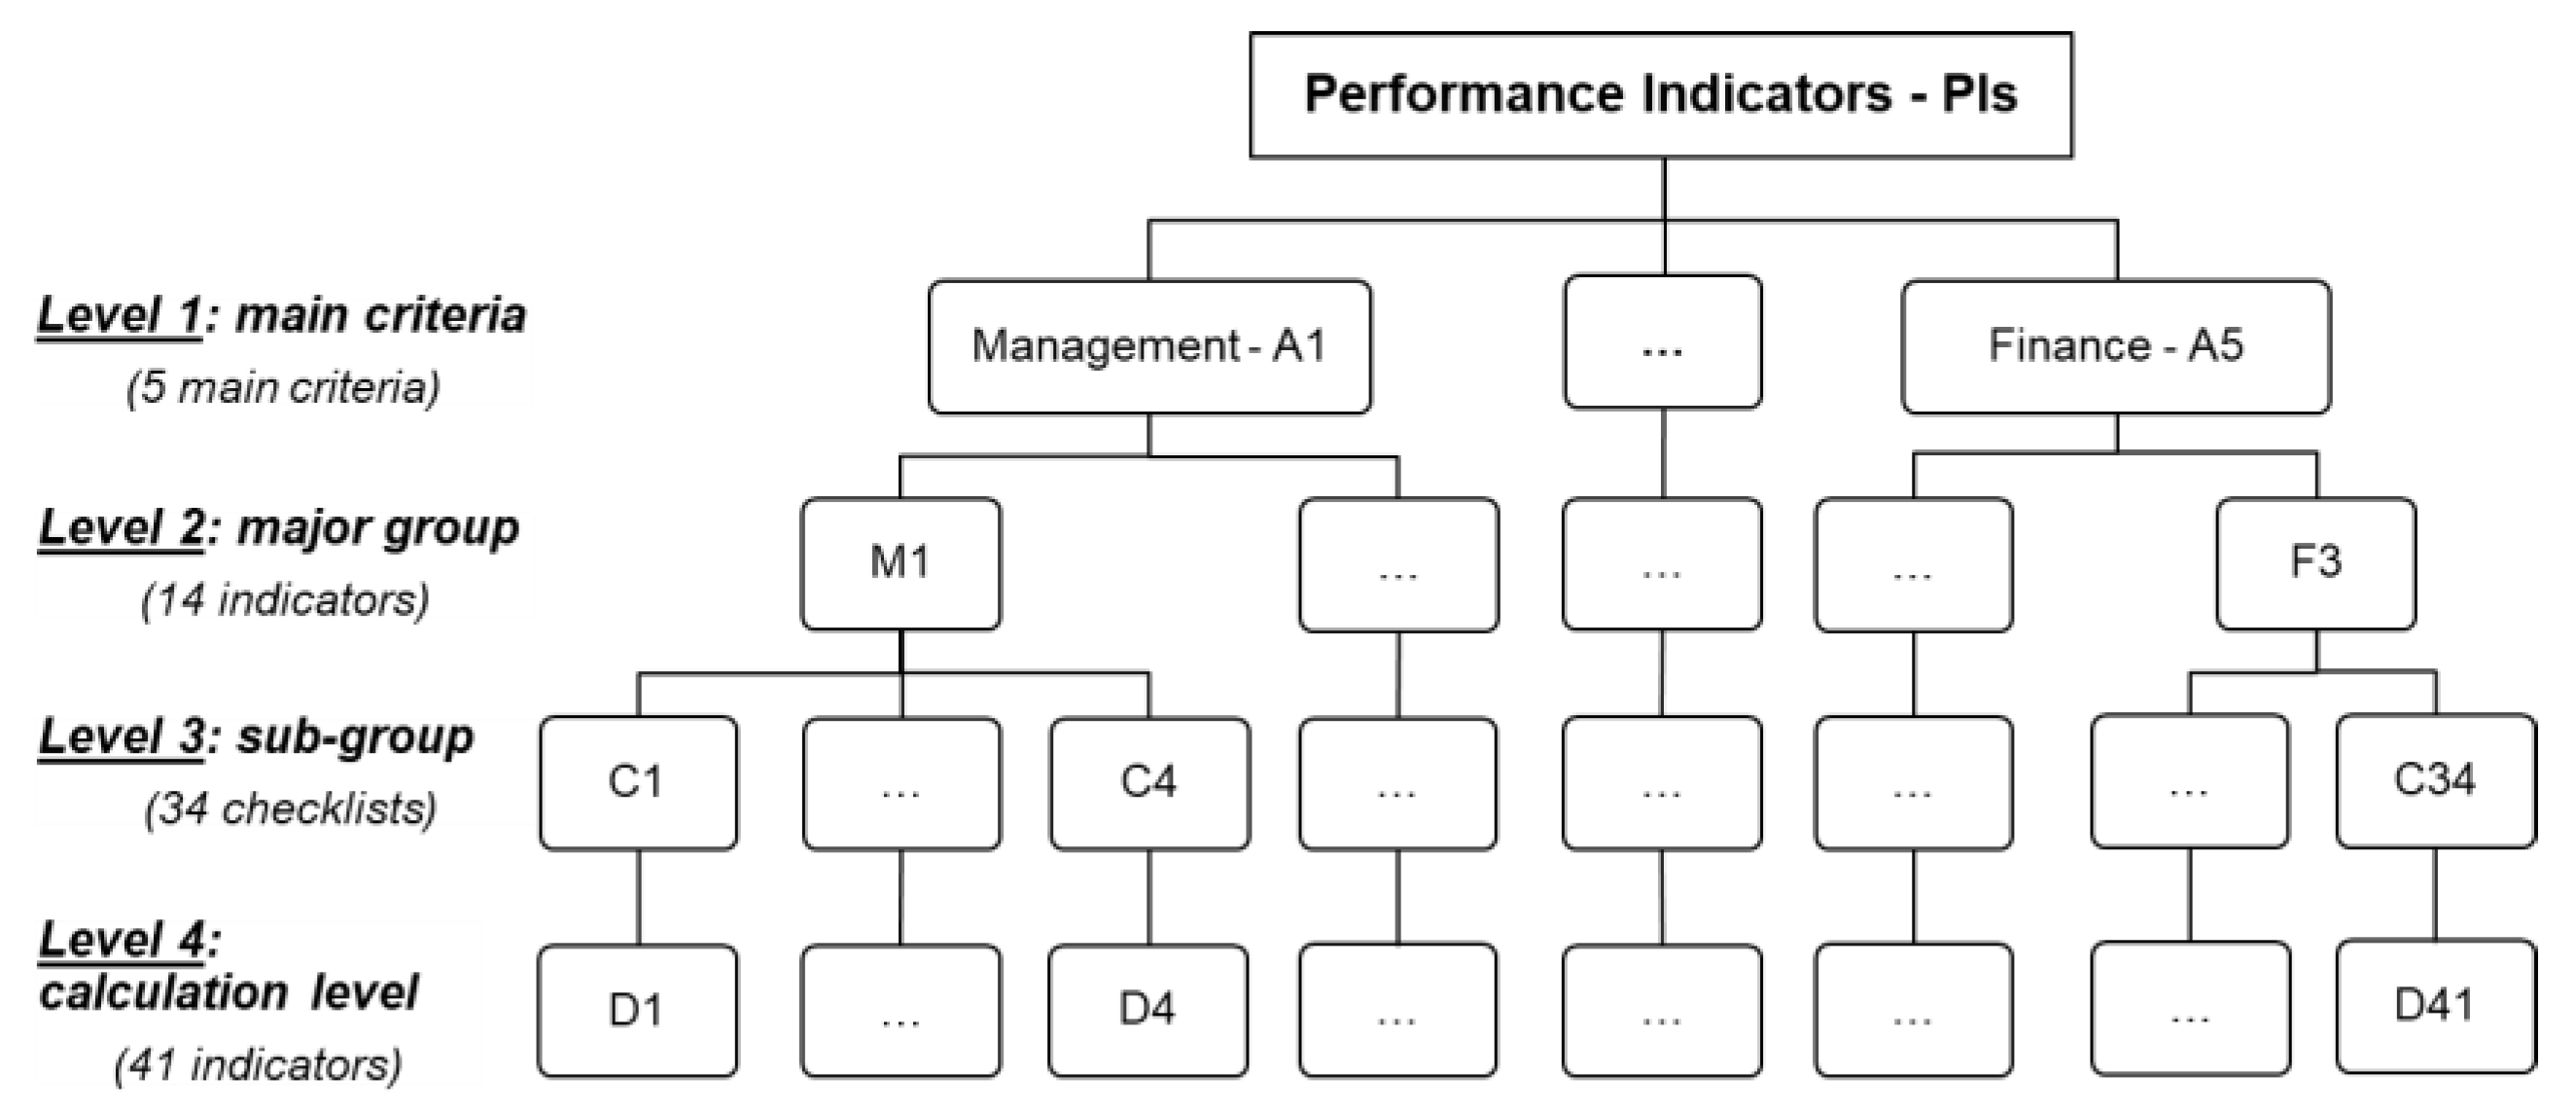
Figure 1. Hierarchy tree for the evaluation of performance in a sanitary sewer system.
Sustainability 11 02746 g001
Figure 2. Prioritization of main criteria (level 1) by the analytical hierarchy process (AHP).
Sustainability 11 02746 g002
Figure 3. Prioritization of the major group (level 2) by the AHP.
Sustainability 11 02746 g003
Figure 4. Distribution of the global weight of 34 checklists in the level 3 group by the AHP.
Sustainability 11 02746 g004
Figure 5. Overall prioritization of all 34 checklists (level 3) by the AHP.
Sustainability 11 02746 g005
Figure 6. The process to propose a set of key performance indicators (KPIs) for sanitary sewer systems (SSSs).
Sustainability 11 02746 g006
Figure 7. Extraction of PIs and selection of KPIs for sanitary sewer systems.
Sustainability 11 02746 g007
Table 1. Composition of criteria and sub-groups hierarchy for a set of performance indicators (PIs).
Main CategoryCodeMajor GroupCodeSub-GroupCodeCalculation LevelCodeUnit
ManagementA1Laws, regulations, and required manualsM1Act, provisions, ordinancesC1Regulatory complianceD1(%)
Professional standards and manualsC2Professional standards and manualsD2(%)
Contract documentC3Prosecutions/notices issued to contractorsD3(%)
Sewage management recordkeeping listC4Sewage management recordkeepingD4(%)
Organizational structureM2Work role and responsibilityC5Employment levelsD5(No./100 km sewer)
Management personnelD6(%)
Technical personnelD7(%)
Employment qualificationC6Employment qualificationD8(%)
Work continuity of employeeC7Absenteeism D9(days/100 employees/month)
Working accidentsD10(No./100 employee/year)
Employee education and trainingM3On-the-job training C8On-the-job training D11(hours/employee/year)
Environment, health, safety (EHS) training C9Environment, Health, Safety (EHS) training D12(hours/employee/year)
Emergency response training and exercisesC10Emergency response trainingD13(hours/employee/year)
Operation and maintenanceA2Operational monitoring and inspectionOM1Flow rate/water quality/odor monitoring C11Wastewater quality monitoringD14(%)
Sewer cleaningD15(%)
Flow monitoringD16(%)
Sewer condition inspectionC12Sewer inspectionD17(%)
OM2Drainage system maintenanceC13Drainage system maintenanceD18(%)
Manhole maintenanceC14Manhole maintenanceD19(%)
Sewer maintenanceC15Sewer maintenanceD20(%)
Pump maintenanceC16Pump maintenanceD21(%)
Information and communication facility maintenanceOM3Database server and security inspectionC17Database server and security inspectionD22(No./year)
Electronic and communication equipment maintenanceC18Electronic and communication equipment maintenanceD23(%)
Supplies and equipment maintenanceOM4Supplies and equipment inventoryC19Supplies and equipment inventoryD24(%)
Supplies and equipment preparednessC20Supplies and equipment preparednessD25(%)
Safety and protective equipmentC21Safety and protective equipment D26(%)
ServiceA3Sewer service informationS1Level of Service, and Index valueC22Population coveredD27(%)
Adequacy of sewer systemD28(%)
Notice to customer of service interruptionsC23Notice to customer of service interruptionsD29(%)
Complaint and responseS2Sewer service complaintC24Total complaintsD30(No./100/year)
Complaint resolution C25Response to complaintsD31(%)
EnvironmentA4Sanitary sewer overflowsE1SSOs frequencyC26SSOs frequencyD32(No. SSO events/100km)
SSOs volumeC27SSOs inspection volumeD33(%)
Infiltration/InflowE2Infiltration volumeC28Infiltration volumeD34(m3/km/year)
Inflow volumeC29Inflow volumeD35(m3/km/year)
FinanceA5Financial soundnessF1Debt to total asset valueC30Debt to total assetD36(%)
Operation and service costF2Operation cost to annual expendituresC31Operating ratioD37(%)
Customer service cost to annual expendituresC32Customer service cost per accountD38($/account)
Capital investment planF3Budget planningC33Current ratioD39(%)
Asset turnover ratio D40(%)
Medium and long-term budget and business planningC34Return on assetD41(%)
Table 2. The pairwise comparison matrix.
A1A2A3A4A5Eigenvalues (Weights)
A110.3170.8950.9150.8990.1310
A23.15313.0653.3482.7300.4298
A31.1170.32611.7411.2050.1681
A41.0930.2990.57411.3470.1365
A51.1130.3660.8300.74210.1346
CR0.0131
Table 3. The pairwise comparison matrix of checklists in sewer system maintenance (OM2).
C13C14C15C16Eigenvalues (Weights)
C1311.2130.5090.4910.1770
C140.82510.6240.5170.1718
C151.9661.60111.1040.3250
C162.0351.9360.90610.3263
CR0.0028
Table 4. Overall weights and ranking of the new PIs for sanitary sewer systems.
Level 1Level 2Level 3Ranking
CriteriaWeightMajor GroupGross WeightSub-GroupGross WeightLevel 1Level 2Level 3
Management (A1)13.1%Laws, regulations, and required manuals0.032Act, provisions, ordinances0.00651333
Professional standards and manuals0.00534
Contract document0.01130
Sewage management recordkeeping list0.01031
Organizational structure0.044Work role and responsibility0.0231017
Employment qualification0.01032
Work continuity of employee0.01129
Employee education and training0.055On-the-job training0.026616
Environment, health, safety (EHS) training0.01227
Emergency response training and exercises0.01722
Operation and maintenance (A2)43.0%Operational monitoring and inspection0.146Flow rate/water quality/odor monitoring0.056125
Sewer condition inspection0.0901
Sewer system maintenance0.186Drainage system maintenance0.033113
Manhole maintenance0.03214
Sewer maintenance0.0604
Pump maintenance0.0613
Information and communication facility maintenance0.055Database server and security inspection0.035712
Electronic and communication equipment maintenance0.02118
Supplies and equipment maintenance0.043Supplies and equipment inventory0.0171121
Supplies and equipment preparedness0.01228
Safety and protective equipment0.01426
Service (A3)16.8%Sewer service information0.049Level of service, and index value0.0302915
Notice to customer of service interruptions0.01920
Complaint and response0.119Sewer service complaint0.04536
Complaint resolution 0.0742
Environment (A4)13.7%Sanitary sewer overflows0.053SSOs frequency0.0363811
SSOs volume0.01723
Infiltration/Inflow0.084Infiltration volume0.040410
Inflow volume0.0447
Finance (A5)13.5%Financial soundness0.042Debt to total asset value0.0424129
Operation and service cost0.062Operation cost to annual expenditures0.04258
Customer service cost to annual expenditures0.02019
Capital investment plan0.031Budget planning0.0151425
Long-term budget and business planning0.01624
Table 5. The set of KPIs for sanitary sewer systems in South Korea.
Key Performance IndicatorCodeUnitConcept
KPI1On-the-job training D11(hours/employee/year)On-the-job training = [(Number of training hours during a year)/(total number of employees)]
KPI2Wastewater quality monitoringD14(%)Wastewater quality monitoring = [Total number of tests related to wastewater quality (i.e., BOD, COD, TOC…) that are carried out/total number of tests related to wastewater quality (i.e., BOD, COD, TOC…) required by applicable standards or legislation] × 100
KPI3Sewer cleaningD15(%)Sewer cleaning = (Length of sewers cleaned/total sewer length) × 100
KPI4Flow monitoringD16(%)Flow monitoring = (Number of flow metering performed at locations within sewer system/total number of flow metering locations within sewer system required by operation strategy of the system) × 100
KPI5Sewer inspectionD17(%)Sewer inspection = (Length of sewers inspected/total length of sewers network) × 100
KPI6Sewer maintenanceD20(%)Sewer maintenance = (Length of defective sewers rehabilitated, renovated, replaced/total sewer length) × 100
KPI7Pump maintenanceD21(%)Pump maintenance = (Number of pumps replaced, renewed, renovated, or repaired/total of pumps) × 100
KPI8Response to complaintsD31(%)Response to complaints = [(Total number of responses to complaints)/(total number of complaints related to sanitary sewer system)] × 100
KPI9SSOs frequencyD32(No. SSO events/100km)SSOs frequency = (Total number of SSOs events that occurred during a year of sanitary sewer systems × 100/total km of sewer collection system)
KPI10Infiltration volumeD34(m3/km/year)Infiltration volume = Volume of water entering sewers from groundwater during a year/total sewer length of sanitary sewer system
KPI11Inflow volumeD35(m3/km/year)Inflow volume = Volume of water entering sewers from erroneous connection during a year/total sewer length of sanitary sewer system
KPI12Debt ratioD36(%)Debt ratio = (Total liabilities/total assets) × 100
KPI13Operating ratioD37(%)Operating ratio = (Total O&M costs/total operating revenue) × 100
Table 6. Various aspects and weights associated with KPIs.
CodeKey Performance IndictorGross Weight (%)Weight (%)
Management (A1)
KPI1On-the-job training 2.604.55
Operation & Maintenance (A2)
KPI2Wastewater quality monitoring1.873.27
KPI3Sewer cleaning1.873.27
KPI4Flow monitoring1.873.27
KPI5Sewer inspection9.0015.76
KPI6Sewer maintenance6.0010.51
KPI7Pump maintenance6.1010.68
Service (A3)
KPI8Response to complaints7.4012.96
Environment (A4)
KPI9SSOs frequency3.606.30
KPI10Infiltration volume4.007.01
KPI11Inflow volume4.407.71
Finance (A5)
KPI12Debt to total asset4.207.36
KPI13Operation ratio4.207.36
Sum57.10100.00