Sustainable Production of Sweet Sorghum as a Bioenergy Crop Using Biosolids Taking into Account Greenhouse Gas Emissions


Institute of Agroecology and Plant Production, Wroclaw University of Environmental and Life Sciences 24a Grunwaldzki Square, 50-363 Wrocław, Poland
*
Author to whom correspondence should be addressed.
Sustainability 2019, 11(11), 3033; https://doi.org/10.3390/su11113033
Submission received: 14 April 2019
/
Revised: 19 May 2019
/
Accepted: 24 May 2019
/
Published: 29 May 2019
(This article belongs to the Special Issue Global Warming, Environmental Governance and Sustainability Issues)
Abstract
:Currently, little data are available on greenhouse gas (GHG) emissions from sweet sorghum production under temperate climate. Similarly, information on the effect of bio-based waste products use on the carbon (C) footprint of sorghum cultivation is rare in the literature. The aim of this study was to evaluate the agronomical and environmental effects of the application of biosolids as a nitrogen source in the production of sweet sorghum as a bioenergy crop. The yield of sorghum biomass was assessed and the GHG emissions arising from crop production were quantified. The present study focused on whether agricultural use of sewage sludge and digestate could be considered an option to improve the C footprint of sorghum production. Biosolids—sewage sludge and digestate—could be recognized as a nutrient substitute without crop yield losses. Nitrogen application had the greatest impact on the external GHG emissions and it was responsible for 54% of these emissions. CO2eq emissions decreased by 14 and 11%, respectively, when sewage sludge and digestate were applied. This fertilization practice represents a promising strategy for low C agriculture and could be recommended to provide sustainable sorghum production as a bioenergy crop to mitigate GHG emissions.
1. Introduction
Sustainable agricultural systems should be economically profitable, but they should also provide food, feed, and biofuels and prevent or even enhance ecosystem services [1]. In recent years, the agricultural sector has become increasingly heavily dependent on mainly non-renewable energy sources. One of the challenges for sustainable crop production is to decrease the external energy inputs [2]. Among the key issues for agricultural sustainability is greenhouse gas (GHG) emissions as well as their effect on climate [3]. Agricultural production has a significant impact on climate change [4]. Emissions from the agricultural sector in the European Union were estimated at 432 million tons of CO2 equivalents (CO2eq) in 2017 and this was responsible for emitting 10% of the total amount of European GHG emissions [5]. Effective methods (i.e., methods which have the potential to mitigate emissions in agriculture) need development, because current decreases in these areas of emission levels are insufficient [6]. However, development of the following methods for carbon (C) reduction in agriculture are promising: precision farming; improved fertilization management; cultivation of crops with a higher potential for C sequestration (i.e., C4 photosynthesis cycle crops); and lastly, but not all-inclusively, the implementation of organic fertilizers and alternative soil amendments to replace synthetic fertilizers [7,8].
Varied management practices have different impacts on GHG emissions and crops cultivation and therefore they should be examined [9]. The detailed estimation of GHG emissions from the agricultural sector allows for the identification of hot-spots, which provide information about which input causes the most significant effect on climate change due to the release of GHG [10]. The amounts of carbon dioxide (CO2), methane (CH4), and nitrous oxide (N2O) emissions from various sources are converted to one unit, such as kilograms of CO2 eq, emitted to the atmosphere and this is defined as the C footprint [11]. The C footprint can be quantified on a land-area basis as a spatial C footprint, on an output basis defined as per yield unit of produced biomass C footprint or on a produced energy basis [12,13].
In the European Union in 2009, legislation in the form of Renewable Energy Directives provided the criteria for biofuels [14,15]. These two legislative acts state that dedicated energy crops cultivation is one of the three main stages of biofuels production which should be taken into account during GHG emission quantification [16]. Carbon footprint calculators, which take into account the LCA approach represent useful tools for estimating GHG emissions from cultivation of crops for energy purposes. A detailed overview of a wide range of these calculators was provided by Peter et al. [10]. One such calculator—BioGrace (Biofuel Greenhouse Gas Emissions in Europe)—was used in the present study to quantify GHG emissions from energy crops such as sweet sorghum (Sorghum bicolor (L.) Moench) at farm stage [17]. This calculation tool is approved and recommended by the two key European Directives as a method to harmonize calculations of biofuel GHG emissions and support implementation of European directives [14,15] into national laws [16]. BioGrace was developed by economic operators for consultants and politicians to improve decision-making and for implementation of national programs aimed at decreasing GHG emissions [10,16]. It is also a useful tool for farmers, who can check how different management practices affect the carbon footprint of biofuel production [10]. The method of GHG estimation offered by the BioGrace tool is based on standard conversion values, which are mainly emission factors, and also other data that are needed to convert some agricultural inputs into emissions [16]. The Tier 1 approach with national or global standard values was used in this study. The country specific emission values allow improvement of these calculations according to the Tier 1 approach [18].
Greenhouse gas emissions can be divided into external and on-farm emissions [11]. These emissions are a result of production processes and application of agricultural inputs, such as pesticides, fertilizers, seeds, and combustion of diesel oil during farm operations [8,19]. Production and application of fertilizers is a significant contributor to the emissions of GHG from arable crop production [11,12,20,21]. Crop production should take into account the C footprint of the whole biomass energy production chain, in particular at the farm stage. A more sustainable approach to nitrogen (N) fertilization management has a large potential to decrease GHG emissions from energy crop cultivation [10]. There is a great need to focus on more sustainable improvement of soil fertility and optimal use of synthetic N fertilizers. Application of bio-based by-products represents a sustainable waste management method and it provides recycling nutrients for crop growth, which is in line with the European policy for a circular economy [2,22,23,24]. Results of studies concerning the environmental impact of digestate vary significantly throughout the literature. Agricultural use of digestate, which is a stable organic waste material, has the potential to decrease soil CO2eq emissions [25]. However, there is an environmental risk associated with increasing N2O volatilization [26]. Some authors have noted especially high N2O emissions, when liquid digestate is applied in moderately wet soil [27,28]. This significant loss of N2O can negate any benefits from replacing synthetic fertilizers with digestate [28]. Pezzolla et al. [29] obtained different results and suggest that the digestate can be used as a fertilizer to grow crops without any harmful effect on the agroecosystem, including GHG emissions. However, data about the impact of sewage sludge application as a soil amendment on the C footprint of crop cultivation is still lacking.
Biomass use for production of heat, electricity, and fuel has significantly increased in recent years [30]. Using energy crops with a high C sequestration potential such as sweet sorghum for energy purposes represents an almost-closed CO2 cycle [8,10]. It is believed that the biofuels production processes give the same amount of CO2eq as was fixed in the biomass through photosynthesis at the production stage of the raw material [31]. However, crop growth generates a certain amount of GHG and therefore it is not the ideal carbon neutral production chain [10,31]. Sweet sorghum represents a promising bioenergy feedstock in the temperate climate of Central Europe [32]. It is still not well understood how energy crop cultivation systems affect GHG emissions. Moreover, so far, there are a limited number of studies on GHG emissions from sorghum production. Storlien et al. [9] examined the effect of various N fertilizer rates, crop rotation, and crop residue managements on GHG emissions from sorghum production for bioenergy purposes. According to their results, N addition significantly increased N2O emissions, and incorporation of half of sorghum residues increased CO2 emissions [9]. Davis et al. [33] recommended the perennial grasses switchgrass (Panicum virgatum L.) and miscanthus (Miscanthus × giganteus Greef et Deuter) for ethanol instead of maize (Zea mays L.) as a cellulosic feedstock for ethanol production. The production of biofuel from these crops characterized by low N demand allows significant mitigation of GHG emissions at the farm stage [33].
Given the aforementioned considerations, the response of sweet sorghum dry matter (DM) yield to biosolids fertilization was evaluated. This study focused on evaluating how sewage sludge and digestate application affect the C footprint of the sorghum production system, compared with conventional fertilization management. This study improves knowledge on the environmental impact of sorghum production with different fertilization managements in regards to the C footprint. It provides insight into the necessity of finding the most sustainable and cleanest methods of crop production for energy purposes.
2. Materials and Methods
2.1. Study Site Description
This study on N fertilization management of sorghum yield and GHG emissions was carried out in the period 2016–2018. It was conducted under field experiment conditions at the Agricultural Research Station of Wroclaw University of Environmental and Life Sciences. This experimental site is located in Central Europe (southwestern Poland; 51°10’25” N and 17°07’02” E). The climate in the study site is classified as temperate [34]. The annual average temperature is 9.0 °C and the annual average rainfall is 583 mm. The monthly temperature and precipitation of the area of research at the time the experiment was carried out were recorded every 10 min using an ‘AsterMet’ meteorological station (A-STER s.c., Krakow, Poland).
Ten soil samples (0.1 kg) from a layer of 30 cm depth were randomly taken from 10 spots across the experimental area (PN-ISO 10381-2). The soil samples were collected before sowing, prior to the field experiment was established. Then, individual samples were mixed to receive one composite sample, air dried and sieved with a mesh size of 2.0 mm. Then, physio-chemical properties of the topsoil (layer of 0–30 cm depth) were assessed. Particle-size distribution was determined by the sieve method (sand fraction) and hydrometer method (silt and clay fractions) after sample dispersion with hexametaphosphate. The soil texture was defined as sand, 0.05–2.0 mm; silt, 0.002–0.05 mm, and clay, <0.002 mm diameter (PN-R-04033 I USDA). pH was measured in distilled water and 1 mol dm−3 KCl solution, at the soil:solution ratio 1:2.5 with a pH meter (Omega Engineering, Inc., Norwalk, USA).
Mineral forms of nitrogen (soluble and exchangeable NH4+ and NO3−) were determined after extraction of fresh soil (stored in a fridge until extraction at −20 ºC temperature) with a 1% solution of K2SO4, at the solution to soil ratio of 5:1 and a shaking time of 1 h. Then, suspensions of each derived sample were prepared by filtration through Whatman 2 filter paper (Whatman International Ltd, Maidstone, UK), followed by storage at −20 °C until analysis. In the filtrate, concentrations of mineral nitrogen forms were measured colorimetrically: N-NO3 with phenoldisulfonic acid, and N-NH4 with potassium sodium tartrate and Nessler’s reagent (UV-Vis spectrometer, Cintra 4040, GBC Scientific Equipment, Braeside, Australia) [35]. The contents of plant-available phosphorus and potassium were analyzed by ICP-OES after Egner–Riehm extraction with calcium lactate (spectrometer Varian Inc. (Part A)—Vista MPX Simultaneous ICP-OES) [35].
2.2. Experimental Materials
Sucrosorgo 506—a late-maturing photoperiod insensitive triple-cross hybrid of sweet sorghum developed by Sorghum Partners Inc. (USA)—was used in this experiment. Stems of this hybrid have a relatively higher concentration of soluble sugars. It is well adapted for Central European conditions and produces a high amount of biomass in moderate climates [36]. Medium maturing, triple-cross hybrid Rona 1 with juicy stems recommended for silage is the result of a Hungarian breeding program (Gabonakutató) [37]. French late-maturing hybrid SuperSile 20 was received from Caussade Semences [38]. Late-maturing Goliath, mainly used for forage, was developed by Saaten Union GmbH (Germany) [39]. These hybrids have been registered in the EU Common Catalogue and were chosen based on the results of previous long-term studies [36].
Commercial urea characterized by 46% N was used in this study. Triple superphosphate with 46% P2O5 content was used as a phosphorus (P) source and potassium salt with 60% K2O content as a potassium (K) fertilizer. Solar dried sewage sludge sourced from a municipal sewage treatment plant in Klodzko operating in EXPOVAL technology was used. Methanogenic post-digestion liquid digestate (termed digestate in this paper) was obtained from a mesophilic biogas plant in Strzelin (Südzucker Polska Inc.) fed with beet pulp. The chemical characteristics of biosolids used for fertilization are given in Table 1.
2.3. Field Treatments and Experimental Design
The experiment had a two-factorial split-plot design including sorghum hybrids and four fertilization managements. Treatments were arranged in a randomized, complete block with four replications. Experimental plots were 12.6 m2 6 × 2.1 m (length × width). The research used four sweet sorghum hybrids: Sucrosorgo 506, Rona 1, SuperSile 20, and Goliath.
Primary tillage was done with a moldboard plow in the fall and with leveling and an aggregate seedbed preparation in the spring. The seeds of sweet sorghum hybrids were sown on 6 May 2016, 5 May 2017, and 15 May 2018. The annual N input of 100 kg N ha−1 was provided by broadcast application before sowing of (1) 19 t ha−1 sewage sludge, (2) 45 m3 ha−1 digestate, and (3) 220 kg ha−1 urea. Unfertilized plots were also included in the experimental work. The rates of potassium and phosphorus were as follows: 100 kg ha−1 in the form of K2O and 70 kg ha−1 of P2O5. These fertilizers were provided by single broadcast pre-sowing application and then were mixed with topsoil using a rotary harrow. Additional surrounding plots were set to minimize boundary effects through edges of the experimental field. Lumax 537.5 SE (s-metolachlor 312.5 g·dm−3 + mesotrione 37.5 g·dm−3 + terbuthylazine 187.5 g·dm−3) at the dose of 2.0 dm3·ha−1 was post-sowing, pre-emergency applied for weed control. Safener Concep III (oxabetrinil 700 g kg−1) was used to avoid injuries to sorghum plants caused by the phytotoxic effects of s-metolachlor.
Before harvest, five representative plants from the middle row within each plot were collected and the aggregate sample was cut using a bowl chopper (Krag). The sample of shredded biomass was weighed and oven-dried at 105 °C until reaching constant mass. The moisture content was gravimetrically determined and the DM ratio was calculated (PN-EN 12880:2004).
The plants were mechanically harvested with a brush cutter (Stihl FS400 C, Germany) on 23 September 2016, 20 September 2017, and 11 October 2018. To estimate the fresh matter yield, the sorghum biomass was weighed just after harvest and the biomass production per hectare was extrapolated (Mg ha−1). Harvesting losses were also included in calculations.
2.4. CO2 Emission Determination and Carbon Footprint Calculation
The system boundaries for the carbon footprint calculation within the scope of this study are presented in Figure 1.
Calculations were performed based on Intergovernmental Panel on Climate Change methodology [18,40,41]. The main assumptions are given in Table 2. The quantification of GHG emissions was made according to ISO TS 14067 [42]. The freely available BioGrace Excel GHG calculation tool was used to estimate the C footprint of sorghum production [17]. Standard values containing conversion factors and LHV (lower heating values) from the database developed by IPCC were used for computing GHG emissions [43]. Other sources of emission factors are included in Table 3. The climate was classified as cold temperate and dry, and soil conditions were classified as sandy, in accordance with IPCC methodology. The environmental impact of different fertilization managements was assessed by estimating the spatial- and yield-scaled C footprint, expressed as kg CO2eq ha−1 and kg CO2eq Mg−1 DM produced, respectively. The assessment covers the major greenhouse gas emissions (CO2, N2O, and CH4) generated during all major processes: from input materials for crop production, through the on-farm crop cultivation, to the field-gate. Analysis included both direct and indirect N2O emissions. The following sources of direct N2O emissions were incorporated into the analysis: N synthetic fertilizer, organic N applied as soil amendments (digestate and sewage sludge), and N in sorghum residues. Indirect N2O was related to the atmospheric deposition of N volatilized from leaching and runoff, and CO2 from urea fertilization.
The GHG emissions were divided into two categories: (1) external emissions associated with production and transport of farm inputs, such as fertilizers, pesticides, and seeds and (2) on-site emissions including tractors and machinery fuel consumption during farm practices, and direct and indirect N2O emissions. The GHG emissions from diesel oil consumption included all the operations of farm machinery used for various crop production activities, such as tillage, fertilizer and herbicide application, and sowing and harvesting. Annual CO2eq emissions from urea application associated with the loss of CO2eq during the industrial production process were calculated in the present study. Emissions related to soil C stock changes were included in the total C footprint of the farm. Quantification of GHG emissions was computed with emission factors according to the values shown in Table 3. Greenhouse gas emissions generated outside the farms (in wastewater treatment plants and during the biogas production process) were not considered. However, the analysis included emissions related to the application of sewage sludge and digestate and direct N2O emissions due to N losses from soil fertilized with these kinds of organic amendments. According to IPCC methodology, it was assumed that there is no net accumulation of biomass C stocks. The change in biomass was not estimated, because for annual crops the increase in biomass stocks in a single year is equal to biomass losses from harvest and mortality in this year [41].
Conversion from N2O-N emissions to N2O was done by multiplication by 44/28. Emissions of CO2, CH4, and N2O were quantified taking into account their 100-year global warming potentials (GWP), i.e., 1 for CO2, 28 for CH4, and 265 for N2O. As recommended by IPCC, the most recent values of the 100-year time horizon GWP relative to CO2 were used in this study, adapted from IPCC Fifth Assessment Report [44].
2.5. Statistical Analyses
The normal distribution of the obtained data was checked with the Shapiro–Wilk test [46]. An analysis of variance (ANOVA) was performed to assess the statistical significance of the sorghum biomass yield and C footprint. The parameter averages were estimated across four plot replications. Treatment averages separation was carried out using the Tukey test at the probability level of α = 0.05 [47]. The four tested fertilization managements were considered fixed factors and the four replications were entered as random effects [48]. The Levene test at P level < 0.05 was used for evaluation of the variance homogeneity. The Statistica software package (version 13.1 StatSoft, Poland) was used to carry out statistical analyses [49].
3. Results
3.1. Weather and Soil Conditions
In 2016, 2017, and 2018, the average temperatures during the sweet sorghum growing season were higher than the 30-year average: 0.8, 0.2, and 1.9 °C, respectively (Table 4). The period from August to September 2018 was characterized by the highest average temperature, which was 2.3 °C higher than the multiyear mean. In each experimental year, the total rainfall during the vegetation period was lower than the 30-year average: 74.6, 12.5, and 81.9 mm, respectively, for 2016, 2017, and 2018 (Table 4). Extremely adverse weather conditions with drought occurred at the beginning of the sorghum vegetation period in May 2016, when total precipitation was 90% lower than the 30year average. In 2017, both average temperature and precipitation were close to the long-term average temperature and rainfall sum.
The experimental site is composed of loamy sand textured soils, originally classified as Brunic Arenosols soil (IUSS Working Group WRB, 2014). The soil was characterized by a thick (30–34 cm) humus layer and slightly acidic pH (6.0). The soil has a high content of nitrate and ammonium nitrogen, available phosphorus, and plant available form of potassium (Table 5). The soil is well-drained with the water table at 130 cm depth.
3.2. Sorghum Biomass Yield
The results of sorghum biomass DM yield and C footprint are shown in Table 6. The analysis of variance showed that the DM yield production was not significantly affected by interaction between experimental factors considered in the study. The average sorghum DM yields ranged from 10.5 for non-fertilized SuperSile 20 to 23.6 Mg ha−1 for Sucrosorgo 506 fertilized with sewage sludge. In the case of each sorghum hybrid, the lowest biomass yield was produced by control plants. Hybrids produced significantly different biomass yields. Sucrosorgo 506 was characterized by the highest productivity in the study area. Dry matter yield of Sucrosorgo 506 was 35% higher than the yield of SuperSile 20, which produced the lowest yield of the four tested hybrids (Table 6). Both sewage sludge and digestate application significantly increased the yields across the hybrids, which were 45% and 28% higher than that for the control. The yields of sweet sorghum biomass were significantly different in the experimental period. In 2017, DM yield was 24.3% and 41.6% higher than in 2016 and 2018, respectively.
3.3. Carbon Footprint of Sorghum Per Area and Per Mg of Biomass
Averaged over the three years, a significant effect of both tested factors on spatial C footprint was reported in this study. The cultivation of sorghum without N fertilizer application resulted in the lowest CO2eq per unit of area and per unit of biomass yield; in particular, in the case of the three hybrids: Rona 1, Goliath, and SuperSile 20. Irrespective of fertilization treatments, the highest yielding hybrid, Sucrosorgo 506, emitted the highest amount of GHG per hectare. Emissions from field production of this hybrid were 16% higher than those from cultivation of SuperSile 20, which was characterized by the lowest yield and the lowest area-scaled C footprint. The spatial C footprint was significantly affected by fertilization management systems. The application of waste products caused a decrease in GHG emissions compared to conventional fertilization. The application of sewage sludge and digestate resulted in 6% and 10% lower CO2eq emissions per ha, respectively, compared with the use of urea. The control sorghum plants produced the lowest amount of GHG. The spatial C footprint varied greatly during the period of the experiment. In 2017 and 2018, this was at a comparable level, which was on average 12.5% higher than in 2016.
The yield-scaled C footprint expressed as a CO2eq per Mg DM of yield produced presented a quite narrow range from 88 to 147 kg CO2eq Mg−1 DM, without significant differences between the interactions of tested factors. Greenhouse gas emissions per Mg of biomass were the highest from SuperSile 20 hybrid cultivation, which was characterized by the lowest biomass yield. Across the hybrids, the effect of fertilization treatment was the same as for spatial C footprint, with the highest value for urea application. Application of sewage sludge and digestate provided, respectively, 14% and 11% lower emissions of GHG than from the use of urea. Across all hybrids and fertilization treatments, differences between years were also significant. In 2016, sorghum cultivation emitted higher amounts of GHG per Mg of produced biomass compared to 2017 and 2018.
3.4. Structure of Inputs Share of Carbon Footprint
Across all the hybrids and years, the share of varied inputs in the C footprint is presented for each fertilization treatment in Figure 2. When the emissions were averaged across all hybrids, the largest contributor to the total amount of GHG emissions was the combination of direct and indirect N2O emissions, which ranged from 56% to 63% of the total emissions and from 10% to 17%, respectively, for direct and indirect N2O emissions. An increase in direct N2O emissions was observed when sorghum was fertilized with sewage sludge and digestate (Figure 2C,D). When urea was applied as the N source, it was responsible for 13% of the total GHG emission and this was the second largest contributor to the C footprint. Diesel combustion during various farming operations (such as soil tillage, sowing, herbicide spraying, fertilizer application, harvesting, etc.) was responsible for relatively high GHG emissions and its contribution to the C footprint of sorghum production was estimated at 13–22%. Carbon dioxide equivalents emissions related to the use of P and K fertilizers, seeds and herbicide had the lowest contribution to the total GHG emission and on average they all accounted for from 5% to 9% (Figure 2A–D).
3.5. External and On-Site Emissions
The sources of external GHG emissions are shown in Figure 3. In the analysis, the following sources of external emission were included: manufacture, transportation, storage, and delivery of agricultural inputs to the farm gate. The use of N fertilizer was responsible for 54% of external emissions and dominated in terms of the external GHG emissions. Consequently, the external emissions from sorghum fertilized with urea were 2.2 times higher than emissions from treatments fertilized with sewage sludge and digestate (Figure 3).
As an average of four hybrids and three years, on-site emissions made a significantly higher contribution to the total GHG emission, because these were from 8 to 17 times higher than external emissions (Figure 3 and Figure 4). Direct N2O was responsible for the largest amount of emitted GHG in each fertilization treatment. Averaged over three years, diesel consumption was the second largest contributor to the C footprint at the farm level. On-farm emissions from unfertilized sorghum were 27%, 19%, and 22% lower compared to those from sorghum fertilized in a conventional way and by application of sewage sludge and digestate as soil amendments, respectively. On-site emissions were similar between fertilization treatments that used synthetic N or biosolids as a source of nutrients (Figure 4).
4. Discussion
4.1. Biomass Yield
The DM biomass yield of Rona 1 fertilized with urea recorded in this study (15.0 Mg ha−1) was similar to that reported in a previous study carried out under the same environmental conditions (15.2 Mg ha−1) [36]. In previous research at the same experimental site, a lower DM yield for sweet sorghum hybrid Sucrosorgo 304 fertilized with urea compared to the yield of Sucrosorgo 506 was reported [49]. Irrespective of the hybrids, application of bio-based waste products provided a biomass yield statistically comparable to that for crops fertilized in a conventional way with urea. These observations are in line with the findings of Kołodziej et al. [23], who reported that application of sewage sludge enhanced yields of Sucrosorgo 506 and Rona 1. Similarly, Akdeniz et al. [50] recorded an increase in sorghum DM yield as a response to sewage sludge application. Our findings are congruent with the results of Verdi et al. [51], who found no differences between the yield of crops fertilized with digestate and urea. In another study conducted in southwestern Germany, it was found that digestate could be an adequate substitute for mineral fertilizer in sweet sorghum production [52]. The same reaction of sorghum plants to biosolids application was noted by Sigurnjak et al. [53] in a study carried out in the Czech Republic under similar weather conditions. Digestate can be considered a synthetic N substitute without crop yield losses [54]. The biomass yields were significantly different across the years of the experiment. This was probably associated with the varied weather conditions.
4.2. Carbon Footprint
Results indicated that greenhouse gas emissions varied considerably between the fertilization treatments. Both the CO2eq emitted to produce a metric ton of biomass and emissions per area unit decreased when sewage sludge and digestate were applied. Styles and Jones [55] reported that production of miscanthus biomass for energy purposes resulted in GHG emissions of 1938 kg CO2eq per hectare. This lower value can be associated with the lower N demand of miscanthus [33].
The application of synthetic fertilizer is the main source of external GHG emissions from sorghum production. Similar results were obtained in a study conducted by Plaza-Bonilla et al. [11], who reported the great impact of N fertilization on external emissions. Most of the C footprint is associated with N fertilizer production and use [19]. Storlien et al. [9] reported a significant impact of N fertilization on CO2 and N2O emissions from sweet sorghum, especially at the beginning of the growing season in each year of the experiment.
Lower emissions from the production of sorghum using biosolids were associated with the lower reliance on the external input of synthetic fertilizer. Considering the CO2eq quantity emitted into the atmosphere for synthetic fertilizers production, partial or total fertilization with digestate provided lower CO2eq emissions [25]. Application of digestate had a relatively lower impact on the emissions of CO2 and CH4 compared to urea [56]. Cumulative N emissions via volatilization showed that digestate could be a promising method of sustainable fertilization management to decrease N losses [51]. However, these research projects pointed out differences between gases emitted by the two kinds of fertilizers: digestate emitted 23% more N2O than urea, but urea emitted 66% more ammonia than digestate [51]. These results are congruent with the findings of Dendooven et al. [26], who reported that emissions of CH4 and CO2 were not affected by fertilization treatments; however, digestate application increased emissions of N2O. It was revealed that combining fresh and more stabilized sewage sludge enabled a decrease in N2O emissions [44,57]. The emissions intensity of GHG from digestate amended soils was lower compared to the use of untreated manure and was at a similar level to those for synthetic fertilizer. However, the researchers pointed out that the agronomic and environmental results related to the impact on crop yield and C footprint cannot simply be predicted on this basis; rather, specific soil and digestate physio-chemical characteristics should also be taken into account [57].
Diesel combustion during farming operations is a significant contributor to global warming potential [12]. Pesticide application accounts for the lowest GHG contribution and this is associated with the low demand of sorghum for plant protection chemicals used for weed, disease, and insect control. Only a low rate of herbicide is needed in sorghum cultivation, which is a new crop in the Central European region and does not yet have natural enemies. Findings of the present study are in line with Plaza-Bonilla et al. [11], who found that emissions related to pesticides represented only 1% of external emissions, as an average of the tested hybrids and years. Sweet sorghum can be recognized as a high-yielding biofuel feedstock with minimal impact on net GHG emissions [58].
5. Conclusions
This study was performed because there is limited information on the allocation of agricultural residues for sweet sorghum as well as for digestate, which is a sub-product of anaerobic digestion. Application of bio-based by-products (sewage sludge and digestate) provided a sorghum biomass yield close to that obtained when conventional synthetic fertilizer was used. Combined direct and indirect CO2eq emissions on the basis of both per unit area and per unit of biomass yield were lower when bio-based waste products were used compared with the application of urea. The present study indicated that the lower GHG emissions resulted from the reduced reliance on synthetic N fertilizers due to their replacement by alternative nutrient sources, such as sewage sludge and digestate. It can be concluded that this fertilization practice can be considered a promising sustainable strategy for low carbon agriculture, which allows the recycling of nitrogen and other nutrients as an element of the circular economy. Biosolids should be recommended for providing sustainable sorghum production as a feedstock for bioenergy to mitigate GHG emissions and global climate change processes. Further research is needed to confirm the suitability of the alternative fertilization management proposed in the present study. This future work should be focused on comparing results based on other available calculation tools. There is a great need to develop local emission factors, which will provide better characteristics of national conditions. The system boundaries can be extended to the production process of bioethanol and methane from sorghum. Moreover, data thus obtained could be compared with results from direct measurements of GHG emissions from soil using chambers placed in the field.
Author Contributions
Conceptualization, L.G. and J.S.; methodology, L.G. and J.S.; validation, J.S.; formal analysis, J.S. and L.G.; investigation, L.G. and J.S.; resources, L.G. and J.S.; data curation, L.G.; writing—original draft preparation, L.G.; writing—review and editing, L.G. and J.S.; visualization, L.G.; supervision, J.S.
Funding
This research received no external funding.
Conflicts of Interest
The authors declare no conflict of interest.
References
- Usman, M.; Ibrahim, F.; Oyetola, S.O. Sustainable agriculture in relation to problems of soil degradation and how to amend such soils for optimum crop production in Nigeria. Int. J. Res. Agric. Food Sci. 2018, 4, 1–17. [Google Scholar]
- Brodt, S.; Six, J.; Feenstra, G.; Ingels, C.; Campbell, D. Sustainable Agriculture. Nat. Educ. Knowl. 2011, 3, 1. [Google Scholar]
- Vergé, X.P.C.; De Kimpe, C.; Desjardins, R.L. Agricultural production, greenhouse gas emissions and mitigation potential. Agric. Meteorol. 2007, 142, 255–269. [Google Scholar] [CrossRef]
- IPCC. Climate Change 2014: Synthesis Report. Contribution of Working Groups I, II and III to the Fifth Assessment Report of the Intergovernmental Panel on Climate Change; Core Writing Team, Pachauri, R.K., Meyer, L.A., Eds.; IPCC: Geneva, Switzerland, 2014. [Google Scholar]
- EEA. Trends and Projections in Europe 2018. Tracking Progress towards Europe’s Climate and Energy Targets; European Environment Agency report 16/2018; Publications Office of the European Union: Luxembourg, 2018. [Google Scholar]
- Muñoz, C.; Paulino, L.; Monreal, C.; Zagal, E. Greenhouse Gas (CO2 AND N2O) Emissions from Soils: A Review. Chil. J. Agric. Res. 2010, 70, 485–497. [Google Scholar] [CrossRef]
- Frank, S.; Havlík, P.; Soussana, J.F.; Levesque, A.; Valin, H.; Wollenberg, E.; Kleinwechter, U.; Fricko, O.; Gusti, M.; Herrero, M.; et al. Reducing greenhouse gas emissions in agriculture without compromising food security? Environ. Res. Lett. 2017, 12, 105004. [Google Scholar] [CrossRef]
- Sosulski, T.; Rutkowska, B.; Szczepaniak, J.; Szulc, W.; Skowrońska, M. Impact of reduced tillage on CO2 emission from soil under maize cultivation. Soil Tillage Res. 2018, 180, 21–28. [Google Scholar] [CrossRef]
- Storlien, J.O.; Hons, F.M.; Wight, J.P.; Heilman, J.L. Carbon Dioxide and nitrous oxide emissions impacted by bioenergy sorghum management. Soil Sci. Soc. Am. J. 2014, 78, 1694–1706. [Google Scholar] [CrossRef]
- Peter, C.; Helming, K.; Nendel, C. Do greenhouse gas emission calculations from energy crop cultivation reflect actual agricultural management practices? —A review of carbon footprint calculators. Renew. Sustain. Energy Rev. 2017, 67, 461–476. [Google Scholar] [CrossRef]
- Plaza-Bonilla, D.; Nogué-Serra, I.; Raffaillac, D.; Cantero-Martínez, C.; Justes, É. Carbon footprint of cropping systems with grain legumes and cover crops: A case-study in SW France. Agric. Syst. 2018, 167, 92–102. [Google Scholar] [CrossRef]
- Yadav, G.S.; Das, A.; Lal, R.; Babu, S.; Meena, R.S.; Saha, P.; Singh, R.; Datta, M. Energy budget and carbon footprint in a no-till and mulch based rice–mustard cropping system. J. Clean. Prod. 2018, 191, 144–157. [Google Scholar] [CrossRef]
- Bos, J.F.F.P.; De Haan, J.; Sukkel, W.; Schils, R.L.M. Energy use and greenhouse gas emissions in organic and conventional farming systems in the Netherlands. NJAS Wagening. J. Life Sci. 2014, 68, 61–70. [Google Scholar] [CrossRef] [Green Version]
- European Parliament and Council. Directive 2009/30/EC of 23 April 2009 as Regards the Specification of Petrol, Diesel and Gas-Oil and Introducing A Mechanism to Monitor and Reduce Greenhouse Gas Emissions. 2009. Available online: http://eurlex.europa.eu/LexUriServ/LexUriS (accessed on 6 February 2019).
- European Parliament and Council. Directive 2009/28/EC of 23 April 2009 on the Promotion of the Use of Energy from Renewable Sources. 2009. Available online: http://eurlex.europa.eu/LexUriServ/LexUriServ.do?uri=OJ:L:2009:140:0016:0062:EN:PDF (accessed on 12 January 2019).
- Hennecke, A.M.; Faist, M.; Reinhardt, J.; Junquera, V.; Neeft, J.; Fehrenbach, H. Biofuel greenhouse gas calculations under the European Renewable Energy Directive–A comparison of the BioGrace tool vs. the tool of the Roundtable on Sustainable Biofuels. Appl. Energy 2013, 102, 55–62. [Google Scholar] [CrossRef]
- BioGrace Software. Available online: http://www.biograce.net (accessed on 23 February 2019).
- IPCC. Chapter 11: N2O Emissions from Managed Soils, and CO2 Emissions from Lime and Urea Application. In IPCC Guidelines for National Greenhouse Gas Inventories; Institute for Global Environmental Strategies (IGES): Kanagawa, Japan, 2006; pp. 11.1–11.54. [Google Scholar]
- Shen, Y.; Sui, P.; Huang, J.; Wang, D.; Whalen, J.K.; Chen, Y. Global warming potential from maize and maize-soybean as affected by nitrogen fertilizer and cropping practices in the North China Plain. Field Crops Res. 2018, 225, 117–127. [Google Scholar] [CrossRef]
- Camargo, G.G.T.; Ryan, M.R.; Richard, T.L. Energy Use and Greenhouse Gas Emissions from Crop Production Using the Farm Energy Analysis Tool. Bioscience 2013, 63, 263–273. [Google Scholar] [CrossRef] [Green Version]
- Bartocci, P.; Fantozzi, P.; Fantozzi, F. Environmental impact of Sagrantino and Grechetto grapes cultivation for wine and vinegar production in central Italy. J. Clean. Prod. 2017, 140, 569–580. [Google Scholar] [CrossRef]
- COM. Proposal for a Regulation of the European Parliament and of the Council Laying Down Rules on the Making Available on the Market of CE Marked Fertilising Products and Amending Regulations (EC) No 1; 157 final, 17.3.2016 2016/0084 (COD); COM: Brussels, Belgium, 2016. [Google Scholar]
- Kołodziej, B.; Antonkiewicz, J.; Stachyra, M.; Bielińska, E.J.; Wiśniewski, J.; Luchowska, K.; Kwiatkowski, C. Use of sewage sludge in bioenergy production—A case study on the effects on sorghum biomass production. Eur. J. Agron. 2015, 69, 63–74. [Google Scholar] [CrossRef]
- Ho, A.; Ijaz, U.Z.; Janssens, T.K.S.; Ruijs, R.; Kim, S.Y.; de Boer, W.; Termorshuizen, A.; van der Putten, W.H.; Bodelier, P.L.E. Effects of bio-based residue amendments on greenhouse gas emission from agricultural soil are stronger than effects of soil type with different microbial community composition. Gcb Bioenergy 2017, 9, 1707–1720. [Google Scholar] [CrossRef]
- Maucieri, C.; Nicoletto, C.; Caruso, C.; Sambo, P.; Borin, M. Effects of digestate solid fraction fertilisation on yield and soil carbon dioxide emission in a horticulture succession. Ital. J. Agron. 2017, 12, 116–123. [Google Scholar] [CrossRef]
- Dendooven, L.; Fernández-Luqueño, F.; Paredes-López, O.; Hernández, G.; Pampillón-González, L.; Franco-Hernández, O.; Luna-Guido, M.; Ruíz-Valdiviezo, V.M. Greenhouse Gas Emissions and Growth of Wheat Cultivated in Soil Amended with Digestate from Biogas Production. Pedosphere 2017, 27, 318–327. [Google Scholar] [CrossRef]
- Juárez-Rodríguez, J.; Fernández-Luqueño, F.; Conde, E.; Reyes-Varela, V.; Cervantes-Santiago, F.; Botello-Alvarez, E.; Cárdenas-Manríquez, M.; Dendooven, L. Greenhouse gas emissions from an alkaline saline soil cultivated with maize (Zea mays L.) and amended with anaerobically digested cow manure: A greenhouse experiment. J. Plant Nutr. 2012, 35, 511–523. [Google Scholar] [CrossRef]
- Walsh, J.J.; Jones, D.L.; Edwards-Jones, G.; Williams, A.P. Replacing inorganic fertilizer with anaerobic digestate may maintain agricultural productivity at less environmental cost. J. Plant Nutr. Soil Sci. 2012, 175, 840–845. [Google Scholar] [CrossRef]
- Pezzolla, D.; Bol, R.; Gigliotti, G.; Sawamoto, T.; López, A.L.; Cardenas, L.; Chadwick, D. Greenhouse gas (GHG) emissions from soils amended with digestate derived from anaerobic treatment of food waste. Rapid Commun. Mass Spectrom. 2012, 26, 2422–2430. [Google Scholar] [CrossRef]
- Allen, B.; Kretschmer, B.; Baldock, D.; Menadue, H.; Nanni, S.; Tucker, G. Space for Energy Crops—Assessing the Potential Contribution to Europe’s Energy Future; Report Produced for BirdLife Europe; European Environmental Bureau and Transport & Environ: Brussels, Belgium, 2014. [Google Scholar]
- Brentrup, F.; Palliere, C. Energy efficiency and greenhouse gas emissions in European nitrogen fertilizer production and use. Fertil. Eur. 2008, 639, 25. [Google Scholar]
- Chmielewska, J.; Sowiński, J.; Foszczyńska, B.; Szydełko-Rabska, E.; Kawa-Rygielska, J. Production of bioethanol from sweet sorghum juices with varying content of mineral compounds. Przem. Chem. 2014, 93, 999–1001. [Google Scholar]
- Davis, S.C.; Parton, W.J.; Del Grosso, S.J.; Keough, C.; Marx, E.; Adler, P.R.; Delucia, E.H. Impact of second-generation biofuel agriculture on greenhouse-gas emissions in the corn-growing regions of the US. Front. Ecol. Environ. 2012, 10, 69–74. [Google Scholar] [CrossRef]
- Dubicki, A.; Dubicka, M.; Szymanowski, M. Klimat Wrocławia. In Środowisko Wrocławia-Informator; Smolnicki, K., Szykasiuk, M., Eds.; Dolnośląska Fundacja Ekorozwoju: Wrocław, Poland, 2002; pp. 9–20. (In Polish) [Google Scholar]
- Szczepaniak, W. Metody Instrumentalne w Analizie Chemicznej; PWN: Warszawa, Poland, 2005. (In Polish) [Google Scholar]
- Sowiński, J.; Szydełko-Rabska, E. Comparison of sorghum type yielding in Polish conditions. Ann. Univ. Mariae Curie-Skłodowska Lub. Pol. Sect. E 2013, LXVIII, 30–40. (In Polish) [Google Scholar]
- Hybrid Characteristic. Available online: https://www.gabonakutato.hu/en/our-seeds/sorghum/silage-sorghum/rona-1 (accessed on 13 January 2019).
- Hybrid Characteristic. Available online: https://www.caussade-nasiona.pl/sorgo-trawa-sudanska/ (accessed on 17 January 2019).
- Hybrid Characteristic. Available online: https://www.benelux.saaten-union.com/index.cfm?m=varieties&p=325,1683,html (accessed on 17 January 2019).
- IPCC (Intergovernmental Panel on Climate Change). Chapter 3. Mobile combustion. In Guidelines for National Greenhouse Gas Inventories; Institute for Global Environmental Strategies (IGES): Kanagawa, Japan, 2006; Volume 2, Energy; Available online: https://www.ipcc-nggip.iges.or.jp/public/2006gl/vol2.html (accessed on 23 February 2019).
- IPCC (Intergovernmental Panel on Climate Change). Cropland. In IPCC Guidelines for National Greenhouse Gas Inventories. Agriculture, Forestry and Other Land Use; Institute for Global Environmental Strategies (IGES): Kanagawa, Japan, 2006; Volume 4, Available online: http://www.ipcc-nggip.iges.or.jp/public/2006gl/vol4.h (accessed on 15 January 2019).
- ISO. ISO/TS 14067: Greenhouse Gases e Carbon Footprint of Products e Requirements and Guidelines for Quantification and Communication; International Organization for Standardization: Geneva, Switzerland, 2013. [Google Scholar]
- BioGrace List of Standard Values, Version 4. Available online: http://www.biograce.net/content/ghgcalculationtools/standardvalues (accessed on 11 January 2019).
- Nielsen, S.; Bruun, S.; Bekiaris, G.; Gómez-Muñoz, B.; Larsen, J.D.; Jensen, L.S.; Scheutz, C. Nitrogen mineralisation and greenhouse gas emission from the soil application of sludge from reed bed mineralisation systems. J. Environ. Manag. 2017, 203, 59–67. [Google Scholar] [CrossRef]
- West, T.O.; Marland, G. A synthesis of carbon sequestration, carbon emissions, and net carbon flux in agriculture: Comparing tillage practices in the United States. Agric. Ecosyst. Environ. 2002, 91, 217–232. [Google Scholar] [CrossRef]
- Ghasemi, A.; Zahediasl, S. Normality tests for statistical analysis: A guide for non-statisticians. Int. J. Endocrinol. Metab. 2012, 10, 486. [Google Scholar] [CrossRef]
- Pazderu, K.; Hodoval, J.; Urban, J.; Pulkrabek, J.; Pacuta, V.; Adamcik, J. The influence of sweet sorghum crop stand arrangement on biomass and biogas production. Plant Soil Environ. 2014, 60, 433–438. [Google Scholar] [CrossRef]
- Maharjan, B.; Rosen, C.J.; Lamb, J.A.; Venterea, R.T. Corn response to nitrogen management under fully-irrigated vs. water-stressed conditions. Agron. J. 2016, 108, 2089. [Google Scholar] [CrossRef]
- Sowiński, J.; Głąb, L. The effect of nitrogen fertilization management on yield and nitrate contents in sorghum biomass and bagasse. Field Crops Res. 2018, 227, 132–143. [Google Scholar] [CrossRef]
- Akdeniz, H.; Yilmaz, I.; Bozkurt, M.A.; Keskin, B. The effects of sewage sludge and nitrogen applications on grain sorghum grown (Sorghum vulgare L.) in Van-Turkey. Pol. J. Environ. Stud. 2006, 15, 19–26. [Google Scholar]
- Verdi, L.; Kuikman, P.J.; Orlandini, S.; Mancini, M.; Napoli, M.; Dalla Marta, A. Does the use of digestate to replace mineral fertilizers have less emissions of N2O and NH3? Agric. Meteorol. 2019, 269–270, 112–118. [Google Scholar] [CrossRef]
- Formowitz, B.; Fritz, M. Biogas Diegstate as Organic Fertilizer in Different Crop Rotations. In Proceedings of the 18th European Biomass Conference and Exibition, Lyon, France, 3–7 May 2010; pp. 224–229. [Google Scholar]
- Jaša, S.; Badalíková, B.; Červinka, J. Influence of Digestate on Physical Properties of Soil in Zd Budišov. Acta Univ. Agric. Silvic. Mendel. Brun. 2019, 67, 75–83. [Google Scholar] [CrossRef]
- Sigurnjak, I.; Ryckaert, B.; Tack, F.M.G.; Ghekiere, G.; Meers, E.; Vaneeckhaute, C.; Michels, E. Fertilizer performance of liquid fraction of digestate as synthetic nitrogen substitute in silage maize cultivation for three consecutive years. Sci. Total Environ. 2017, 599–600, 1885–1894. [Google Scholar] [CrossRef]
- Styles, D.; Jones, M.B. Energy crops in Ireland: Quantifying the potential life-cycle greenhouse gas reductions of energy-crop electricity. Biomass Bioenergy 2007. [Google Scholar] [CrossRef]
- Czubaszek, R.; Wysocka-Czubaszek, A. Emissions of carbon dioxide and methane from fields fertilized with digestate from an agricultural biogas plant. Int. Agrophysics 2018, 32, 29–37. [Google Scholar] [CrossRef] [Green Version]
- Baral, K.R.; Labouriau, R.; Olesen, J.E.; Petersen, S.O. Nitrous oxide emissions and nitrogen use efficiency of manure and digestates applied to spring barley. Agric. Ecosyst. Environ. 2017, 239, 188–198. [Google Scholar] [CrossRef]
- Storlien, J.O. The Carbon Footprint of Bioenergy Sorghum Production in Central Texas: Production Implications on Greenhouse Gas Emissions, Carbon Cycling, and Life Cycle Analysis. Ph.D. Thesis, Texas A&M University, College Station, TX, USA, 2013. [Google Scholar]
Figure 1.
System boundaries for the carbon footprint calculation.

Figure 2.
Structure of inputs share of carbon footprint in sorghum production (A) without nitrogen fertilization, fertilized with (B) urea, (C) sewage sludge, and (D) digestate (pooled from 2016, 2017, and 2018).
Figure 2.
Structure of inputs share of carbon footprint in sorghum production (A) without nitrogen fertilization, fertilized with (B) urea, (C) sewage sludge, and (D) digestate (pooled from 2016, 2017, and 2018).

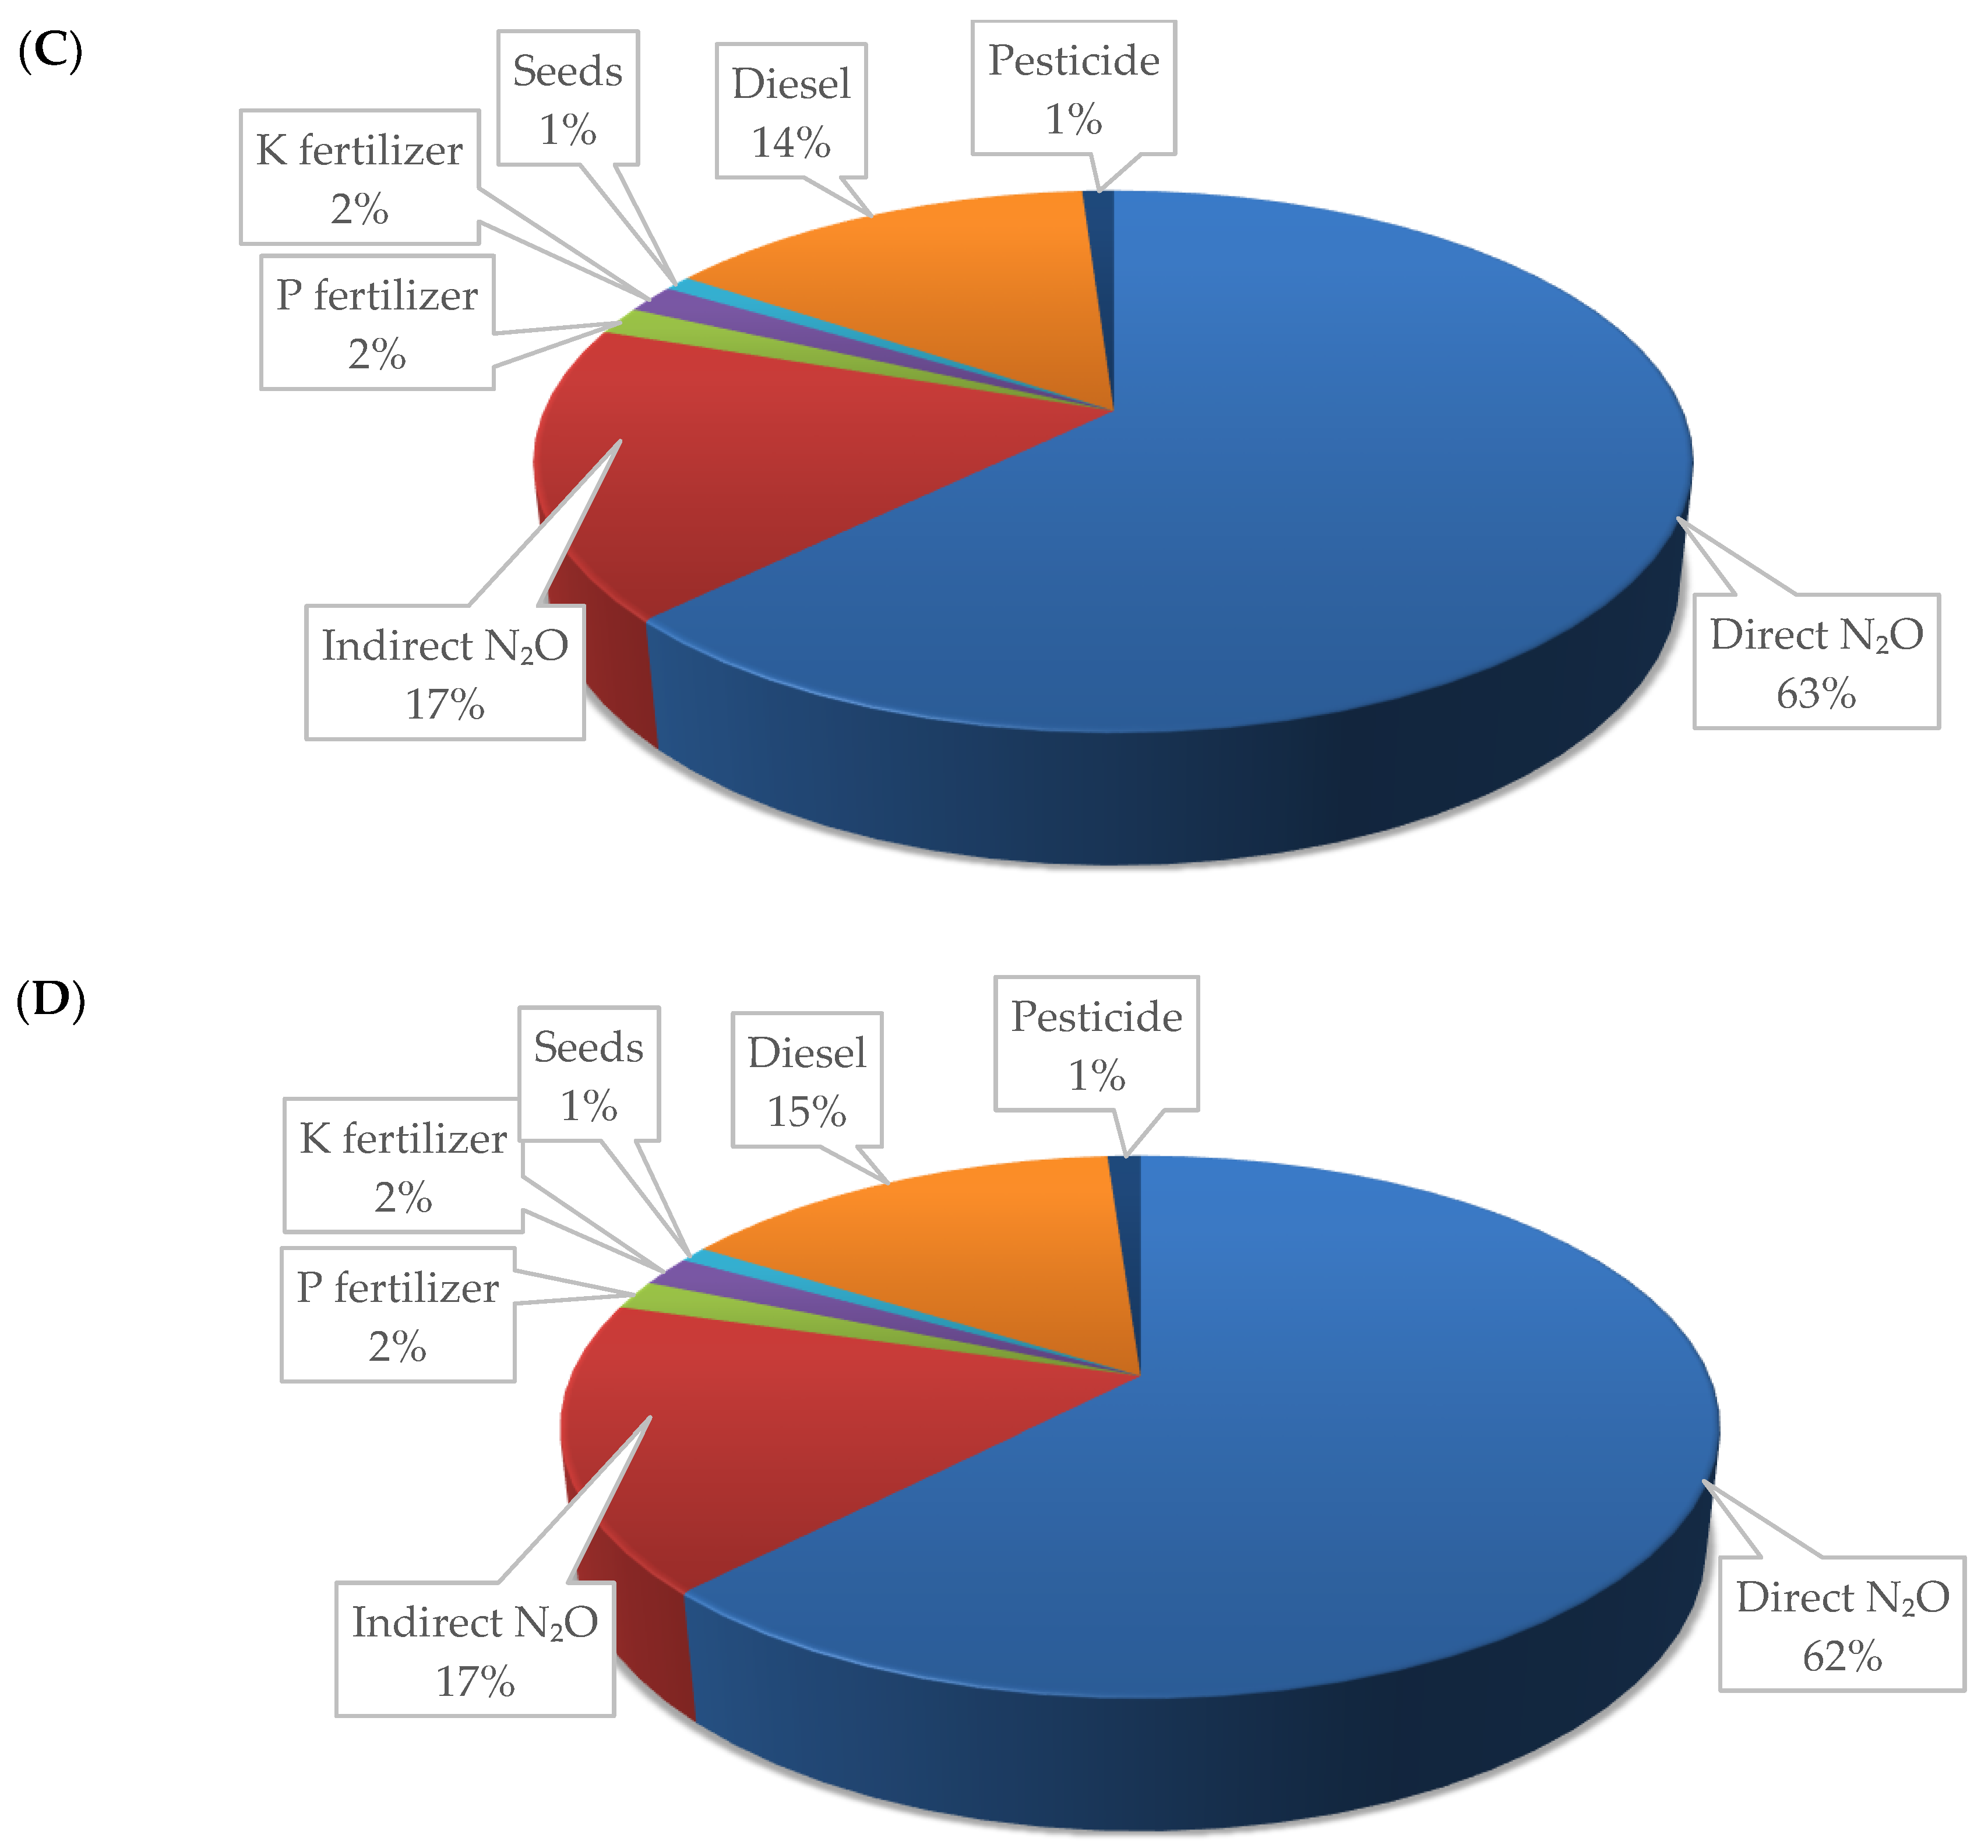
Figure 3.
External emissions of CO2 related to agricultural inputs, such as N, P, and K fertilizers, seeds, and pesticide, as affected by different fertilization managements. Values correspond to the annual average for the 2016–2018 period.
Figure 3.
External emissions of CO2 related to agricultural inputs, such as N, P, and K fertilizers, seeds, and pesticide, as affected by different fertilization managements. Values correspond to the annual average for the 2016–2018 period.

Figure 4.
On-site emissions related to N2O direct and indirect emissions, fuel combustion, and urea hydrolysis from sorghum production as affected by different fertilization managements. Values correspond to the annual average for the 2016–2018 period.
Figure 4.
On-site emissions related to N2O direct and indirect emissions, fuel combustion, and urea hydrolysis from sorghum production as affected by different fertilization managements. Values correspond to the annual average for the 2016–2018 period.


Table 1.
Characteristics of biosolids used as fertilizers in the field experiment.
| Parameters/Chemical Elements with Limit Value for Organic Fertilizer and Organic Soil Improver | Unit | Digestate | Sewage Sludge | Methods |
|---|---|---|---|---|
| pH | 7.6 | 7.4 | PN-EN 12176:2004 | |
| DM (1) | % | 2.8 | 42 | PN-EN 12880:2004 |
| Organic compounds | % DM | 71 | 31.5 | PN-EN 12879:2004 |
| Total nitrogen (N) | 8 | 1.29 | KJ-I-5.4-179 | |
| Ammonia nitrogen N-NH4 | 2 | <0.10 | PN-EN 14671:2007 | |
| Total phosphorus (P) | 0.54 | 1.63 | PN-EN ISO 1185:2009 | |
| Calcium (Ca) | 2.99 | 4.11 | ||
| Magnesium (Mg) | 1.02 | 0.60 | ||
| Potassium (K) | mg kg −1 DM | 1280 | n.a. (2) | PN-EN ISO 1185:2009; PN-EN 13657:2006 |
| Copper (Cu), 200 (3) | 49.6 | 239 | PN-EN ISO 1185:2009 | |
| Zinc (Zn) | 170 | 777 | ||
| Lead (Pb), 120 (3) | 6.13 | 94 | ||
| Cadmium (Cd), 3 (3) | 2.78 | 0.71 | ||
| Chromium (Cr) | 11.2 | 32.9 | ||
| Nickel (Ni), 50 (3) | 11.6 | 24.7 | ||
| Mercury (Hg), 1 (3) | 0.050 | 0.540 | KJ-I-5.4-36 | |
| Salmonella bacteria: | PB/BB/7/F:20.03.2014 | |||
| no Salmonella species in 25 g sample (3) | 0 | 0 |
The results received from Südzucker Polska S.A. and Wodociagi Klodzkie sp. z o.o.; (1) DM dry matter; (2) n.a. not analyzed; and (3) the maximum permissible concentrations of contaminants in organic soil improver in the framework of the Fertilizing Product Regulation Proposal for a Regulation on the making available on the market of CE marked fertilizing products and amending Regulations (EC) No 1069/2009 and (EC) No 1107/2009 [22].
Table 2.
The main assumptions of the study.
| Rule | Description |
|---|---|
| Scope of the study | Calculate the GHG emissions during sweet sorghum production for biofuels (methane and bioethanol) production. |
| System boundary | Farm stage—including external and on-farm greenhouse gas emissions. |
| Functional unit | 1 ton of sorghum biomass. |
| Time reference | One growing season (as an average of three seasons). |
| Data collection—cultivation | The following agricultural operations were included: soil tillage, sowing, fertilization, herbicide application, and harvest. |
| Carbon footprint calculation: | |
| Calculator | BioGrace Excel GHG calculation tool [17] |
| Methods | IPCC 2006 [18,40,41] |
| Norm | ISO14067 [42] |
The table structure was based on [21].
Table 3.
Greenhouse gas emission factors for agricultural inputs and correlated coefficients used in the estimation in this study.
Table 3.
Greenhouse gas emission factors for agricultural inputs and correlated coefficients used in the estimation in this study.
| Description of Emission Factor | Unit | Default Value | References |
|---|---|---|---|
| Emission factor for N2O emissions from N inputs | kg N2O–N kg−1 N input | 0.01 | [18] |
| FracGASF fraction of synthetic fertilizer N that volatilizes as NH3 and NOx, kg N volatilized | % | 10 | |
| FracGASM fraction of applied organic N fertilizer materials that volatilizes as NH3 and NOx, kg N volatilized | 20 | ||
| Emission factor for N2O emissions from atmospheric deposition of N on soils and water surfaces | 1 | ||
| FracLEACH-(H) fraction of all N added to/mineralized in managed soils in regions where leaching/runoff occurs that is lost through leaching and runoff, | 30 | ||
| Emission factor for N2O emissions from N leaching and runoff | 0.75 | ||
| Energy factor for urea production | 20 | ||
| Fuel density (diesel) | kg m−3 | 832 | [17] |
| LHV (diesel) (1) | MJ kg−1 | 43.1 | |
| Emission factor for combustion of Diesel: CO2 diesel | kg TJ−1 | 74100 | [40] |
| Emission factor for combustion of Diesel: CH4 diesel | 4.15 | ||
| Emission factor for combustion of Diesel: N2O diesel | 28.6 | ||
| Energy factor for mesotrione | MJ kg−1 a.i. (2) | 691 | [31] |
| Energy factor for tetrabulazine and atriazine | 208 | ||
| Energy factor for metolachlor and metazachlor | 388 | ||
| Energy factor for pesticide | kg CO2eq MJ−1 | 0.069 | |
| Energy factor for P fertilizer production | kg CO2eq kg−1 fertilizer | 0.26 | |
| Energy factor for K fertilizer production | kg CO2eq kg−1 fertilizer | 0.25 | |
| Emission factor for sorghum seeds | g CO2 eq kg−1 | 0.86 | [45] |
(1) LHV lower heating value; (2) a.i. active ingredient.
Table 4.
Monthly temperature and rainfall in the research area in the period of 2016–2018.
| Month | Taverage (°C) | Rainfall (mm) | ||||||
|---|---|---|---|---|---|---|---|---|
| 2016 | 2017 | 2018 | Long-Term Average 1986–2015 | 2016 | 2017 | 2018 | Long-Term Average 1986–2015 | |
| May | 15.3 | 14.2 | 17.1 | 14.4 | 5.3 | 24.1 | 54.3 | 54.1 |
| June | 18.6 | 18.5 | 18.8 | 17.3 | 44.6 | 52.5 | 36.6 | 67.4 |
| July | 19.5 | 19.0 | 20.1 | 19.6 | 114.3 | 112.2 | 79.1 | 78.9 |
| August | 17.9 | 19.4 | 21.1 | 18.6 | 27.1 | 43.6 | 20.3 | 65.3 |
| September | 16.4 | 13.3 | 15.8 | 13.7 | 44.7 | 65.7 | 38.4 | 44.9 |
| Average temperature or rainfall sum in the period from May to September | 17.5 | 16.9 | 18.6 | 16.7 | 236.0 | 298.1 | 228.7 | 310.6 |
Table 5.
Soil properties (topsoil layer 0–30 depth) at the study site.
| Soil Texture | pH | NO3-N | NH4-N | Pavailable | Kavailable | ||
|---|---|---|---|---|---|---|---|
| % | g kg−1 | mg kg−1 | |||||
| sand: 87 | silt: 5 | clay: 8 | 6.0 | 0.79 | 0.55 | 337.5 | 154.0 |
Table 6.
Dry matter yield and carbon footprint of sorghum production as affected by different fertilization managements (pooled from 2016, 2017, and 2018).
Table 6.
Dry matter yield and carbon footprint of sorghum production as affected by different fertilization managements (pooled from 2016, 2017, and 2018).
| Sorghum Hybrid | Fertilization Treatment | Dry Matter Yield Mg ha−1 | Spatial Carbon Footprint kg CO2eq ha−1 | Yield-Scaled Carbon Footprint kg CO2eqMg−1 |
|---|---|---|---|---|
| Sucrosorgo 506 | control | 17.0 | 1731 b | 88 |
| Urea | 18.9 | 2742 f | 130 | |
| sewage sludge | 23.6 | 2736 f | 111 | |
| digestate | 19.0 | 2498 def | 117 | |
| Rona 1 | control | 10.9 | 1414 a | 96 |
| Urea | 15.0 | 2528 def | 141 | |
| sewage sludge | 15.3 | 2282 cd | 126 | |
| digestate | 15.8 | 2303 cd | 125 | |
| Goliath | control | 12.2 | 1286 a | 109 |
| Urea | 17.9 | 2621 ef | 135 | |
| sewage sludge | 19.6 | 2446 cde | 118 | |
| digestate | 16.9 | 2340 cde | 120 | |
| SuperSile 20 | control | 10.5 | 1412 a | 96 |
| Urea | 13.1 | 2472 def | 147 | |
| sewage sludge | 14.8 | 2301 cd | 124 | |
| digestate | 12.6 | 2180 c | 131 | |
| Average for factors | ||||
| Hybrid * | ||||
| Sucrosorgo 506 | 19.6 c | 2427 b | 111a | |
| Rona 1 | 14.2 ab | 2132 a | 122ab | |
| Goliath | 16.6 b | 2163 ab | 120ab | |
| SuperSile 20 | 12.7 a | 2091 a | 125b | |
| Fertilization treatment ** | ||||
| control | 12.6 a | 1461 a | 97a | |
| urea | 16.2 b | 2590 c | 138c | |
| sewage sludge | 18.3 b | 2441 b | 119b | |
| digestate | 16.1 b | 2330 b | 123b | |
| Average for years *** | ||||
| 2016 | 15.3 b | 2019 a | 133b | |
| 2017 | 20.2 c | 2282 b | 114a | |
| 2018 | 11.8 a | 2265 b | 115a | |
Each value is the average of four replicates. a,b,c For interaction of factors analysis, each individual year and factor, averages with different letters in the same column are significantly different at p < 0.05 according to the results of ANOVA and Tukey’s test. The columns without letters indicate that significant differences were not observed. * Values were averaged across four fertilization treatments and three years. ** Values were averaged across four hybrids and three years. *** Values were averaged across four hybrids and four fertilization treatments.
© 2019 by the authors. Licensee MDPI, Basel, Switzerland. This article is an open access article distributed under the terms and conditions of the Creative Commons Attribution (CC BY) license (http://creativecommons.org/licenses/by/4.0/).
Share and Cite
MDPI and ACS Style
Głąb, L.; Sowiński, J. Sustainable Production of Sweet Sorghum as a Bioenergy Crop Using Biosolids Taking into Account Greenhouse Gas Emissions. Sustainability 2019, 11, 3033. https://doi.org/10.3390/su11113033
AMA Style
Głąb L, Sowiński J. Sustainable Production of Sweet Sorghum as a Bioenergy Crop Using Biosolids Taking into Account Greenhouse Gas Emissions. Sustainability. 2019; 11(11):3033. https://doi.org/10.3390/su11113033
Chicago/Turabian StyleGłąb, Lilianna, and Józef Sowiński. 2019. "Sustainable Production of Sweet Sorghum as a Bioenergy Crop Using Biosolids Taking into Account Greenhouse Gas Emissions" Sustainability 11, no. 11: 3033. https://doi.org/10.3390/su11113033
Note that from the first issue of 2016, this journal uses article numbers instead of page numbers. See further details here.