Abstract
The foreign trade sustainable development index system of Shenzhen City, including the three subsystems of environment, economy, and society, was constructed based on the theory of emergy analysis. The sustainable development of foreign trade in Shenzhen City from 2009 to 2016 was evaluated, and a detailed analysis of changes in the emergy of light and heavy industries was performed. The results showed that the scale of economy has been expanding, and the total volume of imports and exports has turned from a rise to a decline in 2013. The status of sustainable development is not optimistic. The transaction volume of energy is reduced, and the quality of people’s living environment is declining. The sustainable development of Shenzhen City is not perfect, but it is in a phase of gradual optimization. Moreover, the proportion of heavy industry in import and export trade is significantly higher than that of light industry, which has caused the outflow of energy to a certain extent. Therefore, to improve the level of foreign trade sustainable development, the efficiency of resource utilization must be improved. The import of energy products must be increased, the ability to cope with external interference must be strengthened, and the foreign trade industrial structure must be adjusted.
1. Introduction
Sustainable development is the path that contemporary human beings must take in the face of resource shortages and environmental pollution. It is the eternal theme of human production and development. As a place where most of the production and living activities are gathered, the sustainability of the city is crucial for the sustainable development of the world [1]. In addition, as the degree of economic globalization and international trade liberalization deepened, the economies of various countries faced the challenge of increasing complementarity and dependence. Foreign trade has become a bridge between the Chinese economy and the world economy [2]. Shenzhen City is the most important import and export trade city in China, and the evaluation of urban trade sustainability is of great significance to the city’s future sustainable development [3].
Evaluating international trade performance is an important part of sustainable trade development. There are many foreign indices for evaluating the performance of import and export trades [4]. Different countries and organizations perform different analyses and evaluations. It is roughly divided into the following four stages of development, including: (1) Focus on measuring the economic benefits of foreign trade, such as International Trade and Competitiveness Index of the Organization for Economic Co-operation and Development (OECD) and Trade Performance Indicators (TPI) developed by the World Trade Organization International Trade Center and United Nations Conference on Trade and Development (UNCTAD). The OECD index only includes indices such as export growth rate and relative labor cost and is, therefore, relatively simple. Although the TPI index includes core indicators such as net exports, per capita exports, world market share, product diversification, and the rate of change, the system is relatively mature. However, neither system fully reflects the trade system and social ecological effects [5]. (2) Focus on studying indicators of bilateral trade sustainable development. Balassa proposed the Index of Revealed Comparative Advantage (RCA) in 1995, which measures the relative competition of export products from two countries by calculating the proportion of certain types of export products in world trade [6]. The degree is suitable for analyzing the sustainable development of bilateral trade, but not for the systematic analysis of a country’s (or region’s) sustainable development of foreign trade [7]. (3) Indirectly studying the environmental impact of import and export trade, mainly to study the pollutant emissions’ tax based on the input-output model (I-O). The impact of carbon dioxide emissions allows the trading system or other policy instruments to improve the competitiveness of a country’s economy. The input-output model is used to calculate the impact of foreign trade on environmental pollution [8]. However, this is an evaluation system based on the currency perspective, which failed to directly reflect the import and export trade effects [9]. (4) Direct study of the environmental impact on import and export trade, mainly using the emergy analysis method to evaluate the impact of foreign trade [10].
The emergy theory based on solar energy accounting has been widely used in economic and environmental impact evaluations [11]. Lan et al. first applied the method of emergy analysis to China’s eco-economic system in 1994 [12]. After measuring the various energy indicators, they concluded that the Chinese economy is largely supported by the Chinese environment. The environmental potential reached 98%, the energy currency ratio was low, and a phenomenon not beneficial to China’s ecology and economy was evident. The export emergy was much higher than the import emergy. Subsequently, Odum et al. applied the energy analysis method to China’s agricultural ecosystem, calculated the basic indicators of energy input and output, and evaluated the environmental resource base and yield of natural agriculture [13]. Sui and Lan analyzed and compared the ecological flows and energy indicators of Guangzhou City and Hong Kong in 2006 [14]. Other analyses were performed at the provincial, municipal, or regional level using the theory of energy. For example, the ecological and economic systems of Shanxi, Heilongjiang, Anhui, and Fujian Provinces were quantitatively analyzed [15,16,17]. Emergy analysis determines energy flow among the complex ecosystem components, in addition to the energy exchange inside and outside the system. The comprehensive energy index system can reflect the ecological and economic benefits and show the function and contribution of nature and man [18].
At present, the main urban sustainability evaluation models include multiple level indicators with comprehensive evaluation and urban demand-supply evaluation [19]. Both evaluation models have certain shortcomings in evaluating urban sustainability [20]. The former index system is complex and its weight is inevitably subjective. The latter cannot comprehensively evaluate the city’s supply and demand content, and the evaluation results are relatively simple [21].
In view of the shortcomings of the above research methods, the emergy analysis model to urban sustainability evaluation is applied, and the urban sustainability theory and emergy analysis theory is deeply studied. Under the framework of the traditional emergy model, a multiple level indicators comprehensive evaluation model is introduced to establish an index system consisting of three subsystems: social, economic, and environmental. According to the connotation of the index, it is divided into three categories: comprehensive, classified, and evaluated. The appropriate mathematical model is selected to quantify the indicators, and the comprehensive evaluation results of urban sustainability are obtained. The urban sustainability analysis and evaluation model based on emergy analysis is constructed. Taking Shenzhen City as an example, the application of the model was verified by calculating various indicators of Shenzhen City from 2009 to 2016. Then, further assessing the status of foreign trade in the context of light and heavy industries. Based on the calculation results, the sustainability of Shenzhen City was analyzed, and the countermeasures and suggestions for sustainable development in Shenzhen City were proposed.
2. Study Area and Data
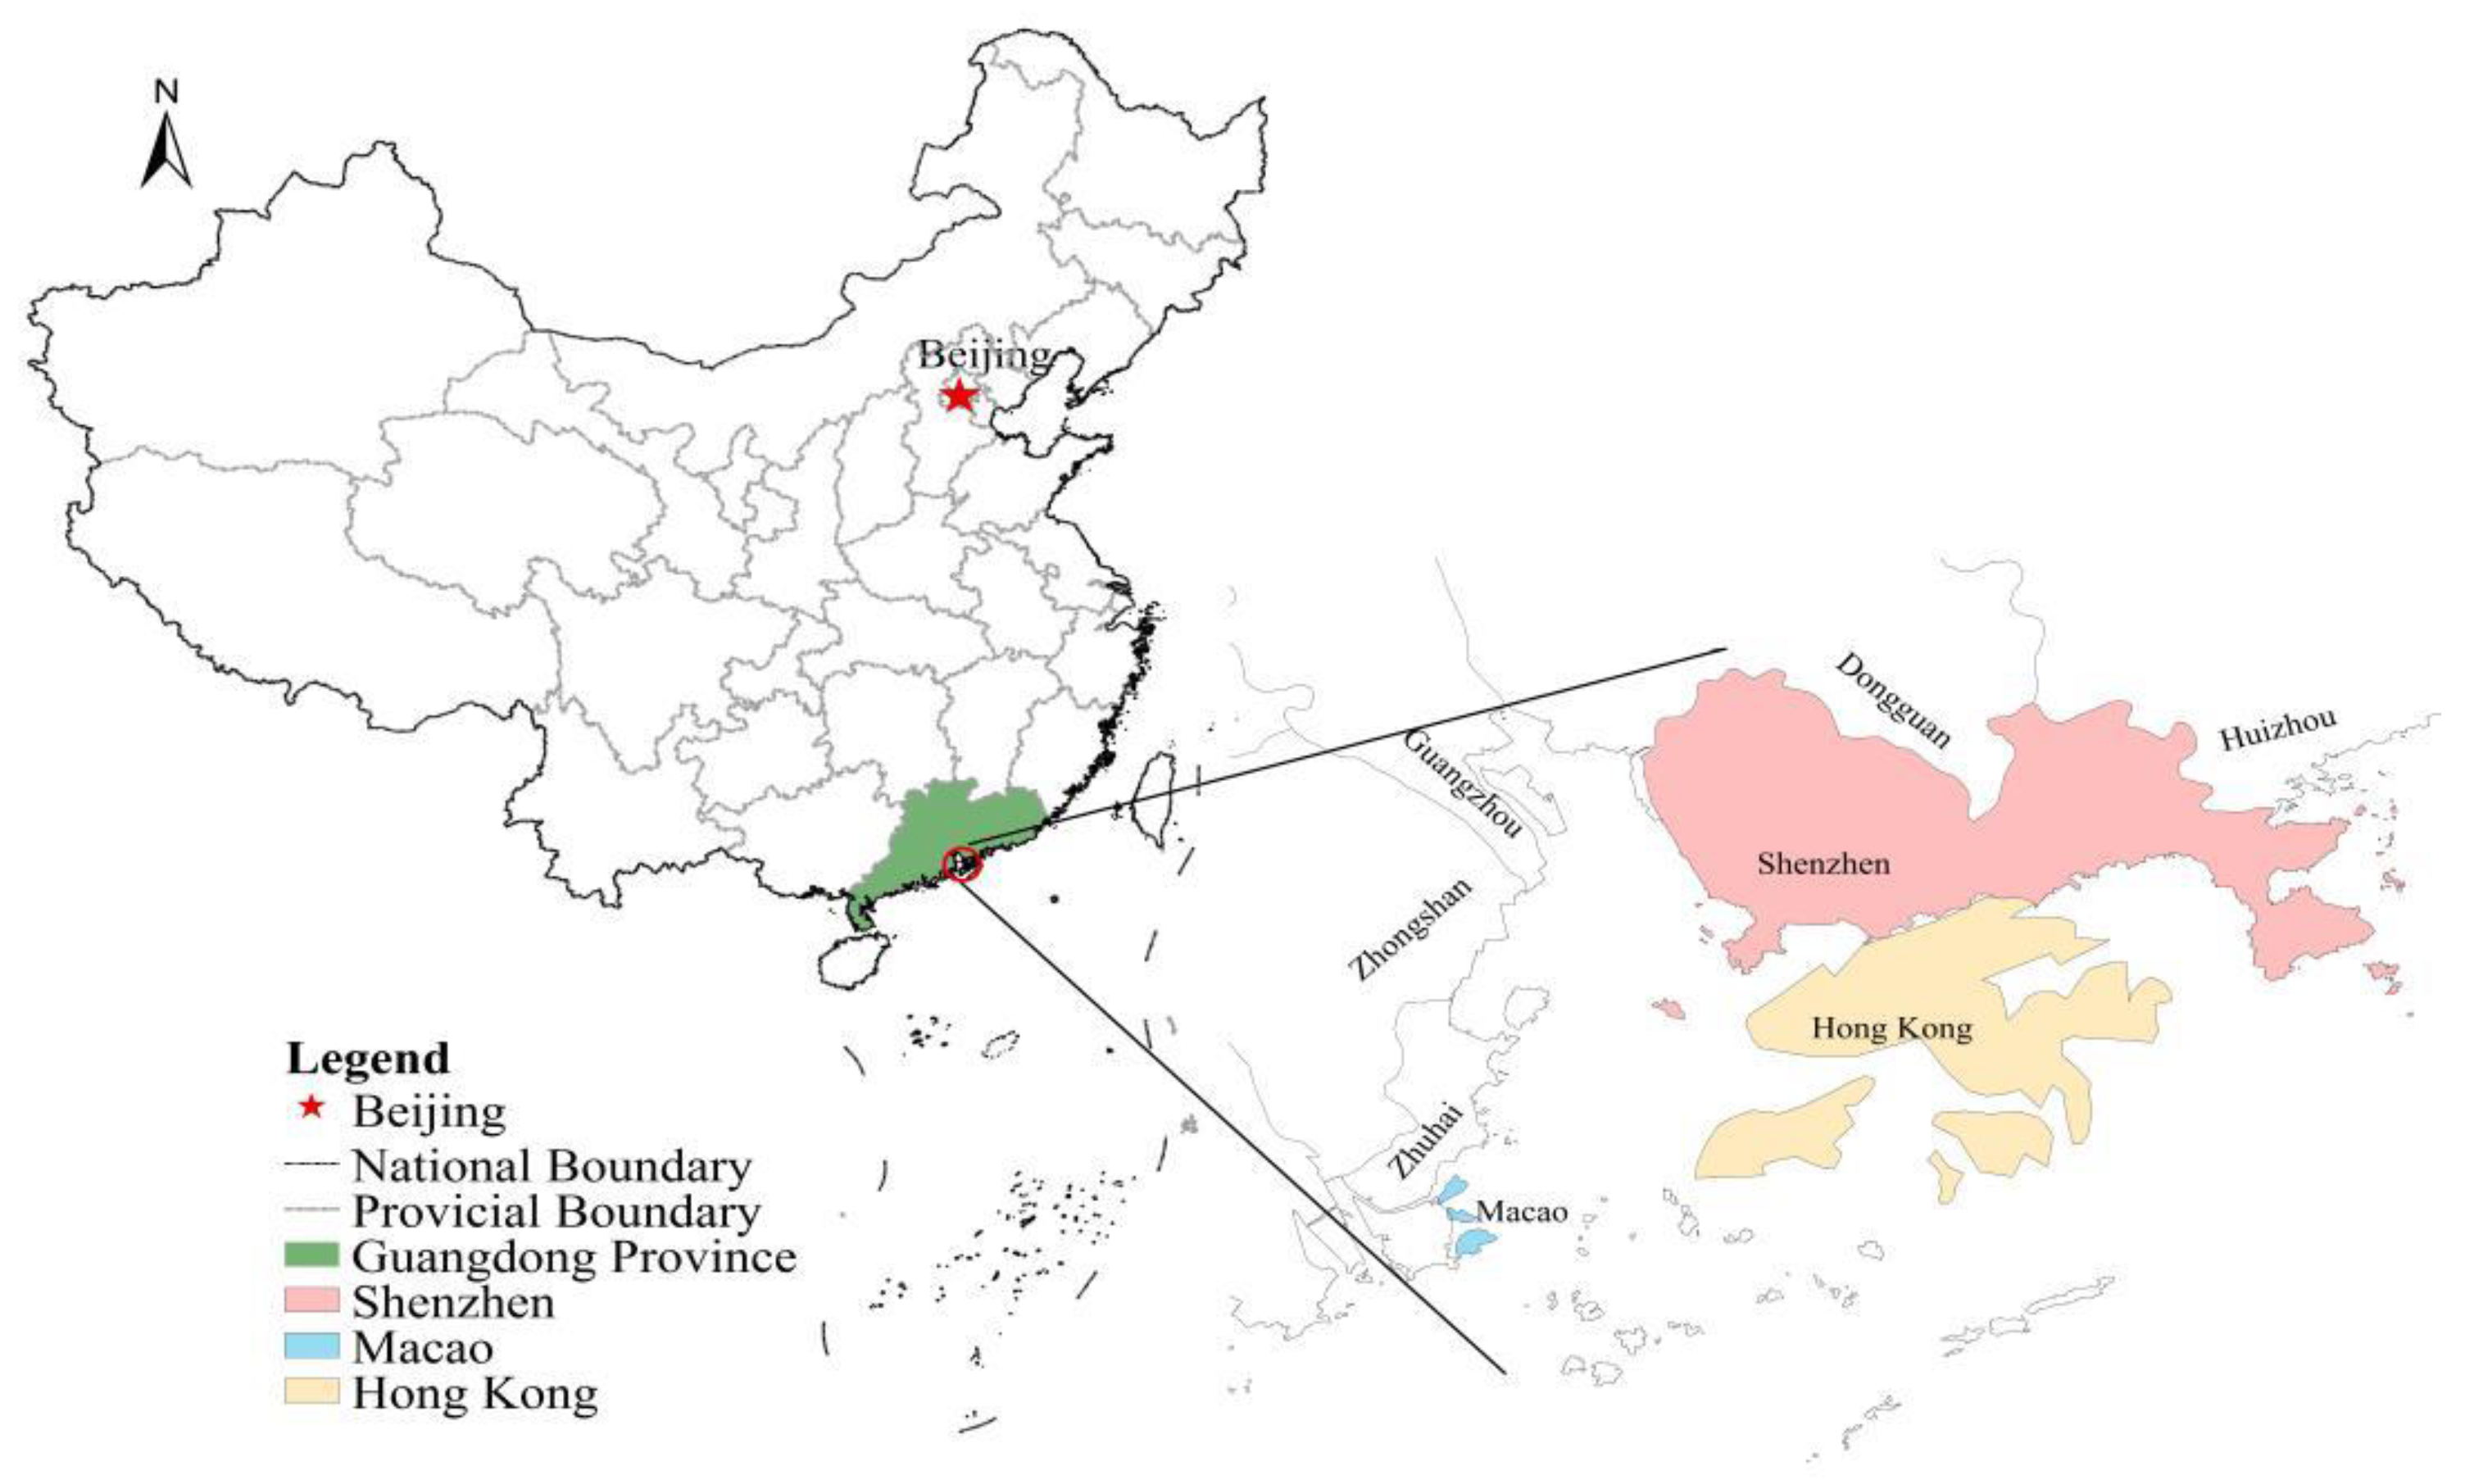
Shenzhen City is one of the four first-tier cities in China, the national economic center city, and the internationalized city positioned by the General Office of the State Council. It is located in the South of Guangdong Province, East of the Pearl River Estuary, separated from Hong Kong, East of Daya Bay and Dapeng Bay, West of Pearl River Estuary and Lingding Ocean, South of Shenzhen River and Hong Kong, and North of Dongwan City and Huizhou City. The city has a total area of 1997.27 square kilometers (Figure 1).

Figure 1.
Map of the research area.
Statistics on foreign trade in Shenzhen City from 2009 to 2016 by referring to the “Energy Consumption by Industry” section in the “Shenzhen Statistical Yearbook” were collected. From the “Reference Coefficient of Various Energy Standard Coals” in the “China Energy Statistics Yearbook,” this research determined the low calorific value. The value of the energy conversion rate was obtained from the book “Emergy Analysis of Ecol–economic System” by Lan et al. [22].
3. Methods
3.1. Calculating the Foreign Trade Emergy
Emergy is the amount of another energy contained in flowing or stored. Since the energy required for generating various resources, products, or services is directly or indirectly derived from solar energy, its value is used as a reference for measuring the value of different types of energy, and the unit is solar joule (abbreviation: sej) [23]. Emergy analysis refers to the comparative and quantitative study of all kinds of energy whose properties and sources are fundamentally different in terms of emergy units.
Through a common standard based on solar emergys, system analysis can compare various energies in a way that adds emergys. Otherwise, the energy is not included in the comparison. According to the division of regional foreign trade industry types, emergy calculation uses raw data from the natural resources used in the foreign trade process. According to the emergy conversion rate, emergy is calculated to determine the regional foreign trade’s solar emergy [24].
In the past, energy analysis compares energy and energy of various properties and sources into energy units, and then compares and quantifies them. However, different types of energy are not comparable and additive [25]. For example, the energy and electrical energy produced by coal combustion with the same petrochemical energy are also very different and cannot be simply added and compared. With the energy value as a common metric, the energy that cannot be added and compared can be added and compared by the energy value, so that the system analysis is based on the common value of the solar energy value [26].
Energy analysis mainly calculates the ratio of production toward the investment of system energy, in order to show the efficiency of input energy formation. However, the energy analysis of ecosystems usually does not calculate the energy input of natural resources such as solar energy and rainwater. The results of various production and investment ratios from the analysis results do not reflect the great contribution and effect of nature and cannot indicate ecological benefits [27]. The energy value analysis not only analyzes the energy value flow between the components in the system, but also analyzes the energy value communication inside and outside the system. The comprehensive energy value index system obtained through the analysis results not only reflects the ecological benefits but also the economic benefits, which indicates the role and contribution of nature and people [28].
Since energy cannot express and measure the essential relationship between man and nature, environment and economy, it is difficult to analyze eco-economic systems, including socio-economic-natural complex ecosystems [29]. Emergy analysis can unify the natural ecosystem and the human economic system for quantitative analysis. In addition, energy analysis cannot comprehensively analyze the system’s energy logistics, currency flow, population flow, and information flow. Energy units cannot be used to express the relationship between ecological and economic benefits. Emergy value analysis uses energy as a common dimension [30]. The ecological flow is comprehensively analyzed to quantitatively assess the structural and functional characteristics and dynamic changes of the system.
All the wealth created by mankind and nature contains both energy and value. Therefore, the value of energy is a reflection of the substantial amount of wealth and an expression of objective value. Natural resources, commodities, labor, and scientific information can all measure their inherent true value and evaluate their contribution. Energy cannot be used to measure the value of nature and the economy [31].
3.1.1. Classification of Foreign Trade Industry
We select 22 departments from the Shenzhen Statistical Yearbook (2009–2016), as shown in Table 1.

Table 1.
Department classification of foreign trade industry.
3.1.2. Emergy Calculation of Each Industry
The emergy of the import and export trade only represents part of the industry’s energy consumption. After dividing the import and export trade by industry, we calculated the total value of each industry’s currency as a proportion of the total economic value, which represents the import and export trade’s emergy as a proportion of the industry’s total emergy, and calculates the total emergy of the industry, as shown in Table 2.
Table 2.
Emergy conversion coefficient table.
Due to the different energy unit calorific values and emergy conversion rates, we obtained the emergy conversion rate from the emergy analysis of ecological economic systems by Lan et al. [22]. To calculate the emergy values of 22 industries, the consumption data of coal, coke, crude oil, gasoline, kerosene, diesel, fuel oil, natural gas, and electricity by the unit heat value is multiplied. Then, it is multiplied by the energy conversion rate. In addition, the consumption data is from the “Energy Consumption by Industry” in the Shenzhen Statistical Yearbook.
Since the low calorific value was obtained by deducting water vapors as well as the latent heat of vaporization in flue gas from the high calorific value (i.e., all the heat released when 1 kg of fuel is completely burned), it is closer to the actual calorific value of industrial boiler combustion. Therefore, this value was adopted in our current study. The low calorific value and emergy conversion rate of these nine energy sources are shown in Table 3.
Table 3.
Low calorific value and emergy conversion rate of energy sources.
Imported goods consume foreign energy, which should be measured, according to the energy consumption of other countries. However, due to the large number of importing countries involved, and the difficulty of obtaining energy consumption data by industry, we assumed that the energy efficiency of each importing country was similar to that of Shenzhen City when measuring the total foreign trade emergy.
According to the classified energy consumption data of each industry, the energy consumption value was calculated. The formula is shown below.
where E is the import and export emergy of various industries, E1 is energy consumed by various industries, E2 is the emergy conversion rate, E3 is the emergy conversion coefficient, e1 is the energy consumption in various industries, e2 is the unit calorific value, e3 is the emergy conversion rate, and e3 is the emergy conversion coefficient.
E = E1× E2 × E3 = e1 × e2 × e3
EMDijt is used to indicate the import and export emergy of the jth energy consumption in the t-year of the i-industry (i = 1, 2, 3, ..., n; j = 1, 2, 3, ..., m; t = 1, 2, 3, ..., t). Then, the emergy of the import and export of the i-industry in the t-year was EMDijt. Its calculation formula is shown below.
EMDit = ∑ EMDijt
3.2. Evaluation Index System of Foreign Trade Sustainable Development
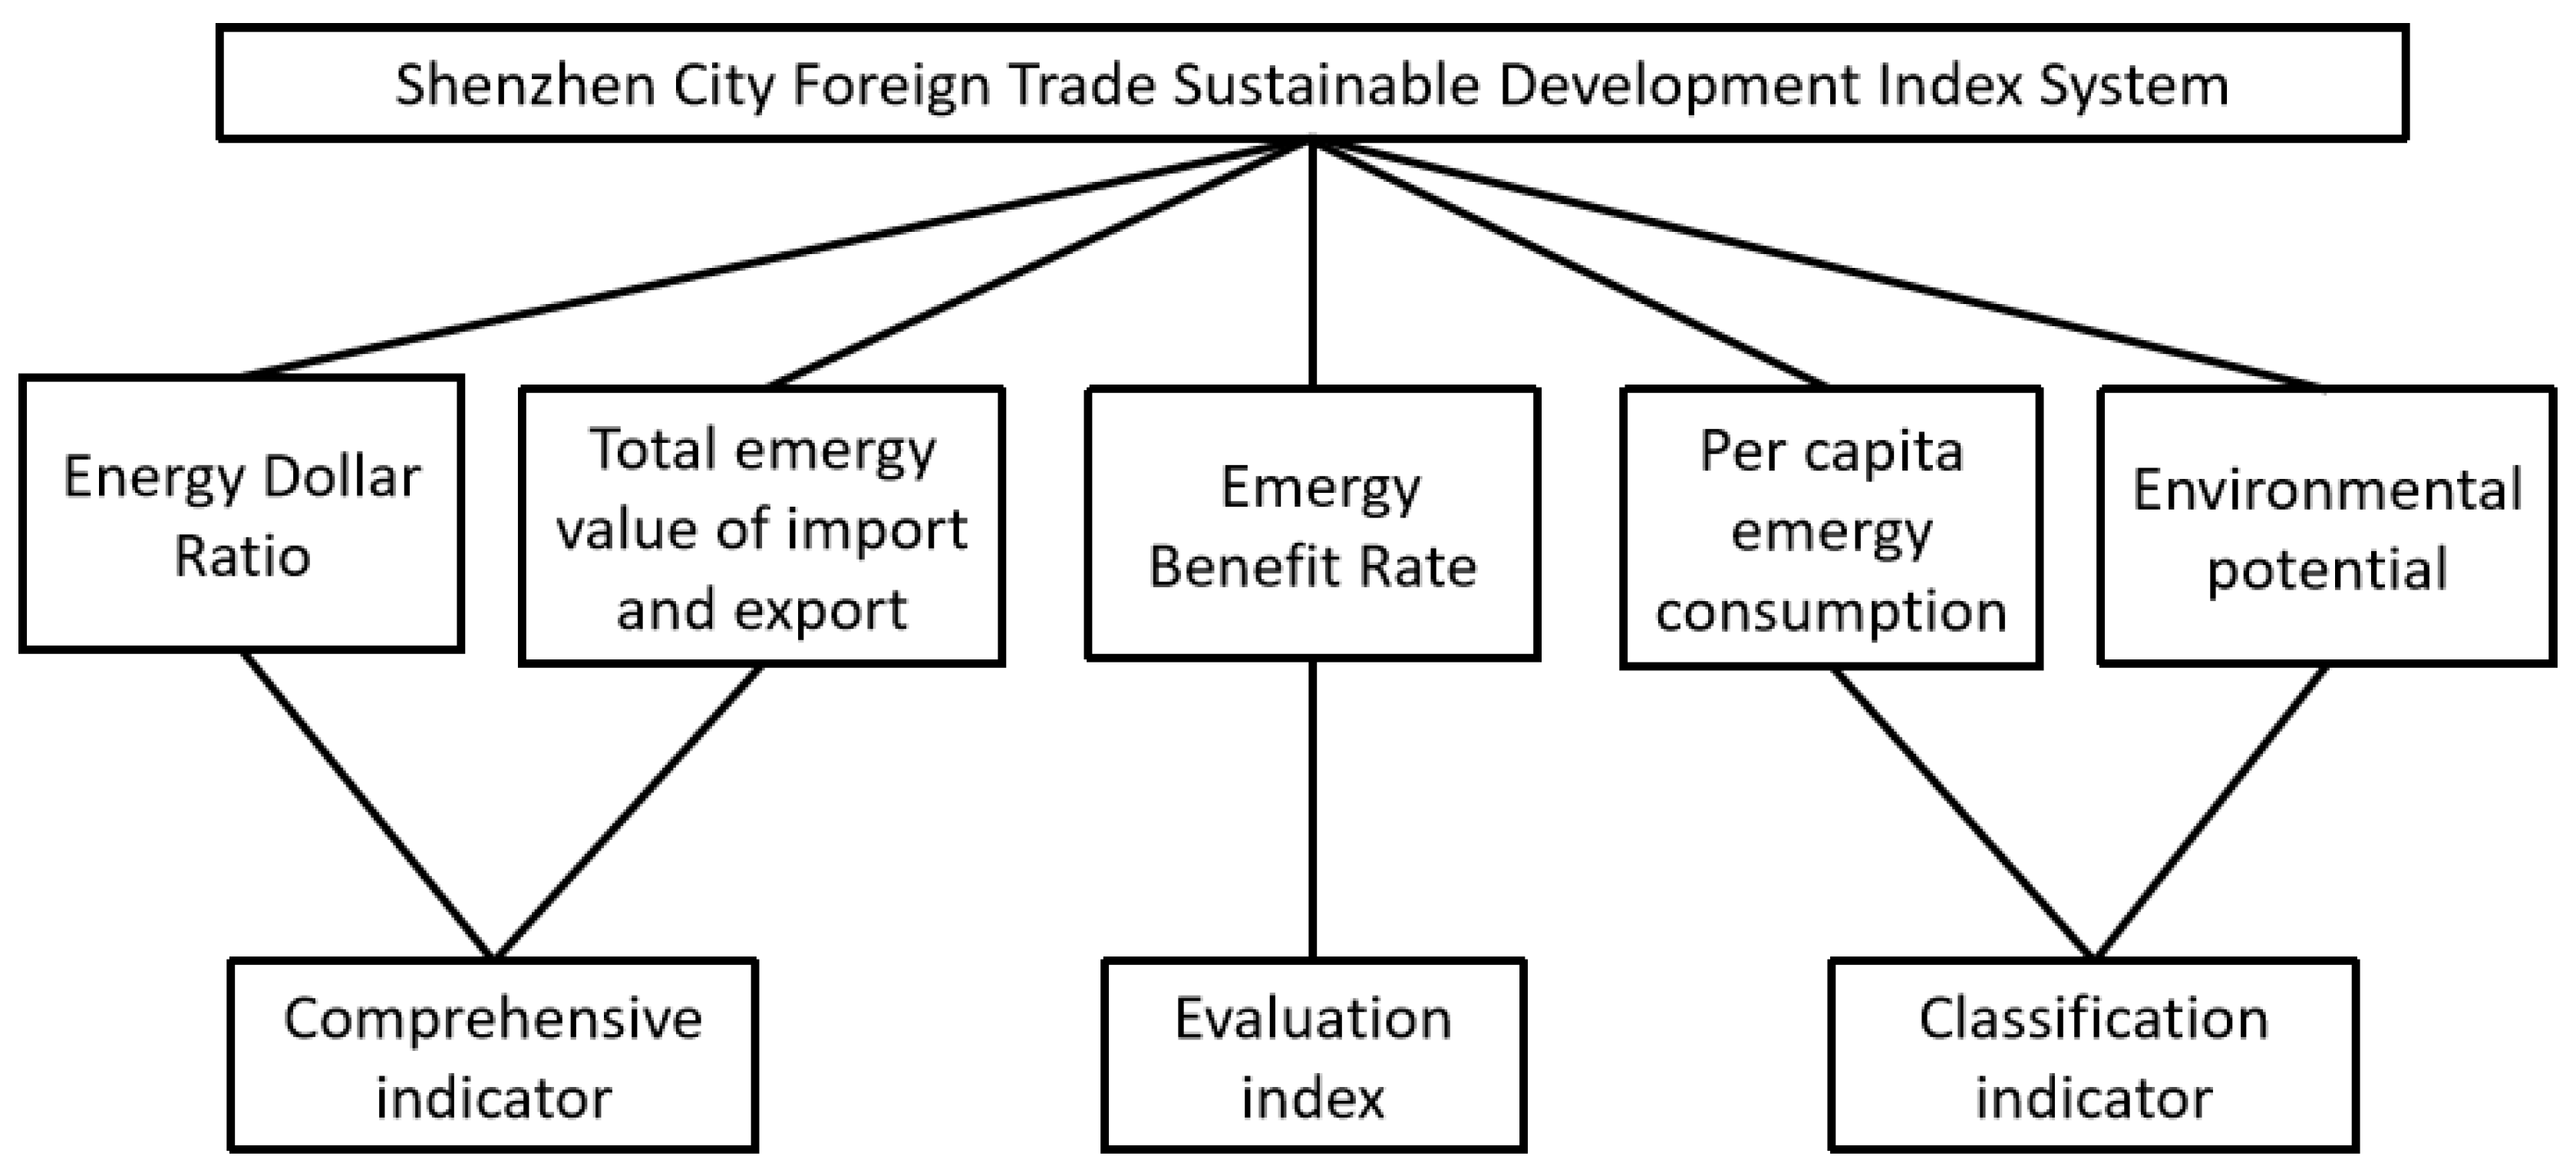
In the evaluation index system for constructing foreign trade sustainable development, the secondary indicators used in this research were: (1) Emergy dollar ratio, (2) environmental potential, (3) per capita emergy, (4) emergy benefit rate, and (5) the total emergy of import and export. We further categorized them into three primary indicators: (1) Comprehensive indicators, where the overall economic development is evaluated based on the energy dollar ratio and total energy of imports and exports. (2) Classification indicators, where the economy’s impact on the environment and people’s living standards is reflected in the per capita emergy consumption and environmental potential. (3) Evaluation indicators, where the degree of a country’s foreign trade development status is measured by the emergy input rate (Figure 2) [32].
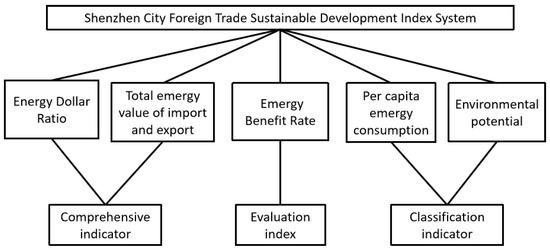
Figure 2.
Emergy analysis index system diagram.
3.2.1. Emergy Dollar Ratio (EDR)
The Emergy dollar ratio (EDR) is the equivalent amount of energy in a country or region, which is the ratio of a country or region’s total emergy divided by the current currency. To some extent, the monetary rate of money reflects the system’s ability to purchase money. The more emergys are available in a unit of currency, the greater the ratio is, which indicates the lower economic development of the system. This implies the need for investing in high-energy technologies to replace low-energy resources and to improve the overall benefits from resources. The less emergy a unit currency can buy, the smaller the ratio is. In general, the same amount of money spent in underdeveloped areas can buy more energy. Its calculation formula is as follows.
EDR = total energy of foreign trade/volume of foreign trade currency
3.2.2. Environmental Potential (EP)
Environmental potential (EP) is the ratio of renewable energy to the total energy use value, and it can evaluate the natural environment’s ability to support the system’s production. EP can be used to account for the extent to which the system depends on the natural environment and the contribution of natural environmental resource emergys to economic development. The higher the environmental potential is, the stronger the supportive ability of the natural environment is, and the lower the degree of economic development is. Its calculation formula is shown below.
EP = renewable resource energy/total system utilization energy
3.2.3. Per Capita Emergy Consumption (PEC)
From the perspective of macro-ecological economics, it is more scientific and comprehensive to measure people’s living standard and quality of life using per capita emergy consumption (PEC) than the traditional per capita income. The real wealth that an individual possesses includes the free emergy of the natural environment that is not quantified by market tendencies, the emergy of bartering with other people without participating in any currency flow, and the emergy reflected in the currency through market exchange [33]. These aspects of “wealth” enjoyed by people cannot be fully reflected simply by personal economics and monetary income. In foreign trade, the per capita emergy consumption reflects the process of real wealth change in the process of foreign trade, which reflects the impact of foreign trade on the environment. Its calculation formula is shown below.
PEC = total emergy of foreign trade/total population
3.2.4. Emergy Benefit Rate (EBR)
Emergy benefit rate (EBR) reflects the profitability of a country or region in foreign trade. When it is greater than 1, it indicates that the import emergy of a country or region is greater than the export emergy [21], so Shenzhen City benefits from foreign trade. On the contrary, it is at the disadvantage of emergy loss. Its calculation formula is as follows.
EBR = import emergy/export emergy
3.2.5. Total Emergy of Import and Export
From a dynamic point of view, a country’s or region’s sustained economic growth will inevitably be accompanied by an increase in total foreign trade. However, using the import and export trade does not indicate the fairness of international trade. Even if the export value is higher than that of import, it is not necessarily a loss. It can only be measured by the total emergy of import and export [34]. The total emergy of a country’s imports and exports refers to the sum of the emergy of a country’s imports and exports of goods and services over a certain period of time (usually one year). Its calculation formula is as follows.
Total emergy of imports and exports = emergy of imported goods and services + emergy of exported goods and services
3.3. Calculation of Emergy of Key Industries
In the Encyclopedia of China, heavy industry refers to the production of materials including energy, machine manufacturing, electronics, chemicals, metallurgy, and building materials. The energy industry includes the coal, oil, and power industries. The machinery manufacturing industry includes coal mining equipment, power generation, automobile industry chemical industry including sulfuric acid, alkali, fertilizer, petrochemical industry, the metallurgical industry including steel, the non-ferrous metal industry, building materials including cement, the glass industry, and more [35].
The light industry refers to the industries mainly providing consumer goods and hand tools. According to the different raw materials used, it can be divided into two categories: (1) The first type directly or indirectly uses agricultural products as basic raw materials. It mainly includes industries such as food manufacturing, beverage manufacturing, tobacco processing, textile, sewing, leather and fur making, paper making, and printing. (2) The second type uses industrial products as raw materials. It mainly includes cultural and educational sporting goods, chemical manufacturing, synthetic fiber manufacturing, daily chemical products, household glass products, daily metal products, hand tools manufacturing, medical device manufacturing, and cultural and office machinery manufacturing industries [36].
In order to illustrate the main structure of emergy flow in Shenzhen City during the trade process, we analyzed the foreign trade value from the perspective of the heavy chemical industry and light industry.
3.3.1. Emergy Measurement of Heavy Industry Sector
According to the heavy industry sector definitions and classifications, 10 sectors including the mining and dressing industry, chemical industry, and transportation equipment manufacturing industry were classified as heavy industry sectors. emergys for each sector represented the sum of total emergys for the heavy industry sector. Its calculation formula is shown below.
where H is the heavy industry sector emergy, H1 is the emergy of ore mining industry, H2 is the food processing and manufacturing emergy, H3 is the petroleum processing coking and nucleus processing industry emergy, H4 is the medical chemical manufacturing emergy, H5 is the rubber and plastic products industry emergy, H6 is the non-metallic mineral products industry emergy, H7 is the metal smelting and rolling processing industry emergy, H8 is the metal products industry emergy, H9 is the machinery industry emergy, and H10 is the electrical machinery and equipment manufacturing emergy.
H = H1 + H2 + H3 + H4 + H5 + H6 + H7 + H8 + H9 + H10
3.3.2. Emergy Measurement of the Light Industry Sector
According to the light industry sector definitions and classifications, seven sectors including the tobacco products industry, textile industry, clothing and leather manufacturing industry, wood furniture manufacturing industry, paper industry, and paper products industry were classified as light industry sectors. The emergys of each sector represented the sum of total emergys of the light industry sectors. Its calculation formula is as follows.
where L is the light industry sector emergy, L1 is the tobacco product industry emergy, L2 is the textile industry emergy, L3 is the clothing leather manufacturing emergy, L4 is the wood furniture manufacturing emergy, L5 is the paper and paper products industry emergy, L6 is the electronic communication equipment manufacturing emergy, and L7 is the instrumentation manufacturing industry emergy.
L = L1 + L2 + L3 + L4 + L5 + L6 + L7
4. Results Analysis
4.1. Foreign Trade Development Status of Shenzhen City
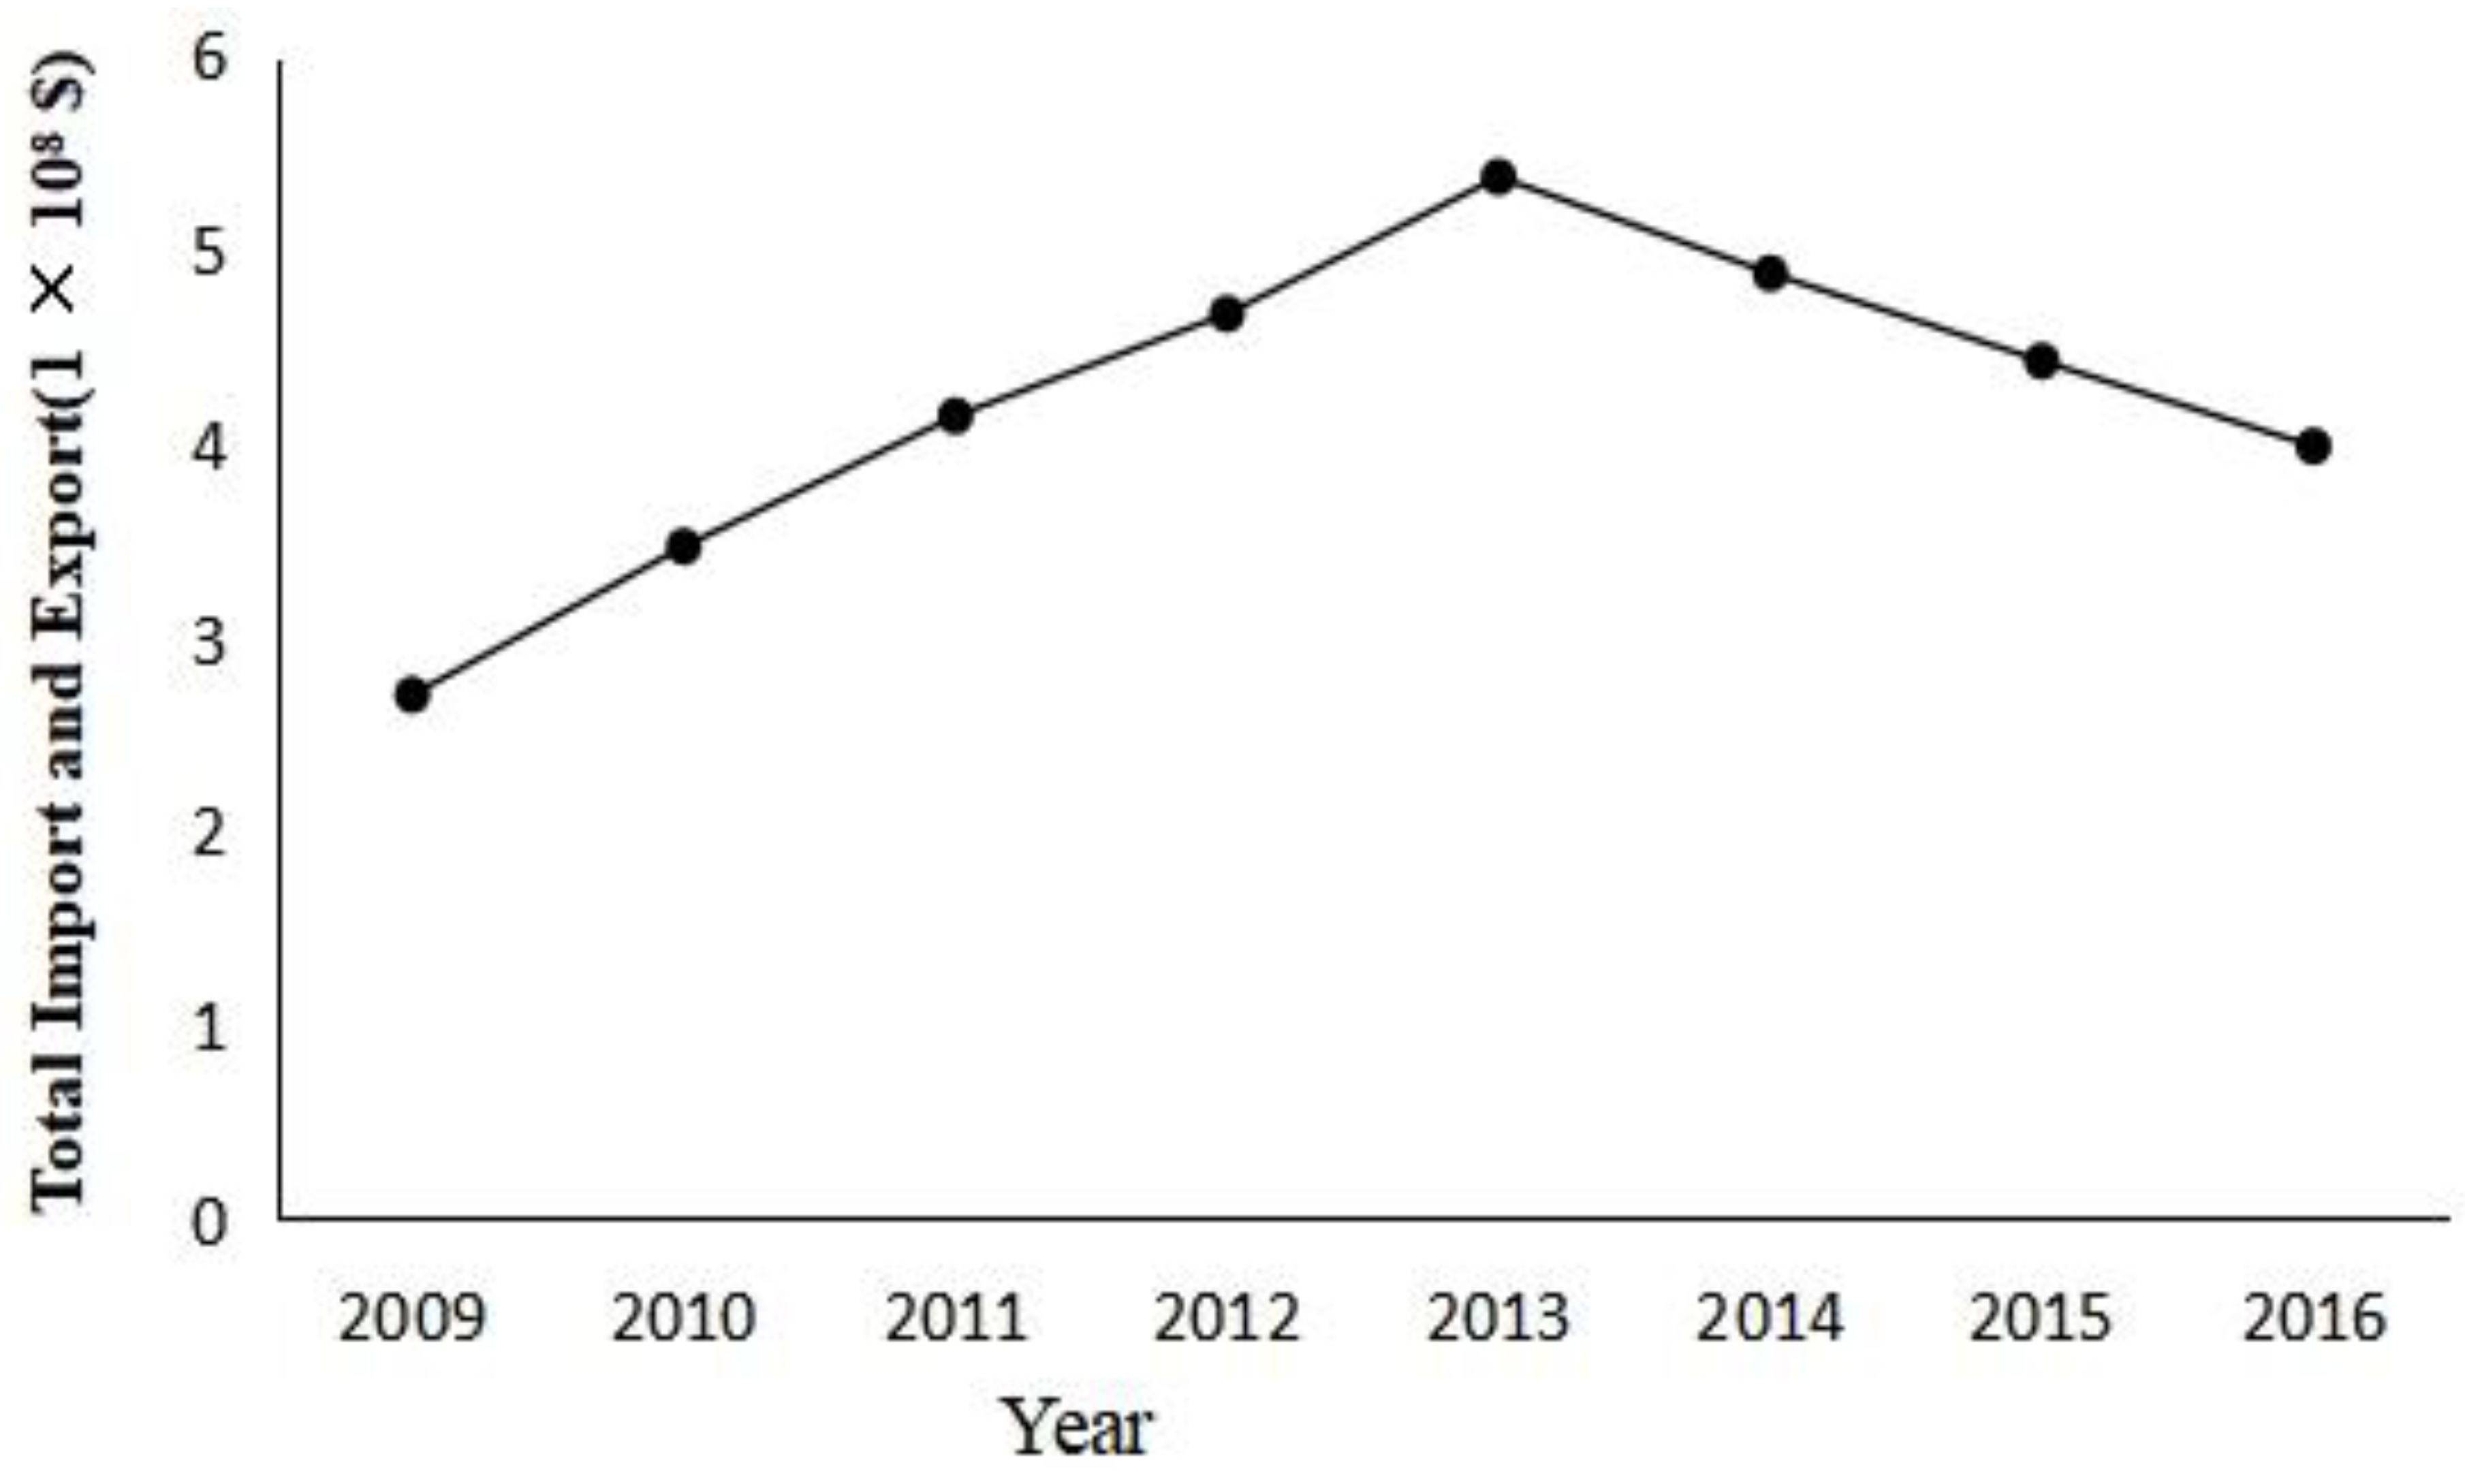
In recent years, Shenzhen City has experienced rapid development, and its foreign trade changes are shown in Figure 3.
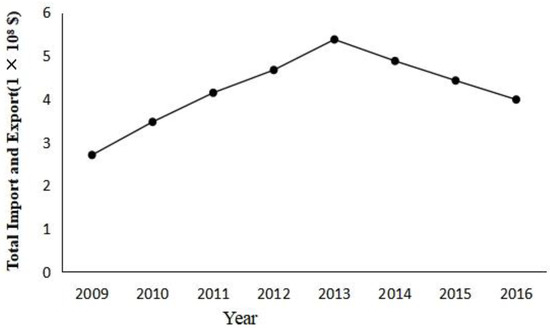
Figure 3.
Changes in the total import and export volume of Shenzhen City.
Figure 3 shows that total import and export volume in Shenzhen City began to decline in 2013, which may have been affected by the establishment of the Shanghai Free Trade Zone. This new trade zone implements the RenMinBi Yuan (RMB) apital project opening, promotes commodity futures trading, establishes an administrative management system that is compatible with the international high-standard investment and trade rules system, and implements a series of new reform policies such as negative inventory management. This may have attracted a large number of foreign capital introductions, sharing the advantages of Shenzhen City as a special economic zone, which, in turn, led to a decline in the volume of import and export trade.
4.2. Foreign Trade Emergy of Major Industries
According to the statistical data of energy consumption in different industries obtained from the “Shenzhen Statistical Yearbook” from 2009 to 2016, the total foreign trade emergy values of 22 industries in the national economic statistics of Shenzhen City from 2009 to 2016 were calculated using the emergy analysis method. The results are shown in Table 4.
Table 4.
Foreign trade emergys of 22 industries in China from 2009 to 2016.
As can be seen from Table 4, the differences between the industry and the time evolution in Shenzhen City are very clear between 2009 and 2016. The number of industries is huge, and individual analysis is more difficult. In order to more accurately analyze the trend of change, 22 industries are divided into light and heavy industries for further analysis.
4.3. Calculation Results of Each Index
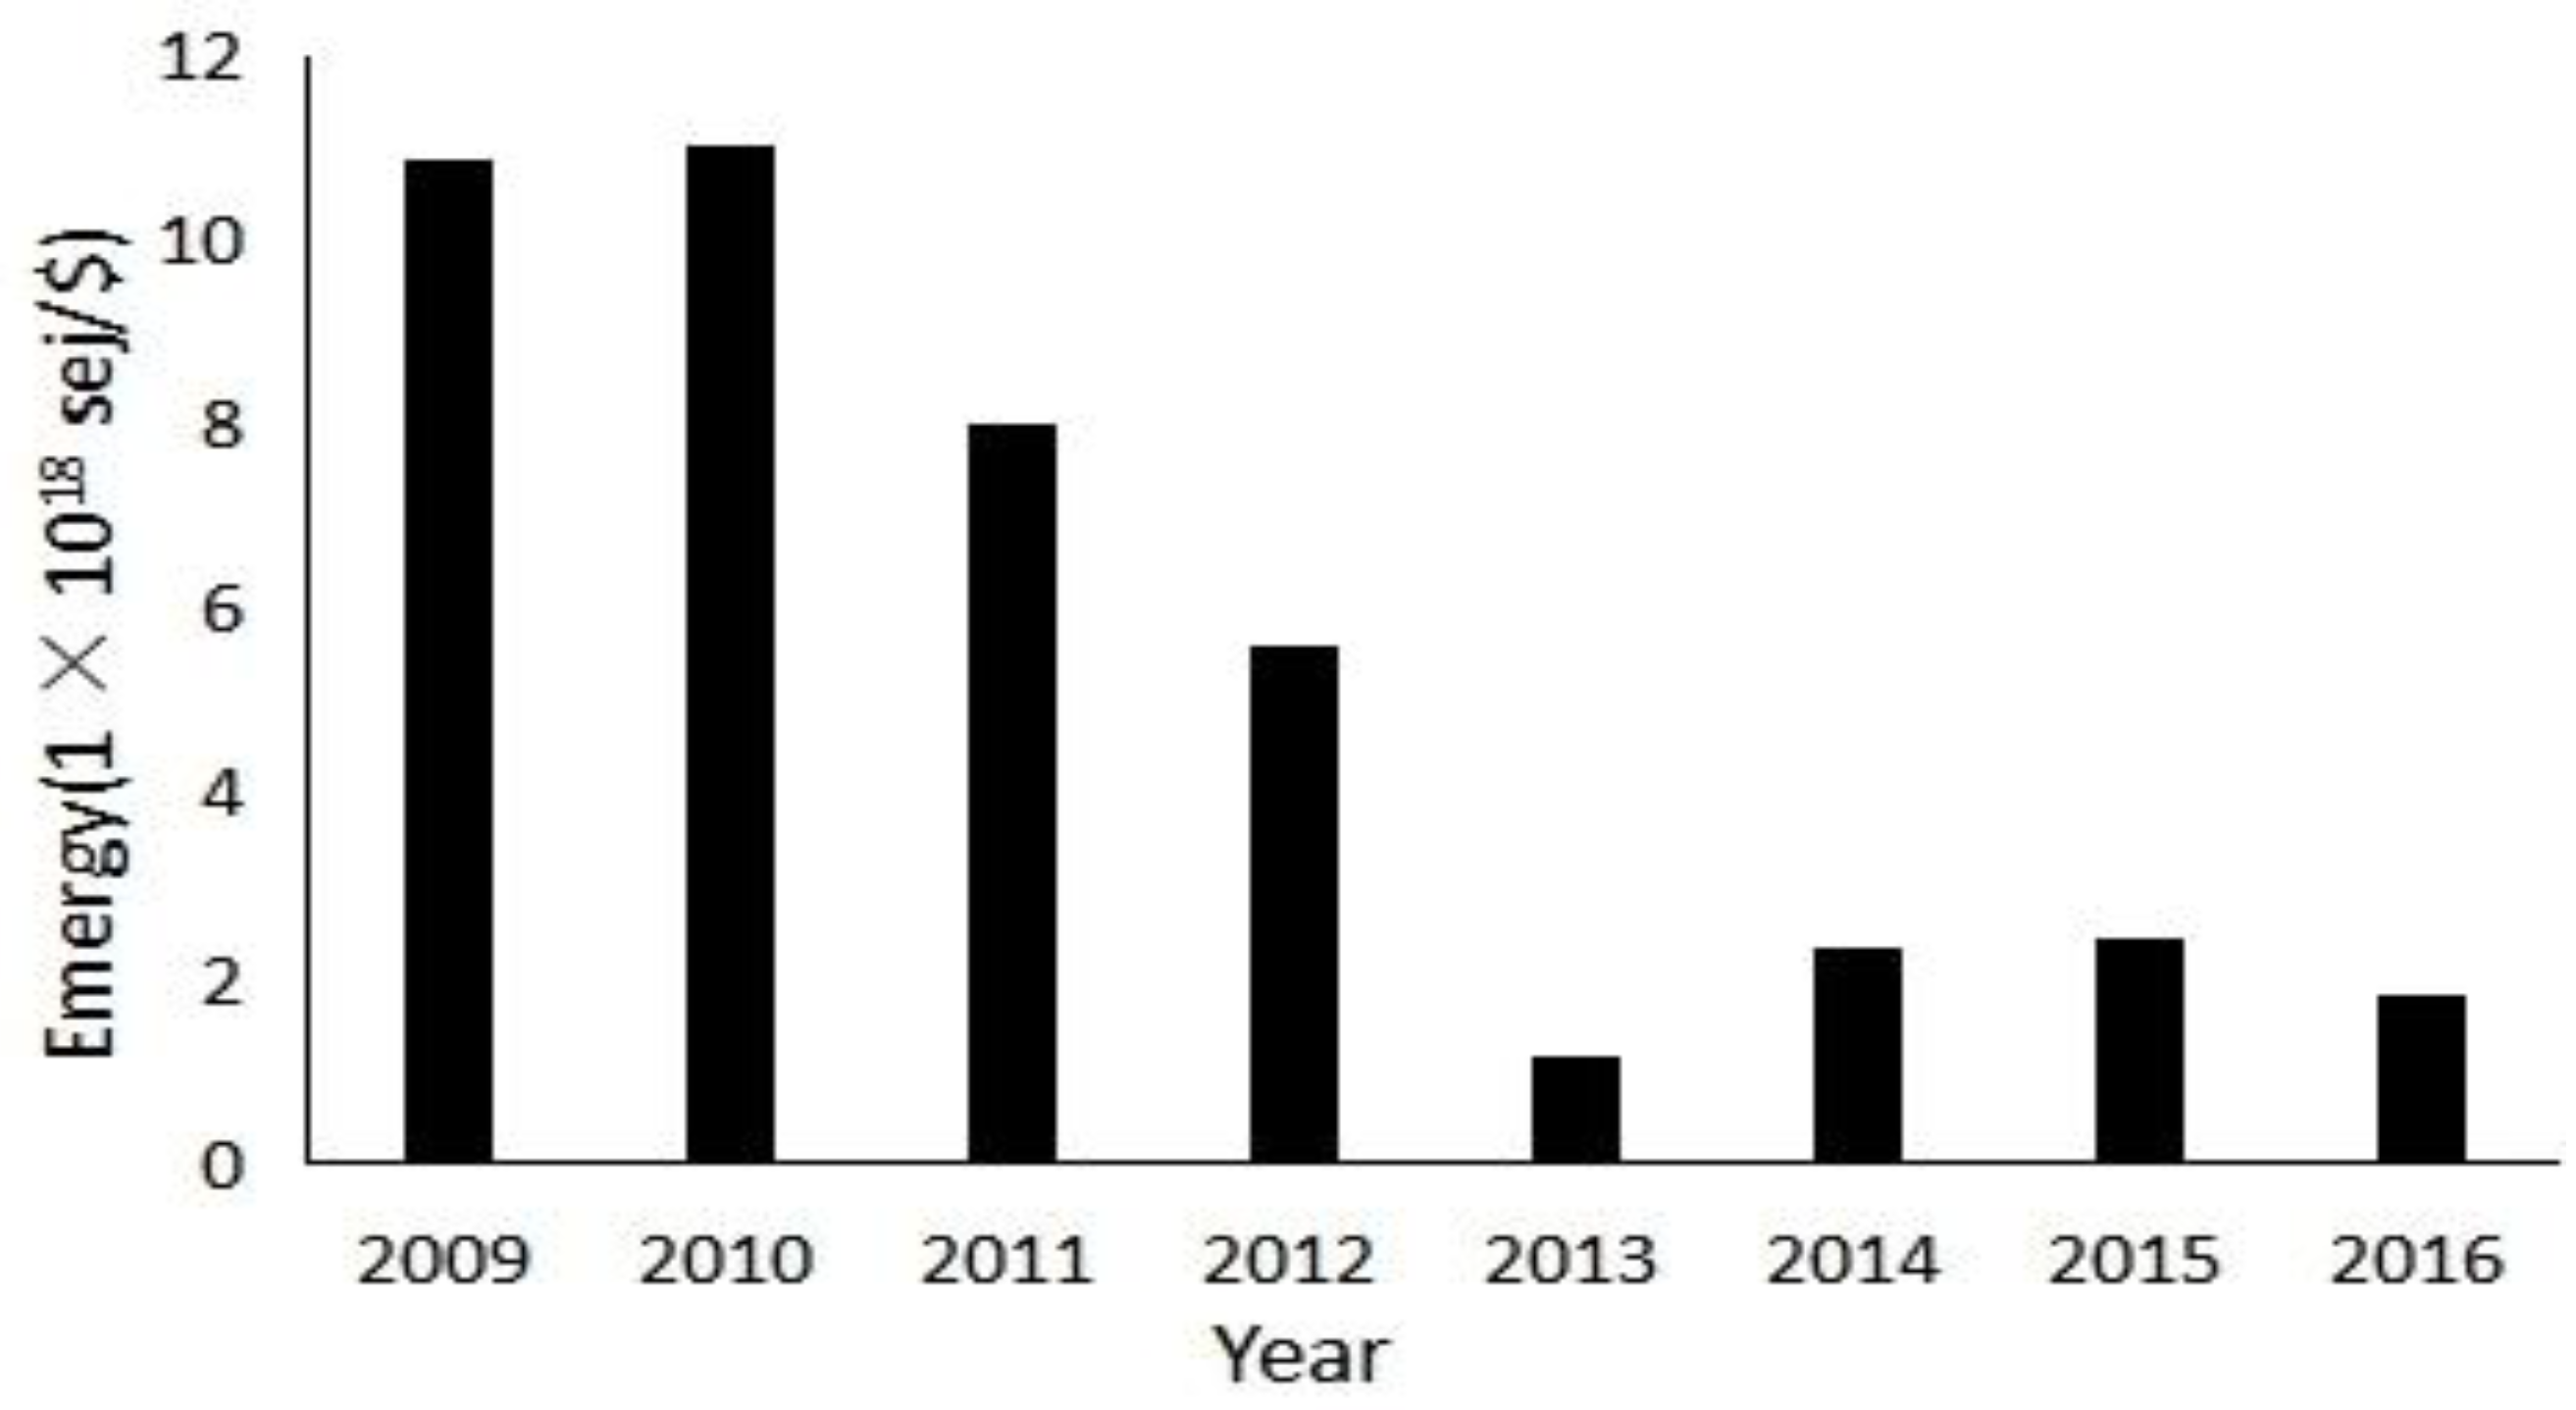
4.3.1. Emergy Dollar Ratio (EDR)
From 2009 to 2016, foreign trade EDR in Shenzhen City showed a wave-like decreasing trend (Figure 4). The EDR increased from 11.02 × 10¹⁸ sej/$ and fell to 1.18 × 10¹⁸ sej/$, with a maximum range of 9.84 × 10¹⁸ sej/$. These data macroscopically reflect that the emergy purchased by the unit currency in the continuous development of Shenzhen City’s foreign trade gradually decreased, and the value of natural resources increased.
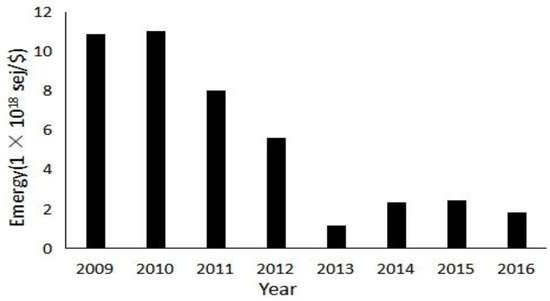
Figure 4.
Exchange rate of ECR in Shenzhen City’s foreign trade from 2009 to 2016.
4.3.2. Environmental Potential (EP)
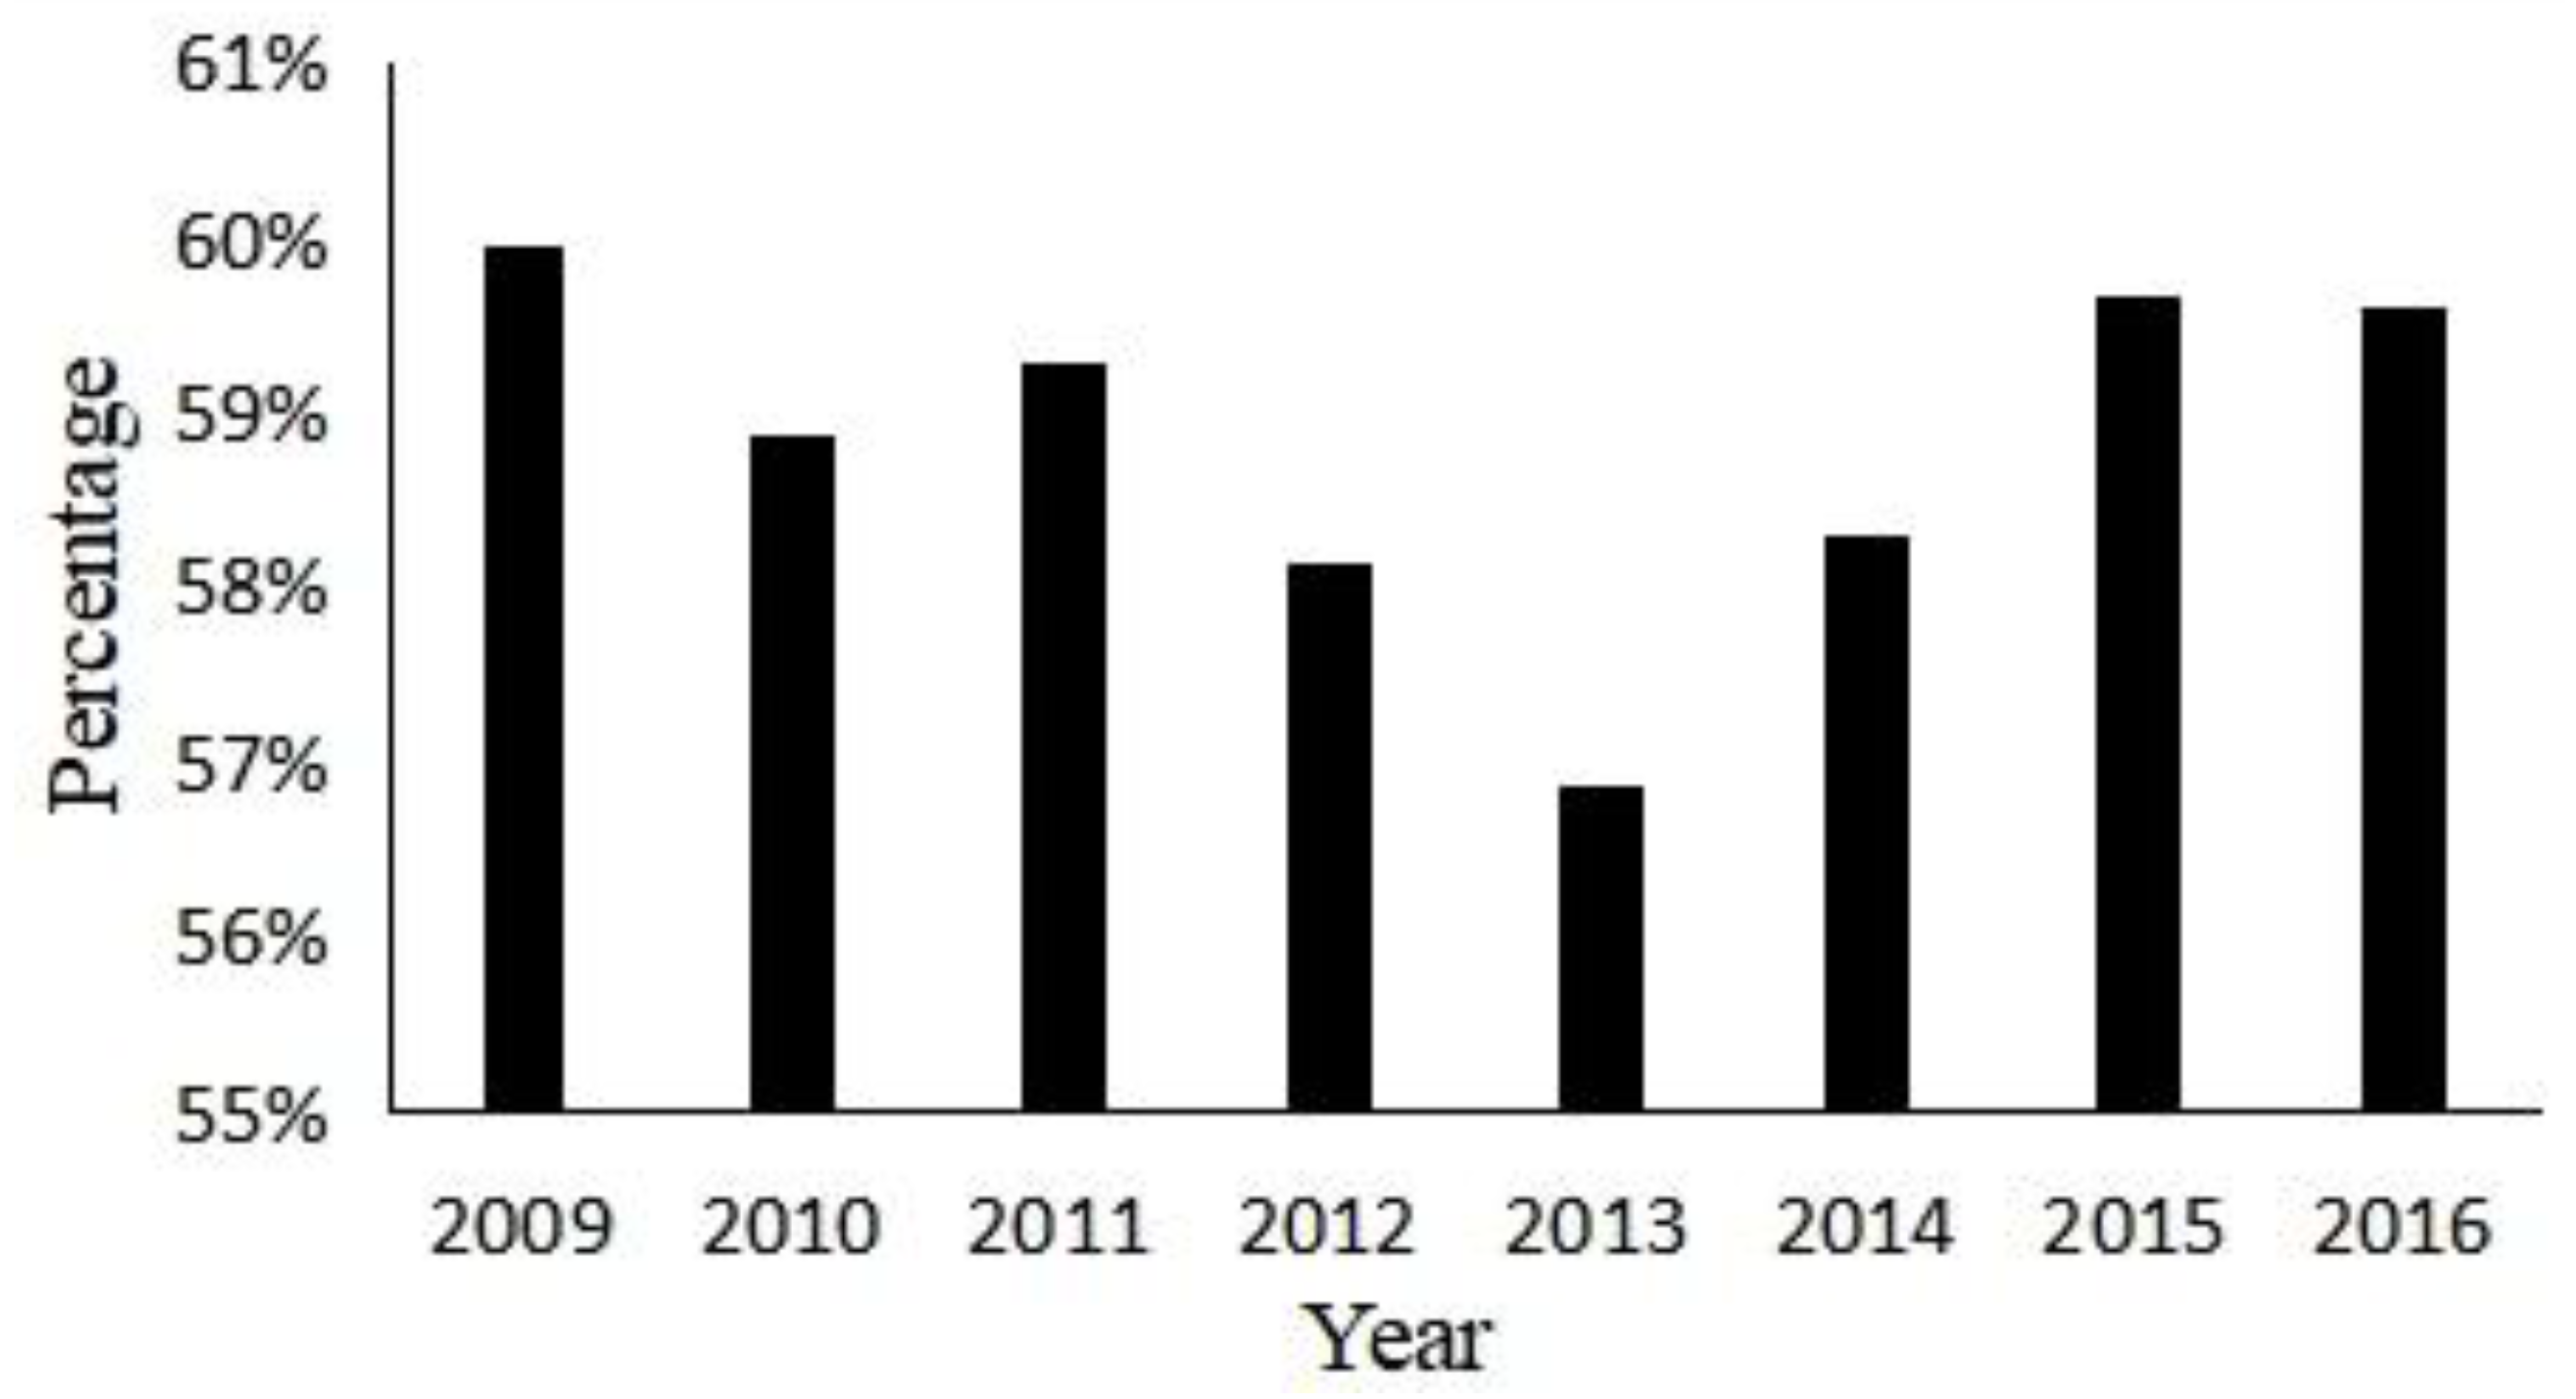
The foreign trade system is not a closed and isolated development. It should be connected with the outside world on the basis of self-reliance. In the emergy analysis theory, the environmental potential (EP) was used to express the self-sufficiency of local resources. The trend is shown in Figure 5.
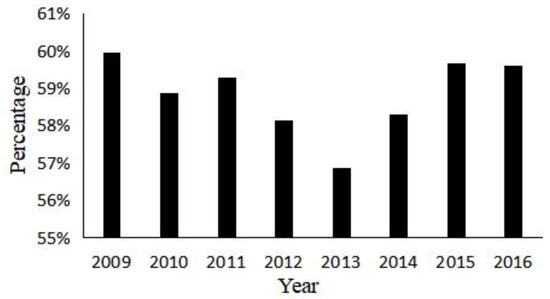
Figure 5.
Environmental potential of Shenzhen City’s foreign trade from 2009 to 2016.
The EP of foreign trade in Shenzhen City from 2009 to 2016 had a wavy trend. In 2013, the emergy reached a maximum, and the environmental potential was reduced to the lowest value. After rising in 2015, it only dropped by 0.06 percentage points between 2015 and 2016. These data points indicate that the environmental potential of foreign trade in Shenzhen City is relatively low, and that purchasing emergy accounts for the majority, which is conducive to the best use of resources and the overall degree of economic development gradually increase. For further improvement, we should give full play to resource advantages and accelerate the economic development of foreign trade in Shenzhen City on the basis of effective use and scientific management of its own resources.
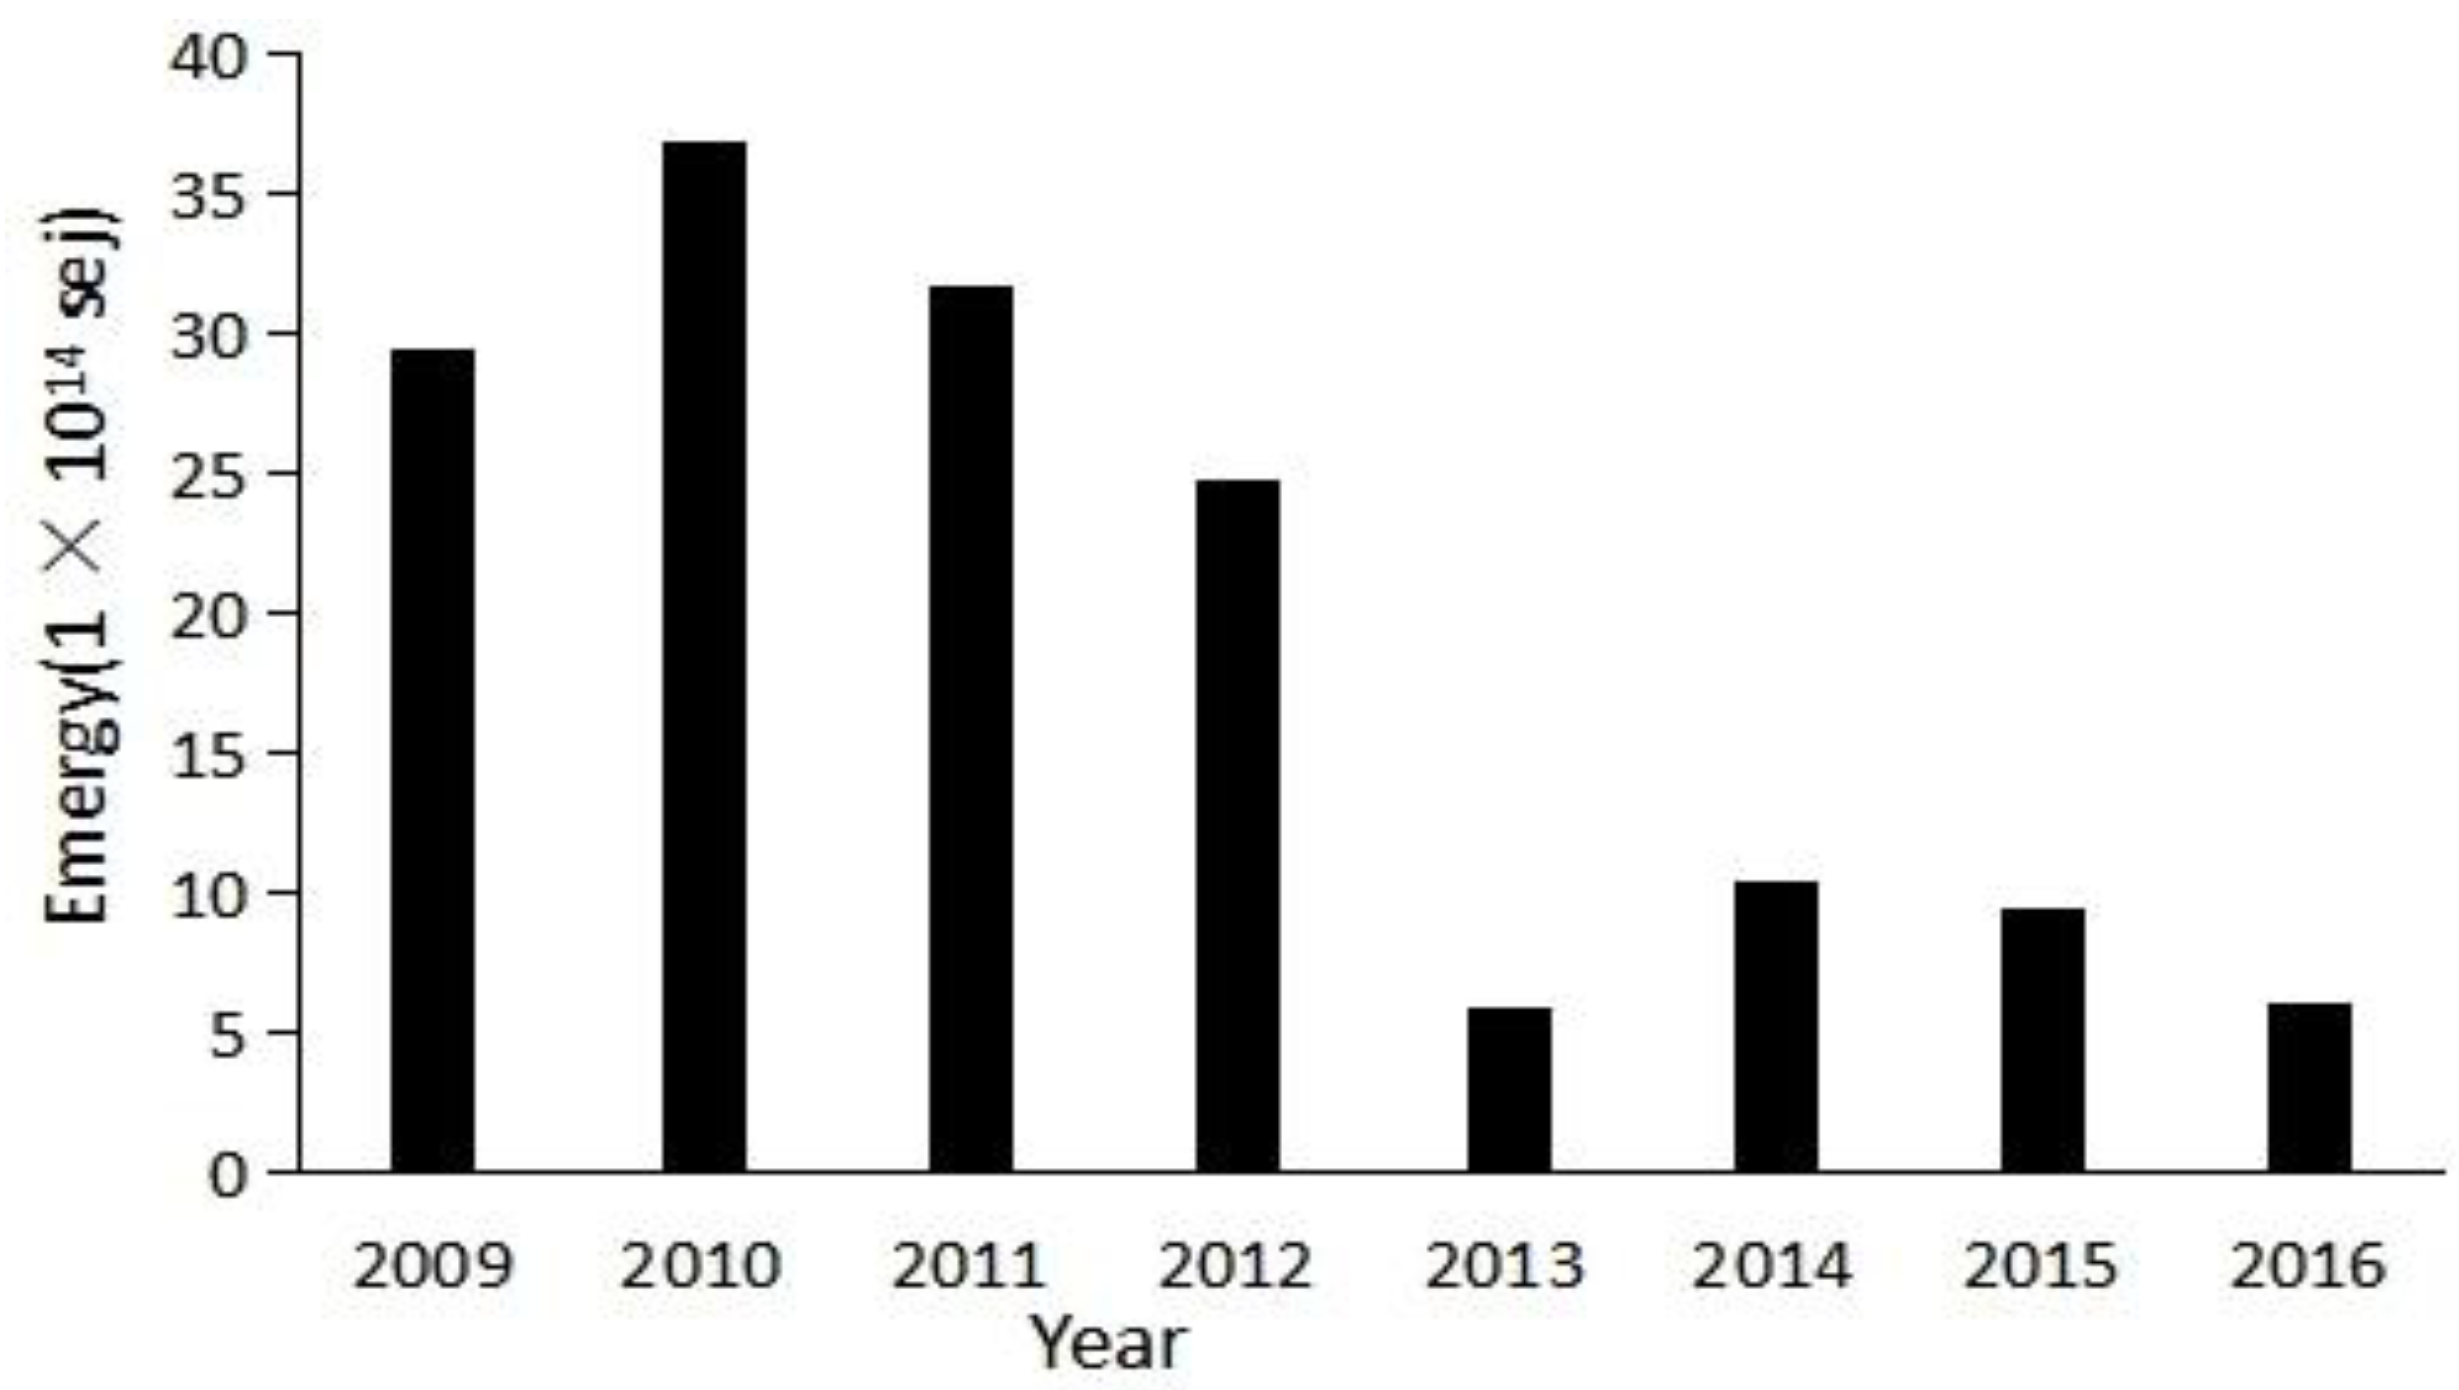
4.3.3. Per Capita Emergy Consumption
With the continuous increase in population in Shenzhen City, the emergy of resources for social and economic development is also increasing, and the per capita emergy consumption shows an overall declining trend (Figure 6). In 2010, the per capita emergy consumption was 36.86 × 10¹⁴ sej, and, in 2013, it fell to 5.98 × 10¹⁴ sej, which was followed by a small increase and decrease. Due to the intermittent nature of industrial upgrading, the per capita emergy consumption in 2014 and 2015 increased, respectively, compared to 2013 and 2016. This may have an adverse impact on the living standards and environmental quality on population.
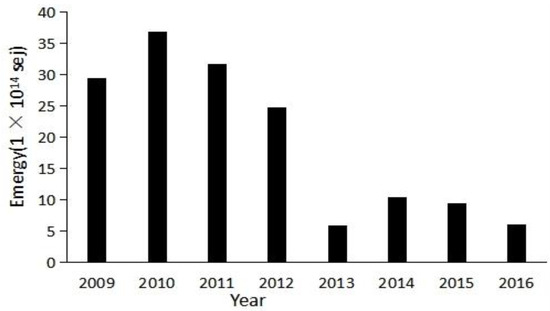
Figure 6.
Per capita emergy consumption in Shenzhen City’s foreign trade from 2009 to 2016.
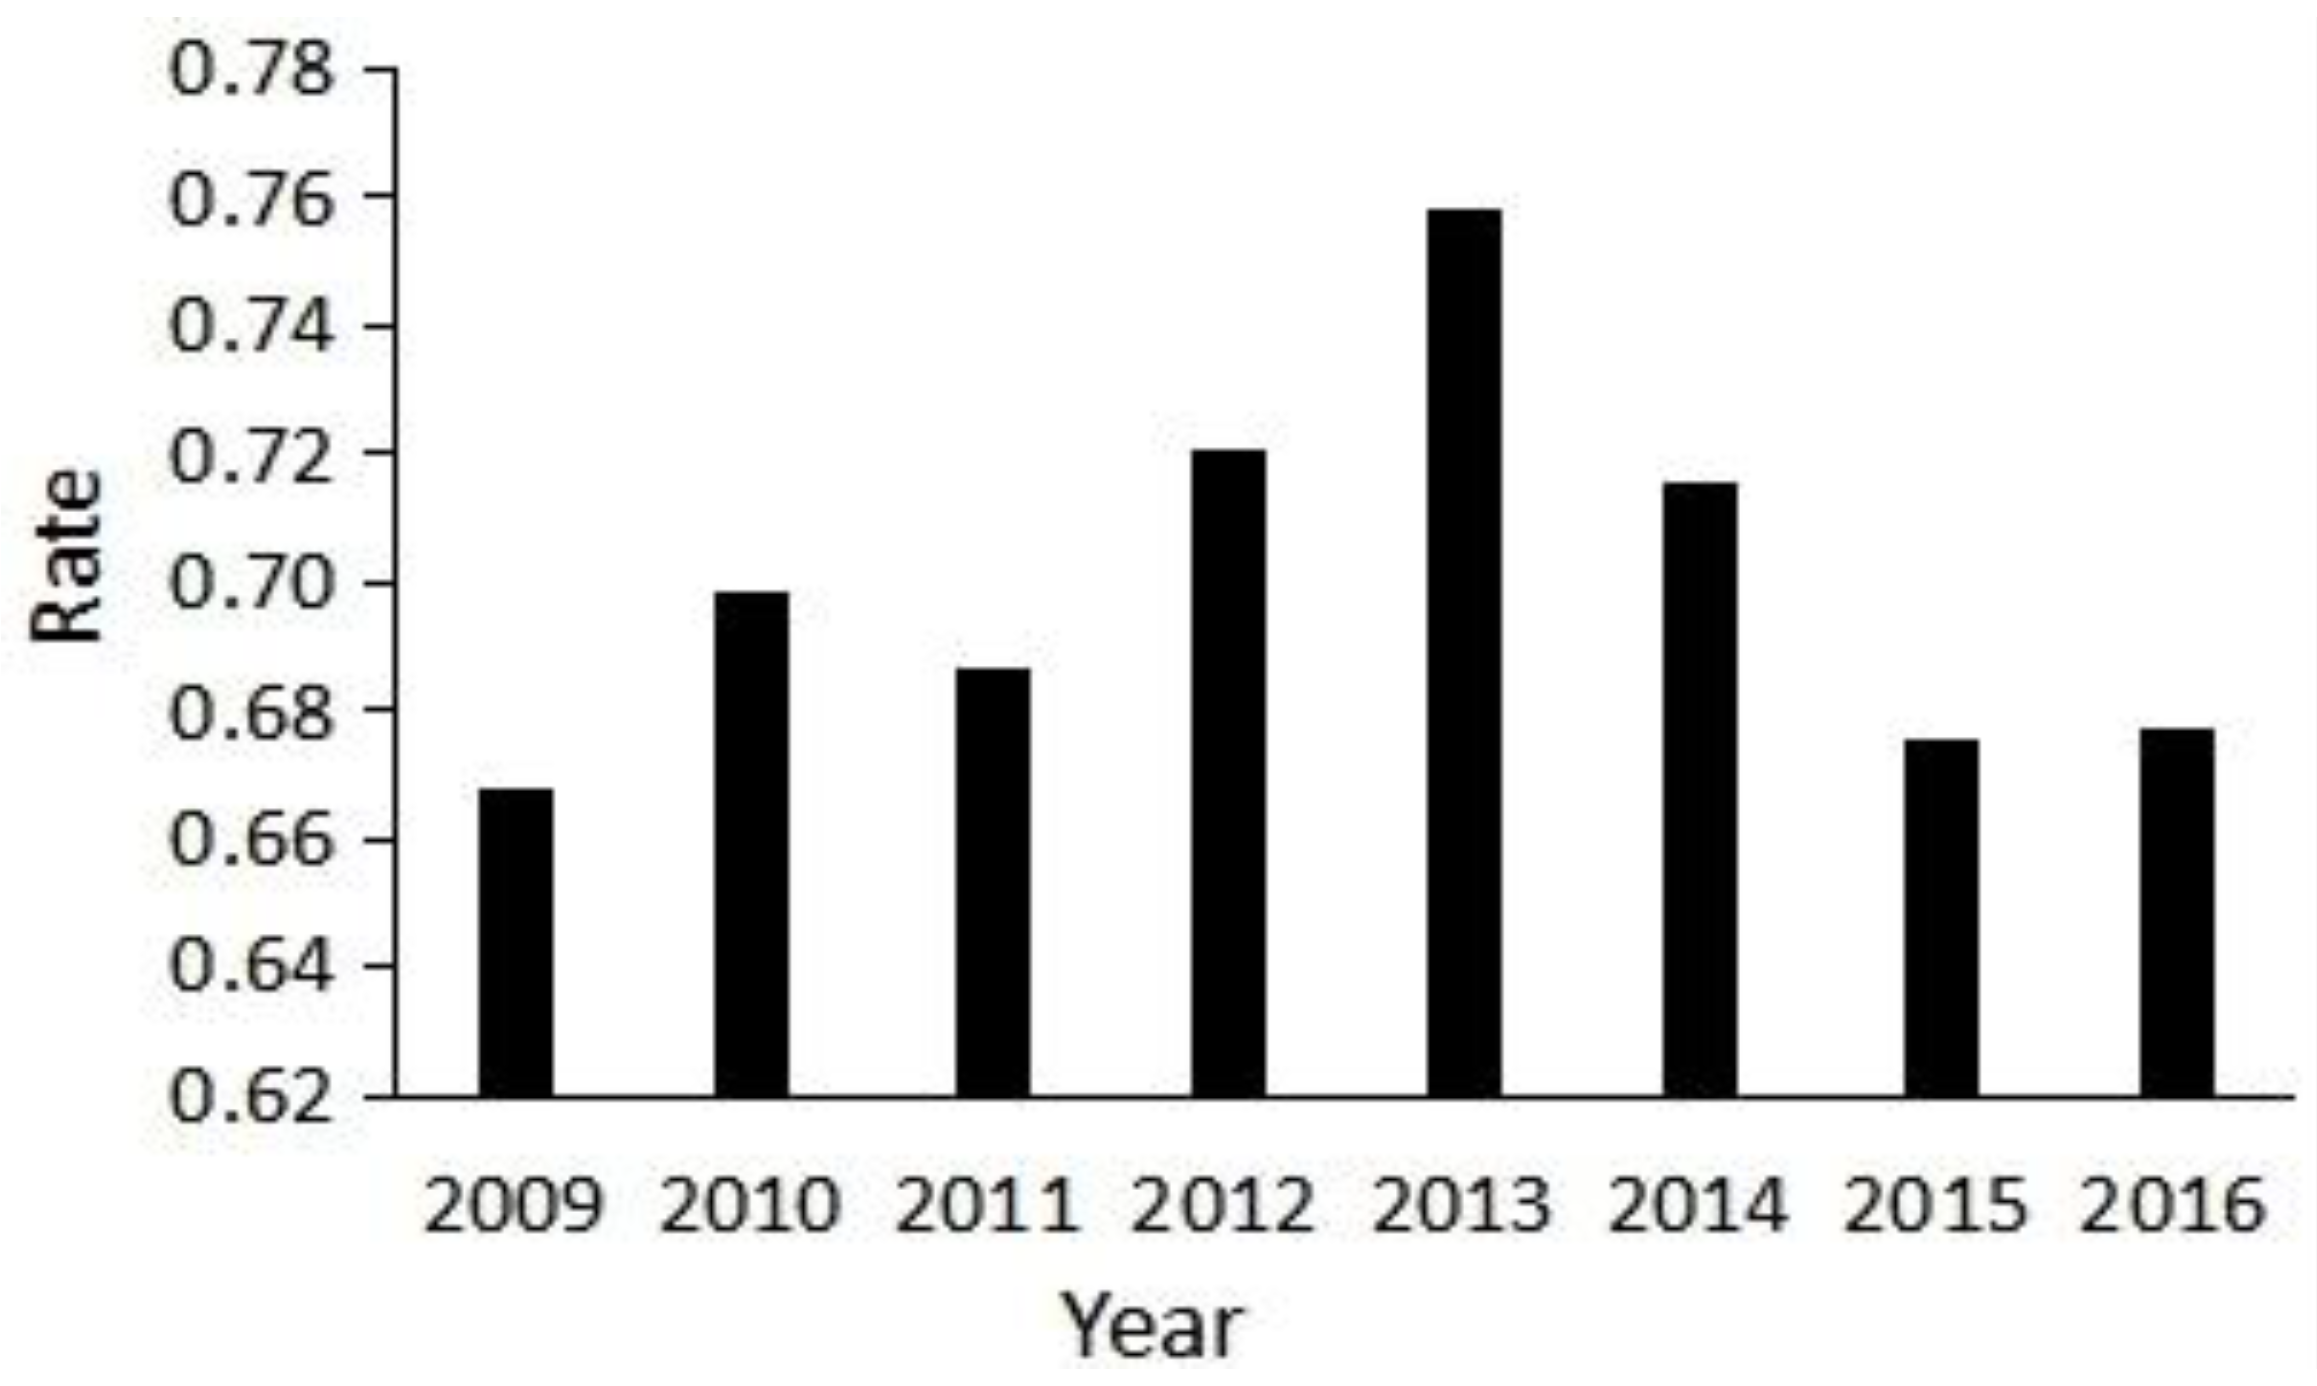
4.3.4. Emergy Benefit Rate
From the 2009 to 2016 energy benefit rate in Shenzhen City, the value-for-money benefit rate is shown to rise and fall in the range of less than one. Essentially, in the whole foreign trade, the import emergy of Shenzhen City is always less than the export emergy, and the output emergy is greater than the input emergy, which is in an unfavorable position (Figure 7). This reflects the unreasonable structure of foreign trade, and explains the irrationality of economic and industrial structures at a deeper level.
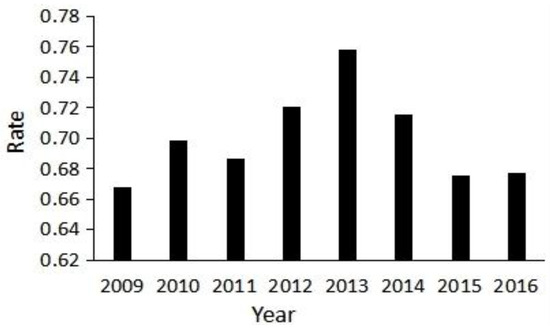
Figure 7.
Changes in the energy benefit rate of foreign trade in Shenzhen City from 2009 to 2016.
4.3.5. Total Emergy of Import and Export
In our current study, the total emergy of import and export is a summary of the import and export emergy values of 22 industries. Changes in the total emergy of foreign trade from 2009 to 2016 are shown in Figure 8. The data show that, after a slow rise in 2009 to 2011, a sharp decline began, which indicates that foreign trade in Shenzhen City may be in an unfavorable state, and its fairness remains to be seen. This situation may be affected by the international economic environment.
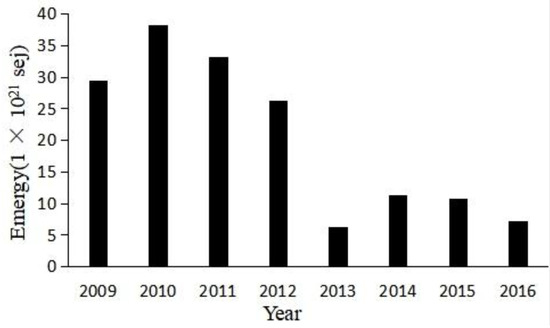
Figure 8.
Changes of total emergy of import and export of foreign trade in Shenzhen City from 2009 to 2016.
4.4. Comprehensive Evaluation of the Sustainable Development of Foreign Trade
After calculating the emergy of foreign trade in Shenzhen City via emergy analysis, the sustainability of foreign trade was evaluated using the emergy index system constructed from three aspects: economy, society, and environment, as shown in Table 5. Comprehensive analysis showed that foreign trade and sustainable development had great potential for improvement in Shenzhen City.
Table 5.
Analysis of emergy index system results.
4.5. Analysis of Key Industries
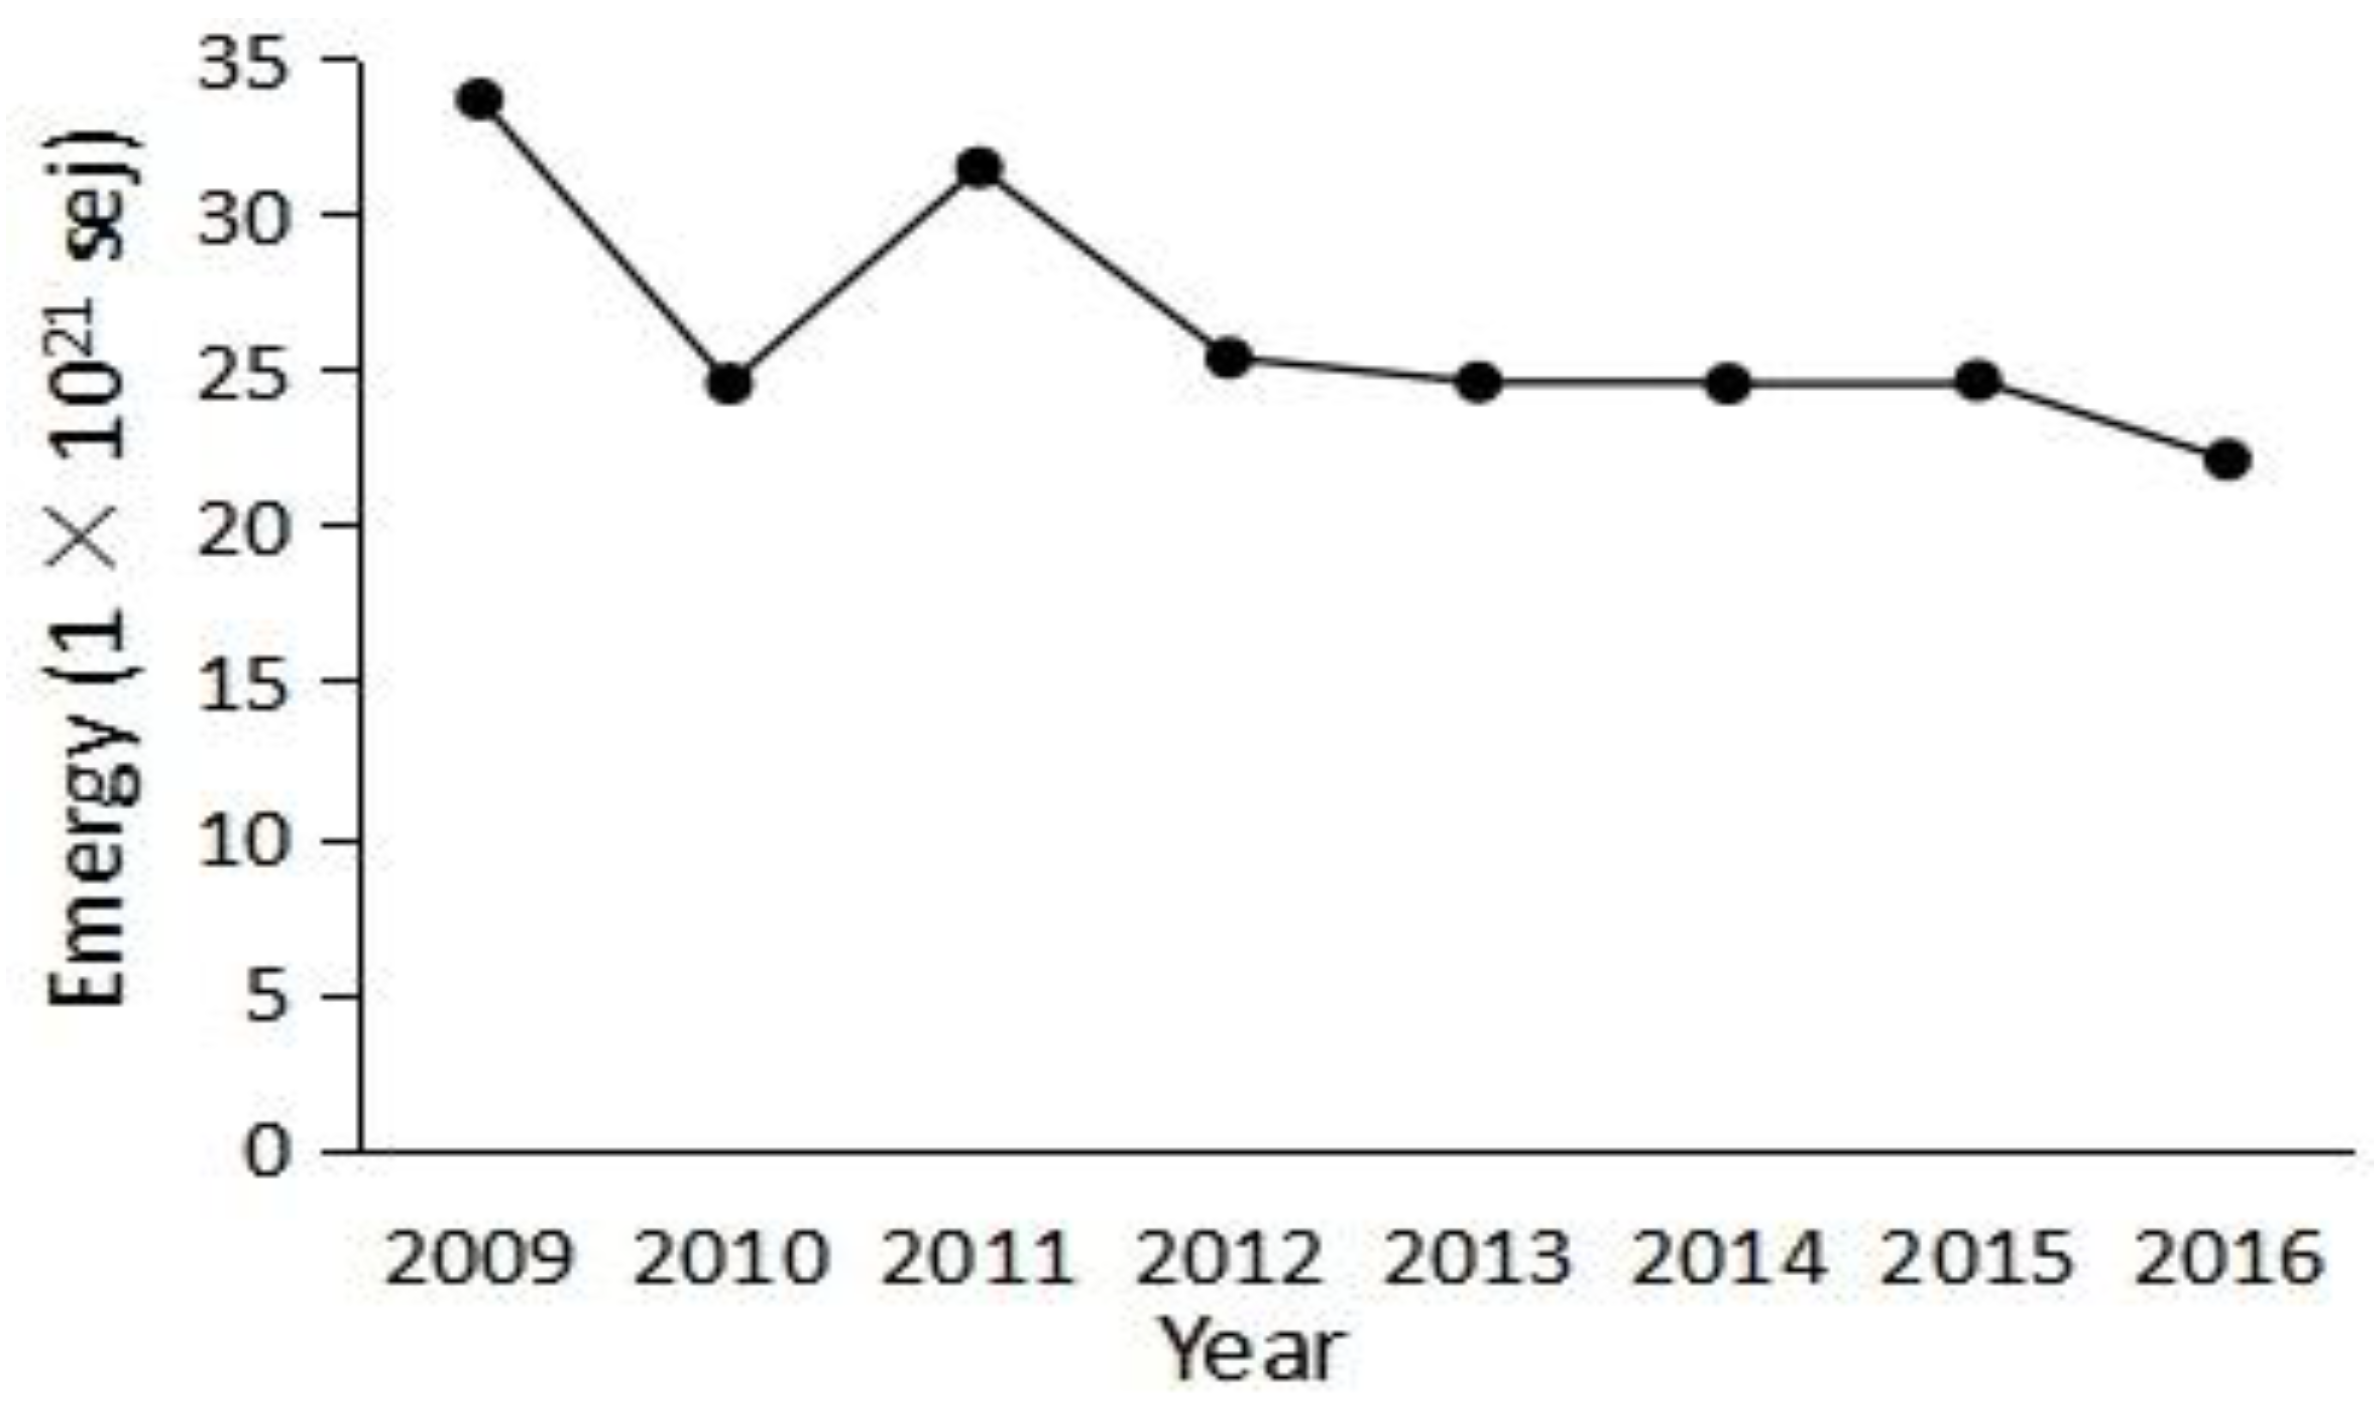
4.5.1. Emergy Analysis of Heavy Industry Sector
The heavy industry sector is comprised of 10 sectors including mining and mining industry, chemical industry, transportation equipment manufacturing industry, and its emergy consumption chart for 2009 to 2016, as shown in Figure 9.
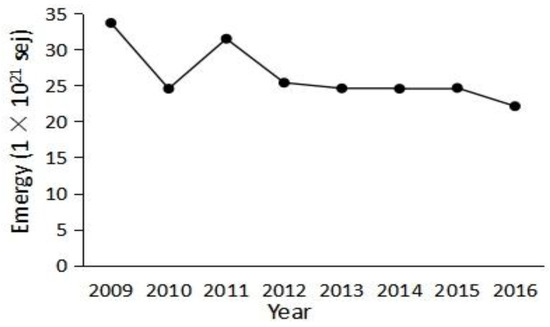
Figure 9.
Emergy consumption trend of heavy industry from 2009 to 2016.
The heavy industry sector’s trade value plummeted as a whole before 2010. After a sharp increase in 2010, it began to decline at a relatively steady rate in 2011 and was relatively stable in 2016 (Figure 9). These data show that the emergy of the heavy chemical industry trade in Shenzhen City has gradually developed in recent years in favor of ecology and sustainable trade development. With emphasis on and control of heavy energy pollution in Shenzhen City caused by heavy chemical industries, the heavy chemical industry export values are gradually reduced, which is beneficial for economic and environmental benefits. However, the opposite trend that occurred in 2010 implies the lack of current policy measures.
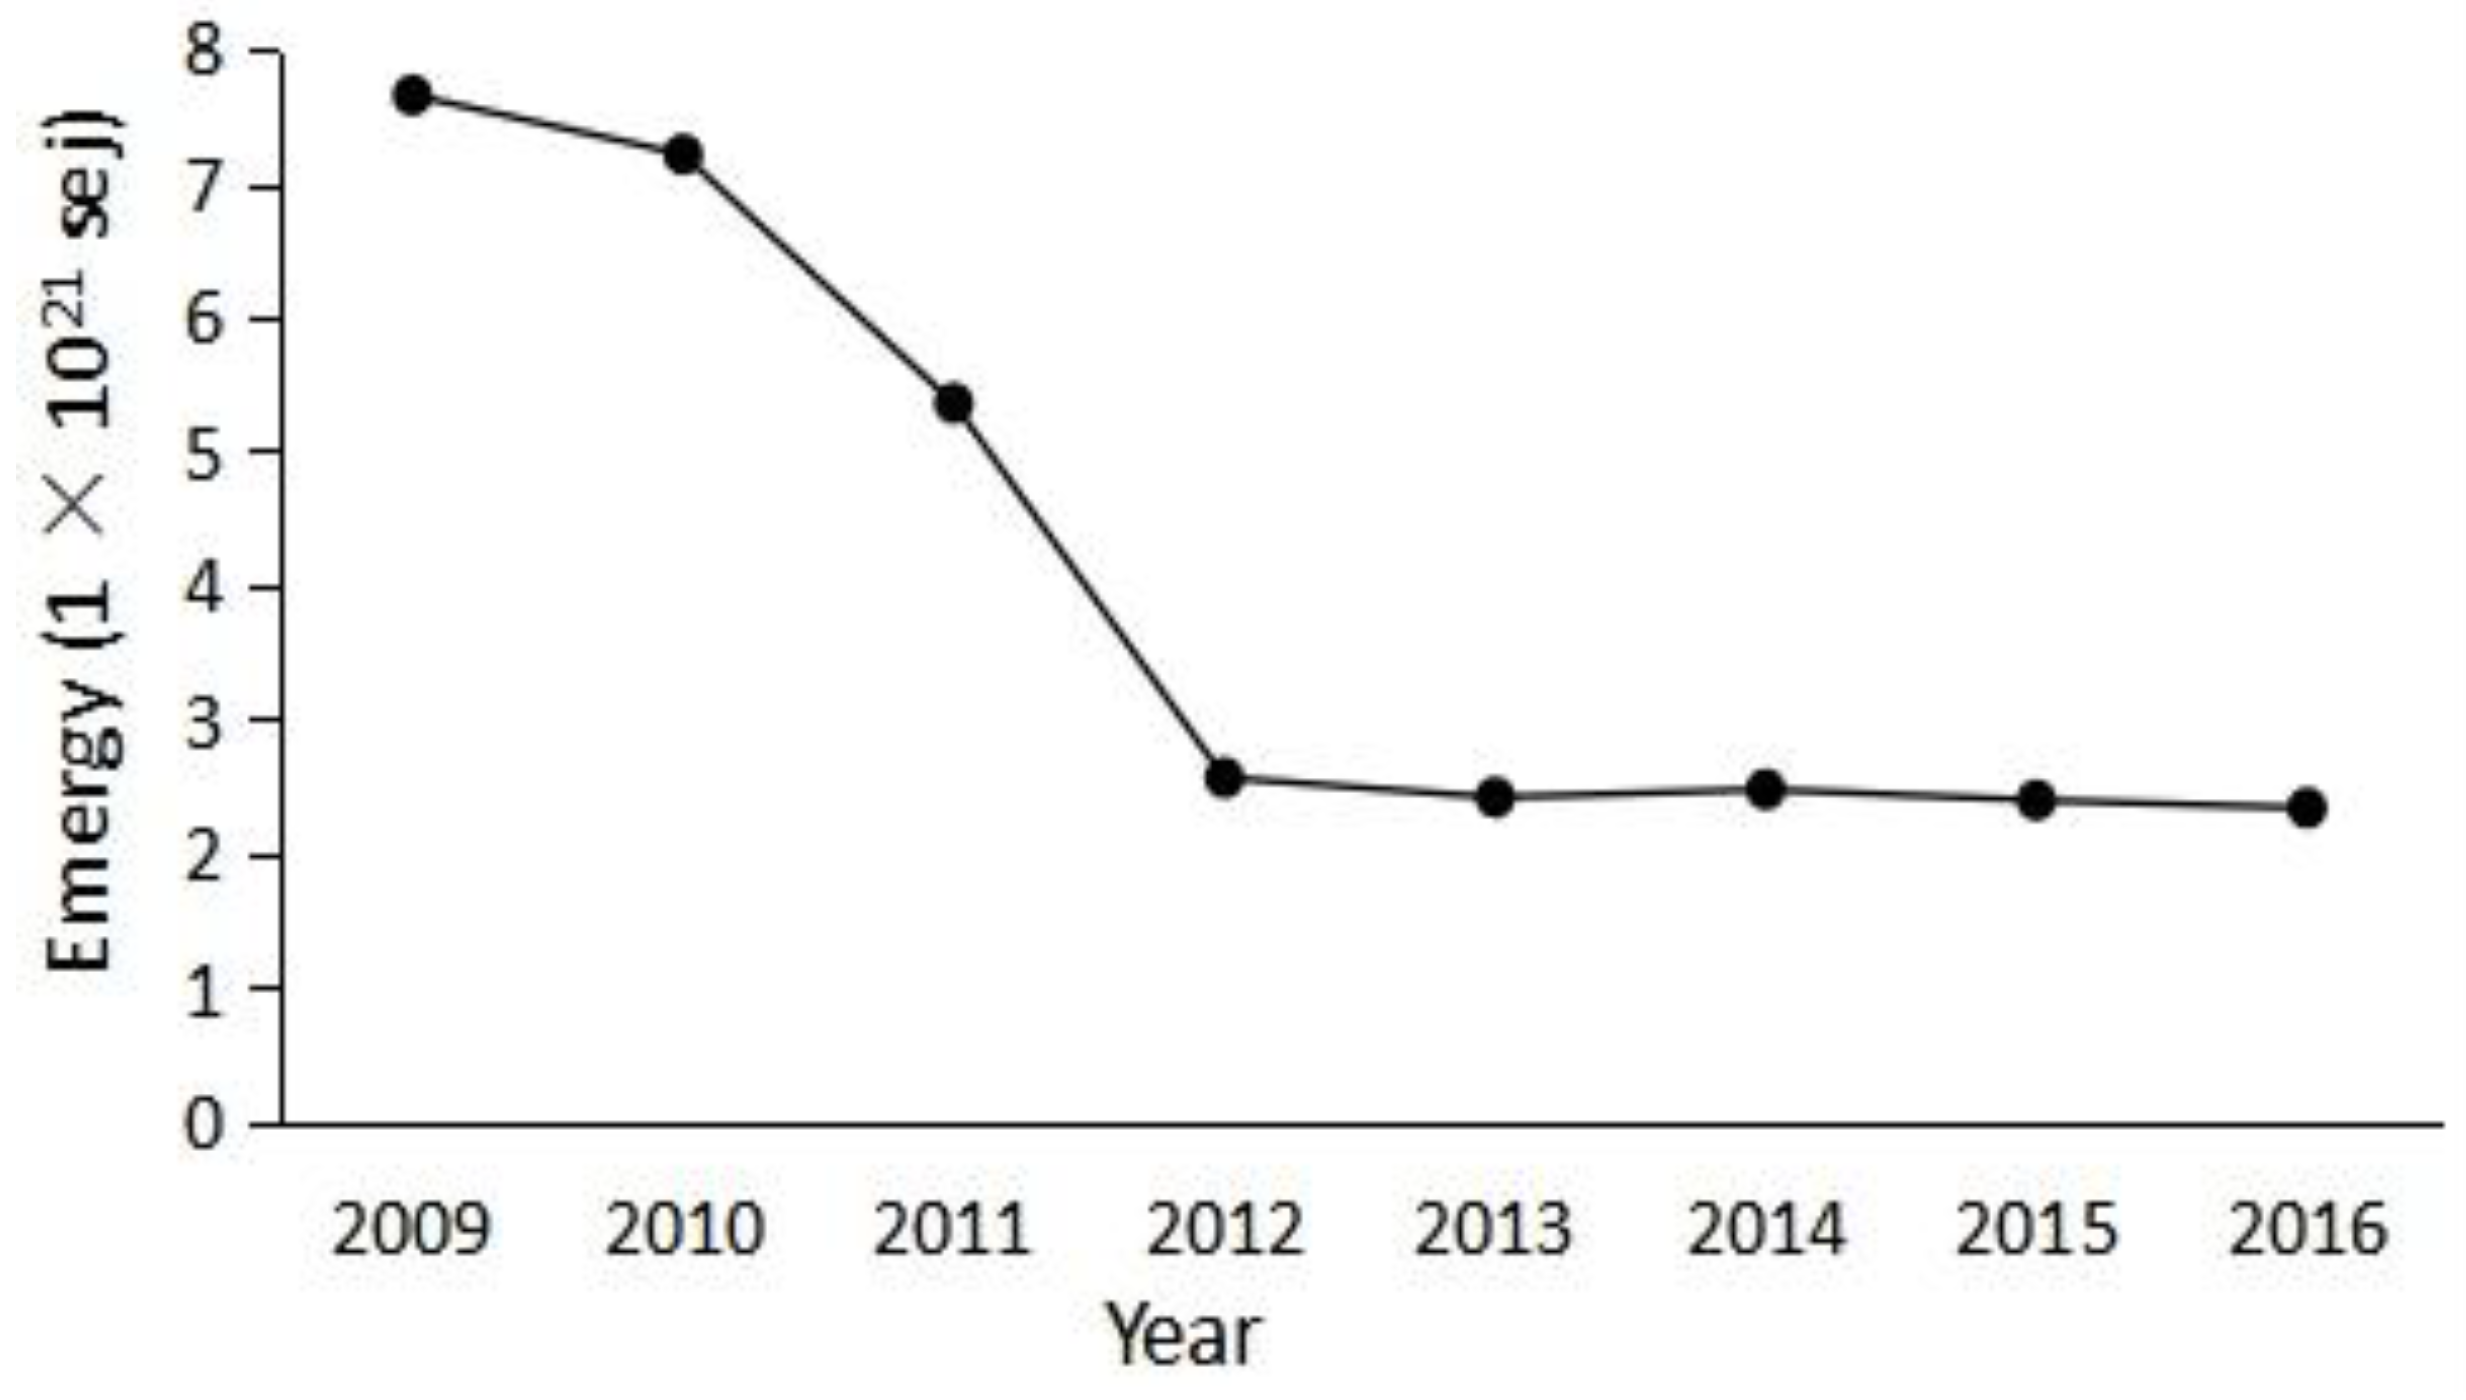
4.5.2. Emergy Analysis of the Light Industry Sector
According to the light industry sector’s definition and classification, the trend chart of the young industry emergy consumption from 2009 to 2016 was made, as shown in Figure 10.
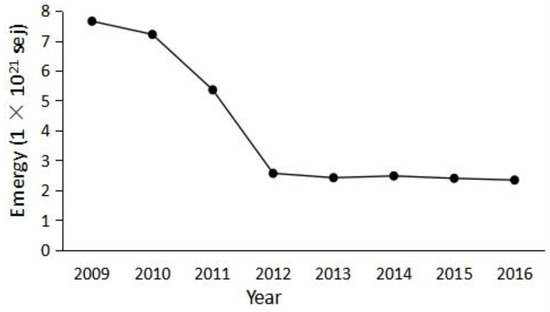
Figure 10.
Emergy consumption trend of light industry from 2009 to 2016.
The light industry sector’s emergy trend was very clear, especially since 2012, its curve remained almost stable, and both had a surplus from 2009 to 2016. In addition to the small fluctuations during the initial individual years, the overall performance of the light industry gradually decreased before 2012, and experienced a small to large decline. The large emergy surplus in the light industry sector indicated the outflow of ecological benefits in Shenzhen City. However, the overall light industry sector trade is in a state of inflow of economic interests, which represents a relatively contradictory situation. Therefore, it is necessary to take measures of regulation and control so that trade and ecology can achieve a win–win situation.
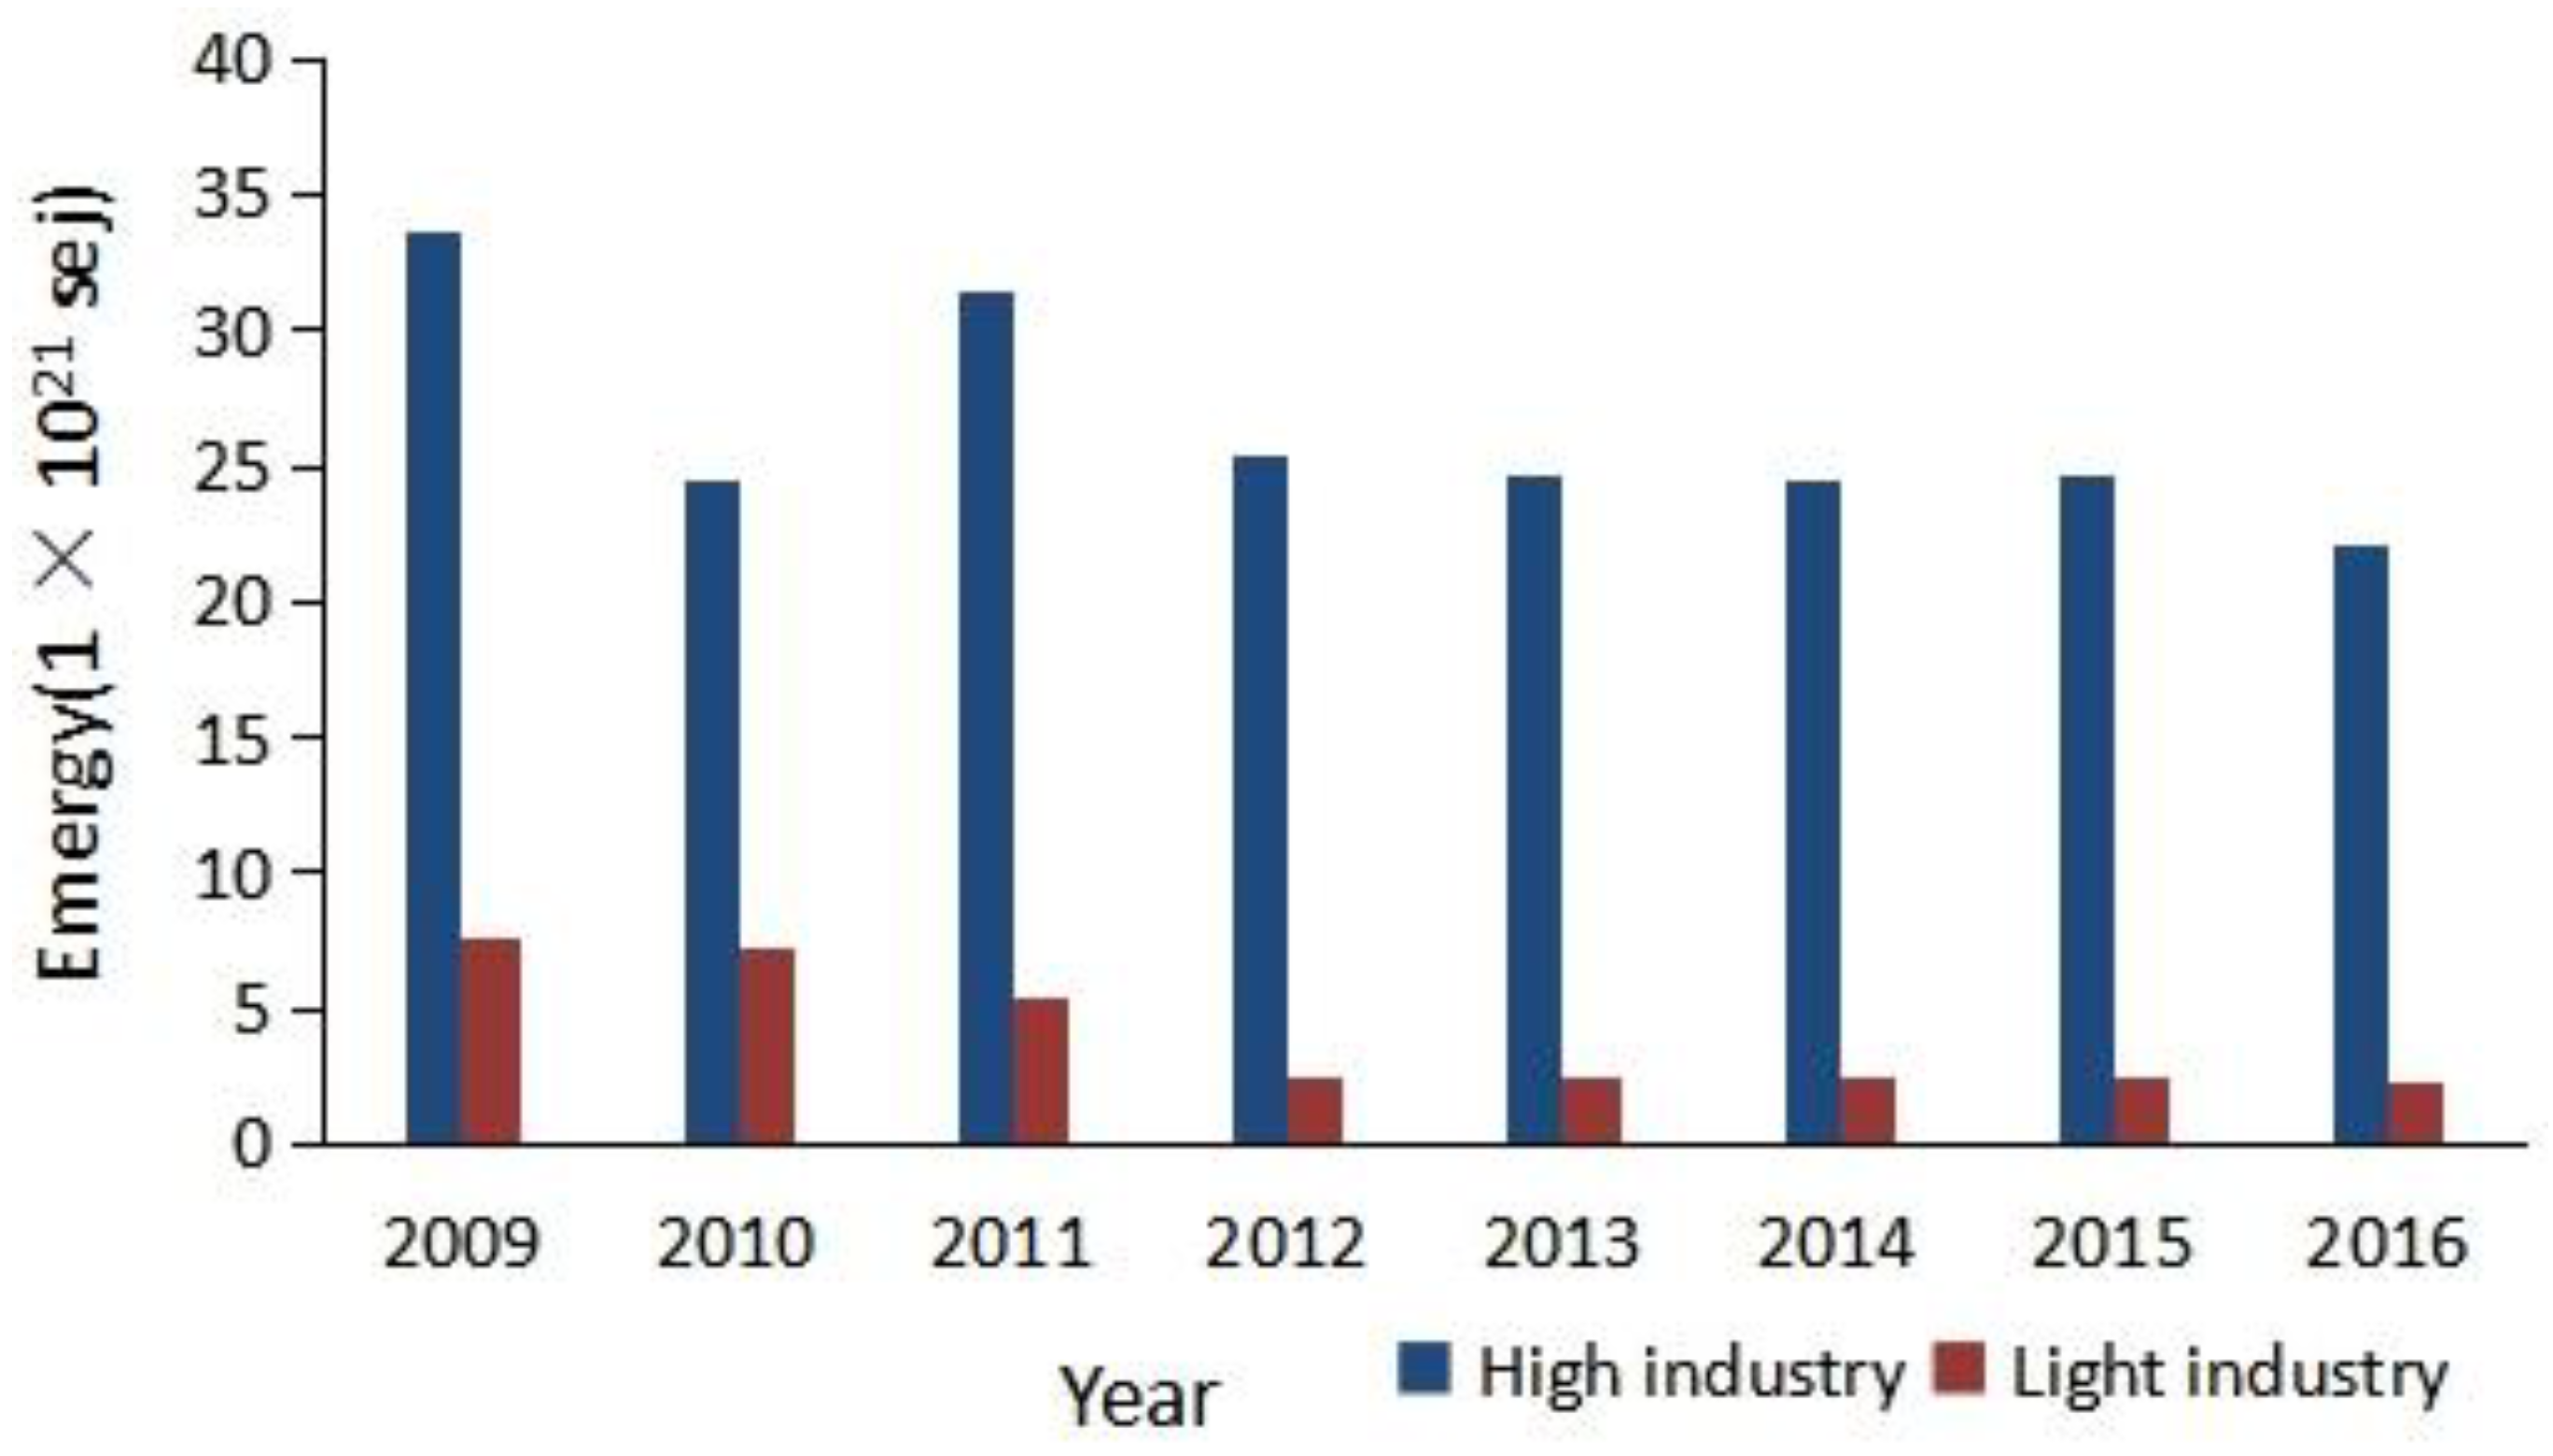
4.5.3. Comparative Analysis
A comparative analysis of trade emergys for light and heavy industrial sectors can be made by comparing the emergys from 2009 to 2016 heavy industry trade, as shown in Figure 11.
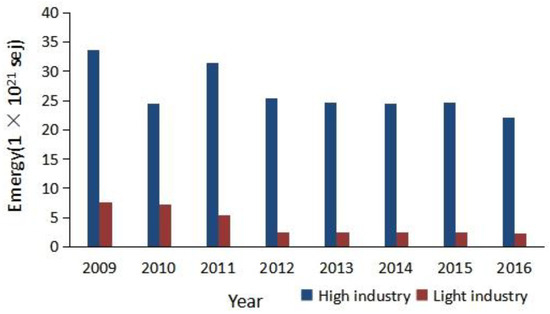
Figure 11.
Comparison of emergys of young heavy industry trade from 2009 to 2016.
The volatility of heavy industrial trade emergys was more severe, while the fluctuation of trade emergys in the light industry sector generally declined over time. From 2009 to 2016, the emergy of trade in the heavy chemical industry sector was greater than that in the light industry sector. The specific comparative analysis showed that, even though there was a trade surplus in the heavy chemical industry sector, it caused damage to the ecological interests of Shenzhen City. However, in recent years, the surplus values have been shrinking in the direction of foreign trade sustainable development. Although the light industry sector has greatly developed, the difference between the export and import emergy is still increasing year by year, which indicates that there is too much emergy flowing out of the light industry production sector in Shenzhen City, and measures must be recorded to improve it.
4.5.4. Analysis on the Sustainable Development of Foreign Trade in Light and Heavy Industries
The emergy analysis method can be used to measure the industry’s internal time change analysis and the foreign trade, according to the light and heavy industries. This reflects the overall situation of the three subsystems of foreign trade in Shenzhen City: economy, society, and environment.
The inter-annual changes in industrial structure in Shenzhen City show that foreign trade relies on heavy industries with lower energy quality, while light industries with higher energy quality account for a smaller proportion, and the natural economic benefits of high-energy industry resources are less than low-energy industries. This leads to the loss of natural resources in foreign trade, which reflects the irrational structure of the foreign trade industry. Although the heavy chemical industry sector suffers from the trade surplus value, it causes certain damage to ecological interests. However, in recent years, the surplus value has been shrinking. It is conducive to the development of ecology and sustainable trade.
In summary, the industrial structure in Shenzhen City requires further adjustment. Although the current sustainable development of foreign trade is not optimistic, it is in a state of gradual optimization.
5. Conclusions
In Shenzhen City, from the perspective of foreign trade emergy analysis, foreign trade was in an unfavorable environment from 2009 to 2016. The emergy purchased by the unit currency is gradually declining, and the value of natural resources is rising. People’s living standards and quality of life may decline. The import emergy is always less than the export emergy, and the output emergy is greater than the input emergy, which is at a disadvantage. It can be seen that, during this period, the sustainable development of foreign trade suffered a certain degree of damage.
The emergy of import and export trade in Shenzhen City is continuously lost. From a currency perspective, its scale continues to expand. The tension between the growth of foreign trade’s economic value and the loss of emergy reflects the irrational use of foreign trade for environmental resources. The ever-expanding scale of trade has adversely affected environmental resources, which makes it more difficult for foreign trade to achieve sustainable development.
In the import and export of light and heavy industry in Shenzhen, it can be seen that, on the one hand, the proportion of heavy industry emergy is significantly higher than that of light industry, which causes the outflow of emergy. This reflects the irrationality of the current industrial structure. On the other hand, the overall situation is gradually improving, and it is turning to the sustainable development direction of foreign trade.
In order to improve the outflow of energy in foreign trade and, ultimately, achieve the sustainable development of foreign trade in Shenzhen City, we propose the following strategies.
- (1)
- Improve resource utilization efficiency. According to the import and export industry emergy in Shenzhen City, huge ecological resources are directly and indirectly consumed in the production process of goods used for foreign trade. Improving resource utilization efficiency can result in the same or improved products with less resource consumption, which greatly reduces the outflow of emergys, and also fundamentally saves ecological resources.
- (2)
- Increase the import of energy products. Since 2009, the import emergy of energy products in Shenzhen City was less than their export emergy. The deficit increased the loss of energy consumption of import and export, and greatly tightened foreign trade’s net export value. Therefore, more energy products should be imported from major energy countries in the future. This way, acquiring ecological benefits is increased, which can also serve as a strategic energy reserve.
- (3)
- Adjust the industrial structure. The inter-annual changes in Shenzhen’s industrial structure show that foreign trade depends on heavy industries with low energy quality, and light industry with higher energy quality accounts for a relatively small proportion. Therefore, Shenzhen should optimize its industrial structure and promote the development of the circular economy in terms of sustainable development, implement energy conservation and emission reduction, and increase the development of cleaner production.
Author Contributions
Each one of the authors contributed according to their research specialty in this review. More specifically, Y.T. wrote this thesis. S.X. and J.M. provided guidance on data and editing. C.L. and H.L. provided technical support and editing support.
Funding
The National Water Pollution Control and Treatment Science and Technology Major Project (2017ZX07301-001) and 1125 project of Zhengzhou City financially supported this work.
Acknowledgments
We would like to extend special thanks to the editor and the anonymous reviewers for their valuable comments in greatly improving the quality of this paper.
Conflicts of Interest
The authors declare no conflict of interest.
References
- Genus, A.; Theobald, K. Roles for university researchers in urban sustainability initiatives: The UK Newcastle Low Carbon Neighbourhoods project. J. Clean. Prod. 2015, 106, 119–126. [Google Scholar] [CrossRef]
- Tao, Z. Post-crisis trade protectionism and its countermeasures. Bus. Res. 2011, 4, 148–152. [Google Scholar]
- Li, H. Emergy Analysis and Sustainable Development of Ecological and Economic System in Shenzhen City; Fujian Normal University: Fuzhou, China, 2011. (In Chinese) [Google Scholar]
- Liu, C. Research on the Coordinated Development of Foreign Trade and Low-Carbon Economy in Shandong Province; Shandong University: Jinan, China, 2012. (In Chinese) [Google Scholar]
- Cao, R.; Kang, L. Problems and countermeasures of environmental trade barriers in international trade. Environ. Prot. Circ. Econ. 2011, 31, 66–69. (In Chinese) [Google Scholar]
- Balassa, B. Trade Liberalisation and “Revealed” Comparative Advantage. Manch. Sch. 1965, 33, 99–123. [Google Scholar] [CrossRef]
- Yang, P.; Zheng, D. Sustainable development of China’s foreign trade under the background of low carbon economy. J. Price 2010, 5, 37–39. (In Chinese) [Google Scholar]
- You, W. Free Trade and Environmental Pollution: Theoretical Analysis and Empirical Research in China; Shandong University: Jinan, China, 2011. (In Chinese) [Google Scholar]
- Bastianoni, S.; Marchettini, N. Mergy/exergy ratios of the level of organization of systems. Ecol. Model. 1997, 99, 33–45. (In Chinese) [Google Scholar] [CrossRef]
- Shen, L.; Guo, X. Spatial quantification and pattern analysis of urban sustainability based on a subjectively weighted indicator model: A case study in the city of Saskatoon, SK, Canada. Appl. Geogr. 2014, 53, 117–127. [Google Scholar] [CrossRef]
- Shen, L.Y.; Ochoa, J.J.; Shah, M.N.; Zhang, X. The application of urban sustainability indicators—A comparison between various practices. Habitat Int. 2010, 35, 17–29. [Google Scholar] [CrossRef]
- Lan, S.; Odum, H.T. Emergy Synthesis of the Environmental Resource Basis and Economy in China. Ecol. Sci. 1994, 13, 63–74. [Google Scholar]
- Odum, H.T.; Lan, S.; Liu, X. Energy Flow and Emergy Analysis of the Agroecosystems of China. Ecol. Sci. 1998, 1, 34–41. [Google Scholar]
- Sui, C.; Lan, S. Analysis and comparison of emergys of urban ecosystems in Guangzhou and Shanghai. Urban Environ. Urban Ecol. 2006, 19, 1–3. (In Chinese) [Google Scholar]
- Guo, X. Study on the spatial and temporal changes of sustainable development of Shanxi Province based on emergy analysis. In Summary of Papers of the Annual Meeting of the Economic Geography Committee of the Chinese Geographic Society; Economic Geography Professional Committee of China Geographical Society: Beijing, China, 2017. (In Chinese) [Google Scholar]
- Tan, C. Emergy Analysis and Scenario Prediction of Ecological and Economic System in Heilongjiang Province; Northeast Forestry University: Harbin, China, 2012. (In Chinese) [Google Scholar]
- Zhang, H.; Huang, M.; Hu, X. Green GDP accounting of Fujian Province based on emergy analysis. Acta Geogr. Sin. 2010, 65, 1421–1428. (In Chinese) [Google Scholar]
- Zhang, Y. Empirical Study on Sustainable Development Level of Foreign Trade in Sichuan Province; Southwestern University of Finace and Ecnomics: Chengdu, China, 2011. (In Chinese) [Google Scholar]
- Lei, K.; Wang, Z. Emergy synthesis of tourism-based urban ecosystem. J. Environ. Manag. 2007, 88, 831–844. [Google Scholar] [CrossRef] [PubMed]
- Li, H.; Brown, M. Emergy-based environmental accounting toward a sustainable Mongolia. J. Geogr. Sci. 2017, 27, 1227–1248. [Google Scholar] [CrossRef]
- Tilley, D.R.; Price, J.; Campbell, E. Emergy synthesis for valuing the ecosystem services of green walls and other vegetated building envelope technologies. In Proceedings of the XVIIth World Congress of the International Commission of Agricultural and Biosystems Engineering (CIGR), Québec City, QC, Canada, 13–17 June 2010. [Google Scholar]
- Lan, S.; Qin, P.; Lu, H. Emergy Analysis of Ecological Economic System; Chemical Industry Press: Beijing, China, 2002. [Google Scholar]
- Wang, J. Research on the Ecological Benefits of China’s Foreign Trade Based on Emergy Analysis; Zhejiang University: Hangzhou, China, 2009. (In Chinese) [Google Scholar]
- Giannantoni, C.; Zoli, M. The Four-Sector Diagram of Benefits (FSDOB) as a method for evaluating strategic interactions between humans and the environment. Ecol. Econ. 2009, 69, 486–494. [Google Scholar] [CrossRef]
- Lei, K.; Wang, Z.; Ton, S. Holistic emergy analysis of Macao. Ecol. Eng. 2008, 32, 30–43. [Google Scholar] [CrossRef]
- Geng, Y.; Tian, X.; Sarkis, J.; Ulgiati, S. China-USA Trade: Indicators for Equitable and Environmentally Balanced Resource Exchange. Ecol. Econ. 2017, 132, 245–254. [Google Scholar] [CrossRef]
- Ghaley, B.B.; Porter, J.R. Emergy synthesis of a combined food and energy production system compared to a conventional wheat (Triticum aestivum) production system. Ecol. Indic. 2013, 24, 534–542. [Google Scholar] [CrossRef]
- Siche, J.R.; Agostinho, F.; Ortega, E.; Romeiro, A. Sustainability of nations by indices: Comparative study between environmental sustainability index, ecological footprint and the emergy performance indices. Ecol. Econ. 2007, 66, 628–637. [Google Scholar] [CrossRef]
- Fang, C.; Ren, Y. Analysis of emergy-based metabolic efficiency and environmental pressure on the local coupling and telecoupling between urbanization and the eco-environment in the Beijing-Tianjin-Hebei urban agglomeration. Sci. China Earth Sci. 2017, 66, 1083–1097. [Google Scholar] [CrossRef]
- Cao, K.; Feng, X.; Wan, H. Applying agent-based modeling to the evolution of eco-industrial systems. Ecol. Econ. 2009, 68, 2868–2876. [Google Scholar] [CrossRef]
- Zarbá, L.; Brown, M.T. Cycling emergy: Computing emergy in trophic networks. Ecol. Model. 2015, 315, 37–45. [Google Scholar] [CrossRef]
- Li, P. How to realize sustainable development of China’s foreign trade in the “twelfth five-year plan” period—A case study of quanzhou. J. Xi’an Pet. Univ. (Soc. Sci. Ed.) 2011, 20, 37–41. (In Chinese) [Google Scholar]
- Lan, S.F.; Odum, H.T.; Liu, X.M. Emergy Flow and Emergy Analysis of the Agroecosystems of China. Ecol. Sci. 1998, 6, 32–39. [Google Scholar]
- Li, S.; Fu, X.; Zheng, D. Emergy analysis of China’s sustainable economic development. J. Nat. Resour. 2001, 4, 297–304. [Google Scholar]
- Li, J. Thoughts on promoting the sustainable development of China’s foreign trade. Macroecon. Manag. 2010, 9, 45–46. (In Chinese) [Google Scholar]
- Cuadra, M.; Rydberg, T. Emergy evaluation on the production, processing and export of coffee in Nicaragua. Ecol. Model. 2006, 196, 421–433. [Google Scholar] [CrossRef]

© 2019 by the authors. Licensee MDPI, Basel, Switzerland. This article is an open access article distributed under the terms and conditions of the Creative Commons Attribution (CC BY) license (http://creativecommons.org/licenses/by/4.0/).