1. Introduction
The phenomenon of globalization has led to increased disparities between wealthy and developing countries, but also between rich and poor citizens within each country. Thus, one of the priorities of the Europe 2020 strategy is to combat poverty and reduce by at least 20 million, the number of people suffering or at risk of suffering from poverty and social exclusion [
1]. At the same time, with the expansion of globalization, emerging countries in the European Union have witnessed a rapid increase in labor migration. The number of migrant workers hired abroad has grown considerably, with thousands of young people leaving their country every day, but not all migrants are immediately successful in finding a job and start sending money to their country of origin. Current private transfers made by non-residents (living in the host country for more than one year) in their country of origin are called “remittances” [
2].
Remittances may lead to the development of a country, by stimulating human and physical capital, by alleviating poverty and inequality. Remittances reduce poverty by increasing income, allow higher investment in physical assets, education, and health, and also allow access to a wide range of knowledge. This suggests that remittances may have a significant positive impact on income or consumption and a significant negative impact on poverty. However, remittances do not enter the country of origin without costs. In some cases, the income generated by the household members can be reduced due to the emigration of some members that are sending remittances. However, the remaining members can make various investments, which can lead to the economic growth of the respective community.
Remittances tend to decrease as the migrant community become more stable in the country of destination, or as the economic conditions of the host country deteriorate. At household level, remittance reliance leads to neglecting family productive activities while at a community, and regional level, it leads to increased inequality between families receiving remittances and those who do not receive them—it also leads to higher inflation.
The flow of remittances out of a country also depends on the migrants’ plans to return to the host country; if they stay temporarily, they tend to send more money than if they intend to stay for a long period of time.
As a result of their growing volume and stable nature, remittances have become a topic of interest to many economists. In this paper, we aimed to study the impact of remittances on reducing poverty in the emerging countries of the European Union, by increasing household incomes.
The risk of poverty threshold is a macroeconomic indicator used to measure poverty [
3,
4], referring to the level of economic resources needed to ensure that the lifestyle is considered acceptable. Poverty risk ratio is the share of people with an equivalent disposable income (after social transfers) below the poverty risk threshold, which is set at 60% of the national median equivalized disposable income, after transfers. Risk of poverty threshold does not measure wealth or poverty, but a low income compared to other residents in that country, which does not necessarily imply a low standard of living [
5]. For poverty indicators, adult disposable income is calculated based on the household’s total disposable income, divided by the adult-equivalent size of the household.
This study is part of a series dedicated to the analysis of causal relationships and interdependencies between economic indicators such as economic growth, remittances, risk of poverty threshold, income inequality, and personal incomes. In a previous study using data for the EU countries and a linear regression model, we found that the influence of the poverty risk threshold on income inequality is strongly determined by their trend in the emerging EU countries [
6]. In another study we analyzed the evolution and trends of the share of remittances in gross domestic product [
7]. In this context, in this paper, we perform first a statistical-descriptive analysis of the involved macroeconomic indicators per capita global remittances, risk of poverty threshold, we analyze the evolution of remittances received from worldwide in the emerging countries in the European Union (EU), and, finally, we estimate and predict the evolution of remittances share in risk of poverty threshold by means of several time-dependent polynomial regression models, using available data for the EU member states, for the period 2005–2017.
The paper is organized as follows:
Section 2 discusses a brief review of literature on empirical studies concerning the analyzed indicators (per capita global remittances; risk of poverty threshold on household member; and share of global remittances in risk of poverty threshold).
Section 3 describes the empirical models, estimation methodology, and the data source.
Section 4 presents empirical investigation and results, while
Section 5 contains some discussion. Finally, in the last section, conclusions of this study are formulated, and limitations and future research avenues are emphasized.
As risk of poverty threshold is a significant macroeconomic indicator to measure the quality of life in a country, in this paper we analyze the extent to which the volume of remittances influences the welfare of the citizens of the countries of origin. At the same time, poverty reduction is a priority set by the Council of Europe in the Europe 2020 strategy, according to which the number of Europeans with a living standard below the national poverty line should be reduced by 25% by 2020 [
1]. This study analyzes the share of remittances in the risk of poverty threshold for nine EU emerging countries, being a novelty in this configuration of macroeconomic indicators and not addressed in other specialized studies.
The results obtained are analyzed and interpreted economically, thus providing support for other studies as well as justifying design of governmental policies aiming to use of remittance flows in order to reduce the poverty rate and increase the quality of life in emerging EU member states. We may conclude that free movement of labor in the EU is an important factor for sustainable economic growth for both developed EU countries (by ensuring labor market stability) and emerging countries (through the remittances flow).
2. Materials
The impact of remittances on economic growth has been studied by a number of researchers at a macroeconomic or household level, and many have found a positive effect of remittances on economic growth, while others have found the opposite. The impact of poverty reduction may be long-term if households invest in business, agriculture or other types of activities. Overall, studies have focused on the analysis of the remittance impact on economic growth [
8,
9]. Some researchers find a positive relationship between remittances and economic growth [
10,
11,
12,
13], while others find a negative relationship, or not [
14,
15,
16,
17]. The positive impact on the macroeconomic level can be expressed in the consolidation of the balance of payments (by input of foreign currency in the countries of origin through remittances), in the increase of household incomes (which allows to meet basic needs but also investment in education, health, business etc.), all those may lead to growth of the local economy, and to financing of local or regional development projects. Remittances can reduce poverty through revenue growth, which allows investment in business, education and health.
While many studies have examined this relationship using a group of developing countries, several studies have analyzed the relation in different regions. Thus, the impact of remittances on economic growth in developing countries (for example, 57 countries), 1970–2017 [
18], or a group of seven Central and Eastern European countries [
19], has been analyzed.
Labor migration and remittances provide monetary and non-monetary benefits to beneficiary countries, communities and households. Directly, there is ample research stating that they contribute to improving the economic well-being of beneficiary families and reducing poverty [
20,
21].
However, the way remittances affect the welfare of the household, depends on the countries where the labor force migrates. Migrant workers often go through complicated legal processes in destination countries, and illegal migrants face even more challenges during travel, work and everyday life [
22].
A series of studies using micro and macro data prove the role of remittances in reducing poverty. Thus, the correlations between remittances, population migration, poverty and economic growth from the macro and microeconomic perspective were analyzed for 68 developing countries, and the period 1990–2010, the authors considering that remittances increase with increasing emigration, having a positive effect on poverty reduction, but the impact of remittances on economic growth is difficult to quantify [
23]. The impact of remittances on poverty has been analyzed for six emerging countries over the period 1994–2014, using two scenarios; a pessimistic one, where remittances negatively affect both economic growth and per capita income, and an optimistic one in which the remittance flow contributes to the reduction of poverty, the conclusion being the need to establish critical points that remittances have to overcome in order to reduce poverty in labor-exporting countries [
24].
Remittances are a new financial phenomenon and one of the major sources of revenue for emerging countries. The impact of remittances on the economic system is stronger in developing countries. Remittance flows to developing countries were more stable than other financial flows even when the global economy was affected by the 2009 global financial crisis [
25,
26]. Most studies on worker remittances have analyzed the effects of remittances, which are influenced by changes in the host country’s macroeconomic conditions more than changes in the country of origin [
27].
The positive impact materializes at the macroeconomic level in the consolidation of the balance of payments by providing foreign currencies (remittances are stable) at the household level, allows the family to meet their basic needs, to invest in education, health, business, etc., while at the community and regional level it leads to the growth of the local economy and the financing of some local development projects. Remittances have a positive impact on the credit rating of a country, providing an important and stable source of foreign currency that can reduce investors’ panic, cope with the balance of payments crisis and can be used for development projects [
28].
The negative impact at the macroeconomic level is manifested by the deterioration of the trade balance by stimulating the import and the appreciation of the local currency, the deterioration of the social balance. At the same time, remittances tend to decrease as the migrant community is more stable in the country of destination or as the economic conditions of the host country deteriorate. At the household level, remittance reliance leads to neglecting family productive activities, and at a community and regional level, it leads to increased inequality between families receiving remittances and those who do not receive, but also to rising inflation. It has been found that remittances have, on average, a negative impact on the rate of growth of African countries [
29].
The analysis of the long-term and short-term impact of remittances on financial development in developing countries has demonstrated the existence of a long-term positive and a slightly positive short-term relationship, with the exception of low-income countries [
30]. For Bangladesh, using household income and expenditure it was showed that remittance receipts led to a decline of about eighteen percent of poverty [
31]. At the same time, the link between migration, remittances, and poverty was analyzed both at household level and at macro level [
32].
The analysis of the long-term impact of remittances on economic growth in West Africa and the Caribbean over the period 1975–2011 showed that there is a significant long-term impact of labor remittances on incomes, while the impact on consumption is not significant [
33]. The increase in remittances is not due to existing migrations that raise earnings to send more remittances in hard times at home, but stem from increased migration as a result of income shocks [
34].
A number of researchers have studied the impact of remittances on poverty reduction, and according to some authors, remittances have no impact on poverty [
35], have a negative impact [
36], or have a strong positive impact on poverty [
37,
38,
39,
40]. The analysis of remittances, international migration, and poverty in the Kyrgyz Republic, Tajikistan and Uzbekistan shows that both international migration and remittances significantly reduce poverty in these Central Asian countries [
41].
The size and effects of remittances and emigration and their impact on poverty are analyzed on a sample of four Western Balkan countries: Macedonia, Albania, Serbia and Kosovo, and the conclusion is that while remittances will increase, emigration will show a slight decrease, but the level of poverty can be reduced by remittances [
42].
Analyzing the link between remittances and poverty, as well as the long-term impact of migrants’ return on poverty in Indonesia [
43], the authors conclude that while remittances contribute to poverty reduction, returning migrants to their home country will lead to increased poverty. The flow of remittances out of a country depends on migrants’ plans to return to the host country, they send more money if they stay temporarily than if they intend to stay for a long period of time.
The positive and long-term impact of remittances on economic growth in Latin American and Caribbean countries has been highlighted, but the West African countries do not confirm a long-term relationship [
44].
In conclusion, the studied literature suggests that there are results regarding the effects of migration and remittances on poverty, so this is a subject of interest.
3. Data, Model, Methodology
3.1. Data
The macroeconomic indicators used for the analysis in this study were as follows: risk of poverty threshold on household member (denoted by RPT, expressed in euro), per capita global remittances (REMW, expressed in euro) and their share in RPT (S_REMW_RPT, %). The values of these indicators over the period 2005–2017 for the nine emerging countries of the European Union (Bulgaria—BG, Czechia—CZ, Estonia—EE, Hungary—HU, Latvia—LV, Lithuania—LT, Poland—PL, Romania—RO, and Slovakia—SK) were taken from the Eurostat database [
3]. Per capita global remittances were obtained by dividing the annual values of global remittances for a country by the corresponding population volume. Theoretical models were estimated and the data were processed using econometric, data processing, and analysis software (EViews 9.5) [
45].
The statistical data collected from Eurostat showed that before 2005 there were few remittance values available only for a very small number of countries. This motivated the period (2005–2017) of choice in this study.
3.2. Models
In order to estimate and forecast the share of annual REMW into RPT different regression models were used. The general time regression model can be written as follows [
46]:
where:
is the discrete time,
is the response variable at the time
,
is function of time, depending of the
-dimensional parameter
. As
, the parameter terms
, ...,
are the regression coefficients that need to be estimated in order to determine the regression function
.
If
is an estimation of the regression coefficient
, the estimation of
is
, and the predicted value of previous equation is:
while the differences:
are the residual values (or estimation errors).
The most common method used in estimating parameters in regression analysis is the least squares method (LSM); that is, finding the parameters for which the sum of squared errors has a minimum value.
In this paper we chose to use the following polynomial time dependent regression models:
The linear time regression model:
where, t = 1, ...., n, refers to the time period. The terms
, are the unknown parameters to be estimated.
The signs of the coefficients of or specific relations between them determine the shape of the approximating curve. Thus, variable y follows an inverted U-shaped curve if . The critical value of is positive in the case it corresponds to a maximum value of the dependent variable y.
The cubic model:
where the signs of the coefficients of
or specific relations between them determine the shape of the approximating curve. Thus, the graph follows a N-shaped curve if
, and there exist two real critical values of variable t, namely
if
. In this case, as
, to
a maximum value of the dependent variable y corresponds, while to
a minimum value. The N-shaped curve signifies that the value of variable y starts rising to a first point of turning, then drops to a second critical point, after which it rises again, while the inverted N graph means the opposite, respectively a decrease to the first critical point, followed by increase to the second critical point, and then decrease.
While the linear model allows only to establish an increasing or decreasing tendency of the data set, the quadratic and cubic model may provide more interesting information, concerning empirically estimated turning points.
3.3. Econometric Methodology
Data collected from the Eurostat database contains information on two macroeconomic indicators for nine emerging EU countries for a period of 13 years (2005–2017). Firstly, we analyzed the evolution of remittances and the risk of poverty threshold over this period and determined their trends. At the same time, we analyzed the evolution of the share of global remittances on the risk of poverty threshold. Then, based on standard statistical descriptors (mean value, standard deviation, etc.), information on the chronological series distribution was obtained for the three indicators for EU emerging countries. Finally, we empirically estimated the theoretical models (1), (2) and (3) in order to study the share for each emerging country.
4. Empirical Findings and Results
4.1. Data Analysis
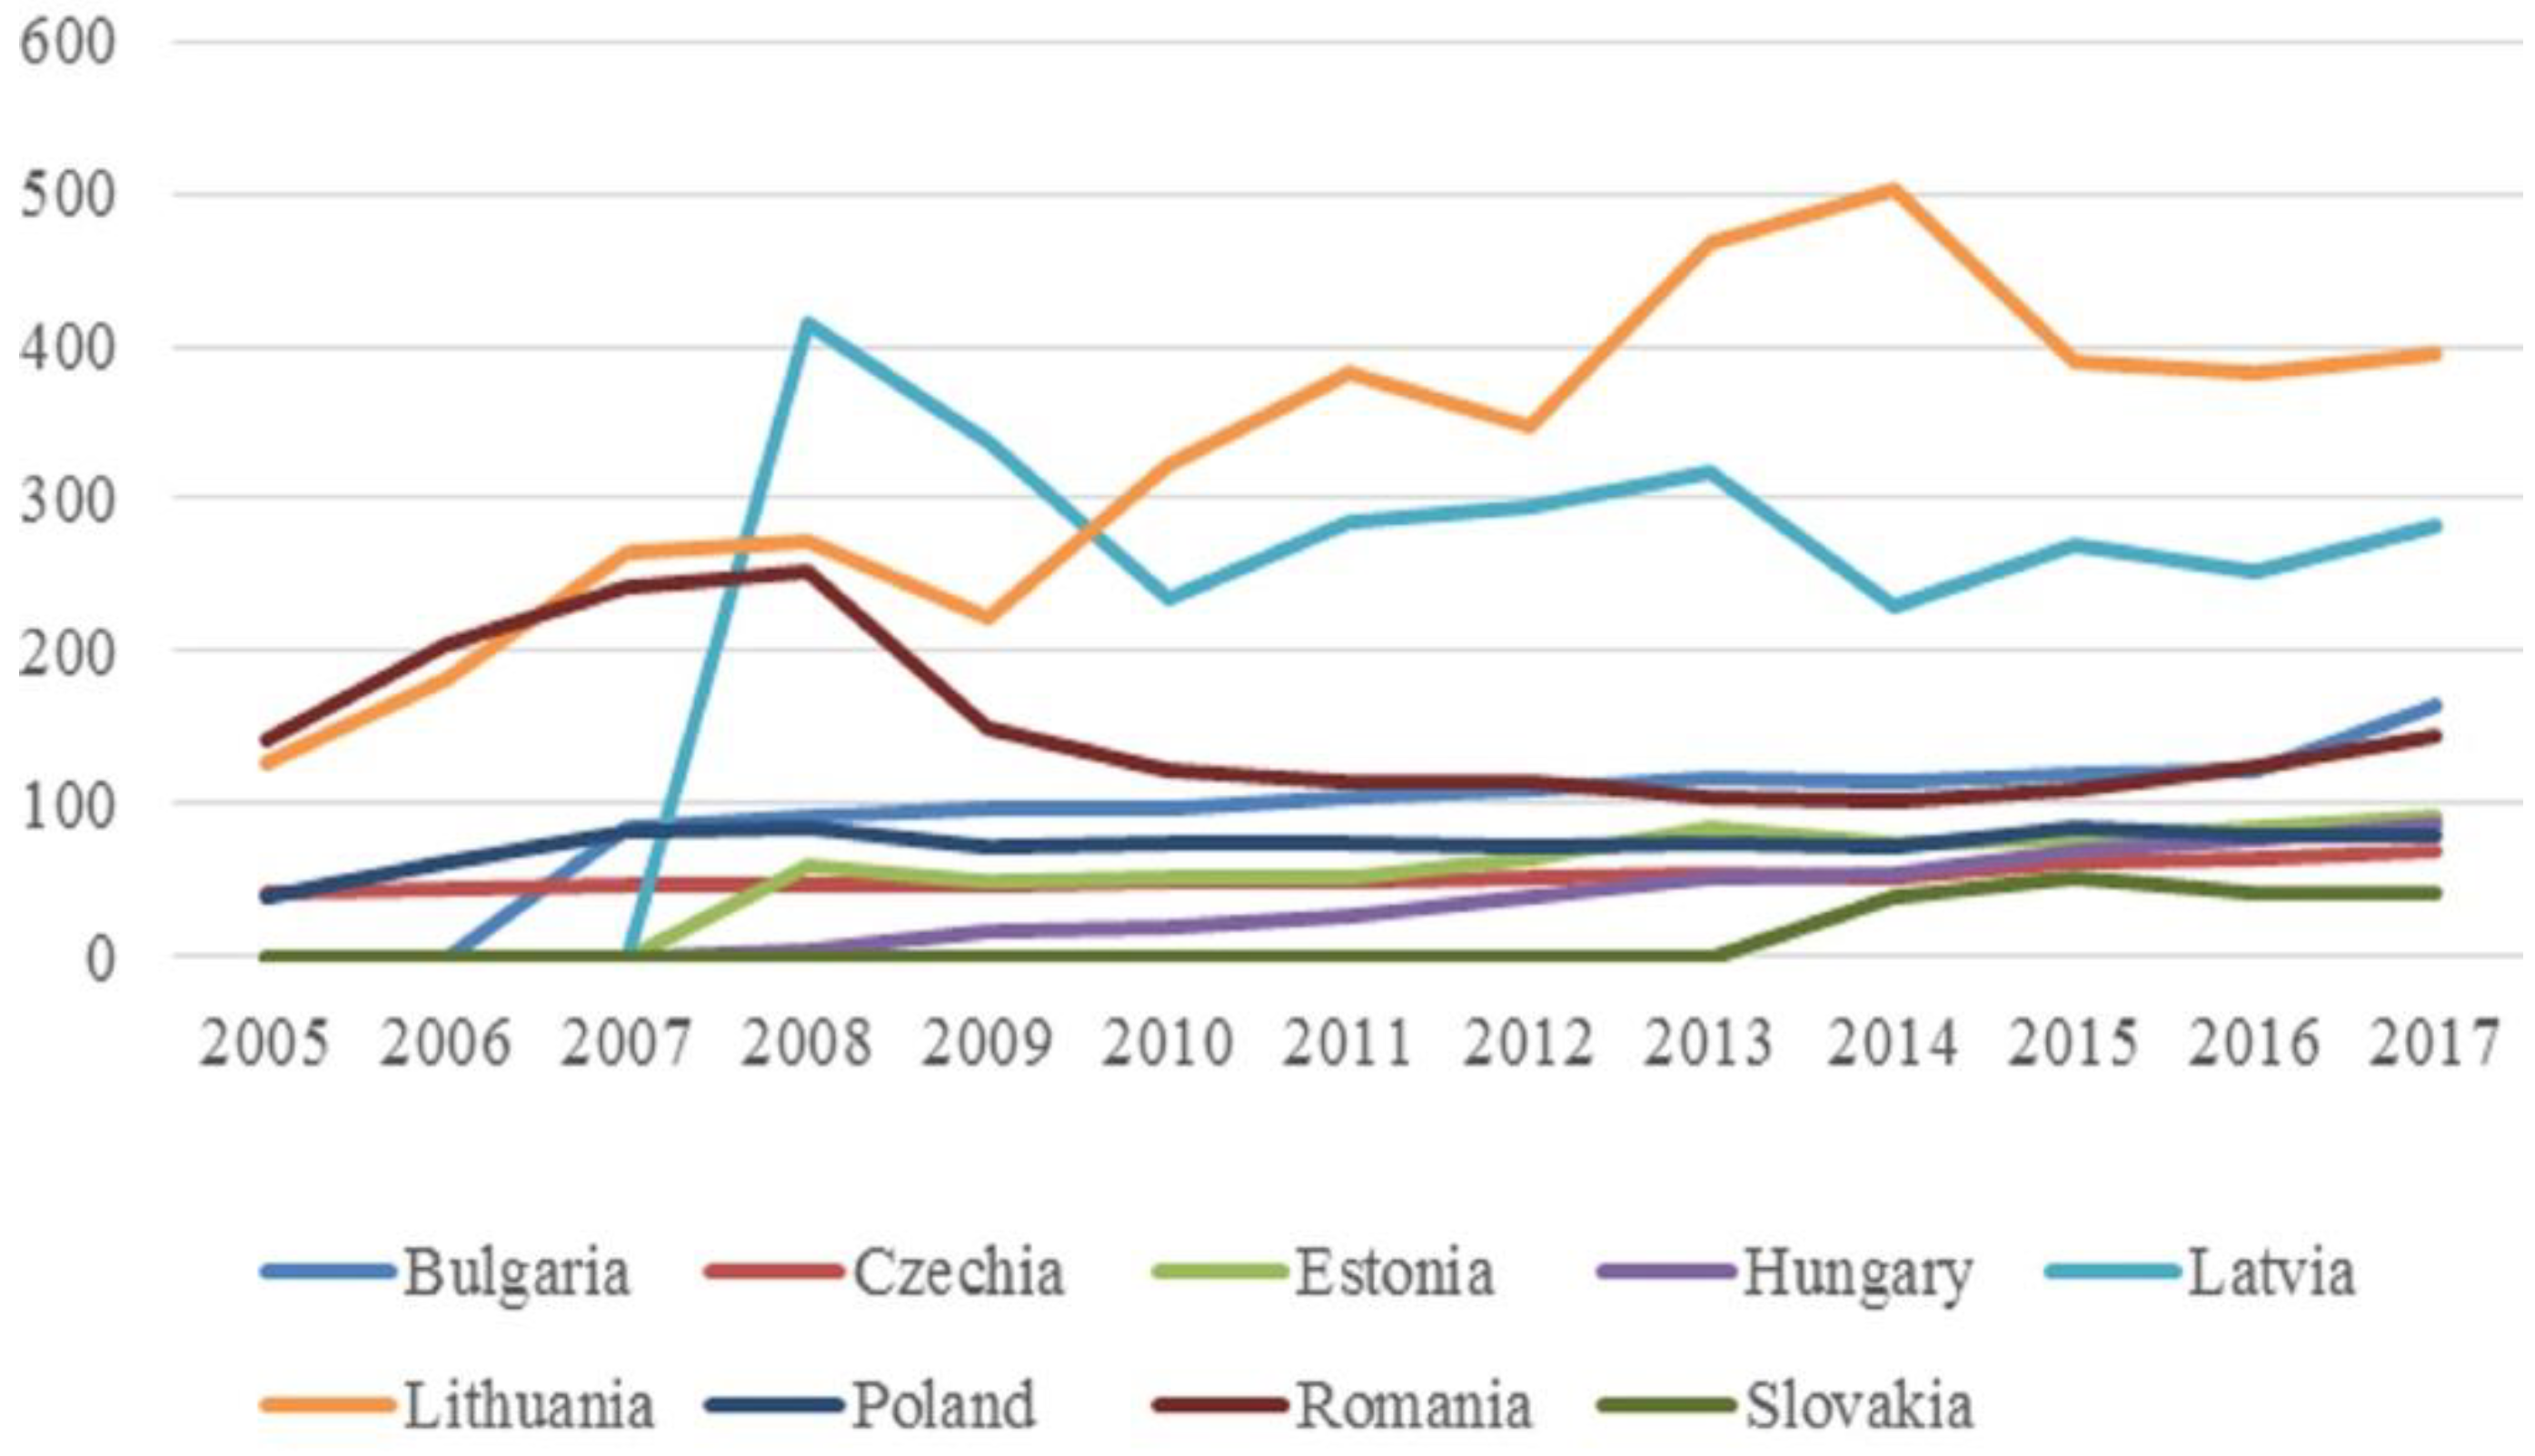
The values of remittances increased in 2017 compared to 2005 for all countries, however, the evolution in time of REMW showed that they had a sinuous variation with increases and decreases (
Table 1 and
Figure 1). It is noticed that with the global crisis, the level of remittances has been affected (for instance, in Romania or Latvia, the values of remittances have dropped dramatically).
Values in
Table 1 were computed by dividing annual global remittances by the corresponding population volume, data taken from Eurostat [
5].
At the same time, RPT showed, after a significant decline in 2009 due to the global economic crisis, a steady growth trend (
Table 2 and
Figure 2).
The extent to which the value of REMW influenced RPT can be quantified by their ratio (share of global remittances in risk of poverty threshold). From
Table 3 and
Figure 3, it is noted that S_REMW_RPT has seen quite significant positive or negative variations in each country. The impact of REMW on RPT is quite insignificant for 5 of the subjects, amounting under 4%. The share has values between 5–15% for Bulgaria, Latvia, Lithuania, and Romania. The highest value is recorded for Romania, almost 25% in 2007, but declining significantly after 2009 to below 10%.
In
Table 4 there are presented some statistics for the data of the EU emerging countries.
The statistical analysis shows that Lithuania has the largest average remittance value (EUR 327.8892), followed by Latvia (EUR 291.9309) followed by Romania and Bulgaria. The lowest average amount of remittances is in Slovakia (43.47839 euros). Concerning the average risk of poverty threshold, we note the highest value in Czechia followed by Slovakia.
Concerning RPT, none of the analyzed time series follow a normal distribution, except Hungary la RPT (2.98). The REMW variable presents a slight right asymmetry for Latvia, more pronounced for Bulgaria and Poland, the distribution being leptokurtic. For the other six countries, the distribution is platykurtic, with the most pronounced asymmetry for Estonia. The RPT variable has an almost normal, slightly right asymmetric distribution for Romania (leptokurtic distribution), and slightly left asymmetric for the others (platykurtic distribution).
The statistical analysis of the share (
Table 5) shows that the amount of remittances is significant in the risk of poverty threshold in Lithuania (12.8112) and Romania (11.64671), followed by Latvia with a significant value. Distribution is platykurtic, strongly left asymmetric for Czechia and Hungary, slightly asymmetric for Lithuania, Latvia and Slovakia, and it is platykurtic, slightly right asymmetric for other countries.
4.2. Estimation of Regression Parameters in Models 1, 2 and 3
The results of the estimation using the three models above are given in
Table 6,
Table 7 and
Table 8, where there are also indicated the estimated shape and the empirical turning points.
4.3. Results and Economic Significance
The REMW evolution for the emerging EU countries showed that the value of remittances had a sinuous trend with increases and decreases, and along with the global crisis, the remittances level had been also strongly affected. Hungary presents a particular case, the value of remittances rising year after year during the analyzed period, reaching 2021.96% in 2017 compared to 2005. For the other countries, (with the exception of Latvia), there was a slight upward trend in recent years, thus exceeding the value in 2005. As far as the RPT is concerned, all countries have had an upward trend over the whole period (the lowest rate growth is registered by Hungary, 26.77%), which means that the level of economic resources needed to ensure living conditions has increased, with an increase in the standard of living. S_REMW_RPT has had a steeply increasing trend in Hungary (1771% in 2017 as compared to 2005), and for other countries there was a sinuous trend of decreases and increases, noting that in 2017 the value of the weight was lower than in 2005 (except for Lithuania and Slovakia).
Regarding the analysis of the impact of remittances on the level of poverty, the conclusion is that, for emerging countries, it was more significant at times when S_REMW_RPT was higher, as due to remittances received in the countries of origin, household incomes were increasing, and poverty reduced. For four of countries of the group (Bulgaria, Latvia, Lithuania, and Romania), the mean value of the share lay between 5–15%, while it was below 4% for the other ones. The use of remittances for entrepreneurial activities, investment, health, education leads to the economic growth of the countries of origin, which also contributes to poverty reduction.
According to the linear model, we note that S_REMW_RPT was shrinking for six of the emerging EU countries (Bulgaria, Czechia, Latvia, Poland, Romania, Slovakia) and increased for three of them (Estonia, Lithuania and Hungary). The quadratic model estimated a decrease in S_REMW_RPT to the critical point followed by an increasing trend for Bulgaria, Czechia, Hungary and Romania, and a reverse situation for Estonia, Latvia, Lithuania, Poland and Slovakia.
The estimations of the linear model were strongly influenced by the variations caused by the economic crisis. Thus, the interpretations are not confirmed by the quadratic or cubic model.
The cubic model provided a better approximation of the evolution of S_REMW_RPT, the regression curve with an “inverted N” shape for seven countries (Bulgaria, Czechia, Estonia, Hungary, Latvia, Lithuania, Romania), showing a decrease to the first point turning, then increasing to the second turning point, followed by another decrease (Latvia has no turning points). For Poland and Slovakia the curve had the shape of “N”, having an increase up to the first turning point, then a decrease to the second turning point, followed by an increase.
Analyzing the quadratic and cubic model, which were more faithful in presenting the tendencies of S_REMW_RPT, we see that the value of the critical point in the quadratic model was very close to the value of the first return point in the cubic model for Bulgaria, Czechia, Romania and Slovakia (
Figure 4).
Latvia does not appear in the figure because it had no turning points in the cubic model. In the case of Hungary, Latvia and Poland, in the quadratic model, the critical point was located outside the analyzed period.
5. Discussion
The evolution of global remittances showed that the value of remittances had a sinuous trend with increases and decreases. With the global crisis, the remittances level was also strongly affected, so in 2009 compared to 2008 their value dropped by more than 40%. Compared to 2008, the value of remittances dropped drastically in Romania (42%) and Latvia (32%), and less in Poland (5.4%), while for the rest of the states it increased. The most significant increases were registered by Hungary with over 2000%.
Data analysis shows that the risk of poverty threshold experienced a positive growth rate until 2009, when the effects of the global crisis were felt, and so the risk of poverty threshold declined in all countries in 2010 (except for Bulgaria, where it decreased in 2011), after which the risk of poverty threshold experienced a steady growth, implying an improvement in the living standards of the population, both in the context of economic growth and due to remittances received from outside the country of residence.
The share of per capita remittances in risk of poverty threshold showed an evolution with variations of increases and decreases. Decreases were due to the effects of the global crisis on the amount of remittances sent to the countries of origin, in correlation with their economic growth during the period under review.
Taking into account the values of turning points, in the short term, the cubic model estimated an increasing tendency for Bulgaria, Czechia, Hungary, Lithuania, and Poland. According to the cubic model for Hungary and Lithuania, the upward trend was maintained in the short term (2020), followed a downward trend. For Poland, the linear model indicated a decreasing trend, while the cubic pattern indicated an upward trend after 2016. For Romania, the linear model indicated a decreasing trend, while the cubic pattern indicated a downward trend after 2018.
The results lead to the conclusion that, in the short term, the share of remittances in risk of poverty threshold was expected to maintain a growth trend for most of the analyzed countries (Bulgaria, Czechia, Hungary, Lithuania, Poland, Romania, and Slovakia), followed a downward tendency after 2018 for Bulgaria and Romania, and the same after 2020 for Hungary and Lithuania. For Latvia and Estonia, both quadratic and cubic models estimated a decreasing evolution.
The impact of remittances on poverty was more pronounced at the level of emerging countries in time periods when the share of remittances was higher in the risk of poverty threshold. Thus, for Bulgaria, Latvia, Lithuania, Romania (where the share was between 5–15%), the models show a short-term increase followed by a decrease, except for Latvia, where all three models indicated a decreasing tendency.
6. Conclusions
The risk of poverty threshold has increased in emerging countries, so that the level of economic resources for life insurance has increased. In this sense, it is very important that remittances are not used only for consumption, but also for investments, education, health, etc., which can lead to poverty reduction.
With globalization, the phenomenon of migration in Europe and the world is an important source of remittances for emerging countries, amplified by the possibility that EU citizens can move freely for labor. Remittance flows are a fundamental element for the well-being of citizens in emerging countries because they help millions of households to exceed their subsistence level and also contribute to improving health, education, living conditions, and even increasing entrepreneurship. Although remittances are mostly used for consumption, they can also contribute to the economic development of these countries if they are predominantly directed towards investment, saving or entrepreneurial activities. Actual flows of remittances are considered to be substantially higher than those from official data, as freedom of movement in the European Union allows migrants to return home frequently, bringing directly home their money earned abroad.
We can conclude that remittances are a vital source of financial support for emerging countries, as they directly increase the incomes of families whose members migrate to other countries to work, leading implicitly to poverty reduction and a rising risk of poverty threshold.
Following the trends in remittances, governments in these emerging countries need to develop appropriate policies in order to protect and to capitalize this massive flow of capital that can make an important contribution to tackling poverty and reducing the number of people suffering or at risk of suffering from the poverty, which is one of Europe 2020 priorities.
In this context, the results of this study may be the starting point for further studies involving the relationship between poverty, remittances, and other macroeconomic indicators. At the same time, through economic interpretations, they can provide support for designing appropriate governmental policies in emerging EU member states aiming to achieve sustainable economic growth.
As Europe’s developed countries will continue to be a significant source of remittances for the EU’s emerging countries, in subsequent studies we intend to analyze their contribution to the development of new businesses, and to growth of investment in healthcare or education, thus supporting the sustainable economic growth of these countries.


