Abstract
Decisions made in the early stages of construction projects significantly influence the costs incurred in subsequent stages. Therefore, such decisions must be based on the life-cycle cost (LCC), which includes the maintenance, repair, and replacement (MRR) costs in addition to construction costs. Furthermore, as uncertainty is inherent during the early stages, it must be considered in making predictions of the LCC more probabilistic. This study proposes a probabilistic LCC prediction model developed by applying the Monte Carlo simulation (MCS) to an LCC prediction model based on case-based reasoning (CBR) to support the decision-making process in the early stages of construction projects. The model was developed in two phases: first, two LCC prediction models were constructed using CBR and multiple-regression analysis. Through k-fold validation, one model with superior prediction performance was selected; second, a probabilistic LCC model was developed by applying the MCS to the selected model. The probabilistic LCC prediction model proposed in this study can generate probabilistic prediction results that consider the uncertainty of information available at the early stages of a project. Thus, it can enhance reliability in actual situations and be more useful for clients who support both construction and MRR costs, such as those in the public sector.
1. Introduction
Significant decisions on construction projects are generally made during the early stages, and such decisions have a great impact on the costs incurred in subsequent stages. Therefore, many studies have sought methods to predict construction costs based on decision making during the early stages. Most of them focused on predicting the construction cost and contributed to improving the prediction accuracy [1,2,3,4]. In addition, research has also been conducted on the overhead cost in the construction stage [5], and probability-based approaches have been made to predict construction costs [6]. However, given that maintenance, repair, and replacement (MRR) cost is two to three times more than the initial construction cost [7,8], all costs need to be considered to realize a decision-making process based on the life-cycle cost (LCC). The LCC of the building is affected by the final users since it is completed. Attitudes, habits, and perceptions of users influence the physical characteristics and LCC of the building [9,10]. Conversely, the building environment affects users’ productivity and psychological comfort [11]. Decision making in early stage also has a great impact on LCC [12]. It could be as large as the impact of the final user on the LCC. In particular, the need to consider the LCC at the early stages may be higher in construction projects such as those for public offices, in which both the construction and MRR, costs are borne by the same client.
Meanwhile, uncertainty is inevitable in long-term construction projects, and the information available in the early stages is subject to frequent change as the projects progress [13,14,15,16]. In addition, as the acquisition of complete and reliable information is generally not possible during the early stages of construction projects, predicting accurate costs in the initial stages is a very difficult task [17]. Therefore, it is necessary to make probabilistic predictions that consider the uncertainty of the information available during these early stages.
This study aimed to develop a probabilistic LCC prediction model to support the decision-making process during the early stages of construction projects. The model was constructed in two phases: first, two LCC prediction models were constructed using case-based reasoning (CBR) and multiple-regression analysis (MRA); second, a probabilistic LCC prediction model was developed by applying the Monte Carlo simulation (MCS) to a constructed model.
2. Literature Review
2.1. Cost Estimation in the Early Stage
Cost is an important factor that determines whether a project can be implemented. To predict the cost of a project, researchers have approached statistical analysis methodologies, such as regression analysis, or artificial intelligence methods, such as artificial neural networks (ANN) and expert systems [18,19,20]. Although such studies have contributed to cost prediction during the early stages, they have the following limitations: (1) difficulties in adhering to appropriate rules in non-experienced fields when using the rule-based reasoning of statistical analysis methodologies, and (2) the black-box type process of deriving the results in ANN [21]. Conversely, as CBR is a feasible methodology capable of making decisions or dealing with complicated problems with relatively little information [15,18], it has been widely implemented to predict costs during the early stages of construction projects [1,22,23,24,25,26]. Most of these studies, however, have focused on predicting construction costs; few studies have dealt with the prediction of LCCs at early stages.
2.2. Life-Cycle Cost
All structures have an initial investment phase that includes planning, design, and construction; an operation and maintenance (OM) phase after the construction; and a disposal phase after its lifetime. The total cost of a facility is the LCC, which includes planning costs, design costs, construction costs, operation and maintenance costs, and disposal costs.
Economic evaluations are conducted based on the LCC for efficient decision making regarding investments [27,28]. Until now, however, LCC analysis (LCCA) has been primarily performed during the design phase to compare the costs of several design alternatives to support the decision-making process [29]. However, as the decision-making process in the early stage (i.e., before the design phase) has the greatest influence on the LCC of a project, it is necessary to predict the LCC at the early stage to use it in the decision-making process.
2.3. Probabilistic Prediction
Uncertainty exists almost everywhere; therefore, a probabilistic approach can counter the risks inherent in management [30]. The probabilistic approach has been primarily applied in the field of construction management to analyze construction costs [31,32,33,34,35] and construction periods [36,37,38], while research has continued in many other fields [39,40].
Former studies on cost prediction during the early stage of construction projects have used definite information related to projects for predictions [1,24]. However, uncertainty is inherent during the early stages, and the information tends to change frequently with the progress of the project [14,15,16]. Therefore, a probabilistic approach is required to make decisions that consider the uncertainty of the factors influencing the changes/modifications of construction projects during the early stage.
3. Research Framework
A probabilistic model performs simulations to produce results; therefore, an algorithm or a base model is required [41]. In this study, two deterministic LCC prediction models were constructed using CBR, and a probabilistic model was proposed based on one of them (see Figure 1). Model I was developed to retrieve the construction and the MRR costs separately and to present the LCC as the sum of the results, while Model II was developed to directly retrieve the LCC. The two models were then compared to select the one with the superior prediction performance. Finally, a probabilistic LCC model was proposed by combining the selected model with MCS and was validated by executing four validation cases.
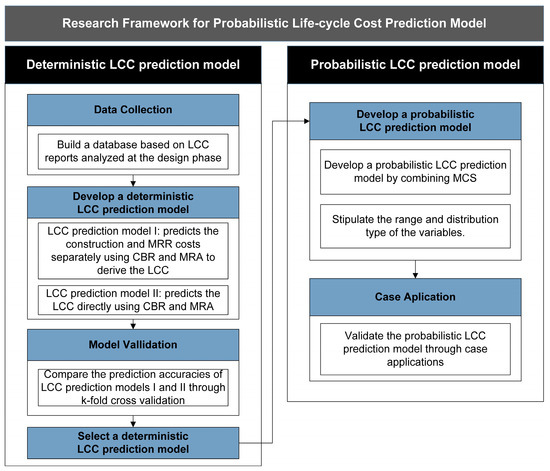
Figure 1.
Research framework.
4. Deterministic Model Development
4.1. Data Collection and Establishment of Database
To develop LCC prediction models, 74 LCCA reports that were submitted to the public clients in Korea together with the detailed design documents were used. The collected data included the construction costs (Y1), MRR costs (Y2), and LCC (Y3) obtained from results of the LCC analysis performed during the design phase of these buildings. The MRR cost included the repair and replacement costs and not the operating expenses for routine maintenance. In addition, information on 13 factors (e.g., total floor area, district and site area, etc.) available during the early stage was collected and used as independent variables (X1–X13) for the predictions; a summary is presented in Table 1. From the 74 cases, 70 randomly selected cases were extracted to construct a database; the remaining four cases were used to validate the models.

Table 1.
Description of variables.
Variables used in this study were classified into numerical and categorical types. While numerical variables take numerical values and represent some kind of measured values [42], categorical variables should be converted into dummy variables (0 or 1) in order to conduct regression analysis [1]. For example, a foundation type variable (X11) consisting of three categories (X11a mat, X11b pile, and X11c pile + mat) can be converted with two dummy variables. If a building has a mat type foundation, X11a, X11b, and X11c will be set as 1, 0, and 0, respectively.
4.2. LCC Prediction Models Using CBR
Using the CBR technique, two deterministic LCC prediction models were constructed to function as base models for developing a probabilistic LCC prediction model. CBR is a data-mining tool that remembers the solutions applied to previous problems with similar situations and uses the information and knowledge to solve a new problem [43]. In the early stages of construction projects, a lot of categorical and numerical information is available. Jin et al. [1] proposed a CBR model that considers numerical and categorical variables to predict project costs during the early stage of construction and improves the degree of accuracy by revising extracted cases. In their model, the standardized coefficients derived from MRA were used as the attribute weights for the retrieval phase of CBR, and the retrieved values were revised using the non-standardized coefficients in the revision phase. The deterministic LCC prediction models of the current study were constructed by referring to the algorithm of Jin et al.’s model.
4.2.1. LCC Prediction Model I
Model I was programmed to retrieve the construction and MRR costs separately and to calculate the LCC as the sum of the results. Therefore, the variables for predicting the construction and MRR costs were selected, and their weights were estimated to develop the model (see Figure 2).
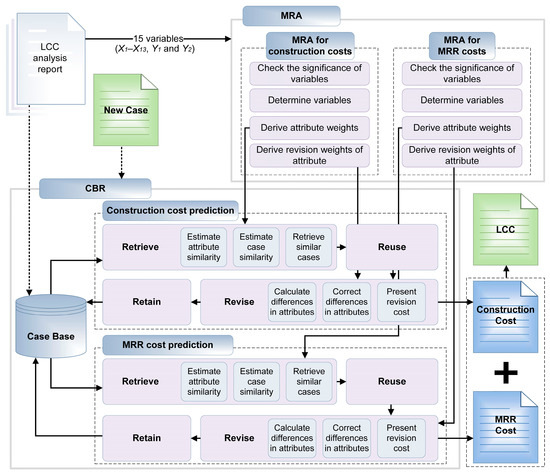
Figure 2.
Process of LCC prediction Model I.
To select the independent variables for Model I, a significance test based on p-value was performed with 15 variables (X1–X13, Y1, and Y2) using MRA. The p-value represents a significant probability of the independent variables, and the significance level of 0.05 is generally considered to have statistical significance [23,44]. In this study, thus, variables having p-value above 0.05 were excluded.
During the significance test, if the significance of a variable was higher than 0.05, the variable was excluded from the analysis because it was judged to be insignificant in predicting the dependent variable, and the MRA was performed again. In this manner, the MRA was repeatedly performed until the variables were finalized, i.e., until the significance of all the remaining variables was less than 0.05. The selected variables were used as attributes for the CBR.
From the MRA of the construction cost, the coefficient of determination (R2) was found to be 0.963, and the selected variables are summarized in Table 2. In the same way, the coefficient of determination (R2) was found to be 0.967 from the MRA of the MRR cost. The selected variables are summarized in Table 3.

Table 2.
Results of construction cost regression analysis.

Table 3.
Results of MRR cost regression analysis.
The absolute values of the standardized coefficients (β) and unstandardized coefficients (B) obtained from the MRA results, respectively, were used as the attribute weights for estimating the attribute and as the revision weights to improve the accuracy of the extracted cases [1].
The attributes, attribute weights, and revision weights were then input to the CBR model to predict the LCC. To retrieve similar cases, the attribute similarity (AS) was first estimated using Equation (1) for categorical variables and Equation (2) for numerical variables [1,19,45]. Further, the case similarity (CS) was calculated for each case using Equation (3), and the case with the highest degree of similarity (HCS) to the new case was derived using Equation (4) [24,45].
where AVNi = value of attribute i in the new case; and AVRi = value of attribute i in the retrieved case.
where AWi = weight of attribute i.
where m = the number of cases in the case base. If the value of similarity of the retrieved case was not 100, the attribute difference (AD) was carried out on the basis of the difference between AVNi and AVRi (Equation (5)), and the total revision value (TRV) was calculated using Equation (6) [1].
where AVNi = value of attribute i in the new case; and AVRi = value of attribute i in the retrieved case.
where = total revision value of the attribute i; and ADi = difference between the value of attribute i in the new case and in the retrieved case; and PEi = revision weight of attribute i. The categorical variable was input as a dummy variable in the MRA. Therefore, the calculation result of ADi was either 0 or 1, and the revision weight was applied when the result was 1. The cost of the retrieved case was added to the obtained TRV to calculate the revised cost (RC) using Equation (7).
where Cretrieved = the costs of the retrieved case. Finally, the sum of the construction cost and MRR cost obtained from the CBR model was presented as the LCC prediction result of Model I.
4.2.2. LCC Prediction Model II
Similar to Model I, Model II, which directly retrieves the LCC, was developed, as shown in Figure 3.
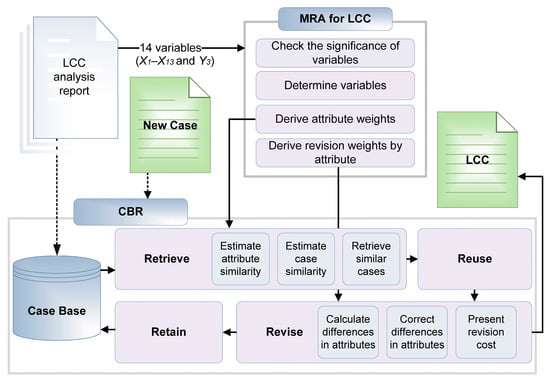
Figure 3.
Process of LCC prediction Model II.
In the same way with development of Model I, a significance test was performed with 14 variables (X1–X13, and Y3) for Model II. From the MRA of Model II, the coefficient of determination (R2) was obtained as 0.968; the selected variables are summarized in Table 4. The absolute values of the standardized coefficients (β) and unstandardized coefficients (B) were used as the attribute weights and revision weights, respectively.

Table 4.
Results of life-cycle cost regression analysis.
Case retrieval and revision were performed by applying Equations (1) to (7), similar to the process of Model I. The LCC value calculated in the final revision was specified as the predicted value.
4.2.3. Validation
To validate Model I and II, k-fold cross-validation was conducted, which is a popular procedure for estimating the performance of a classification algorithm on a data set [46,47]. In this study, k was set up as ten; thus, the validation was tenfold. For each fold, four of the 74 cases collected were randomly excluded; 70 cases were used to construct the model and the four remaining cases were individually input to the model to predict the LCC. The error rates for the comparison of prediction performance of the models were calculated using Equation (8). The average error rate in the four cases was used to analyze the accuracy of each fold; then, the total average [47] and the standard deviation of the ten folds were used as model-validation criteria.
where ERn = error rate of case n; LCCn = LCC of case n; and LCCn_prediction = LCC prediction value of case n.
Furthermore, MRA was used to compare the developed models to the models based on the conventional method, because it is one of the most widely used methods in statistics [19,24,48]. In this study, two MRA models (Model III and Model IV) were constructed. Model III predicted the construction and MRR costs separately and presented the LCC as the sum of the results, while Model IV directly predicted the LCC. The validation results of the LCC prediction Model I and II (CBR model) and Model III and IV (MRA model) were summarized in Table 5.

Table 5.
K-fold cross-validation results.
The total average error rate in the entire validation was 9.54% for Model I and 16.18% for Model II, which showed a 6.64% difference in the average error rate between the models. In addition, the total error averages of Model III and Model IV were calculated as 13.2% and 14.7%, respectively, which was larger than Model I. The difference between the minimum and maximum values of the total average error rate for each model was 9.07%, 17.4%, 26.86%, and 12.88%, respectively. The standard deviation of each model was 2.76%, 5.27%, 8.42%, and 4.44%, respectively; the standard deviation of Model I was the smallest.
This confirmed that the error rate of Model I was relatively low, which proved that the prediction performance of Model I was superior. Additionally, the 1st fold case of Model I was the lowest among the folds of models. Accordingly, in this study, the 1st fold of Model I was used as the base model to construct the probabilistic LCC prediction model.
5. Probabilistic Model Development
5.1. Probabilistic LCC Prediction
The probabilistic LCC prediction model was constructed by combining the MCS with our LCC prediction Model I (see Figure 4). The MCS is a technique that outputs a probabilistic result by arbitrarily selecting a value to be used in a simulation from a probability distribution. It offers many advantages, such as supporting the decision-making process by generating arbitrary random numbers as input variables, evaluating a large number of cases, and generating the distribution and statistics of results [17].
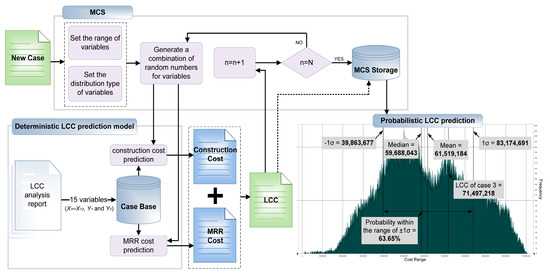
Figure 4.
Process of probabilistic LCC prediction model.
The distribution type of each input variable needs to be defined to apply MCS. This study assumed the range and distribution type of variables selected for the deterministic LCC prediction model to consider uncertainty in the early stages of construction projects. The variables can be classified as numerical and categorical, as shown in Table 6.

Table 6.
Classification of variables.
The range and distribution type of the variables can vary depending on the project, and these may be specified by the user. In this study, the distribution type and range were stipulated as shown in Table 7 and designed to change according to users’ input, under the assumption that all the variables presented for the model verification were prone to uncertainty.

Table 7.
Distribution type and range of variables.
Whereas the input distribution of variables should be defined through each estimation, it was difficult to obtain an amount of data. Assumptions of triangular distribution, which are commonly adopted in Monte Carlo simulations of construction costs, offer a more appropriate method of eliciting experience from construction personnel than other distribution methods [32,49]. In this study, the distribution type of the numerical variables (i.e., total floor area, maximum height, number of floors above the ground, number of floors below ground, number of parking spaces, and construction type) were assumed as having a triangular distribution. However, because the number of floors above ground, number of floors below ground, and number of parking spaces were all whole numbers, the digits after the decimal point were omitted before applying the model.
The range of variables in the early stage was set according to the decision of the client, but in the validation, this study assumed the range of 5%, which is most frequently suggested as the adjustable range for architectural competition in South Korea.
On the other hand, the values of the three categorical variables (structural type, city size, and foundation type) were represented by dummy variables (refer to Table 1). In this study, it was assumed that the possibilities of categorical variables were the same in consideration of the uncertainty of the early stage of the project. Therefore, a discrete uniform distribution was used to express the probability of occurrence of dummy variables 0 and 1 equally. However, if one dummy variable had a value of 1, the remaining dummy variable was set to not be 1 (e.g., if X8a was 1, X8b, X8c, and X8d were 0). Distribution types and range of variables were set as shown in Table 7.
To perform the MCS, a combination of random numbers was generated by creating variables within the stipulated distribution type and range. The combination of random numbers was then input to Model I for deriving the LCC, and the probabilistic LCC prediction result was generated after performing a specified number of iterations.
This study assumed that if the number of cases in the database sufficiently accumulated in the future, the results of the probabilistic LCC prediction model would follow the normal distribution according to the central limit theorem. Hence, based on the three-sigma rule of statistics, in normal distribution, approximately 68%, 95%, and 99.7% of values would be within the range of ±1σ (standard deviation), ± 2σ, and ± 3σ, respectively [50]. This implies that when the LCC was predicted by referring to the values within each range, the probability that the result would have a value outside that range (i.e., the risk) was approximately 32%, 5%, and 0.3%, respectively. Therefore, the user must determine the risk tolerance and specify the appropriate range.
5.2. Verification
Four cases that were excluded from the database used for the model construction of 1st fold of Model I were applied to the probabilistic LCC prediction model, and 100,000 simulations were performed for the validation. Table 8 summarizes the basic information on the validation cases.

Table 8.
Overview of verification cases.
The mean, median, and ± 1σ range of the predicted results were used to illustrate the results of the verification. The probabilistic LCC prediction results of Cases 1–4 are shown in Figure 5.
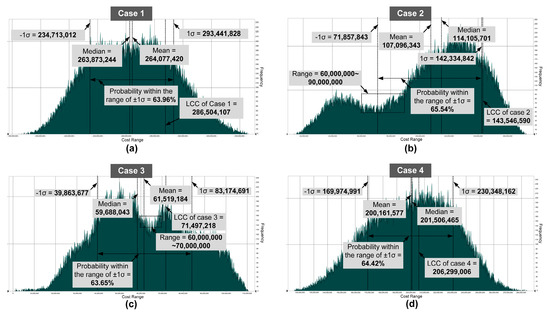
Figure 5.
Probabilistic LCC for the validation cases (a, b, c, d: results of Case 1, 2, 3, 4).
The probabilistic LCC prediction results of Case 1 were as follows: the mean was USD 264,077,420; the median was USD 263,873,244; and the 1σ range was USD 234,713,012–293,441,828. The probability within the range of ± 1σ was 63.96%, which was interpreted as the occurrence probability of LCC within that range (see Figure 5a). The difference between the minimum and maximum values in the range of ± 1σ was approximately USD 58,728,816. The LCC of Case 1 was USD 286,504,107, which was within the probabilistic prediction range. The difference between the LCC and the minimum and maximum values within the range was 18% and 2.4%, respectively.
The probabilistic LCC prediction results of Case 2 were as follows: the mean was USD 107,096,343; the median was USD 114,105,701; and the ± 1σ range was USD 71,857,843–142,334,842. The probability within the range of ± 1σ was 65.54% (see Figure 5b). The difference between the minimum and maximum values in the range of ±1σ was approximately USD 70,476,999. The LCC of Case 2 was USD 143,546,590, which was approximately 0.9% outside the maximum value of the probabilistic prediction range. The difference between the LCC and the minimum and maximum values within the range was 50% and 0.84%, respectively. As shown in Figure 5b, the result of Case 2 converged to a triangular distribution. However, the frequency was low due to the lack of cases in the database that could derive the prediction results within the range of USD 60,000,000–90,000,000. As the frequency of the case was low, the range of ±1σ shifted to the right because the average value moved to the right.
The probabilistic LCC prediction results of Case 3 were as follows: the mean was USD 61,519,184; the median was USD 59,688,043; and the ±1σ range was USD 39,863,677–83,174,691. The probability within the range of ± 1σ was 63.65% (see Figure 5c). The difference between the minimum and maximum values in the range of ± 1σ was approximately USD 43,311,014. The LCC of Case 3 was USD 71,497,218, which was within the probabilistic prediction range. The difference between the LCC and the minimum and maximum values within the range was 7.9% and 16.3%, respectively. Similar to Case 2, the frequency of cases in the range of USD 60,000,000–70,000,000 was low; however, this did not affect the range of ±1σ because the difference between the frequencies of the cases was not large.
The probabilistic LCC prediction results of Case 4 were as follows: the mean was USD 200,161,577; the median was USD 201,506,465; the ± 1σ range was USD 169,974,991–230,348,162; and the probability within the range of ± 1σ was 64.42% (see Figure 5d). The difference between the minimum and maximum values in the range of ± 1σ was approximately USD 60,373,171. The LCC of Case 4 was USD 206,299,006, which was within the probabilistic prediction range. The difference between the LCC and the minimum and maximum values within the range was 17.6% and 11.6%, respectively.
The proposed model can be validated by examining the execution results of the four cases, and the range of the LCC can be presented by considering the uncertainty in the early stage of the construction project.
As shown in Table 9, the probabilistic range of Cases 1–4 included the respective deterministic results derived during the verification of the deterministic LCC prediction model.

Table 9.
Summary of verification results.
5.3. Discussion
Users can apply the proposed model for two purposes. One, they can use it to predict the occurrence probability of a specific LCC value. For example, in Case 1 (see Figure 6), the probability that the LCC was within USD 289,104,243, which was the deterministic LCC prediction value, was 78.2%; therefore, it can be interpreted that the probability that the LCC of Case 1 was within the predicted value was 78.2%, and the risk was 21.8%. Two, they can use it to derive the range of the LCC based on their risk tolerance. For example, if the user intends to predict the LCC with a risk of 30%, the LCC could be within USD 179,797,962–281,373,000, which was the LCC occurrence range with 70% probability.
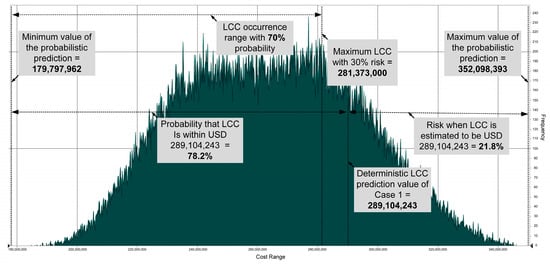
Figure 6.
Interpretation of probabilistic prediction result (Case 1).
In addition, the consideration of the prediction results of both the probabilistic and deterministic LCCs might increase the efficiency of decision making. For example, an analysis of the results of both deterministic and probabilistic predictions for Case 1 can be interpreted as follows. The deterministic LCC prediction value of Case 1 was USD 289,104,243; however, this value can be estimated as USD 234,713,012–293,441,828 when the uncertainty of the variables was reflected based on the ±1σ range. It was predicted that the value would decrease by USD 54,391,231 or increase by USD 4,337,585 (see Figure 7). The possibility that the value would decrease by USD 54,391,231 was 59.8%, while the possibility that the value would increase by USD 4,337,585 was 4.13%. Therefore, the user can decide on the implementation of a project by referring to the fluctuation and probability of variation in the LCC.
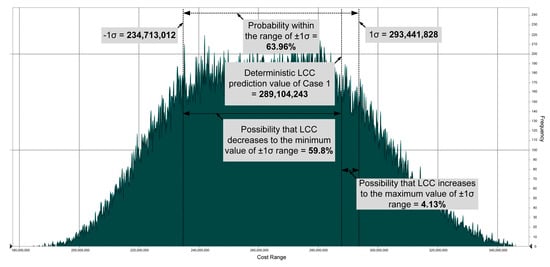
Figure 7.
Comprehensive analysis of probabilistic and deterministic results (Case 1).
In this study, the model was constructed under the assumption that uncertainty exists in all the variables considered. However, the range and distribution type of the variables can vary depending on the project, and few definite variables may be present. In such a case, the range and distribution type can be modified to derive probabilistic results. Therefore, further research is required on the distribution type and range for each variable to support the users.
Meanwhile, the prediction range of the probabilistic LCC was considerably wider in Cases 2 and 3 because there were few similar cases in the database. Therefore, if the database is sufficiently replete, the LCC prediction range should be narrowed further.
6. Conclusions
The decision-making process during the early stage of construction projects must consider the MRR cost along with the construction cost. In addition, it is necessary to probabilistically predict the LCC and reflect it in the decision-making process, given the uncertainty of available information in the early stages of construction projects. This study proposed a probabilistic LCC prediction model by applying the Monte Carlo simulation to a case-based reasoning LCC prediction model to support the decision-making process in the early stages of construction. Two types of deterministic LCC prediction models were constructed, then Model I was selected for its relatively lower error rate after verifying the prediction accuracy through k-fold cross-validation. Assuming the distribution type and range for each variable of Model I, the probabilistic LCC prediction model was developed to perform the MCS. Four cases were applied to the proposed probabilistic model for validation; the results proved that the model was valid because the actual LCCs of Cases 1, 3, and 4 were within the respective prediction results of the probabilistic LCC. The LCC of Case 2 was out of the suggested range by 0.9%. This might be attributed to an inadequate number of cases in the database used for the model construction.
Unlike previous studies on deterministic prediction models, this study sought to ensure reliability in actual situations by generating probabilistic prediction results that considered the uncertainty of information available during the early stages of construction projects. The prediction performance of this model is expected to improve with an increase in the number and variety of cases in the database. Thus far, the proposed probabilistic LCC prediction model can generate prediction results according to the degree of risk tolerance of the user and can support the decision-making process by reflecting the uncertainty in the early stage of construction projects. The proposed model should be especially useful in cases in the public sector that have limited budgets at the beginning of projects and bear both construction costs and MRR costs.
In this study, the range of occurrence was arbitrarily specified under the assumption that uncertainty exists in all the variables presented in this study; the probability distribution of the variables was assumed to be a discrete uniform distribution or a triangular distribution. Therefore, to obtain a more accurate probabilistic result, further research is required on the range and distribution type of each variable. The proposed model in this study did not deal with qualitative variables such as design quality, hence there is a need for future research to address the qualitative variables. To this end, the authors are carrying out follow-up research to stipulate the range and distribution of each variable, and to handle qualitative variables such as design quality or energy efficiency rating.
Author Contributions
Conceptualization, Z.J. and C.-t.H.; Methodology, Z.J. and J.K.; Validation, Z.J. and J.K.; Formal Analysis, C.-t.H.; Investigation, S.H.; Data Curation, Z.J. and J.K.; Writing—Original Draft Preparation, Z.J.; Writing—Review and Editing, C.-t.H. and S.H.; Visualization, Z.J. and J.K.; Supervision, C.-t.H. and S.H.
Funding
This work was supported by the 2018 Research Fund of the University of Seoul.
Conflicts of Interest
The authors declare no conflict of interest.
Abbreviations
| ADi | difference between the value of attribute i in the new case and in the retrieved case |
| ANN | artificial neural networks |
| AS | attribute similarity |
| AVNi | value of attribute i in the new case |
| AVRi | value of attribute i in the retrieved case |
| AWi | weight of attribute i |
| CBR | case-based reasoning |
| Cretrieved | the costs of the retrieved case |
| CS | case similarity |
| ERn | error rate of case n |
| HCS | highest degree of similarity to the new case |
| LCC | life-cycle cost |
| LCCA | life-cycle cost analysis |
| LCCn | LCC of case n |
| LCCn_prediction | LCC prediction value of case n |
| MCS | Monte Carlo simulation |
| MRR | maintenance, repair, and replacement |
| MRA | multiple-regression analysis |
| OM | operation and maintenance |
| PEi | revision weight of attribute i |
| RC | revised cost |
| RCs | reinforced concrete structure |
| RVi | revision value of the attribute i |
| SRCs | steel framed reinforced concrete structure |
| Ss | steel frame structure |
| TRV | total revision value |
References
- Jin, R.; Han, S.; Hyun, C.; Kim, J. Improving Accuracy of Early Stage Cost Estimation by Revising Categorical Variables in a Case-Based Reasoning Model. J. Constr. Eng. Manag. 2014, 140, 04014025. [Google Scholar] [CrossRef]
- Dursun, O.; Stoy, C. Conceptual Estimation of Construction Costs Using the Multistep Ahead Approach. J. Constr. Eng. Manag. 2016, 142, 04016038. [Google Scholar] [CrossRef]
- Koo, C.; Hong, T.; Hyun, C. The development of a construction cost prediction model with improved prediction capacity using the advanced CBR approach. Expert Syst. Appl. 2011, 38, 8597–8606. [Google Scholar] [CrossRef]
- Kim, S.; Shim, J.H. Combining case-based reasoning with genetic algorithm optimization for preliminary cost estimation in construction industry. Can. J. Civ. Eng. 2014, 41, 65–73. [Google Scholar] [CrossRef]
- Juszczyk, M.; Leśniak, A. Modelling Construction Site Cost Index Based on Neural Network Ensembles. Symmetry 2019, 11, 411. [Google Scholar] [CrossRef]
- Sonmez, R. Range estimation of construction costs using neural networks with bootstrap prediction intervals. Expert Syst. Appl. 2011, 38, 9913–9917. [Google Scholar] [CrossRef]
- El-Haram, M.A.; Horner, R.M.W. Application of the principles of ILS to the development of cost effective maintenance strategies for existing building stock. Constr. Manag. Econ. 2003, 21, 283–296. [Google Scholar] [CrossRef]
- Kim, J.; Han, S.; Hyun, C. Identification and Reduction of Synchronous Replacements in Life-Cycle Cost Analysis of Equipment. J. Manag. Eng. 2019, 35, 04018058. [Google Scholar] [CrossRef]
- Caniato, M.; Andrea, G. Discriminating People’s Attitude towards Building Physical Features in Sustainable and Conventional Buildings. Energies 2019, 12, 1429. [Google Scholar] [CrossRef]
- Sant’Anna, D.O.; Dos Santos, P.H.; Vianna, N.S.; Romero, M.A. Indoor environmental quality perception and users’ satisfaction of conventional and green buildings in Brazil. Sustain. Cities Soc. 2018, 43, 95–110. [Google Scholar] [CrossRef]
- Castaldo, V.L.; Pigliautile, I.; Rosso, F.; Cotana, F.; De Giorgio, F.; Pisello, A.L. How subjective and non-physical parameters affect occupants’ environmental comfort perception. Energy Build. 2018, 178, 107–129. [Google Scholar] [CrossRef]
- Dell’Isola, A. Value Engineering: Practical Applications... for Design, Construction, Maintenance & Operations; Greene, M., MacFarlane, R., Morris, S., Eds.; RS Means Company: Kingston, MA, USA, 1997. [Google Scholar]
- De Meyer, A.; Loch, C.H.; Pich, M.T. Managing project uncertainty: From Variation to Chaos. MIT Sloan Manag. Rev. 2002, 43, 60–67. [Google Scholar] [CrossRef]
- Martens, A.; Vanhoucke, M. The impact of applying effort to reduce activity variability on the project time and cost performance. Eur. J. Oper. Res. 2019, 277, 442–453. [Google Scholar] [CrossRef]
- Leśniak, A.; Zima, K. Cost Calculation of Construction Projects Including Sustainability Factors Using the Case Based Reasoning (CRB) Method. Sustainability 2018, 10, 1608. [Google Scholar] [CrossRef]
- Chatterjee, K.; Zavadskas, E.; Tamošaitienė, J.; Adhikary, K.; Kar, S. A Hybrid MCDM Technique for Risk Management in Construction Projects. Symmetry 2018, 10, 46. [Google Scholar] [CrossRef]
- Chou, J.-S.; Yang, I.-T.; Chong, W.K. Probabilistic simulation for developing likelihood distribution of engineering project cost. Autom. Constr. 2009, 18, 570–577. [Google Scholar] [CrossRef]
- An, S.-H.; Kim, G.-H.; Kang, K.-I. A case-based reasoning cost estimating model using experience by analytic hierarchy process. Build. Environ. 2007, 42, 2573–2579. [Google Scholar] [CrossRef]
- Kim, G.-H.; An, S.-H.; Kang, K.-I. Comparison of construction cost estimating models based on regression analysis, neural networks, and case-based reasoning. Build. Environ. 2004, 39, 1235–1242. [Google Scholar] [CrossRef]
- Juszczyk, M.; Leśniak, A.; Zima, K. ANN Based Approach for Estimation of Construction Costs of Sports Fields. Complexity 2018, 2018, 1–11. [Google Scholar] [CrossRef]
- Cheng, M.-Y.; Tsai, H.-C.; Hsieh, W.-S. Web-based conceptual cost estimates for construction projects using Evolutionary Fuzzy Neural Inference Model. Autom. Constr. 2009, 18, 164–172. [Google Scholar] [CrossRef]
- Doğan, S.Z.; Arditi, D.; Murat Günaydin, H. Using Decision Trees for Determining Attribute Weights in a Case-Based Model of Early Cost Prediction. J. Constr. Eng. Manag. 2008, 134, 146–152. [Google Scholar] [CrossRef]
- Koo, C.; Hong, T.; Hyun, C.; Koo, K. A CBR-based hybrid model for predicting a construction duration and cost based on project characteristics in multi-family housing projects. Can. J. Civ. Eng. 2010, 37, 739–752. [Google Scholar] [CrossRef]
- Ji, C.; Hong, T.; Hyun, C. CBR Revision Model for Improving Cost Prediction Accuracy in Multifamily Housing Projects. J. Manag. Eng. 2010, 26, 229–236. [Google Scholar] [CrossRef]
- Ji, S.-H.; Park, M.; Lee, H.-S. Cost estimation model for building projects using case-based reasoning. Can. J. Civ. Eng. 2011, 38, 570–581. [Google Scholar] [CrossRef]
- Chou, J.-S. Web-based CBR system applied to early cost budgeting for pavement maintenance project. Expert Syst. Appl. 2009, 36, 2947–2960. [Google Scholar] [CrossRef]
- Dell’Isola, A.; Kirk, S.J. Life Cycle Costing for Facilities; RS Means: Kingston, MA, USA, 2003. [Google Scholar]
- Chanter, B.; Swallow, P. Building Maintenance Management; Blackwell Publishing: Oxford, UK, 2007. [Google Scholar]
- Kim, J.; Lee, H.W.; Bender, W.; Hyun, C.-T. Model for Collecting Replacement Cycles of Building Components: Hybrid Approach of Indirect and Direct Estimations. J. Comput. Civ. Eng. 2018, 32, 04018051. [Google Scholar] [CrossRef]
- Saibi, M. A Probabilistic Approach for Drilling Cost Engineering and Management. In Proceedings of the SPE/IADC Middle East Drilling and Technology Conference, Cairo, Egypt, 22–24 October 2007; Society of Petroleum Engineers: Richardson, TX, USA, 2007. [Google Scholar]
- Yang, I.-T. Simulation-based estimation for correlated cost elements. Int. J. Proj. Manag. 2005, 23, 275–282. [Google Scholar] [CrossRef]
- Wing Chau, K. The validity of the triangular distribution assumption in Monte Carlo simulation of construction costs: Empirical evidence from Hong Kong. Constr. Manag. Econ. 1995, 13, 15–21. [Google Scholar] [CrossRef]
- Kim, Y.-S.; Kang, H.-W. Development of a model for risk and cost analysis in overseas plant construction projects focusing on petrochemical plant construction projects. KSCE J. Civ. Eng. 2017, 21, 1549–1562. [Google Scholar] [CrossRef]
- Zhu, B.; Yu, L.-A.; Geng, Z.-Q. Cost estimation method based on parallel Monte Carlo simulation and market investigation for engineering construction project. Cluster Comput. 2016, 19, 1293–1308. [Google Scholar] [CrossRef]
- Chang, C.-Y.; Ko, J.-W. New Approach to Estimating the Standard Deviations of Lognormal Cost Variables in the Monte Carlo Analysis of Construction Risks. J. Constr. Eng. Manag. 2017, 143, 06016006. [Google Scholar] [CrossRef]
- Kim, B.-C.; Reinschmidt, K.F. Probabilistic Forecasting of Project Duration Using Kalman Filter and the Earned Value Method. J. Constr. Eng. Manag. 2010, 136, 834–843. [Google Scholar] [CrossRef]
- Kim, B.; Reinschmidt, K.F. Probabilistic Forecasting of Project Duration Using Bayesian Inference and the Beta Distribution. J. Constr. Eng. Manag. 2009, 135, 178–186. [Google Scholar] [CrossRef]
- Moret, Y.; Einstein, H.H. Construction Cost and Duration Uncertainty Model: Application to High-Speed Rail Line Project. J. Constr. Eng. Manag. 2016, 142, 05016010. [Google Scholar] [CrossRef]
- Nakamura, T.; Fujii, K. Probabilistic transient thermal analysis of an atmospheric reentry vehicle structure. Aerosp. Sci. Technol. 2006, 10, 346–354. [Google Scholar] [CrossRef]
- Esmailnezhad, B.; Fattahi, P.; Kheirkhah, A.S. A stochastic model for the cell formation problem considering machine reliability. J. Ind. Eng. Int. 2015, 11, 375–389. [Google Scholar] [CrossRef]
- Schwarzlander, H. Probability Concepts and Theory for Engineers; John Wiley & Sons: Chichester, West Sussex, UK, 2011. [Google Scholar]
- Jin, R.; Cho, K.; Hyun, C.; Son, M. MRA-based revised CBR model for cost prediction in the early stage of construction projects. Expert Syst. Appl. 2012, 39, 5214–5222. [Google Scholar] [CrossRef]
- Aamodt, A.; Plaza, E. Case-Based Reasoning: Foundational Issues, Methodological Variations, and System Approaches. AI Commun. 1994, 7, 39–59. [Google Scholar]
- Berry, W.D.; Feldman, S.; Stanley Feldman, D. Multiple Regression in Practice; Sage Publications: Thousand Oaks, CA, USA, 1985. [Google Scholar]
- Doğan, S.Z.; Arditi, D.; Günaydın, H.M. Determining Attribute Weights in a CBR Model for Early Cost Prediction of Structural Systems. J. Constr. Eng. Manag. 2006, 132, 1092–1098. [Google Scholar] [CrossRef]
- Wong, T.-T. Performance evaluation of classification algorithms by k-fold and leave-one-out cross validation. Pattern Recognit. 2015, 48, 2839–2846. [Google Scholar] [CrossRef]
- Zhou, B.; Li, Z.; Zhang, S.; Zhang, X.; Liu, X.; Ma, Q. Analysis of Factors Affecting Hit-and-Run and Non-Hit-and-Run in Vehicle-Bicycle Crashes: A Non-Parametric Approach Incorporating Data Imbalance Treatment. Sustainability 2019, 11, 1327. [Google Scholar] [CrossRef]
- Chan, A.P.C.; Ho, D.C.K.; Tam, C.M. Design and Build Project Success Factors: Multivariate Analysis. J. Constr. Eng. Manag. 2001, 127, 93–100. [Google Scholar] [CrossRef]
- Chou, J.-S. Cost simulation in an item-based project involving construction engineering and management. Int. J. Proj. Manag. 2011, 29, 706–717. [Google Scholar] [CrossRef]
- Pukelsheim, F. The Three Sigma Rule. Am. Stat. 1994, 48, 88–91. [Google Scholar]
© 2019 by the authors. Licensee MDPI, Basel, Switzerland. This article is an open access article distributed under the terms and conditions of the Creative Commons Attribution (CC BY) license (http://creativecommons.org/licenses/by/4.0/).