Article

The Importance of Standardised Data-Collection Methods in the Improvement of Thermal Comfort Assessment Models for Developing Countries in the Tropics

by
Carolina Rodriguez
1,*,
María Coronado
1,
Marta D’Alessandro
2 and
Juan Medina
3
1
Assistant Lecturer and Researcher at the Architecture Program, University Piloto de Colombia, Bogotá, Colombia, Carrera 9 No. 45A–44, Bogotá 110311, Colombia
2
Architecture, Built Environment and Construction Engineering Department (ABC), Polytechnic University of Milan; Campus Leonardo, via Bonardi 9, 20133 Milan, Italy
3
Architecture Department, University of Los Andes, Bogota, Colombia, Cra 1 Nº 18A–12, 111711 Bogotá, Colombia
*
Author to whom correspondence should be addressed.
Sustainability 2019, 11(15), 4180; https://doi.org/10.3390/su11154180
Submission received: 16 May 2019 / Revised: 14 June 2019 / Accepted: 21 June 2019 / Published: 2 August 2019
(This article belongs to the Special Issue Built Environment Education)

Abstract

:
Thermal comfort in the built environment is one of the most defining parameters influencing energy use, environmental quality, and occupant satisfaction. Unfortunately, there is a lack of research in this area within developing countries, which are becoming increasingly urbanised and where mechanical air conditioning demands are rising. Many of these countries are adopting thermal comfort standards such as the ASHRAE Standard 55, the EN 15251, and the ISO 7730 to regulate the use of air-conditioning; even when these standards have been widely criticised for their inadequacy within geographical regions different to the ones that they were designed for. Research suggests the need to confirm these models through further post-occupancy studies and fieldwork. Deficiencies in data collection and methodologies are thought to require particular attention to develop algorithms that can predict thermal comfort levels accurately. Comprehensive strategies considering interrelated psychological, physiological and social factors are needed. This manuscript highlights gaps of research, specifically within tropical developing countries, through the analysis of Colombia as a case study. It emphasises the importance of standardised fieldwork data and gives examples of alternative collection systems. This aims to contribute to the understanding of occupant´s adaptive behaviours and their impact on the mitigation of climate change.

1. Introduction

The world currently faces essential and complex challenges related to sustainable development, which fundamentally concern the preservation of life on this planet. At the centre of this challenge is the creation of the built environment, where architecture plays a crucial role. Most of the objectives set by the United Nations’ Sustainable Development Goals (SDGs) can be linked to the built environment and the expansion of urban settlements. Data shows that cities currently occupy only 3% of the planet’s surface but represent between 60% and 80% of energy consumption and 75% of carbon dioxide emissions. Additionally, 50% of humanity lives in urban areas—the vast majority in marginal communities—and the tendency is for this to increase to 60% by 2030. According to the State of the Tropics report, before 2050 half of the world’s population will likely reside in tropical regions [1].
In this context, sustainable development has been defined in different ways, which makes it an inherently debatable and modifiable concept. A conventional interpretation delineates it as the ability to “meet the needs of the present without compromising the ability of future generations to meet their own needs” [2]. This interpretation concerns not only scientific aspects but primarily moral, cultural and ideological aspects, which are related to a change of mentality in favour of solidarity and ethics [3]. Unfortunately, the general pressure in the search for sustainability can often blind the exercise of architecture, the direction of research and the development of policies, by prioritising production over reflection. Drastic changes or the introduction of new technologies by themselves are not synonymous with effectiveness or efficiency. Conversely, understanding and reflecting on technology in its social, historical and political context is crucial for its legitimate implementation [4].
Contemporary architecture discourses place thermal comfort as a vital and central component of sustainable buildings. Even when achieving thermal comfort is not particularly a new challenge, but one that has been solved in the past mainly through passive architectural solutions, refined over time according to the conditions of each climate. However, thermal comfort has come to the front line of sustainability debates mainly as the result of a drastic increase in the use of HVAC (heating, ventilation and air conditioning) systems in recent years, which have become more common, affordable, desirable and even unavoidable for certain buildings. This is a relatively new phenomenon in many parts of the world, especially within the housing sector. Data show that in 2007, 87% of homes in the United States had an HVAC system installed, compared to only 11% in Brazil or 2% in India [5,6]. At present, China is the country that consumes the most air conditioning (AC), followed by the United States, India, Brazil, and Indonesia (Figure 1). Likewise, demand has increased exponentially in Malaysia, Singapore, Nigeria, Pakistan, Bangladesh, and the Philippines [7]. It is argued that this trend can potentially bring devastating consequences in terms of environmental damage and the use of non-renewable resources due to its direct impacts on CO2 emissions and energy consumption [8,9,10,11]. Paradoxically, the use of AC is rising rapidly in large and fast-growing cities in developing countries within the tropics, many of which are also geographically located in territories of high vulnerability to climate change.
The tropics comprise the portion of the earth geographically defined between the Tropic of Cancer (23.4° N) and the Tropic of Capricorn (23.4° S), which gets most of the sun exposure. This creates a preconception of the tropics as being a hot and humid zone, when in fact it is a region of vast environmental and climatic diversity. Tropical countries share many cultural and demographic characteristics that stem from their historical, political, and economic circumstances, but also face an imminent call to address critical problems of our time [1]. Colombia is used in this manuscript as a representative case study to review thermal comfort assessment in the tropics, as many challenges in this area are present here. One of the most pressing challenges is the development of policies. The executive reaction towards the proliferation of HVAC systems in this country has mainly focused on the application of standards to regulate its use, more than to address the underlying causes behind its growing demand. This is a concern as it tends to favour mechanical conditioning over passive strategies, which in turn can radically influence design solutions. Usually, the criteria employed to design spaces with mechanical conditioning is very different from the criteria used for spaces with natural ventilation. For example, air-conditioned spaces are designed to be smaller and as airtight as possible to make the mechanical system more efficient. On the contrary, spaces cooled through natural ventilation require a greater height and overall volume and the adequate design of openings to promote air movement. Therefore, if the building was designed with HVAC systems in mind, it is very likely that it will depend on its use throughout its life cycle, as these types of architectural characteristics are very difficult or costly to change at a later date.
The general purpose of this manuscript is to highlight the inadequacy of the current standards in developing countries with tropical climates such as Colombia. This work reflects on primary research by the authors and collaborators over the past five years, which was achieved via structured fieldwork in various buildings in Colombia. The results are used here to stress the importance of standardised data collection and methodology systems in the search for improved standards that not only regulate HVAC systems but most importantly, address preventative and palliative measures from an architectural perspective.

2. Literature Review

2.1. Context of the Case Study

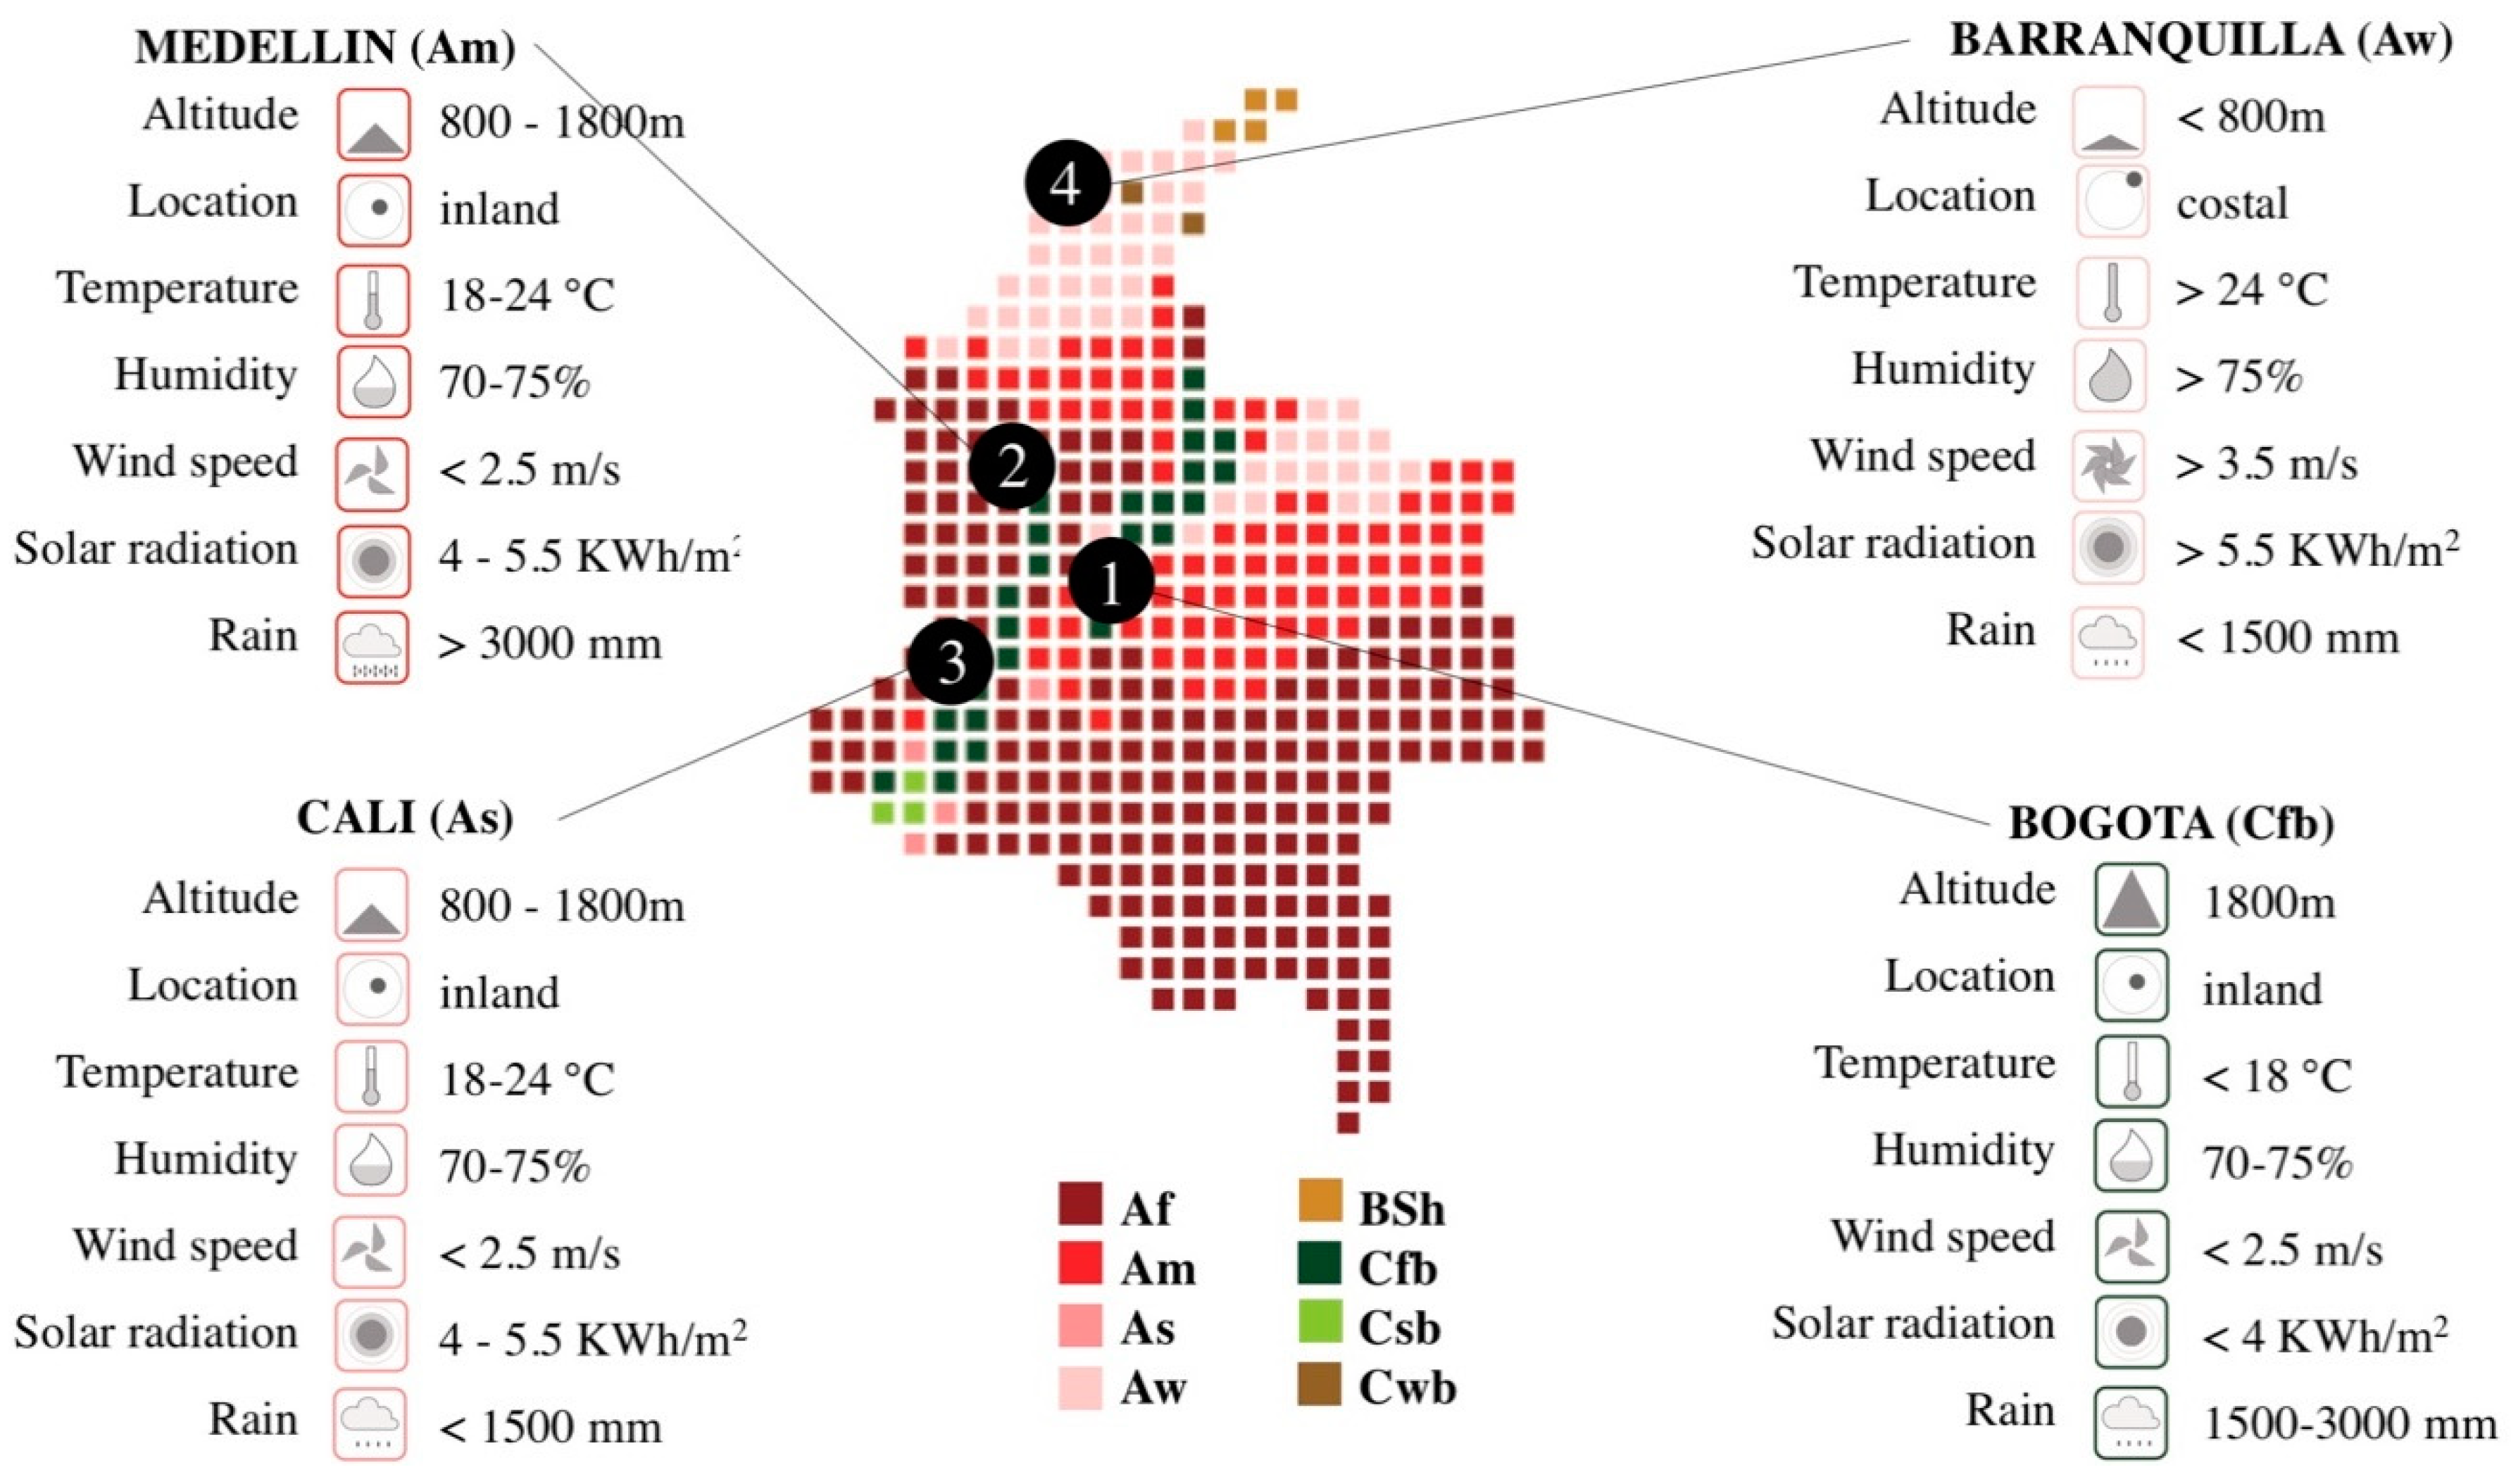
Figures from the 2018 census reveal that Colombian population is comprised by 45.5 million people, which—according to the UN estimates—places it amongst the 30th most populated countries in the world, the 13th within tropical countries and the 3rd in Latin America (after Brazil and Mexico) [13]. A large percentage of its population (77.8%) lives in main cities, 7.1% in small settlements and 15.1% in rural areas [14]. Colombia´s largest cities have very different climates. For example, its capital Bogotá—located at 2547 m above sea level, with an average temperature of 14 °C and 73% relative humidity—is considered a cold climate type Cfb (in the Köppen–Geiger classification). Medellín—located at 1490 m, with an average temperature of 22 °C and 68% relative humidity—is considered a tropical monsoon type Am. Cali—located at 961 m, with an average temperature of 23 °C and 73% relative humidity—is considered a tropical warm-dry climate type As. While Barranquilla—located in a coastal zone at 52 m, with an average temperature of 28 °C and 80% relative humidity—is considered a wet-dry tropical climate type Aw (Figure 2) [15].
Between 2011 and 2016, the AC demand in Colombia increased by 66%, ranking it as the 5th largest demand in Latin America, with approximately 200–250 thousand AC units sold per year [7]. In order to guide the AC use, the Colombian Technical Standard for Thermal Environmental Conditions in Buildings (Norma Técnica Colombiana NTC 5316: Condiciones Ambientales Térmicas de Inmuebles para Personas) was introduced in 2004. This standard is a literal translation into the Spanish language of the United States norm ASHRAE Standard 55: Thermal Environmental Conditions for Human Occupation. Their application in the design of buildings is advised but not yet mandatory within sustainable architecture policies in Colombia, which are relatively recent compared to the rest of the world. Resolution 5926 of 2011 [16] was the first official policy to cover aspects related to eco-efficient buildings. Subsequently, in 2015 the Ministry of Housing introduced Resolution 0549, which focuses on mandatory reductions in water and energy consumption in new dwellings [17]. Although this resolution suggests actions such as natural ventilation, proper orientation, and sun protection, there are no mandatory or detailed guidelines to guarantee or evaluate these parameters either in existing or in new constructions. Therefore, the minimum requirements for thermal comfort are very difficult to measure or enforce.

2.2. Thermal Comfort Assessment Models

Mainstream thermal comfort standards such as the ASHRAE Standard 55, the ISO 7730 standard or the CSN EN 15251 standard, were initially developed in and for the United States and Europe, respectively [18]. These standards include two main methods or models for assessing thermal comfort in buildings, which are the most commonly used worldwide. These are known as the static model or thermal equilibrium model, developed by Fanger [19] and the adaptive model lead by de Dear et al. [20]. The static model focuses on the study of physiological variables related to the heat exchange between the human body and the environment, and it is usually advised for spaces with mechanical ventilation. The adaptive model includes other dynamic variables related to the external climate and occupants’ actions, and it is generally advised for spaces with natural ventilation.
Although there is still no academic or political consensus on the feasibility or applicability of any of these models within different contexts, many countries such as Colombia have implemented them in a literal way and without any adaptation to local economic, political, cultural or geographic conditions. There is now compelling evidence revealing that these standards and evaluation models are not the most appropriate for buildings in tropical climates [21,22]. This is primarily because the perception of neutrality and comfort is subjective and can vary significantly between different climates and seasons [23,24] and amongst occupants—according to age, [25] gender [26] and cultural background [24]. Consequently, alternative models to assess thermal comfort in buildings with natural ventilation or mixed ventilation have emerged in other countries or regions, many of which are inspired by the adaptive model. For example, Toe and Kubota [27] suggest a model for hot and humid climates in general. Other models focus on specific tropical regions in Southeast Asia [28], México [29] and Brazil [30]. While more specific models point to different types of occupation, such as residential buildings in different climatic zones of eastern China [31] or office buildings in hot and humid climates of India [32]. There is no similar study yet focusing on the case of Colombia.
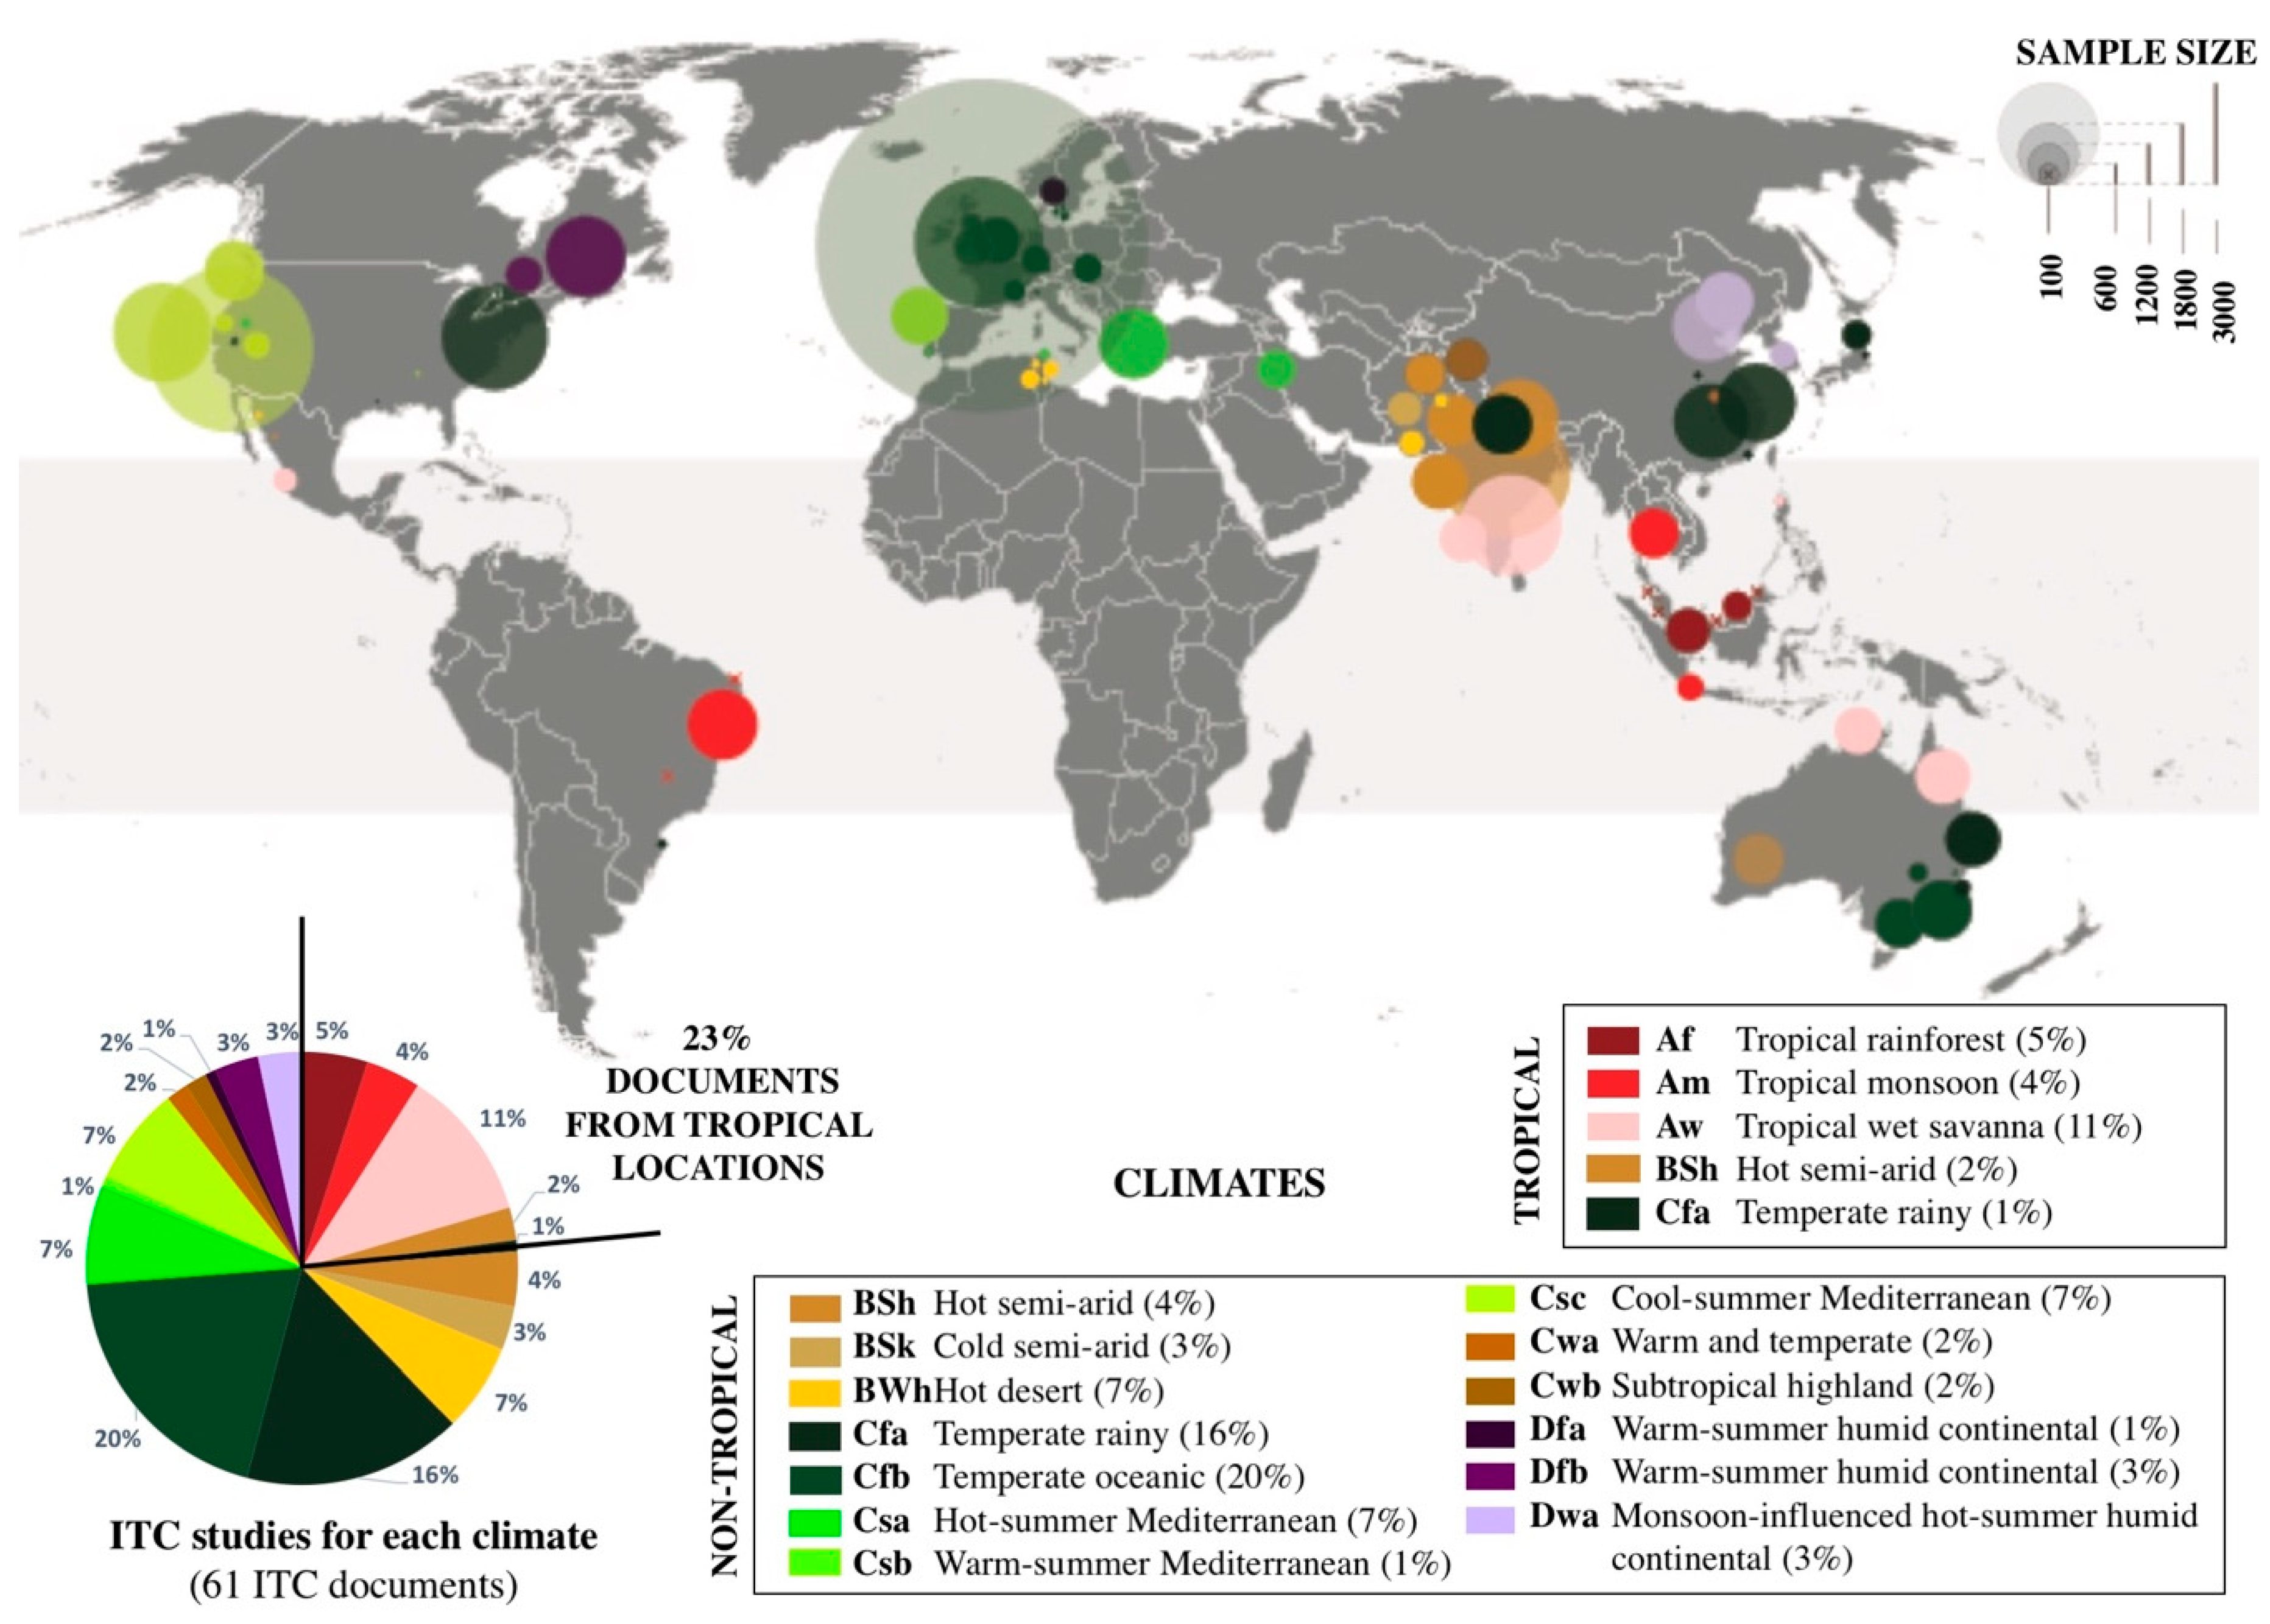
The adaptive model was developed and recently updated using information from two databases: the ASHRAE RP-884 database published in 1998 comprising 23 field research projects [20] and the ASHRAE Global Thermal Comfort Database II published in 2018 comprising 42 field research projects [33,34]. A closer look at these databases evidences their limited amount of information from tropical regions and climates of Africa, South America, Central America, and the Caribbean. Only 23% of the studies in these databases looked at climates in tropical regions. Most of the buildings were offices, including a very small percentage of buildings with natural ventilation, especially in the first sample (Figure 3). Furthermore, these standards were promoted and endorsed by associations such as ASHRAE (American Society of Heating Engineers, Refrigeration and Air Conditioning). Therefore, it is argued that their content and wording may suggest the superiority of mechanical conditioning over other alternatives.

2.3. The Problem

Despite the standards´ limitations mentioned above, one of the main contributions of the ASHRAE databases is the systematisation of raw data from various thermal comfort field studies around the world. Information about environmental conditions (taken from existing buildings and some subjective evaluations from their occupants) was categorised for these databases using multiple criteria, such as building typology, occupancy type, occupants’ demographics, thermal comfort perceptions, indoor instrumental measurements, outdoor meteorological information, and calculated comfort indices. This is a considerable achievement given the complexity of comparing studies from different authors in distinct contexts and using diverse methodologies to acquire and analyse data. However, information regarding building characteristics or occupants’ demographics was not used to create variables within the algorithms used to establish ranges of comfort.
Deficiencies in data collection and fieldwork methodologies are one of the biggest challenges faced in thermal comfort research since the accuracy of the theoretical models relies greatly on the quality of the recorded data from real buildings. Another significant limitation is geographic coverage. Even when the study of thermal comfort has received a great deal of academic attention in recent decades, there is still a general lack of research in tropical contexts and climates, compared to other regions in the world. General bibliometric searches can roughly evidence this. For example, a Scopus search with the terms “thermal comfort” carried out on 27 January 2019 displayed 20,011 documents (including 2702 open access). A total of 87% of this information was published after 2000 and 62% after 2011. Six countries lead research in this area: China, the United States, the United Kingdom, Italy, Japan, and Germany with 48% of all the published production. All of these countries are located above the Tropic of Cancer, except China which has a small portion of territory below this border.
The lack of information regarding thermal comfort in the tropics limits the development of standards suitable for these regions. Recently, tropical countries such as Brazil, India, Malaysia, and Singapore have greatly increased their research efforts in this area, mainly through fieldwork. However, studies are still disjointed from the rest of the tropics and data-collection methods, and evaluation techniques are dispersed. It is argued here that some level of standardisation is needed to facilitate comparative and statistical analysis that could influence the development of more accurate policies based on the existing data.

3. Methods

3.1. Fieldwork

The above problem in the context of Colombia is studied here through an inductive methodology, where it is outlined based on existing literature and preliminary studies and then analysed through fieldwork. Four projects by the authors that involved fieldwork were examined here, two of them in apartment buildings and two in school buildings (Figure 4 and Table 1). These projects were chosen due to their similarities in terms of geographical, climatic and cultural context. The methods used for data collection and analysis were equivalent and the resulting information was comparable. Studying two different building typologies highlighted the need for customisation according to the building use and occupants´ characteristics. The projects were studied at different times of the year and in different years. This allowed a broader vision of the problem and presented opportunities for the refinement of methodologies.
The projects are all located in Bogota (4.7° N, 74.1° W), classified as Cfb climate with little seasonal variation throughout the year in terms of average temperature (±14 °C) and relative humidity (±73%) and two marked rainy seasons (April–May and October–November). The projects differed from each other in terms of building features, use and occupancy characteristics. Quantitative and qualitative information was collected for all of these projects using various tools and procedures. The static and adaptive models, from the ANSI/ASHRAE standard 55 [36], were both used to analyse the collected data, plus an alternative theory of environmental satisfaction [37].

3.1.1. Project One

This consisted of a new housing complex representative of the majority of social housing projects built in Bogotá in the past decade. It featured 456 apartments in 19 six-storey towers with four apartments per level [38]. The project was divided into two stages, during the first one, a sample of 44 apartments distributed on different floors and towers was evaluated. The apartments were then classified into four groups according to their orientation and position within the building. Finally, information was collected from the building and the occupants between November 2015 and April 2016.
The second stage sought to explore and test passive design solutions for the deficiencies found during the evaluation. These were initially studied via computer models and dynamic thermal simulations with Energyplus™ software. Two solutions were chosen to be built focusing on increasing thermal mass and improving air-tightness on the inner part of the walls of the facade, and windows. A comparative method was used for the evaluation, where two apartments with similar conditions (apartment A and apartment B) were selected. Apartment A was left alone, while apartment B was altered with two interventions. Both apartments were studied over three weeks in November 2016.

3.1.2. Project Two

This consisted of a housing complex built in 1987 and representative of the type of multifamily projects that have been built in Bogotá from the end of the 20th Century. It featured 227 apartments in 5–7 storey courtyard configurations. A sample of 28 apartments was selected for the study carried out during May 2017.

3.1.3. Project Three

This was a four-storey school building erected during the early 1940s comprising 37 classrooms, laboratories, offices and specialised classrooms for art and music classes. The rooms were 62.5 m2 on average with 3.7 m high ceilings and placed around two courtyards in a traditional cloister style. The school has a mixed population mainly from middle-income families and with an average occupancy of 32 students per classroom. The teaching format was fairly traditional for the context of Colombia, with students staying in the same room for most of their classes.

3.1.4. Project Four

This was a building mainly constructed during the 1960s with 13 single-storey classrooms. The rooms were 72 m2 on average with 3 m high ceilings and placed in a U-shaped block along internal corridors, leaving one paved courtyard in the middle. This was a boys’ school with a population mainly from middle- and upper-income families and with an average occupancy of 25 students per classroom. The students had activities in different classrooms with an active teaching and learning format.

3.2. Data Collection Tools

Measuring the building’s physical conditions was one of the most demanding tasks in the projects presented here, due to all the administrative work involved in finding suitable buildings, as well as, the financial limitations of acquiring all the necessary equipment and tools. The evaluation of comfort in existing buildings is not a requirement of the ASHRAE Standard 55. However, the standard suggests equipment criteria for indoor environmental data collection [39]. Table 2 shows these recommended criteria next to the equipment used during the projects presented here. It also indicates which parameters are typically used for thermal comfort assessment using the static and adaptive models.
In practice, it was found that multi-channel data loggers are suitable equipment, as they record time-based information, are relatively small in size, and can measure different variables simultaneously. For example, some data loggers can record temperature, relative humidity and mean radiant temperature at the same time or use external probes to measure CO2 concentration, airspeed, surface temperatures or temperatures at different heights to determine stratification. This makes them more cost-effective. Values for surface temperature, plane radiant temperature, and directional radiation are not used in the established algorithms for the static or adaptive models, therefore, they are rarely measured in post-occupancy studies. They were not measured in the projects of the case study due to equipment and recourses limitations.
Many fieldwork projects found in the literature used outdoor weather data from municipal weather stations. This is problematic in the study of tropical countries as these facilities are scattered unevenly and are unusually sparse in Africa and many parts of South America [40]. Additionally, in urban settings weather conditions tend to change within small geographical distances, creating microclimatic zones [41]. Information from local weather stations was used for the first two projects; however, it was confirmed that there were marked differences compared to the actual conditions at the building´s locations. Therefore, mobile on-site weather stations were later acquired and strategically installed in close proximity to the studied buildings in projects 3 and 4. They proved to be practical and more effective to compare indoor-outdoor conditions simultaneously.
The written surveys recommended by appendix L of the ASHRAE Standard 55 were initially adapted and used to collect qualitative data from the occupants of project 1. The ASHRAE recommended surveys are designed to collect information regarding the location of the studied space and point-in-time conditions, as well as selected occupant´s characteristics and general thermal comfort perceptions. In practice, the surveys were found to be inadequate for the demographics studied due to the limitations described in Table 3. Additionally, they tended to be long and repetitive, which frustrated some of the occupants.
In the case of the school buildings, the question’s language, interface, and complexity of the recommended surveys were found to be entirely unsuitable for children. Therefore, new surveys were designed and implemented. Alternative data-collection tools were also tested in these projects, for example, thermographic photographs, observation logbooks, interviews with focus groups, phone surveys, building management databases, and dynamic thermal simulations (Figure 5).

3.3. Studied Variables

During the literature review for this work, many different parameters that can potentially affect thermal comfort were identified concerning physical and environmental conditions and physiological and psychological factors. Some of these variables, for example, altitude, UV radiation, and CO2 levels can significantly impact thermal comfort in cases such as Bogota; however, they are very frequently overlooked. Additionally, architectural variables, such as envelope materials, building components, and space layout, also have substantial physical and physiological effects on the perception of comfort. Personal variables related to the perception of social status, aspirations, and desires—which can change from one culture to another—are also not considered very often. These are thought to be critical in understanding the origins and stimuli behind the growing demand of HVAC systems. Therefore, the surveys and alternative data collection methods were modified to gather evidence on the above variables.

4. Results

4.1. Alternative Data-Collection Tools

The chosen and adapted tools (Table 4) working together allowed the collection of valuable information that contributed to a more holistic understanding of thermal comfort in these buildings. The thermographic photographs and building management databases were particularly useful to detect elements of the building design that were problematic. Likewise, the interviews with focus groups and the observation logbooks demonstrated to be powerful instruments to identify preconceptions, preferences, and adaptational behaviour by the occupants.

4.2. Procedures

The standard procedures to acquire data were found to be particularly linear, fragmented and exclusive. The typical sequence comprises the preparation and gathering of data on-site followed by its analysis off-site and subsequent academic publication of the results. Occupants are usually involved only during the survey stage, but the outcomes of the studies are rarely presented to them afterwards. It is argued that more cyclical and inclusive procedures that involve the occupants at different stages of the project can significantly improve data collection. For example, it was found that according to the age and social background of the occupants, preparatory activities need to be carried out previous to the application of the surveys, such as informal talks, distribution of literature or staff training. Occupants tend to be more motivated and provide more reliable feedback when they feel rewarded for their efforts, in some instances with material prizes or with knowledge. Therefore, involving occupants during the analysis and discussion of results proved to be very valuable to improve and refine the outcomes of the studies.
Some limitations were encountered when placing the equipment in different types of buildings. For example, in school buildings, it became inconvenient to locate the data loggers in the centre of the classrooms for long term measurements. Children are constantly moving and may find the devices distracting during class hours. They may trip on the equipment or knock it down, which may be a hazard and result in data loss or damage of the data loggers. For this reason, the measuring equipment was placed at the back of the classrooms, 1.0 m away from the wall and any infrared radiation or heat sources (Figure 6). This data was complemented with short-term measurements taken with additional equipment at the centre of the room while students were being surveyed.
While working with different occupants and space types, it became evident that the height at which equipment was placed was also an important issue not taken into account by the existing procedures. ASHRAE Standard 55 only includes guidelines for measurements with adult users; therefore, the study of specific equipment height—according to the children’s different stages of development—was needed. Additional issues were encountered, especially when working with children. For example, equipment may stop working, or users may disconnect it or move it during the sample. It became necessary to monitor the equipment regularly during long term measurements and work closely with occupants, teachers and students to avoid these kinds of problems.
Ethical guidelines in Colombia state that minors can only answer surveys with the signed authorisation from their parents or guardians; therefore, the survey sample was conditioned to parent’s approval. This reduced the sample significantly in each classroom, despite working closely with teachers and school staff and informing families in advance about the importance and scope of the study. Therefore, to gather enough data and follow Standard 55’ recommendations, it is advisable for fieldwork studies in schools to survey a larger percentage of occupants than in other types of buildings.

4.3. Data Analysis

The static and adaptive models in the ASHRAE Standard 55 provide algorithms that can be used to calculate ranges of comfort. Tools, such as the Thermal Comfort Tool by the Center for the Built Environment (CBE), University of California Berkeley [42], allow the quick visualisation of these ranges in charts using a limited number of variables. These algorithms and tools were initially used to analyse all of the studied projects. The overall results suggested significant thermal comfort deficiencies, which corroborates initial theoretical research done based on computer simulations. These deficiencies were identified using both the static and the adaptive models proposed by ASHRAE Standard 55. The latter model was found to be slightly more accurate in describing comfort ranges for the selected samples, concerning the occupant’s perceptions recorded via surveys. However, considerable overlaps between the comfort levels predicted by the models and the actual data found during fieldwork were noticed.
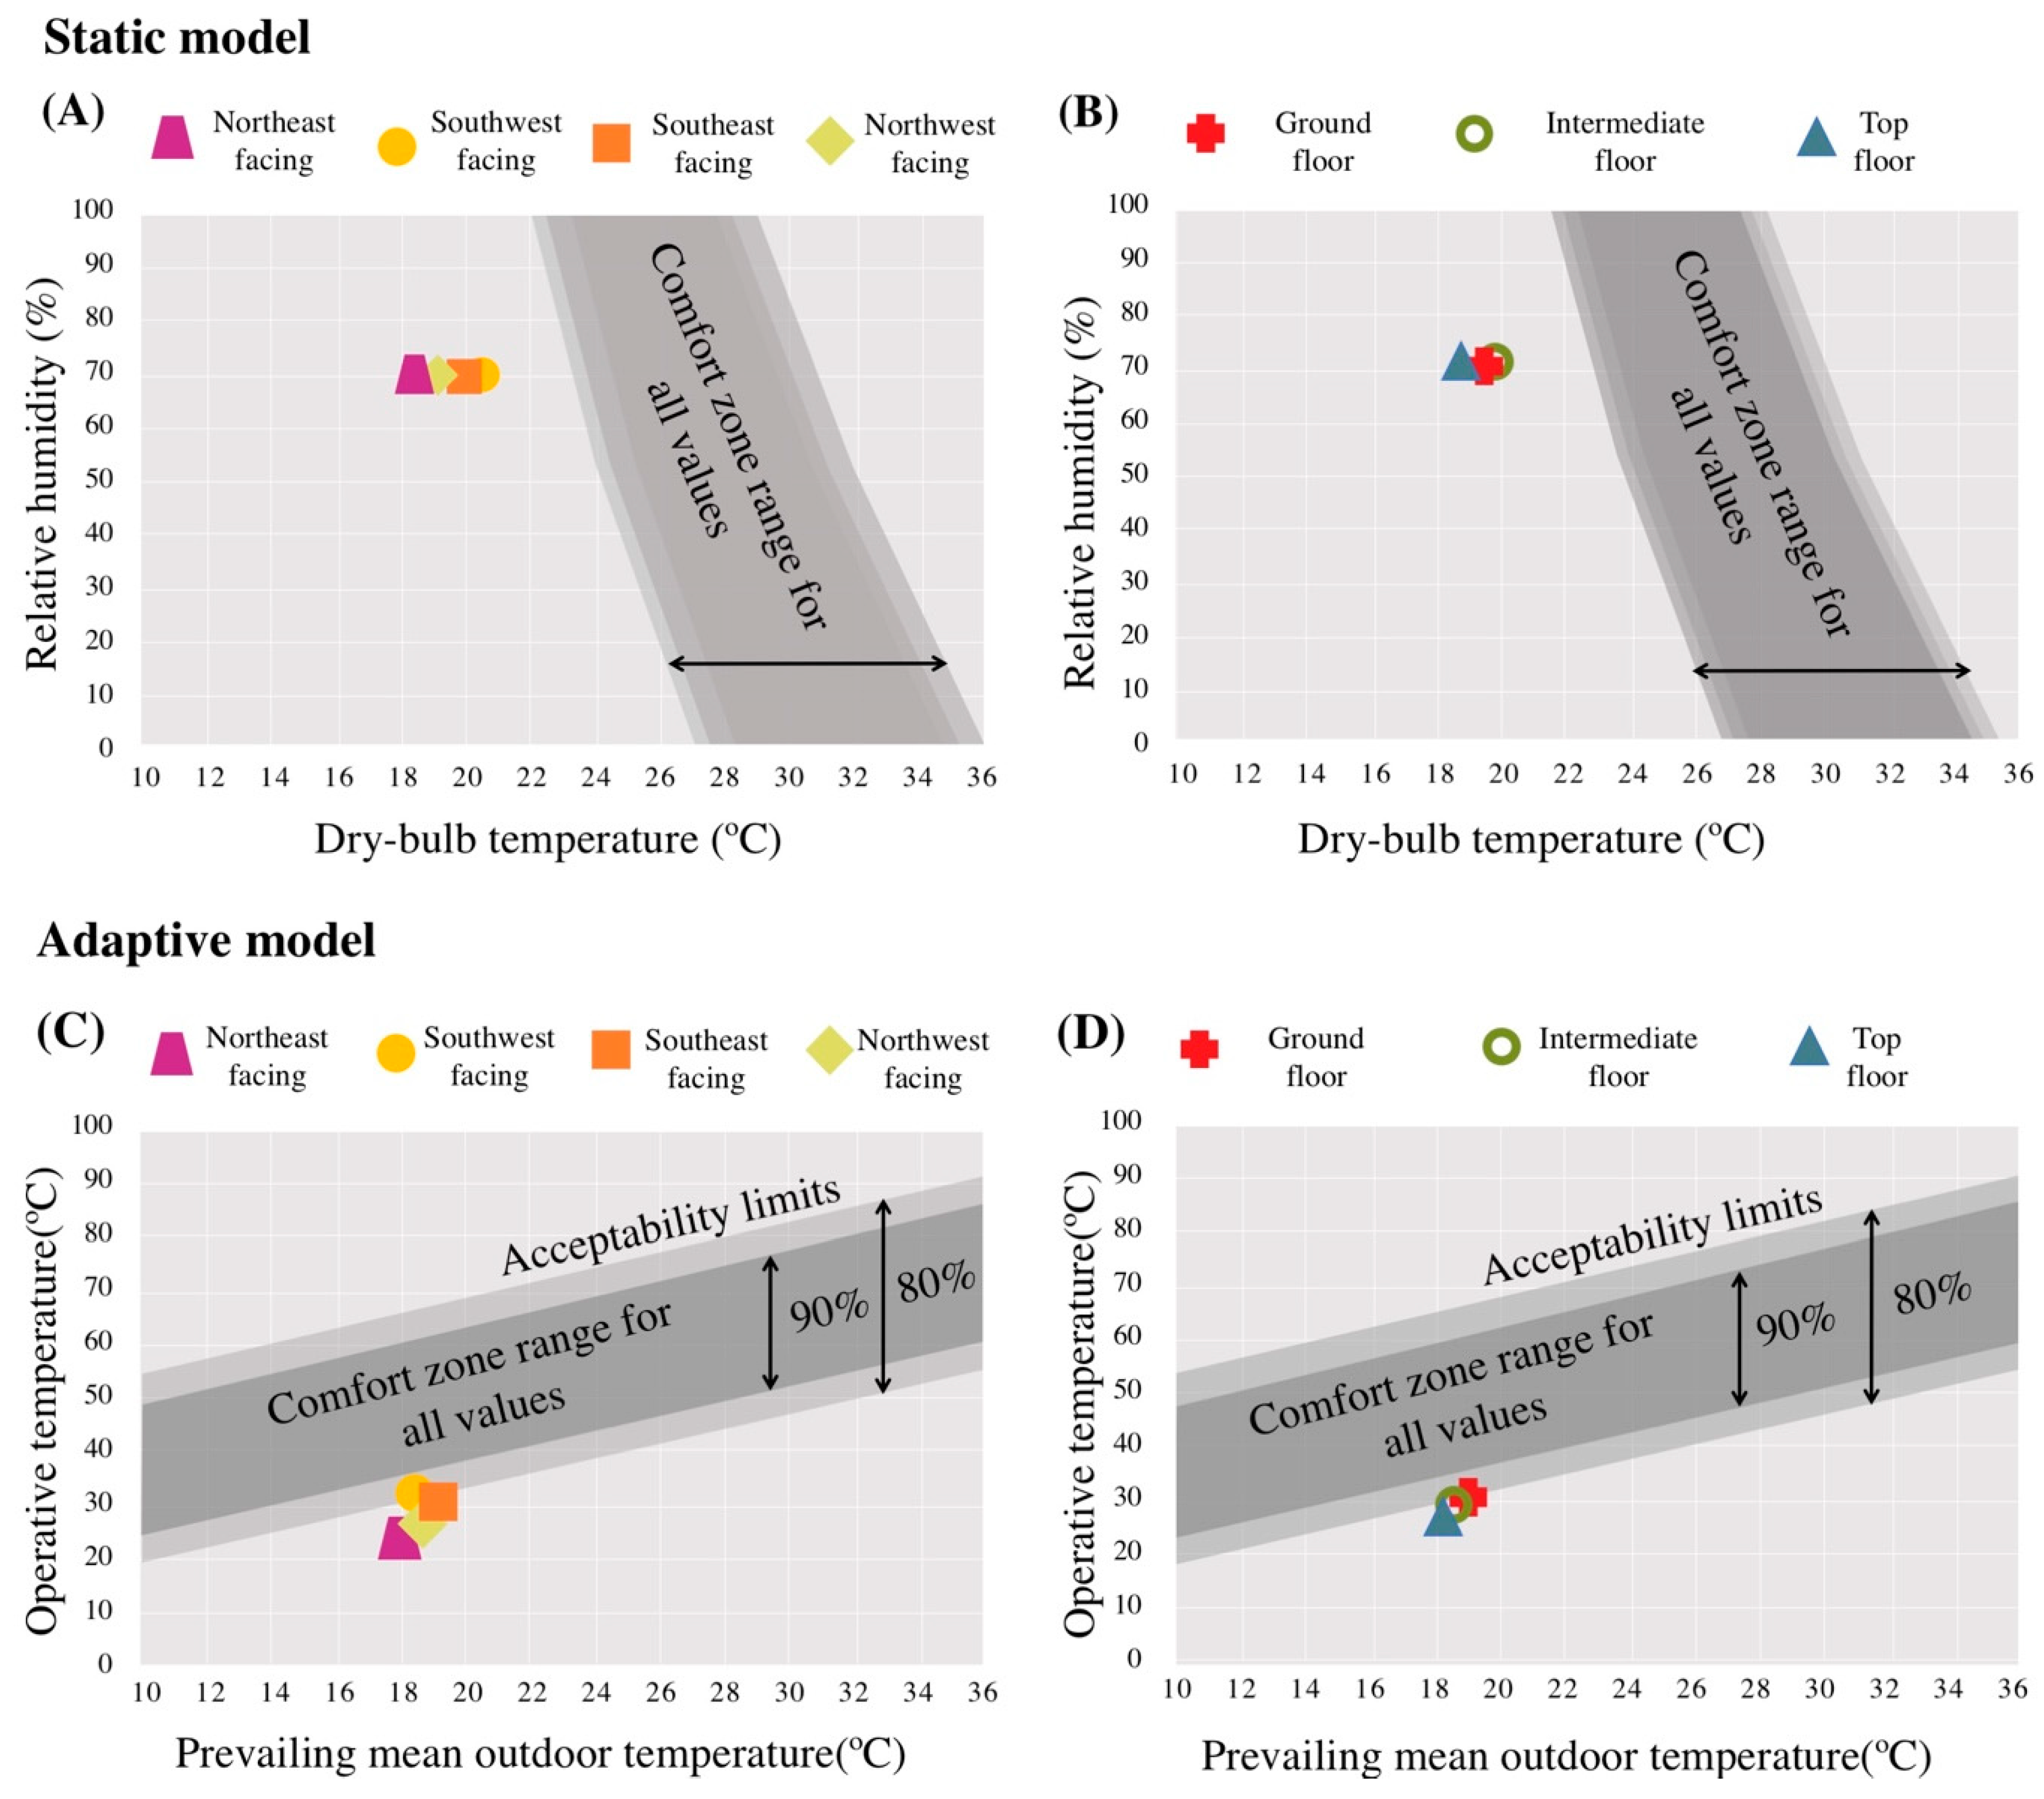
Different results were produced using the same quantitative and qualitative data but different analysis methods. Figure 7 illustrates, with an example from project 1, the marked differences found concerning compliance with the advised comfort zones. According to the Predicted Mean Vote (PMV) calculation from the static model, the overall comfort zone for these apartments was in the range of 22–36 °C (temperature vs. relative humidity). For the average relative humidity measured during the fieldwork (70% rh) the recommended temperature was between 23 and 31 °C. The actual recorded temperatures on-site were on average between 18 and 21 °C (Figure 7A,B). This indicated that all apartments were far out the advised comfort zone. In contrast, according to the charts from the adaptive model (operative temperature vs. prevailing mean outdoor temperature) all apartments studied were outside the recommended 90% satisfaction comfort zone. However, the southwest-facing and southeast-facing apartments, as well as the ground and intermediate floor apartments were very close to the borderline of the 80% satisfaction zone (Figure 7C,D).
The results in project 1 showed indoor temperature fluctuations of up to 4 °C between maximum and minimum values throughout the day, which were directly linked to outdoor fluctuations of up to 11 °C. Occupant dissatisfaction in this project reached up to 80%, especially in north-facing apartments on the top and ground floors. During the studied period (November–April), northeast-facing apartments were 2 °C colder and 10% more humid on average than southwest-facing apartments, due to lack of sun exposure. Top and ground floors also had considerable thermal losses through the roof and the floor slab, respectively. They were between 1 and 2 °C colder with 2–4% more relative humidity compared to intermediate floors. In the measurements, the apartment’s location and orientation were clearly influential factors for thermal comfort. However, in the responses given by the occupants, it was found that comfort was perceived very differently in apartments with the same layout, orientation, construction characteristics and comparable measurements, but with distinct surface finishes.
Apart from the static and adaptive models, no other alternatives were found for the systematic analysis of the other wide range of variables that were collected during fieldwork. In most of the literature, these were usually evaluated at the researcher’s discretion. The most compelling option identified was a theory of environmental satisfaction [37] developed to help interpret and study the occupant’s modes of adaptive behaviour. This theory classifies and rates the process undertaken by individuals in an effort to mitigate discomfort. It was applied to develop and analyse the surveys in all four projects and considered to be useful to identify and evaluate the architectural characteristics that contributed to creating thermal discomfort, the actions taken by the occupants and their commitment to finding a solution. In the case of project 1, when occupants were asked in the survey what was the best way to improve the current situation in their apartment, 32.6% of them replied that it was by installing heating devices (Figure 8). Additionally, a large majority of them (84.1%) were willing to pay to improve their thermal comfort.
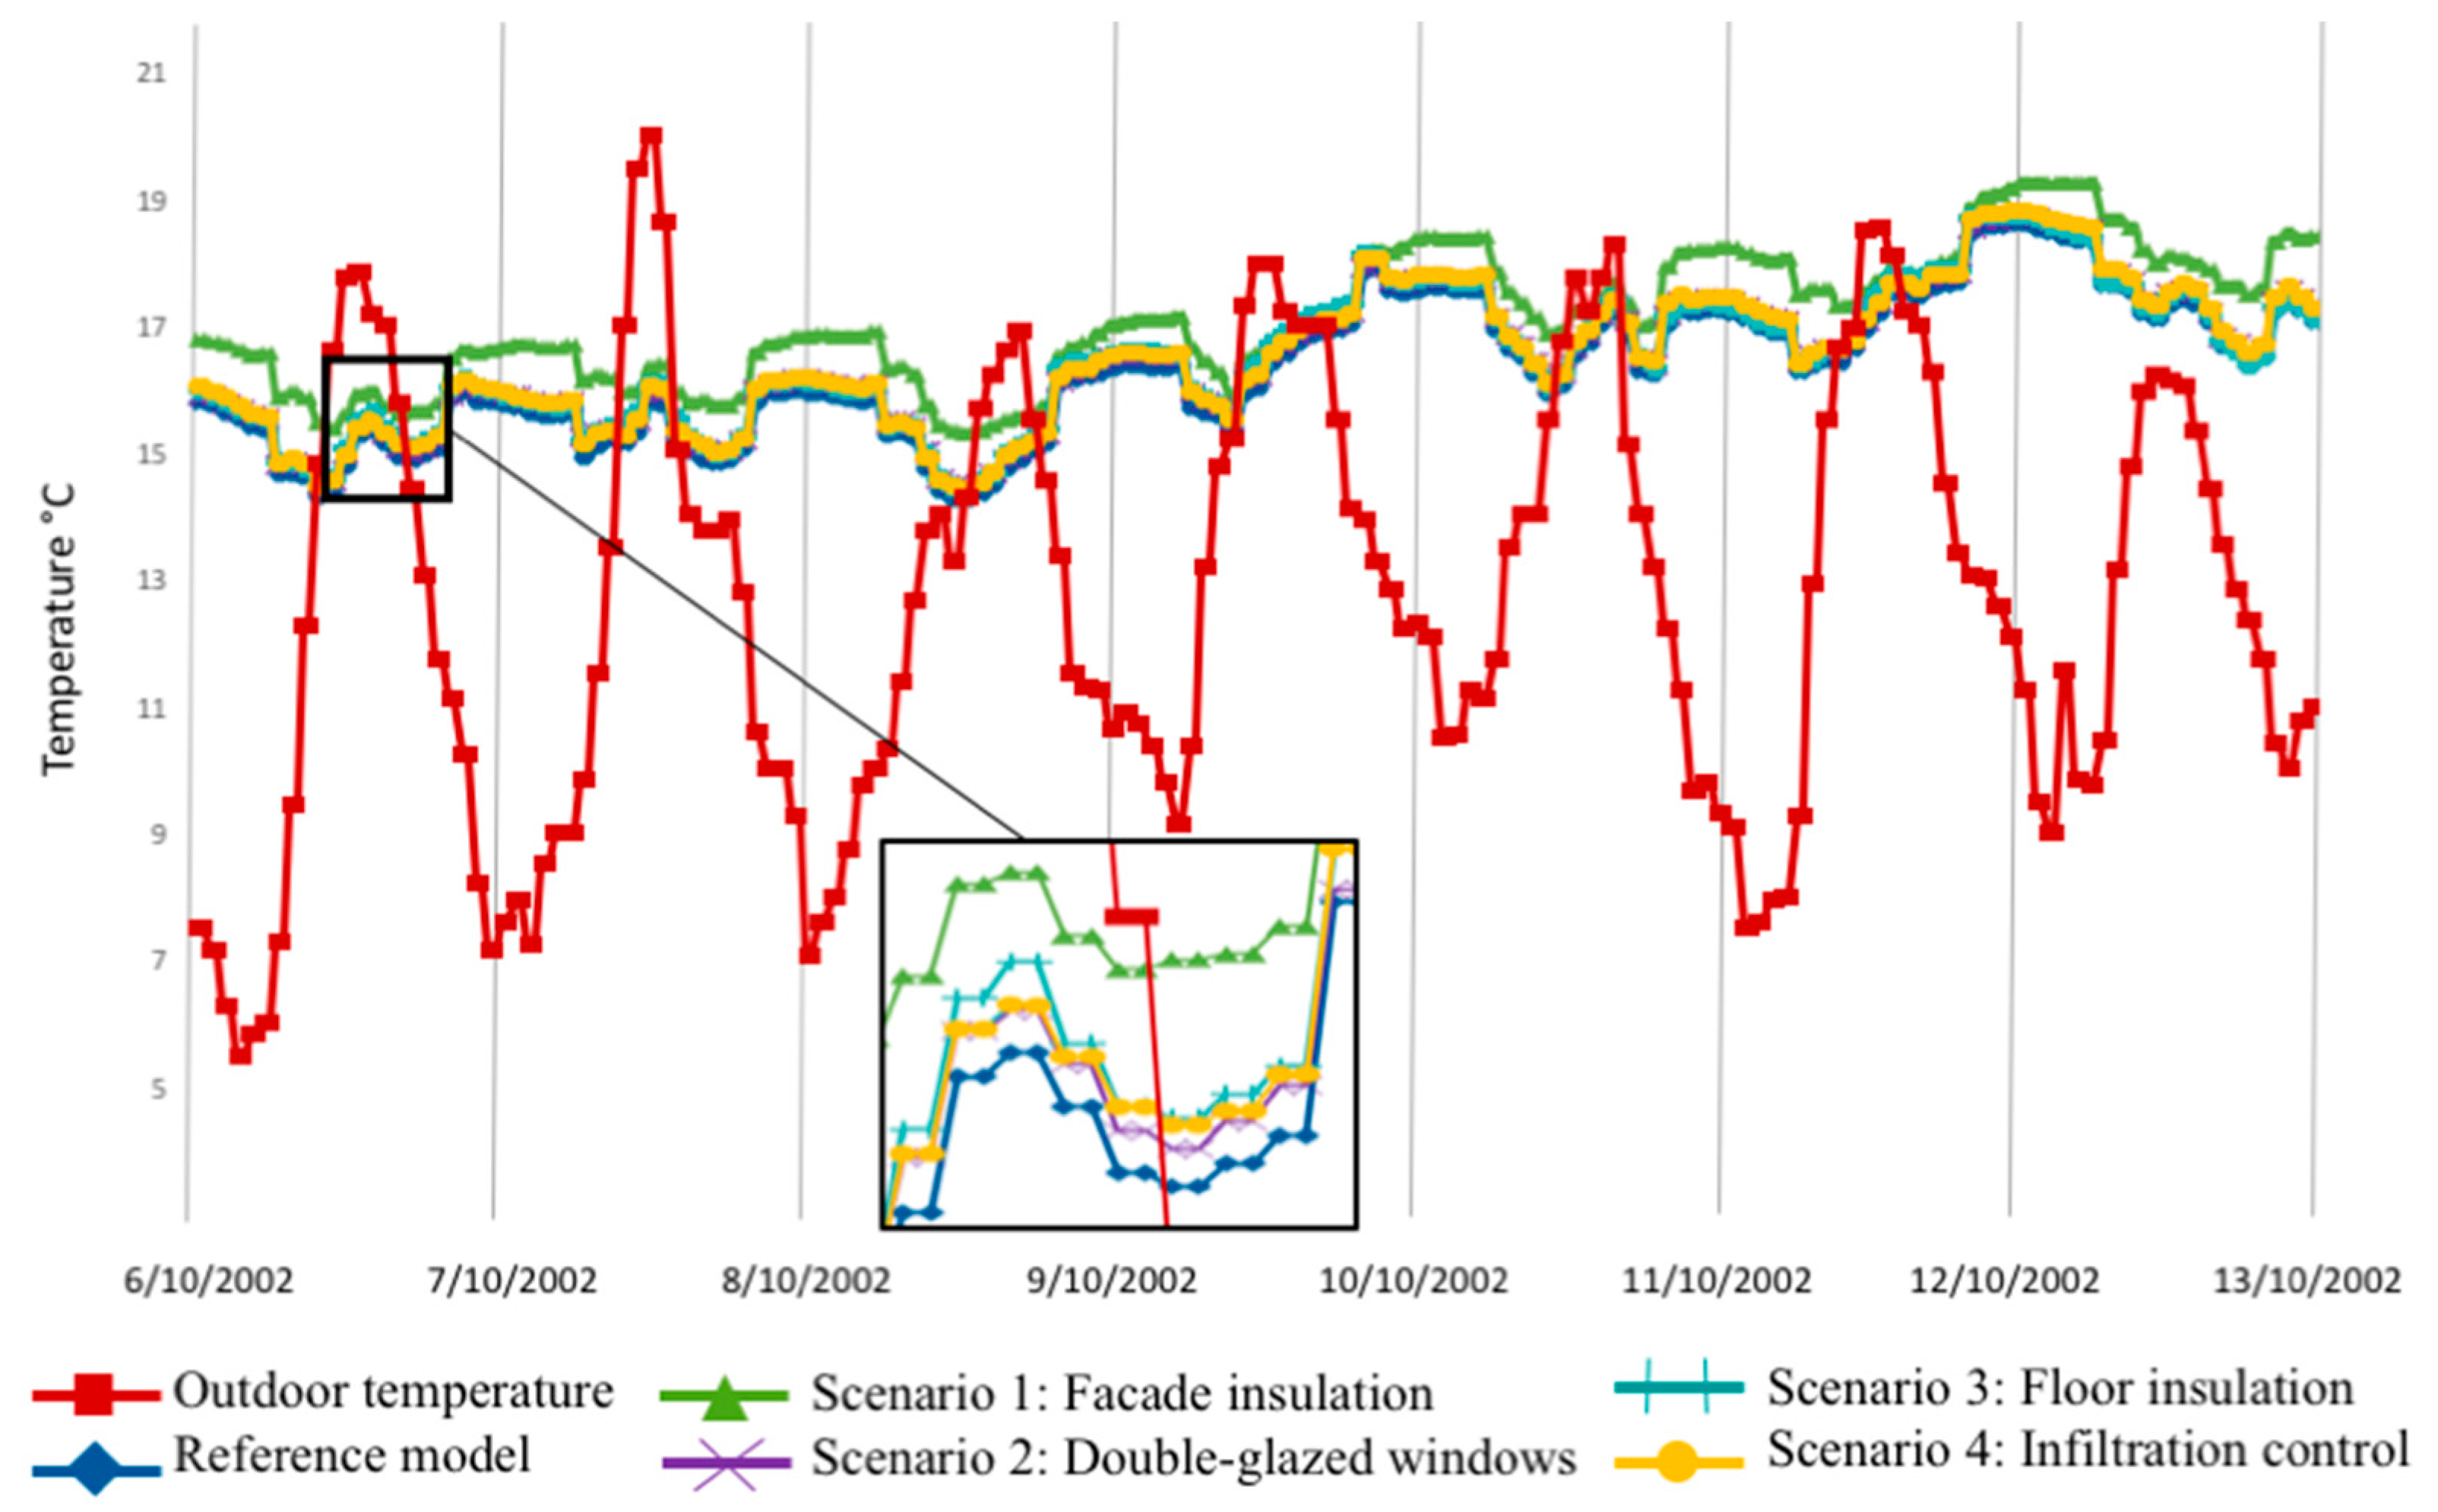
If the results from the evaluation with the static and adaptive models and the answers to the occupant’s satisfaction questions are viewed alone, they may suggest the need for the introduction of mechanical conditioning. However, when all the data collected through alternative tools were analysed together, it suggested that the main problem was the poor thermal performance of the overall building’s envelope. Most of the sources of discomfort were found in the facades (Figure 8). Possible solutions developed through dynamic thermal simulations during the second part of the project indicated that this problem could be solved just by a moderate increase in thermal mass and the improvement of air-tightness. Figure 9 shows four potential retrofit scenarios that were considered: (1) Insulating the facade with 60 mm thick fibreglass insulation. (2) Changing the existing single glassed windows for double glassed windows. (3) Insulating the floor with a 30 mm thick polyurethane layer. (4) Minimising infiltrations by sealing window and door frames. These four scenarios were evaluated using the coldest week of an average year in Bogotá (6–12 October 2002). It was observed that, in this case, the most efficient strategy to increase indoor temperatures was scenario 1 followed by scenarios 4 and 2.
This hypothesis was later demonstrated with two interventions developed in one of the apartments, where indoor temperatures were increased by 2 °C only by adding thermal insulation and improving the fenestration performance. In intervention 1, the inner side of the facades was improved with a retrofit comprising 10 mm plasterboard with stucco and paint finish, a vapour barrier, steel studs at 500 mm centres, 63 mm (2.5”) fibreglass insulation and a waterproof membrane. Intervention 2 consisted of additional sliding windows (identical to the existing) fitted onto the walls built for intervention 1. These were 50 mm framed aluminium windows (not thermally broken) with 4 mm of transparent glass, which formed a 50 mm air gap with the existing window. The occupants of the studied apartment reported a substantial increase in their thermal comfort satisfaction. Past literature indicates that, in similar buildings, insulation and air-tightness can effectively increase the mean indoor temperature by reducing the rate of heat loss through the building fabric [43]. However, further research and investment are needed to corroborate these findings in other types of housing projects in Colombia.
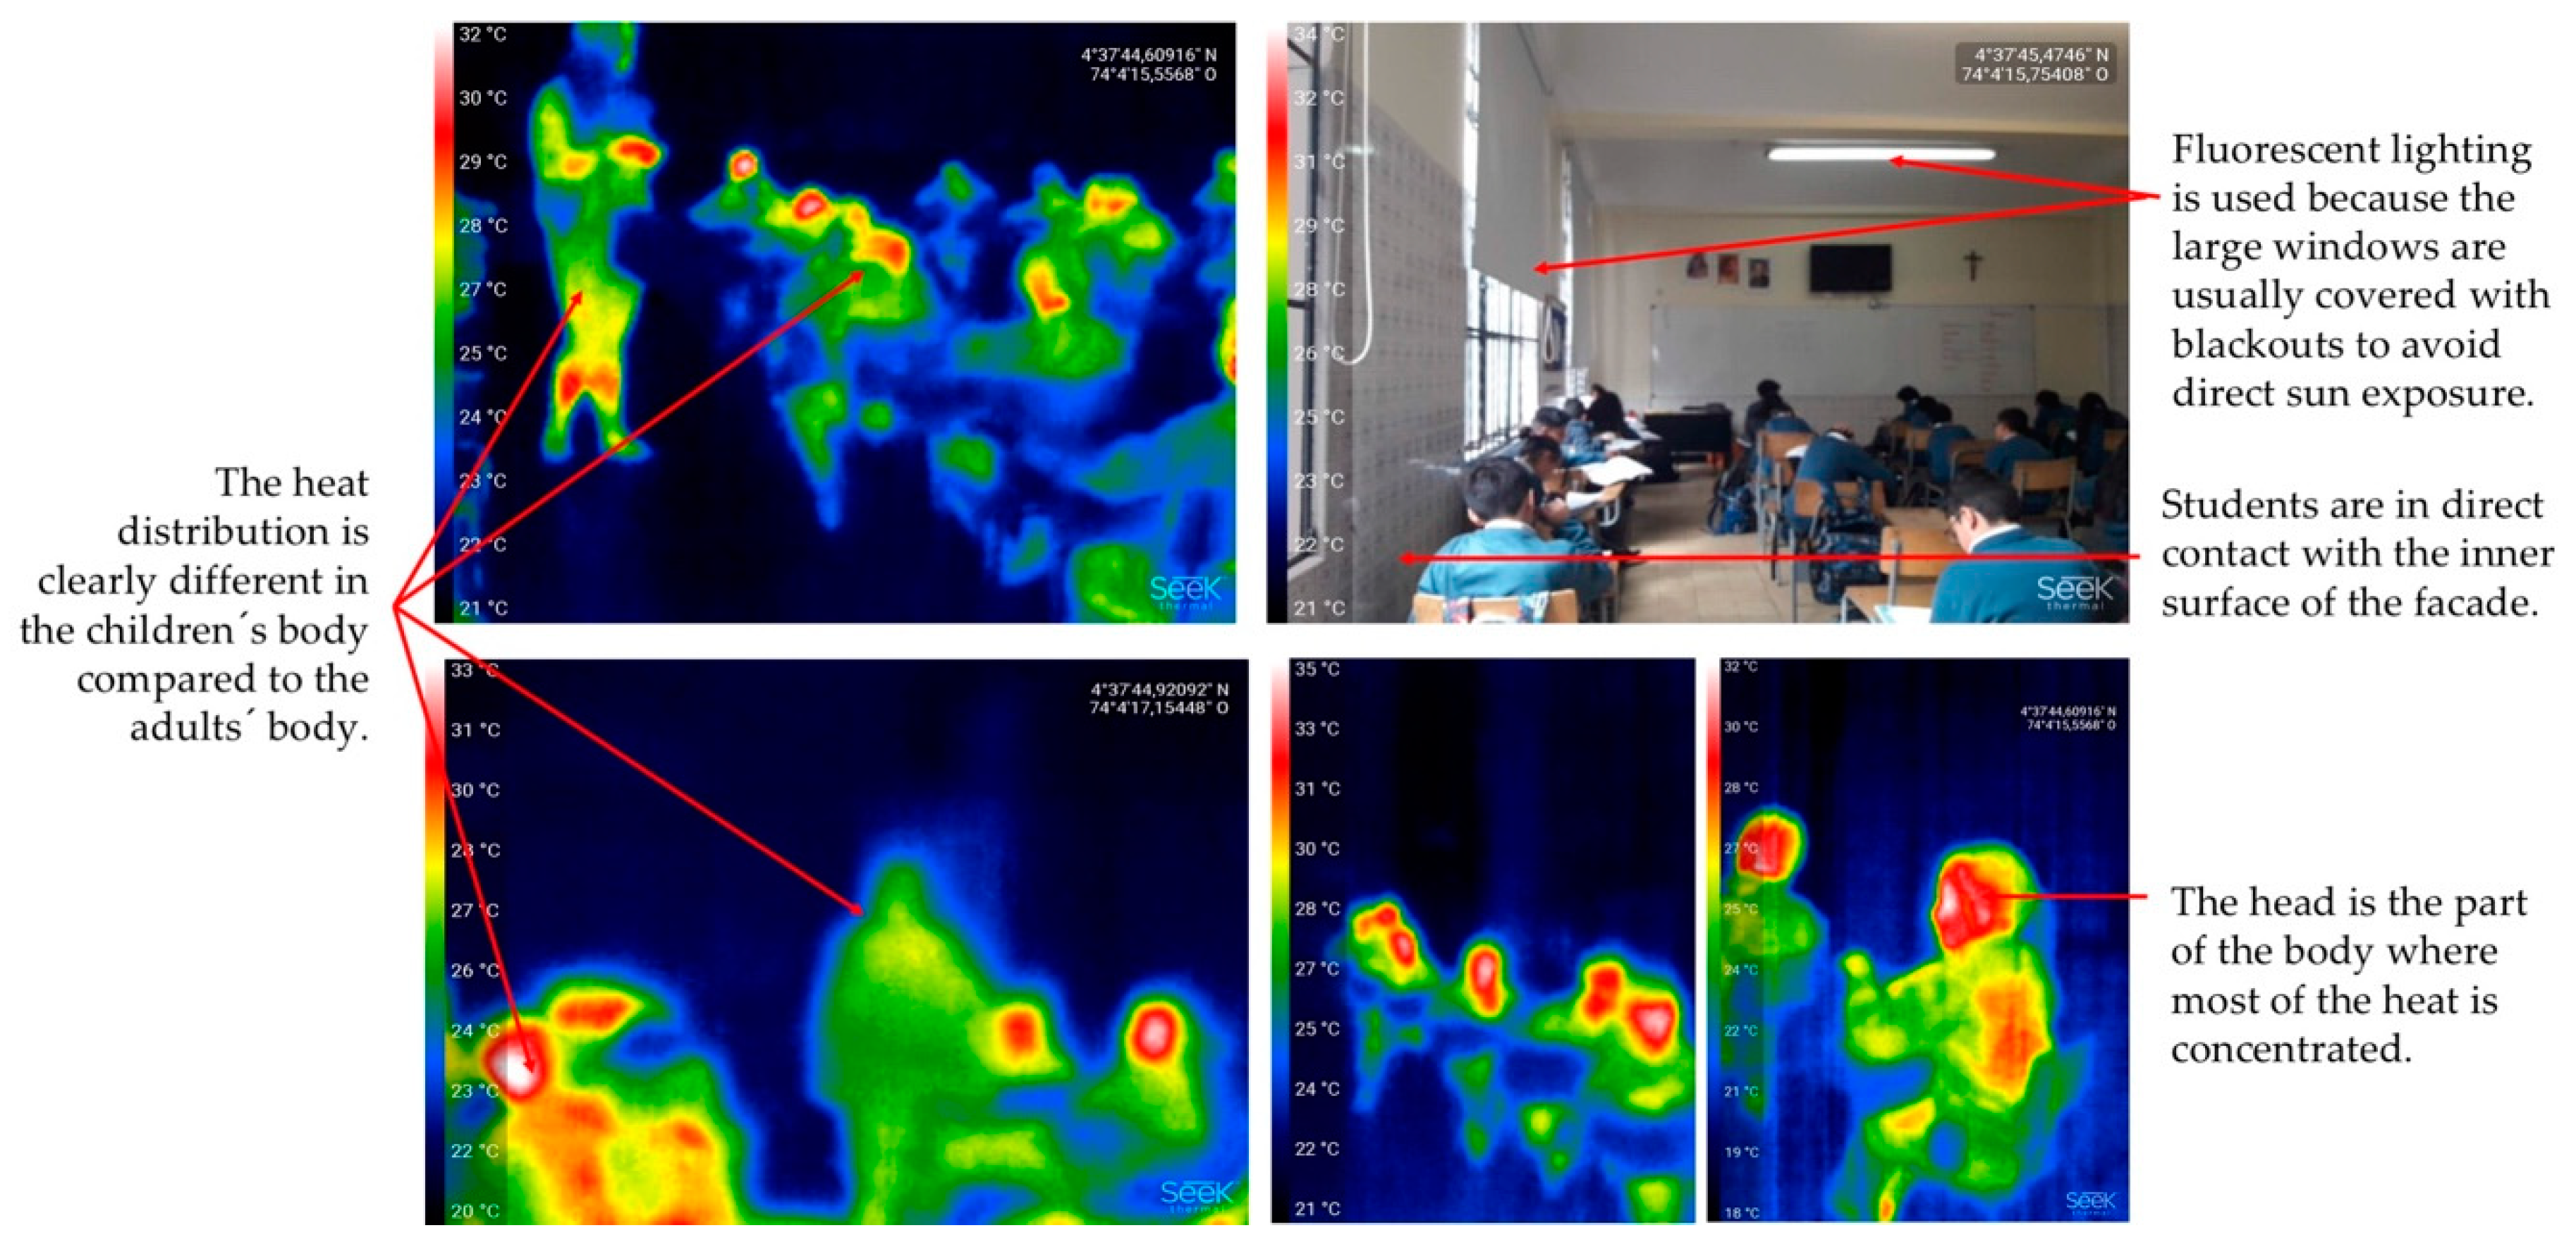
In the case of projects 3 and 4, the measurements also showed a lack of compliance with the standards; however, in the surveys, the satisfaction levels were significantly higher compared to projects 1 and 2. It was found that the occupants surveyed in the housing projects (mainly adults) tended to perceive the environment as being much colder than the occupants surveyed in the school projects (mainly children). The observations recorded in the logbooks, the analysis of the audio-visual material, and the discussions in the focus groups were crucial to understanding comfort levels in projects 3 and 4. For example, the thermographic photographs helped to visualise differences between heat distribution in the adults’ bodies compared to the children’s bodies (Figure 10). The face is the part with the highest concentration of thermoreceptors in the human body [44]; therefore, the measurements were taken at average face height for children in standing and seated conditions, and not at the height recommended by the standards (based on adults). Additional measurements were made at other heights and locations to study stratification, asymmetries, and drafts within the space.

5. Discussion and Conclusions

Data from post-occupancy studies in real constructions have been instrumental in the development of the existing thermal comfort standards. However, the limitations mentioned in this manuscript are considered to be a major flaw in the current pursuit to create universal standards, as they restrict the ability to compare and cross-reference data on a high number of variables. This is supported by the growing academic evidence of the unsuitability of these standards in different contexts. This work highlights that, in the case of Colombia, the use of the ASHRAE Standard 55 and the static and adaptive models alone is insufficient to understand the real thermal comfort conditions of buildings. The conflictive results obtained when using both models to analyse the same space can confuse and mislead designers and building managers.
It is argued here that the most fitting benchmarks are those developed at national or regional level using local data. However, the lack of guidance in data collection tools and procedures requires particular attention. The current models focus on a minimal number of variables, which tends to oversimplify the assessment criteria ignoring important formal and functional aspects of the architecture. There is a lack of clear parameters for data collection regarding many, physical, physiological, phycological and social variables that affect thermal comfort. These are considered essential to create more robust and comprehensive fieldwork records from a broader spectrum of tropical geographies, climates, architectural characteristics and occupancies.
Fieldwork and post-occupancy studies usually are costly, time-consuming and require considerable administrative and academic efforts. Therefore, it is crucial to systematise current practices and joint forces with the aim of better-using research results to improve the means of evaluation and the development of policy. It is suggested here that the first governmental efforts should concentrate on testing, developing and standardising alternative tools, such as those presented in this manuscript, which could be employed to gather more information from existing buildings. Developing a “microzonation” system (comparable to seismic microzonation) could help to customise tools for regions that share similar social, cultural, economic or climatic variables that affect occupant’s comfort and satisfaction. Additionally, different alternatives must be considered according to the occupant’s characteristics and building use.
A second stage would be to support and promote further fieldwork studies in a wide variety of settings using the above criteria. This can be followed by an effort to collect, classify and cross-reference information from existing studies in tropical regions and group them accordingly. These types of independent standardised databases need to be the foundation for the establishment and refinement of assessment benchmarks and relevant policy. It has been proven that generalisations and literal applications of the current framework can lead to erroneous assumptions of thermal discomfort, the over-cooling or over-heating of buildings or the implementation of mechanical conditioning instead of passive solutions. Therefore, this is a critical aspect to address not only from a technical but also from an ethical perspective, as the tropics become more populated and urbanised and energy demands for indoor thermal comfort continue to grow.

Author Contributions

conceptualisation, C.R., M.C., M.D. and J.M.; methodology, C.R., M.C and J.M; validation, C.R., M.C., M.D. and J.M.; formal analysis, C.R., M.C and J.M.; investigation, C.R., M.C., M.D. and J.M.; resources, C.R., M.C., M.D. and J.M.; data curation, C.R., M.C. and M.D.; writing—original draft preparation, C.R.; writing—review and editing, C.R.; visualisation, C.R., M.C. and M.D.; supervision, C.R. and J.M project administration, C.R. and J.M; Software M.C. and M.D; funding acquisition, C.R., M.C. and J.M.

Funding

This research received no external funding.

Acknowledgments

This work is independent research with the support of two academic institutions. It did not receive any specific grant from funding agencies or commercial bodies. The authors would like to acknowledge the assistance from numerous colleagues, students and research assistants in the development of this work. Special thanks to all the people who participated in the case studies and the editing of this article.

Conflicts of Interest

The authors declare no conflict of interest.

References

  1. Edelman, A.; Gelding, A.; Elena McComiskie, R.K.; Penny, A.; Roberts, N.; Templeman, S.; Trewin, D.; Ziembicki, M.; Trewin, B.; Cortlet, R.; et al. State of the Tropics: 2014 Report. Available online: https://www.jcu.edu.au/state-of-the-tropics/publications/2014/2014-report/State-of-the-Tropics-2014-Full-Report.pdf (accessed on 21 March 2019).
  2. General Assembly of the United Nations. Report of the World Commission on Environment and Development: Our Common Future. Available online: https://sustainabledevelopment.un.org/content/documents/5987our-common-future.pdf (accessed on 21 March 2019).
  3. Riechmann, J. Desarrollo sostenible: La lucha por la interpretación. De la Econ. a la Ecologia 1995, 5, 1–20. [Google Scholar]
  4. Winner, L. The Whale and the Reactor: A Search for Limits in an Age of High Technology; University of Chicago Press: Chicago, IL, USA, 1988; ISBN 978-84-7432-280-4. [Google Scholar]
  5. Sivak, M. Potential energy demand for cooling in the 50 largest metropolitan areas of the world: Implications for developing countries. Energy Policy 2009, 37, 1382–1384. [Google Scholar] [CrossRef]
  6. Davis, L.W.; Gertler, P.J. Contribution of air conditioning adoption to future energy use under global warming. Proc. Natl. Acad. Sci. USA 2015, 112, 5962–5967. [Google Scholar] [CrossRef] [PubMed] [Green Version]
  7. The Japan Refrigeration and Air Conditioning Industry Association. World Air Conditioner Demand by Region. 2017. Available online: https://www.jraia.or.jp/english/World_AC_Demand.pdf (accessed on 23 March 2019).
  8. Yang, L.; Yan, H.; Lam, J.C. Thermal comfort and building energy consumption implications—A review. Appl. Energy 2014, 115, 164–173. [Google Scholar] [CrossRef]
  9. Yau, Y.H.; Hasbi, S. A review of climate change impacts on commercial buildings and their technical services in the tropics. Renew. Sustain. Energy Rev. 2013, 18, 430–441. [Google Scholar] [CrossRef]
  10. Zhao, H.X.; Magoulès, F. A review on the prediction of building energy consumption. Renew. Sustain. Energy Rev. 2012, 16, 3586–3592. [Google Scholar] [CrossRef]
  11. Pérez-Lombard, L.; Ortiz, J.; Pout, C. A review on buildings energy consumption. Energy Build. 2008, 40, 394–398. [Google Scholar] [CrossRef]
  12. Samson, J.; Berteaux, D.; Mcgill, B.J.; Humphries, M.M. Geographic disparities and moral hazards in the predicted impacts of climate change on human populations. Glob. Ecol. Biogeogr. 2011, 20, 532–544. [Google Scholar] [CrossRef]
  13. United Nations. Revision of World Population Prospects 2017. Available online: https://population.un.org/wpp/ (accessed on 23 March 2019).
  14. DANE, Departamento Administrativo Nacional de Estadistica. Resultados Preliminares del Censo Nacional de Población y Vivienda 2018. Available online: https://www.dane.gov.co/index.php/estadisticas-por-tema/demografia-y-poblacion/censo-nacional-de-poblacion-y-vivenda-2018 (accessed on 28 June 2019).
  15. Rodriguez, C.M.; D’alessandro, M. Climate and Context Adaptive Building Skins for Tropical Climates: A review centred on the context of Colombia. In Proceedings of the Conference: Advanced Building Skins, Bressanone, Italy, 28–29 October 2014. [Google Scholar]
  16. Secretaría Distrital de Ambiente. Resolucion 5926 de 2011; Secretaría Distrital de Ambiente: Cundinamarca, Colombia, 2011.
  17. Minvivienda. Resolucion No 0549; Minvivienda: Bogotá, Colombia, 2015.
  18. Olesen, B.W. International standards for the indoor environment. Indoor Air Suppl. 2004, 14, 18–26. [Google Scholar] [CrossRef]
  19. Fanger, P.O. Thermal Comfort; Danish Technical Press: Copenhagen, Denmark, 1970. [Google Scholar]
  20. De Dear, R.; Brager, G.; Cooper, D. Developing an adaptive model of thermal comfort and preference. ASHRAE Trans. 1997, 104, 1–18. [Google Scholar]
  21. Rupp, R.F.; Ghisi, E. What is the most adequate method to assess thermal comfort in hybrid commercial buildings located in hot-humid summer climate? Renew. Sustain. Energy Rev. 2014, 29, 449–462. [Google Scholar] [CrossRef]
  22. Kwong, Q.J.; Adam, N.M.; Sahari, B.B. Thermal comfort assessment and potential for energy efficiency enhancement in modern tropical buildings: A review. Energy Build. 2014, 68, 547–557. [Google Scholar] [CrossRef]
  23. Zain, Z.M.; Taib, M.N.; Baki, S.M.S. Hot and humid climate: Prospect for thermal comfort in residential building. Desalination 2007, 209, 261–268. [Google Scholar] [CrossRef]
  24. Karyono, T.H. Thermal Comfort in the Tropical South East Asia Region. Archit. Sci. Rev. 1996, 39, 135–139. [Google Scholar] [CrossRef]
  25. Zomorodian, Z.S.; Tahsildoost, M.; Hafezi, M. Thermal comfort in educational buildings: A review article. Renew. Sustain. Energy Rev. 2016, 59, 895–906. [Google Scholar] [CrossRef]
  26. Karjalainen, S. Thermal comfort and gender: A literature review. Indoor Air 2012, 22, 96–109. [Google Scholar] [CrossRef] [PubMed]
  27. Toe, D.H.C.; Kubota, T. Development of an adaptive thermal comfort equation for naturally ventilated buildings in hot-humid climates using ASHRAE RP-884 database. Front. Archit. Res. 2013, 2, 278–291. [Google Scholar] [CrossRef]
  28. Mishra, A.K.; Ramgopal, M. An adaptive thermal comfort model for the tropical climatic regions of India (Köppen climate type A). Build. Environ. 2015, 85, 134–143. [Google Scholar] [CrossRef]
  29. Oropeza-Perez, I.; Petzold-Rodriguez, A.H.; Bonilla-Lopez, C. Adaptive thermal comfort in the main Mexican climate conditions with and without passive cooling. Energy Build. 2017, 145, 251–258. [Google Scholar] [CrossRef]
  30. Cândido, C.; Lamberts, R.; de Dear, R.; Bittencourt, L.; de Vecchi, R. Towards a Brazilian standard for naturally ventilated buildings: Guidelines for thermal and air movement acceptability. Build. Res. Inf. 2011, 39, 145–153. [Google Scholar] [CrossRef]
  31. Yan, H.; Mao, Y.; Yang, L. Thermal adaptive models in the residential buildings in different climate zones of Eastern China. Energy Build. 2017, 141, 28–38. [Google Scholar] [CrossRef]
  32. Indraganti, M.; Ooka, R.; Rijal, H.B.; Brager, G.S. Adaptive model of thermal comfort for offices in hot and humid climates of India. Build. Environ. 2014, 74, 39–53. [Google Scholar] [CrossRef]
  33. Földváry Ličina, V.; Cheung, T.; Zhang, H.; de Dear, R.; Parkinson, T.; Arens, E.; Chun, C.; Schiavon, S.; Luo, M.; Brager, G.; et al. Development of the ASHRAE Global Thermal Comfort Database II. Build. Environ. 2018, 142, 502–512. [Google Scholar] [CrossRef] [Green Version]
  34. Roaf, S.; Nicol, F.; Humphreys, M.; Tuohy, P.; Boerstra, A. Twentieth century standards for thermal comfort: Promoting high energy buildings. Archit. Sci. Rev. 2010, 53, 65–77. [Google Scholar] [CrossRef]
  35. Merkel, A. Climate-Data.org. 2012. Available online: https://en.climate-data.org/ (accessed on 25 March 2019).
  36. ANSI/ASHRAE. ANSI/ASHRAE 55:2013 Thermal Environmental Conditions for Human Occupancy; ANSI/ASHRAE: New York, NY, USA, 2013. [Google Scholar]
  37. Shin, J.H. Toward a theory of environmental satisfaction and human comfort: A process-oriented and contextually sensitive theoretical framework. J. Environ. Psychol. 2016, 45, 11–21. [Google Scholar] [CrossRef]
  38. Rodriguez, C.; Medina, J.; Pinzon, A. Thermal Comfort and Satisfaction in the Context of Social Housing: Case Study in Bogotá, Colombia—Early view ©. J. Constr. Dev. Ctries 2019, 24, 1–25. [Google Scholar]
  39. ANSI/ASHRAE. ANSI/ASHRAE Standard 55-2017: Thermal Environmental Conditions for Human Occupancy; ANSI/ASHRAE: New York, NY, USA, 2017. [Google Scholar]
  40. Voiland, A. Why so many global temperature records? NASA Earth Obs. 2015. Available online: https://earthobservatory.nasa.gov/blogs/earthmatters/2015/01/21/why-so-many-global-temperature-records/ (accessed on 25 March 2019).
  41. Perini, K.; Magliocco, A. Effects of vegetation, urban density, building height, and atmospheric conditions on local temperatures and thermal comfort. Urban For. Urban Green. 2014, 13, 495–506. [Google Scholar] [CrossRef]
  42. Hoyt, T.; Schiavon, S.; Piccioli, A.; Cheung, T.; Moon, D.; Steinfeld, K. CBE Thermal Comfort Tool. Available online: http://comfort.cbe.berkeley.edu/ (accessed on 25 January 2019).
  43. Hong, S.H.; Gilbertson, J.; Oreszczyn, T.; Green, G.; Ridley, I. A field study of thermal comfort in low-income dwellings in England before and after energy efficient refurbishment. Build. Environ. 2009, 44. [Google Scholar] [CrossRef]
  44. Romanovsky, A.A. Skin temperature: Its role in thermoregulation. Acta Physiol. 2014. [CrossRef]
Figure 1. Air conditioning consumption in million units between 2011 and 2016, based on [7]. Vulnerability to climate change, based on [12].
Sustainability 11 04180 g001
Figure 2. Map of climatic zones in Colombia, according to the Köppen–Geiger classification.
Sustainability 11 04180 g002
Figure 3. ASHRAE (American Society of Heating Engineers, Refrigeration and Air Conditioning) databases (I + II) according to projects location and climate, based on information from [20,33,35].
Sustainability 11 04180 g003
Figure 4. Pictures of the fieldwork projects.
Sustainability 11 04180 g004
Figure 5. Examples of alternative data-collection tools used.
Sustainability 11 04180 g005
Figure 6. Limitations encountered during fieldwork.
Sustainability 11 04180 g006
Figure 7. Example of conflictive results with the static and the adaptive models. (A,B) Dry-bulb temperature-relative humidity charts based on the CBE tool [42] for the static model (PMV) for (A): apartments according to orientation and (B): apartments according to vertical position. (C,D) Operative temperature - prevailing mean outdoor temperature charts based on the CBE tool [42] for the adaptive model for (C): apartments according to orientation and (D): apartments according to vertical position.
Sustainability 11 04180 g007
Figure 8. Example of data analysis based on a theory of environmental satisfaction [37]. Information collected from project 1.
Sustainability 11 04180 g008
Figure 9. Dynamic thermal simulations with EnergyPlus™ developed to study four retrofit scenarios in project 1.
Sustainability 11 04180 g009
Figure 10. Examples of thermographic and regular photographs used for thermal comfort analysis in projects 3 and 4.
Sustainability 11 04180 g010
Table 1. General information from the fieldwork projects.
Apartment BuildingsSchool Buildings
Project OneProject TwoProject ThreeProject Four
STUDYYear of study2015–2016201720182018
Studied sample (units)4428128
Studied occupants4428166168
BUILDING CHARACTERISTICSYear of construction20141987The 1940sThe 1960s
No. storeys6741
Ceiling height (m)2.32.33.73
Total Nº of units (apartments or classrooms)4562273729
Total occupants (approx.)13686811172669
Occupants per unit (avg.)333251
Average unit size (m2)706362.572
CONSTRUCTION DETAILSBuilding typeBlockCourtyardCourtyardBlock
Wall constructionConcrete wall structure with a single-leaf brick wall facade, with no thermal insulationConcrete and masonry wall structure with a single-leaf brick wall facade, with no thermal insulationConcrete and masonry wall structure with a single-leaf brick wall facade with a stone finish or a double-leaf brick wall facade, both without thermal insulationConcrete and masonry wall structure with a single-leaf brick wall facade, with no thermal insulation
Wall thickness (m)0.130.250.35–0.50.25
WindowsSingle-glassed aluminium-frame, featuring fixed top grills for ventilation. 4 mm glass.Single-glassed aluminium-frame. 4–6 mm glass.Single-glassed
iron-frame, operable windows.4 mm glass.
Single-glassed aluminium-frame, featuring top small operable panes for ventilation.
5 mm glass.
Table 2. Indoor environmental parameters.
Used in Assessment ModelsRecommended Equipment Criteria ASHRAE 55Equipment Used During the Case Study Projects
ParameterStaticAdaptiveRangeAccuracyInstrument-ToolRangeAccuracy
Dry-bulb air temperature (℃)xx10 to 40 °C (50 to 104 °F)±0.2 °C (0.4 °F)Multi-channel Data Logger HOBO U12-012−20 to 70 °C (−4 to 158 °F)± 0.35 °C from 0 to 50 °C (± 0.63 °F from 32 to 122 °F)
Relative humidity (%)x 25% to 95% rh±5% rh5% to 95%± 2.5% rh from 10% to 90%, up to a maximum of ± 3.5% rh including hysteresis at 25 °C (77 °F); below 10% and above 90% ± 5% rh.
Globe temperature (°C)xx Black globe thermometer Ø 150 mm10–40 °C±1 °C
Heat Index WBGT Meter Data Logger0 to 59 °C (32.0 to 138 °F)±1 °C
Mean radiant temperature (°C)xx10 to 40 °C (50 to 104 °F)±1 °C (2 °F)Derived from dry-bulb air temperature, globe temperature and airspeed
Operative temperature (°C)xx Derived from dry-bulb air temperature, mean radiant temperature and airspeed
Air speed (m/s)xx0.05 to 2 m/s (10 to 400 fpm)±0.05 m/s (±10 fpm)T-DCI-F900-SO air velocity sensor0.15 to 10 m/s (30 to 1969 fpm)+/−0.05 m/s
Plane radiant temperature (°C) 0 to 50 °C (32 to 122 °F)±0.5 °C (1 °F)Not measured
Surface temperature (°C) 0 to 50 °C (32 to 122 °F)±1 °C (2 °F)Not measured
Directional radiation (W/m2) −35 to +35 W/m2 (−11 to +11 Btu/h·ft2)±5 W/m2 (±1.6 Btu/h·ft2)Not measured
Table 3. Survey sample questions suggested by the ASHRAE Standard 55 and their limitations.
Aspect to EvaluateSample QuestionLimitations
Location of the space and the occupantPlace an “X” in the appropriate place where you spend most of your time (option of a map or a list of locations).The answers for these questions tend to be very similar between the occupants of the same space. They experience comparable outdoor conditions, are normally dressed in equivalent clothing ensembles and the activity levels recorded are usually the same (light activity or seated answering the survey).
The individualization of these questions did not report any substantial advantage regarding the general assessment of thermal comfort. In contrast, the time it took the occupants to answer these questions was considered a disadvantage.
On which floor of the building is the space located?
Are you near an exterior wall?
Are you near a window?
Approximate outdoor conditionsRecord the approximate outside-air temperature and seasonal conditions: (space to indicate temperature and a list of seasons).
Clothing insulation (clo)Using the list below, please check each item of clothing that you are wearing right now (list of garments).
ActivityWhat is your activity level right now? (List of options such as reclining, seated, standing relaxed, light activity, medium activity, high activity).
BehaviourWhich of the following do you personally adjust in your space? (List of building components such as windows, heaters and thermostats).This question was helpful to evaluate behaviour. However, it only contemplates environmental modifications to space and no other types of adaptive behaviour.
SensationWhat is your general thermal sensation? (7-point scale by the ASHRAE standard 55 going from −3 to +3: hot, warm, slightly warm, neutral, slightly cool, cool, cold).The meaning of terms such as slightly or neutral was found to be different amongst occupants, especially when translated to Spanish. In some cases, neutral was linked to an attitude and was understood as thermal sensation being irrelevant.
SatisfactionHow satisfied are you with the temperature in your space? (From very satisfied to very dissatisfied).Dissatisfaction with temperature is very often linked to discontent with other aspects of the space (e.g., ventilation, luminosity, humidity and noise). These are not considered in the recommended surveys.
If you are dissatisfied with the temperature in your space, which of the following contribute to your dissatisfaction: (list of options depending on the local climate).
Source of discomfortHow would you best describe the source of this discomfort? (List of options related to levels of humidity, air movement, sun exposure, drafts, operation of windows, conditioning systems and surrounding surfaces).These questions were helpful to study perception. However, they only evaluate discomfort with temperature, overlooking other influential beliefs and expectations which play an important role when evaluating comfort.
Please describe any other issues related to being too hot or too cold in your space?
Table 4. Alternative data-collection tools used during the projects of the case study.
ToolAspect to EvaluatePurpose-OutcomeSample Questions/Information
SURVEYS

Seven different surveys were designed according to the occupant’s characteristics (two for projects 1 and 2 and five for projects 3 and 4).

All surveys were designed with the same structure to study seven different aspects.

The language, graphics and complexity of the questions were adjusted to suit the occupants in each project.
Personal informationInformation used to cross-reference different aspects against personal variables.Blanks to fill in with information such as age, weight, height, gender and general health. (Optional section).
EvaluationTo evaluate the sensation of comfort and satisfaction regarding temperature, humidity, air movement and lighting.
  • How do you describe the climate of the room AT THIS TIME? (Scale of options for each aspect).
  • AT THIS TIME, how does the climate in this room make you feel? (Scale of options).
PerceptionTo evaluate causality, conduciveness and emotional response.
To identify aspects that help or hinder the goal.
  • What elements do you believe affect your comfort the most?
  • If you feel UNCOMFORTABLE with the climate of this room, what happens?
  • The climate of THIS ROOM makes you feel: (range of emotions such as angry, sad or happy).
PreferenceTo study the sense of value and expectation.
  • What do you like the MOST and the LEAST about the climate of this room?
Adaptive strategiesTo study adaptive behaviour in four different aspects, according to [37]:
  • Environmental modifications to space.
  • Behavioural adaptations.
  • Expectation adjustment.
  • Withdraw from space.
  • When you are UNCOMFORTABLE with the indoor climate, what DO YOU DO TO FEEL BETTER? (Range of options for each aspect).
  • If you could CHANGE or ADD something in THIS ROOM to feel more comfortable, WHAT WOULD YOU CHANGE or ADD?
  • How much would you be willing to pay to improve the current conditions? (If applicable)
Physical-cognitive contextTo establish points of reference and emotional response.
  • Compared to this room, YOUR HOUSE is: (range of comparatives in terms of indoor climate).
  • The climate of YOUR HOUSE makes you feel: (range of emotions).
  • Draw, with different colours, a room or place where you feel VERY COMFORTABLE with the climate and draw yourself inside that place.
Social contextTo evaluate perceived control and agency and social or cultural preconceptions.
  • IN THIS ROOM, who does things to improve the climate within the space?
  • In your opinion, HEATING is: (options related to price, environmental credentials, perception of wealth and necessity).
LOGBOOK
A template was designed using architectural drawings of the studied building.
Data and observations related to construction, occupants, survey and environmental measurementsTo simplify the length of the surveys because many ordinal questions can be answered in the logbook by the observer instead of the participant.
To uncover incidental issues that can influence the study of thermal comfort or have an impact on data collection.
  • Space data (e.g., dimensions, layout, location of windows and types of climatic control).
  • Occupants data (e.g., general clothing insulation, current activity and previous activities).
  • Survey data (e.g., time, date, length and location of occupants).
  • Measurements (e.g., time, date, length and location of equipment).
FOCUS GROUP
Fifteen-minute guided discussion with groups of 5–10 participants according to age.
Preconceptions, causality, conduciveness, perceptions, adaptive strategies, agency, expectations, common believesTo obtain personal feedback in a relaxed environment.
To gain a better inside into cultural believes, common social practices, aspirations and desires.
To explore other aspects of adaptive behaviour that are difficult to evaluate through the survey.
  • What do you NEED to have the ideal climate in a room?
  • In your own words, what influences the climate in this room?
  • Do you think that the climate in this room affects your studies, health, wellbeing or feelings?
  • If you feel uncomfortable with the climate of a space, what would you do?
INTERVIEWS
One-to-one meetings with selected people in each project. (e.g., administrative staff, building managers, owners or architects).
Evaluation, satisfaction controlTo identify origins of discomfort or the stimuli behind the use of climatic conditioning.
  • In your view, is there a problem with the climate of this room? If so, what is or was the problem?
  • What motivated you to improve the conditions of this room or to use mechanical conditioning? (If applicable)
  • What results have you perceived?
AUDIO-VISUAL
AIDS
Architecture and building detailing. Formal, functional and technical aspects of the space. Occupant’s behaviourTo complement the information gathered with other tools.
To study aspects that are difficult to see with the naked eye such as heat distribution.
To obtain further statistical data regarding energy consumption and the use of recourses.
To contrast simulated scenarios against real conditions.
  • Thermographic photos.
  • Regular photos.
  • Audio recordings/phone surveys.
  • Drawings.
  • Building management databases.
  • Dynamic simulations (e.g., EnergyPlus™ coupled with DesignBuilder).
  • Charts (e.g., using the Center for the Built Environment, University of California Berkeley tools [42]).