1. Introduction
Nowadays, it is well-established that a nation’s wealth and economic growth depend on the prosperity of its industrial sector. As a consequence, manufacturing industry is constantly under strong pressure to increase its competitiveness. However, in the industrial sector, sustainability requirements are not yet considered as important as classic performance targets, such as productivity and costs [
1]. However, the market is slowly moving towards the recognition of factors linked to sustainable development [
2]. Thus, sustainability is becoming a preponderant factor for all organizations, whether public or private, for-profit or not-profit.
In addition, the growing demand from stakeholders for more comprehensive information on the operations and financial situation of companies has led some of them to include information on sustainability. This requires companies to extend their information beyond financial data. Gopalakrishnan et al. [
3] summarized the main advantages and drawbacks of moving from a philosophy of strictly financial reporting to a philosophy of sustainability.
The current sustainable production model is mainly based on the concept of Triple Bottom Line (TBL) and its three dimensions: Economic, environmental, and social. According to References [
4,
5], the economic dimension has the largest priority, at the expense of the environmental and social dimensions. Winroth et al. [
6] presented a literature review on Sustainability Indicators (SI) applied in industries and identified a total of 28 indicators. Of these indicators, 11 are related to the environmental dimension, 7 to the economic dimension, and 10 to the social dimension. On the other hand, Wan Mahmood et al. [
7] provided a systematic review of the literature on the integration of performance measurement (PM) and sustainability reporting (SR) applying content analysis. The focus of this research was to determine how the performance measurement system (PMS) supports the development of an effective sustainability report. An important challenge in the assessment of sustainability is using a single sustainable index and how to measure it [
8].
In industrial enterprises, economic sustainability tends to be understood or linked to the manufacturing sustainability. Indeed, according to the Organization for Economic Co-operation and Development (OECD) definition, sustainable manufacturing is about minimizing the various business risks inherent in any manufacturing operation while maximizing the new opportunities arising from the improvement of its processes and products [
9]. Also, the OECD defined a cycle with seven steps for establishing requirements for sustainable manufacturing [
10]. These steps were grouped into three main stages: Preparation, measurement, and improvement. The preparation stage initially involves the mapping and auditing of the impacts that companies generate on the environment and, subsequently, the definition of priorities through the correct selection of performance indicators. In the measurement stage, it is necessary to carry out the evaluation of the influence levels that the inputs and resources of the productive system generate to the environment. Finally, in the improvement stage, along with the evaluation of performance indicators, the improvement opportunities must be identified and selected. These opportunities should be implemented to close the cycle.
Thus, the practices most frequently implemented by manufacturing organizations are, for example, measuring financial key performance indicators (KPIs), monitoring and evaluating business objectives, and prioritizing investment in technology [
11]. On the other hand, the scarcity of natural resources, together with climate change, have prompted manufacturing companies to intensively increase their concern and awareness of environmental impacts [
12]. Thus, manufacturing companies have introduced so-called green practices in their operating strategies [
13], improving their eco-efficiency. In general, the development of sustainable manufacturing practices, as well as their efficiency assessment systems, is observed at three levels: Products, processes, and systems. Recently, Sellitto [
12] highlighted that green manufacturing practices not only refer to the interior of individual companies, but also extend throughout the logistics chain, integrating internal practices, such as green manufacturing and purchasing with external initiatives, like cooperation with suppliers, distributors, or customers, and reverse logistics.
More recently, Negri et al. [
14] proposed a methodology for the integrated assessment of the sustainability of the life-cycle of a product-service system in order to support continuous improvement on the part of both the manufacturer and the user. In addition, they suggest a set of indicators for the three dimensions–economic, environmental and social–aligned with the concept of service unit, based on bibliographic evidence.
Next, the challenge arises of measuring the level of manufacturing sustainability and the contribution degree to the organization’s sustainability. According to Garbie [
15], the main challenge for manufacturing companies in terms of sustainability is the modelling and measurement of performance metrics that integrate the dimensions of sustainability. Garza-Reyes [
16] proposed a repository of sustainability indicators, called the Sustainable Manufacturing Indicators Repository (SMIR), which envisages the integration and extension of 13 sets of popular sustainability indicators. Joung et al. [
17] reviewed a set of indicators and provided a categorization of indicators that are quantifiable and clearly related to sustainable manufacturing.
Recently, Viveros et al. [
18] proposed a sustainable manufacturing measurement infrastructure that allows indicators to be measured within the manufacturing environment and considers the possibility of aggregation at all levels of the organization.
In a study by Rachuri et al. [
19], Overall Equipment Efficiency (OEE) is proposed as an affordable solution for measuring sustainability. According to Esa and Yusof [
20], O.E.E. establishes a link between manufacturing activities and sustainability. Therefore, the use of OEE in manufacturing cannot be underestimated. According to Ibrahim et al. [
21], the OEE has become a major concern for modern manufacturing technology systems. However, limited empirical knowledge is available to confirm the effect of such approach on business performance and, finally, on economic sustainability. To fill this gap, the study aimed to assess the relationship between Fit Manufacturing (Lean Manufacturing, Agile Manufacturing and Sustainability) and Business Performance through the mediation of the OEE.
Wan Mahmood et al. [
7] carried out a literature review to establish the connection between the OEE and the sustainability of manufacturing. The author examined the three factors that contribute to the OEE: Availability, performance and quality, and the components of sustainable manufacturing, including environmental conservation, social efficiency, and economic improvement. Their conclusions can be used as an initial reference for manufacturers to consider the OEE to advance the goal of sustainable manufacturing.
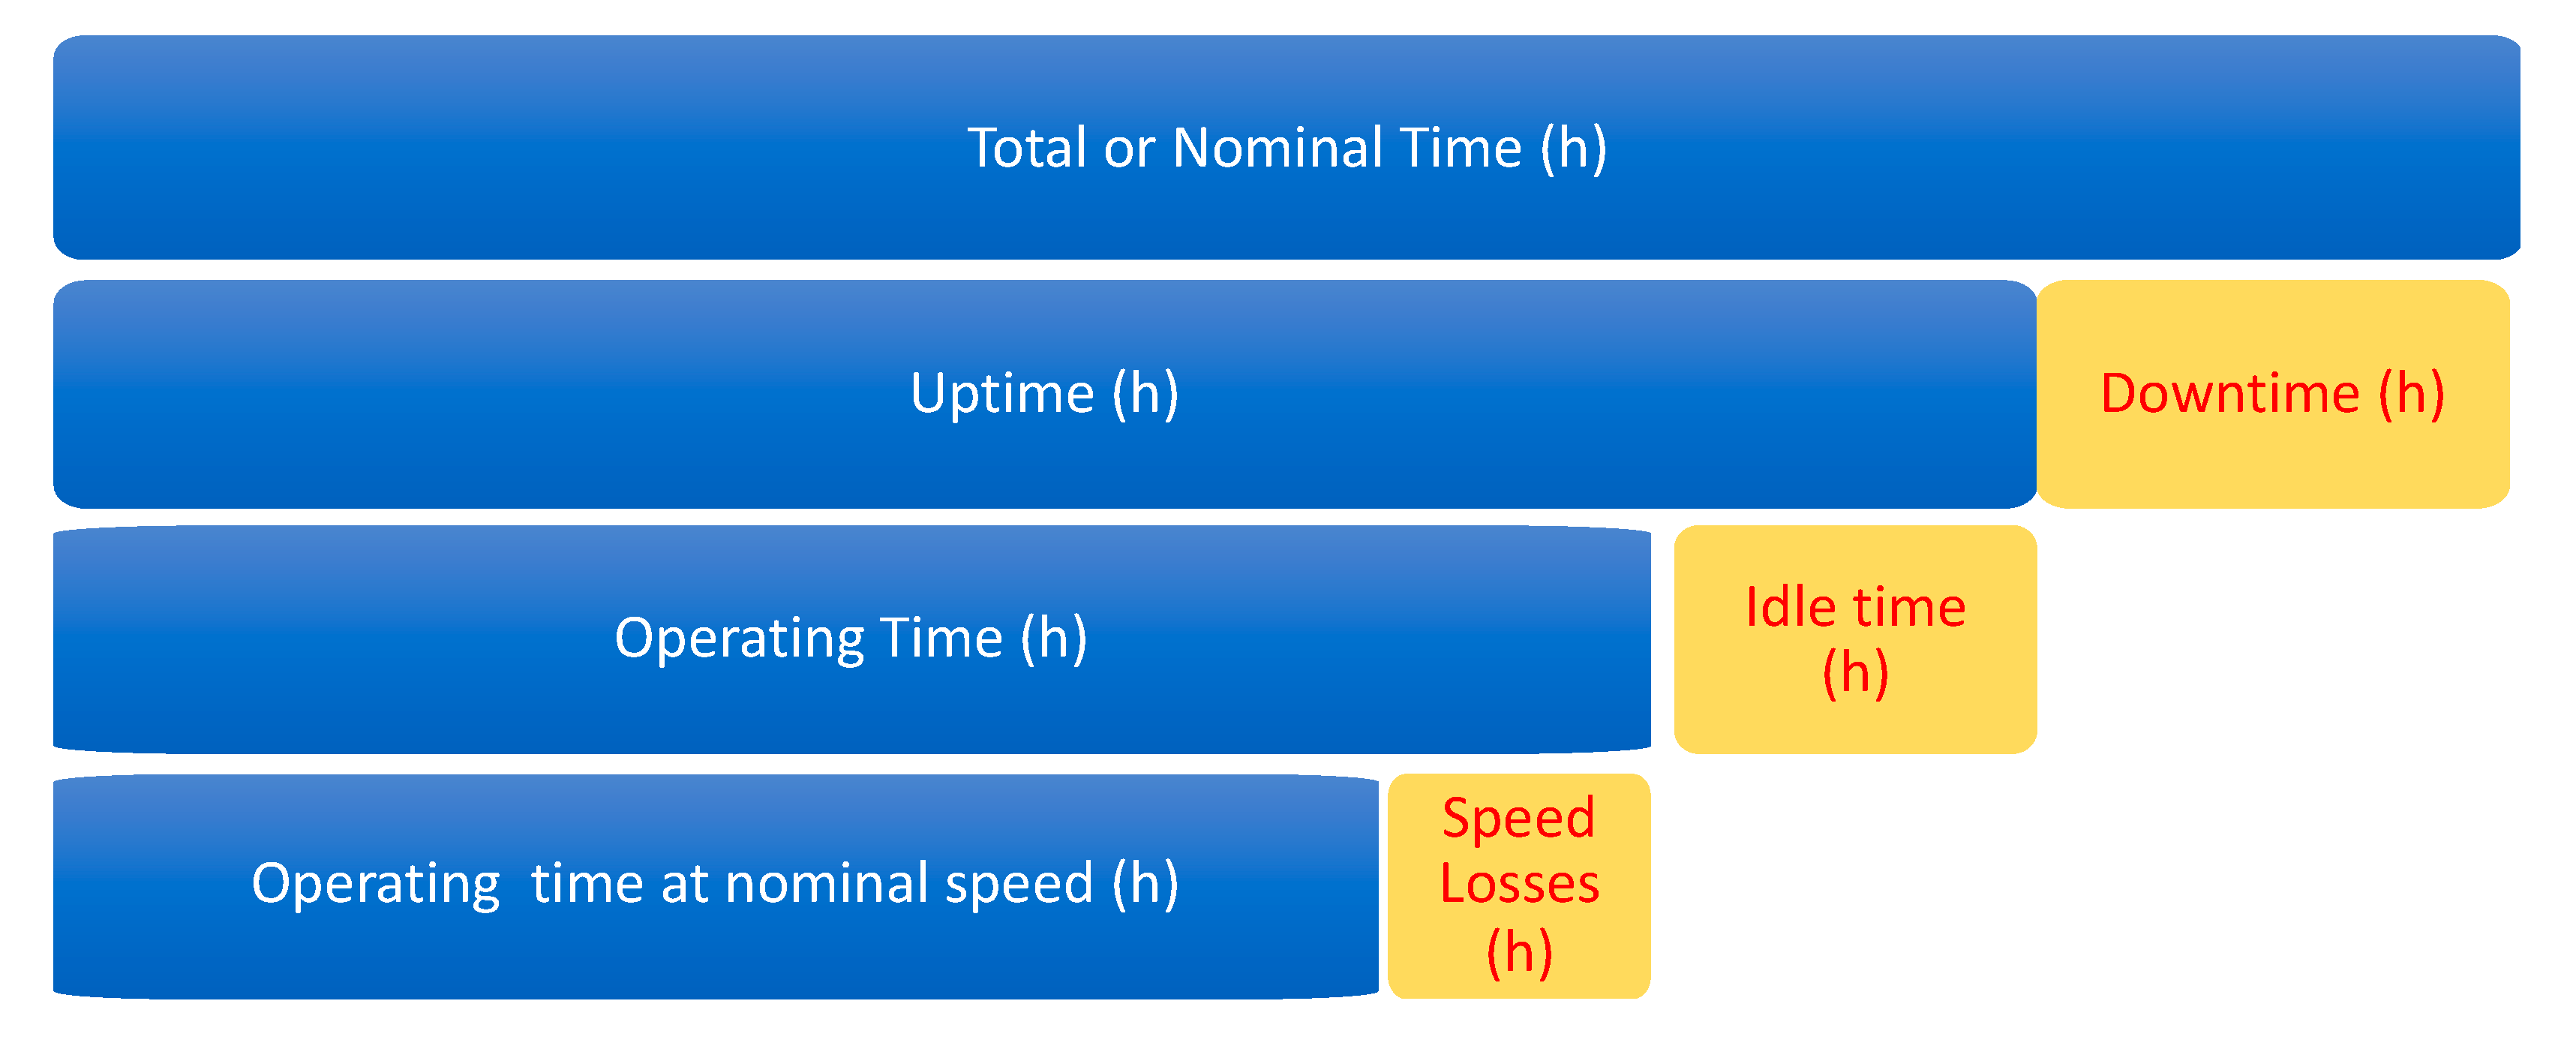
Production levels are often compromised by failures during work, which can lead to economic losses for the company [
22]. Such losses include breakdown loss, installation/adjustment loss, idle loss and minor shutdown loss, reduced speed loss, reduced yield loss, and reprocessing loss. These losses are intimately related to the maintenance and operations decisions. According to Franciosi et al. [
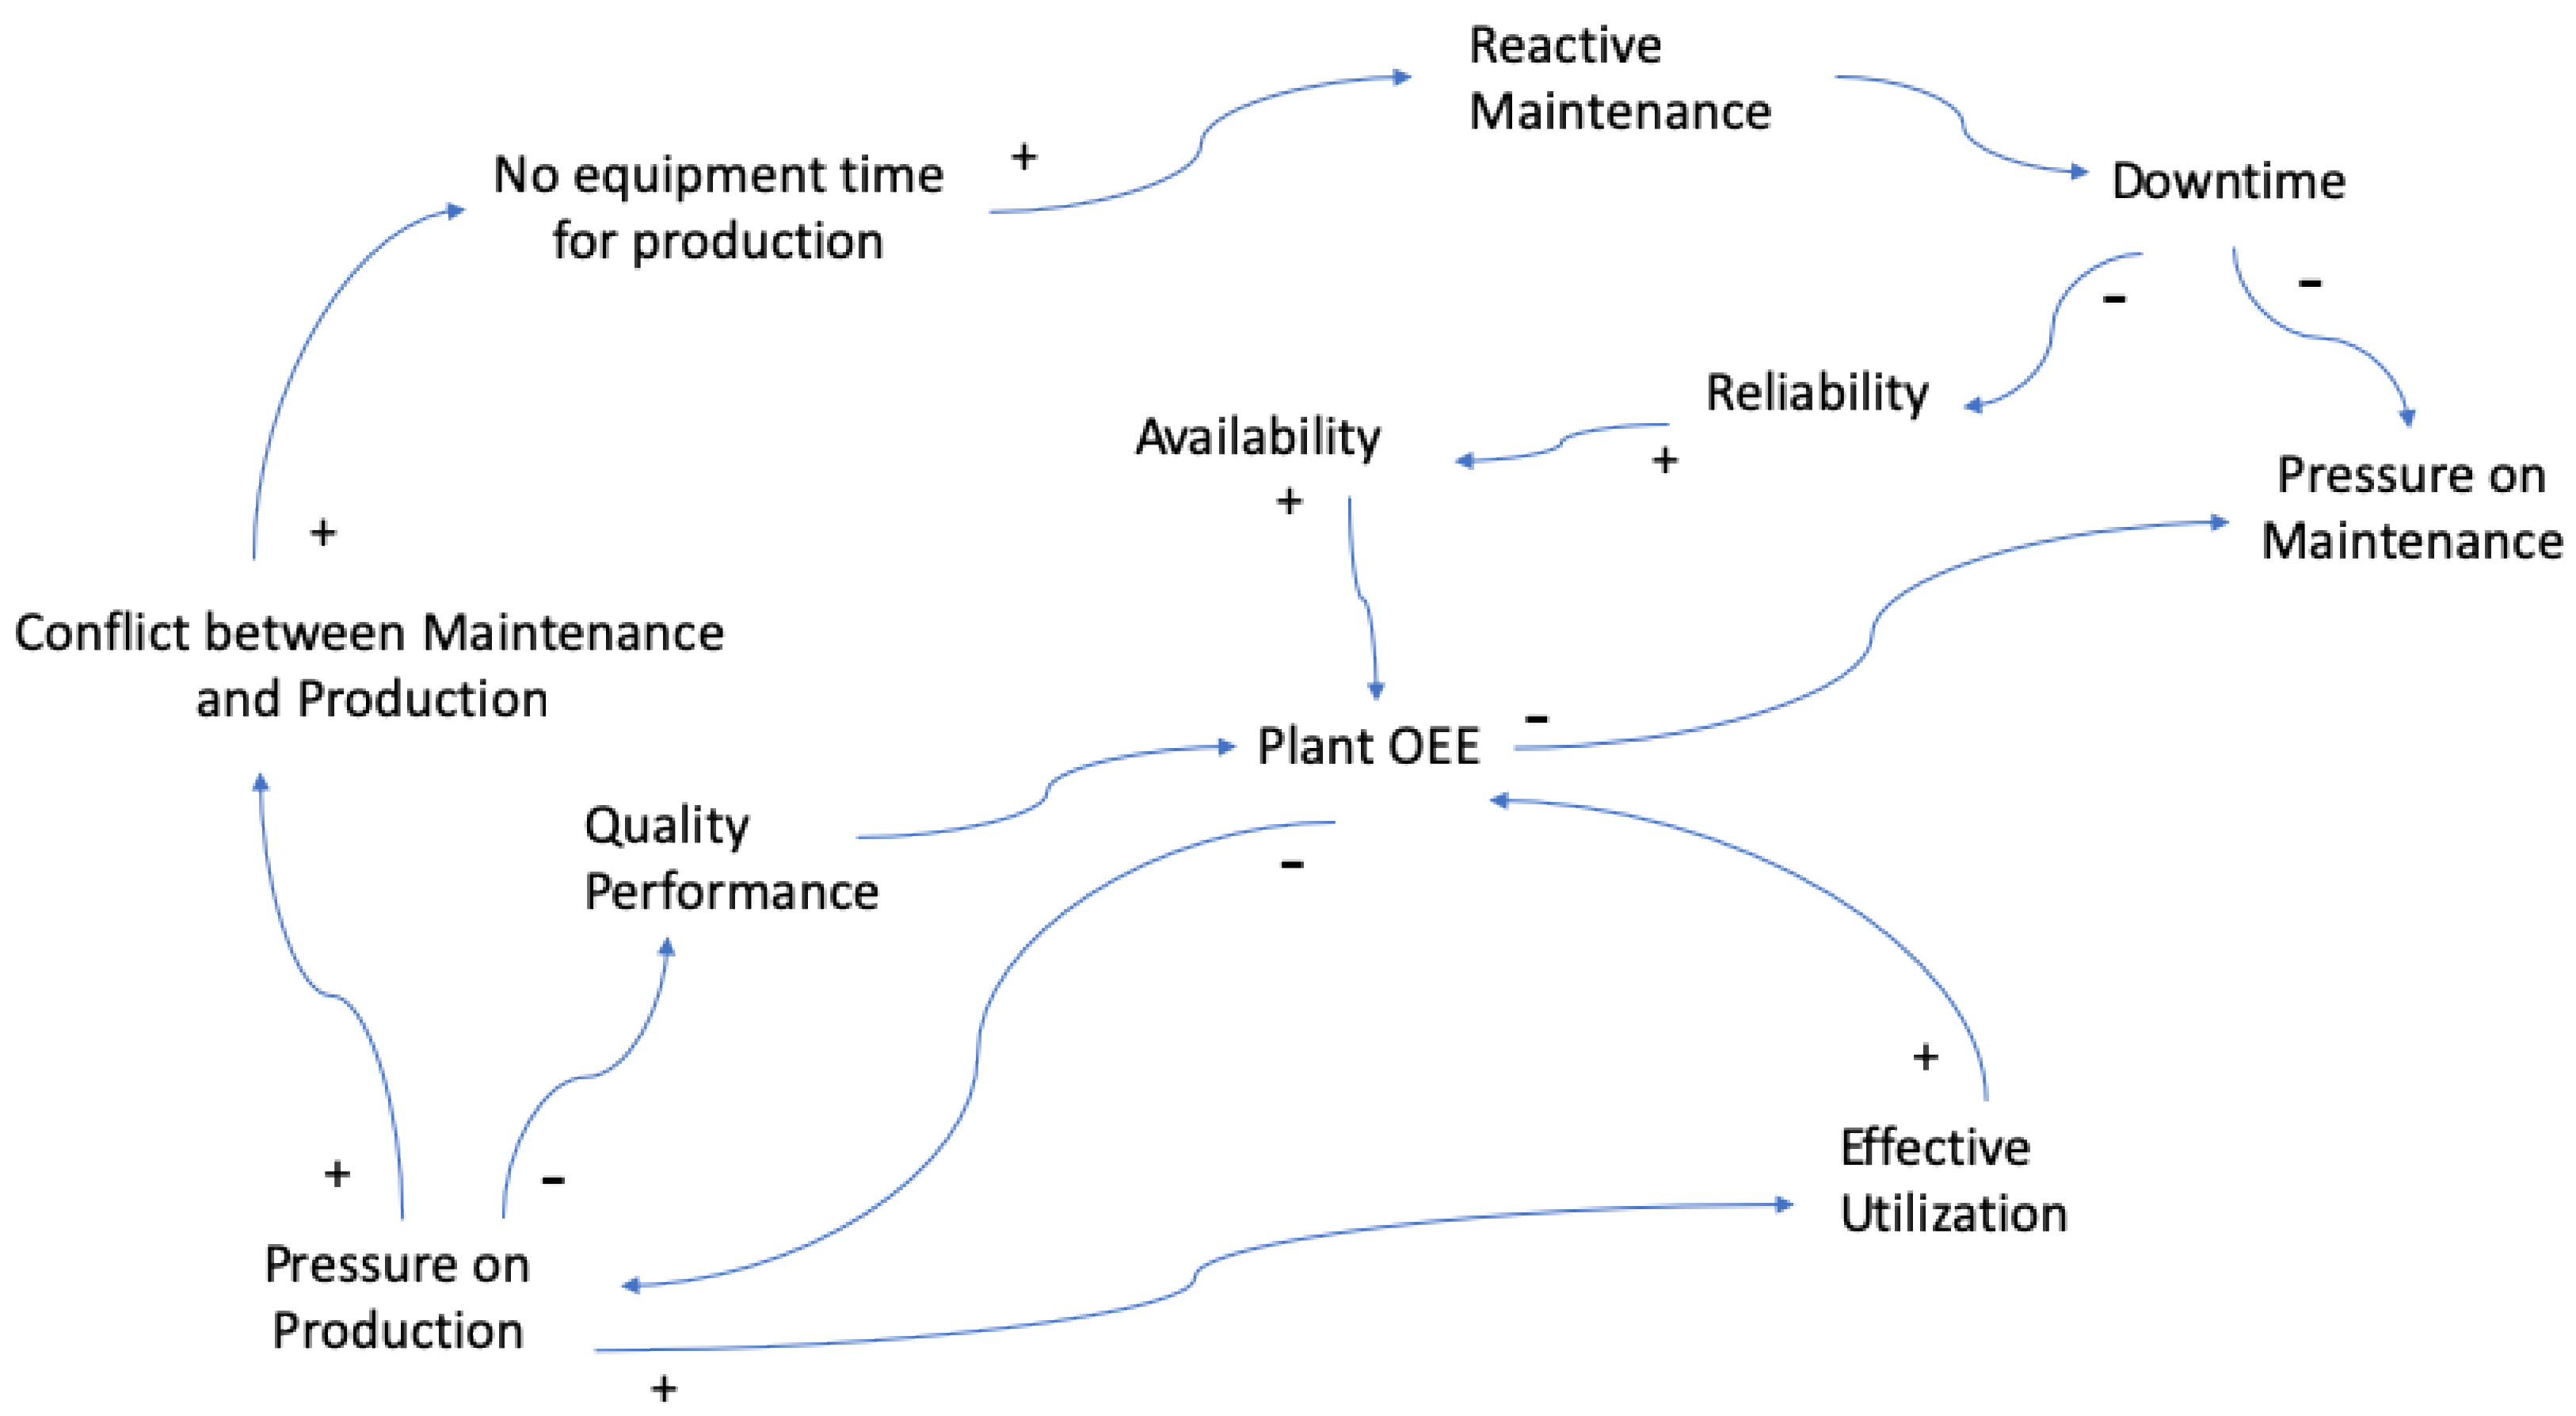
23], the maintenance process is the one that must guarantee the availability, reliability, and safety of the equipment, playing a key role for sustainable productive operations. Similarly, operational decisions should aim to reduce idleness and detentions due to lack of product, operators, or adjustments, among other reasons. Zuashkiani et al. [
24] mapped the dynamics of the OEE to improve asset management strategies using dynamic mapping of the maintenance function. These maps show, among other aspects of this dynamic, production pressure and maintenance performance, the effect of cost on the delay of long-term investments, and conflicts between maintenance and production. Based on these diagrams, we proposed a simplified one that summarizes the relationships between the main aspects of the OEE and its components (
Figure 1).
Thus, in order to achieve sustainable development, strategic and continuous efforts involving the entire organization are required, where maintenance efforts play a leading role [
25], mainly in capital asset-intensive organizations. According to [
26], maintenance activity is, by nature, an important driver for action on the sustainability in production systems. Still, according to the same authors, maintenance plays a fundamental role in maintaining operational continuity through safety management, energy savings, plant and machinery breakdowns, and productivity, among others. The performance of maintenance must be measured to assess the level of achievement of business objectives toward sustainable development.
However, the way in which maintenance can integrate the sustainability goal and contribute to this goal is not clearly defined. According to [
23], few studies addressing this issue are available in the current literature. Ref. [
27] characterized industrial maintenance in a context of sustainability through a systematic review of the literature. Ref. [
11] developed a sustainable maintenance performance assessment model for the cement industry. According to the authors, sustainability measurement is a process of continuous development and constant improvement of maintenance processes, increasing efficiency (operational excellence), the safety of operations, and the maintenance of technical objects and installations, with a focus on employees.
The relationships between the maintenance function and the OEE were mapped in a detailed work by [
24]. Based on knowledge of systems dynamics and strategic management literature, feedback loops were designed to reinforce the maintenance function and its interactions with various elements of a company.
Pires et al. [
27] proposed an approach to prioritize the drivers of sustainable maintenance by prioritizing the factors present in the TBL approach by connecting them to the OEE. According to Esa and Yusof [
20], the affirmative of implementing the OEE is very important for the organization’s sustainability management. Therefore, OEE management can be seen as a process of culture transformation through which existing elements of culture are modified, replaced, or reinforced with better elements.
Sari et al. [
28] developed a framework for measuring sustainable maintenance performance. This framework identifies 15 measures at the corporate level, 20 measures at the tactical level, and 43 measures at the functional level. The economic dimension of sustainability is divided into three dimensions: Cost, quality, and productivity. In the quality dimension and at the corporate level, Overall Plant Effectiveness appears, while in the productivity dimension, mention is made of the efficiency of maintenance. Going deeper into the levels, aspects such as availability, mean time to repair and mean time between failures (MTTR and MTBF respectively) and OEE also appear.
Wan Mahmood et al. [
7] also proposed a framework that relates each dimension of TBL to the OEE factors (system availability, equipment performance, production quality). From that, the attributes that best influence sustainability are grouped. More recently, [
29] investigated maintenance prioritization decisions, as well as developing and validating maintenance decision support to increase productivity.
For Charaf and Ding [
30], the OEE frees managers from short-term vision and provides the prospect of continuous improvement. Using the OEE, the performance of the equipment is evaluated, unmasking all machine performance losses and indicating possible corrective or preventive actions.
Ref. [
2] demonstrated that a systematically used set of combined OEE and productivity measures can successfully drive production improvements. The work of Garza-Reyes et al. [
31] investigated the relationship between OEE and process capability. On the same note, Shahidul et al. [
32] emphasized that the underutilization of machinery capacity appears as a hidden factor without added value in the production process that does not contribute to raising the throughput of the production system. Two interesting works on application of the concept of OEE combined with environment issues are [
33,
34].
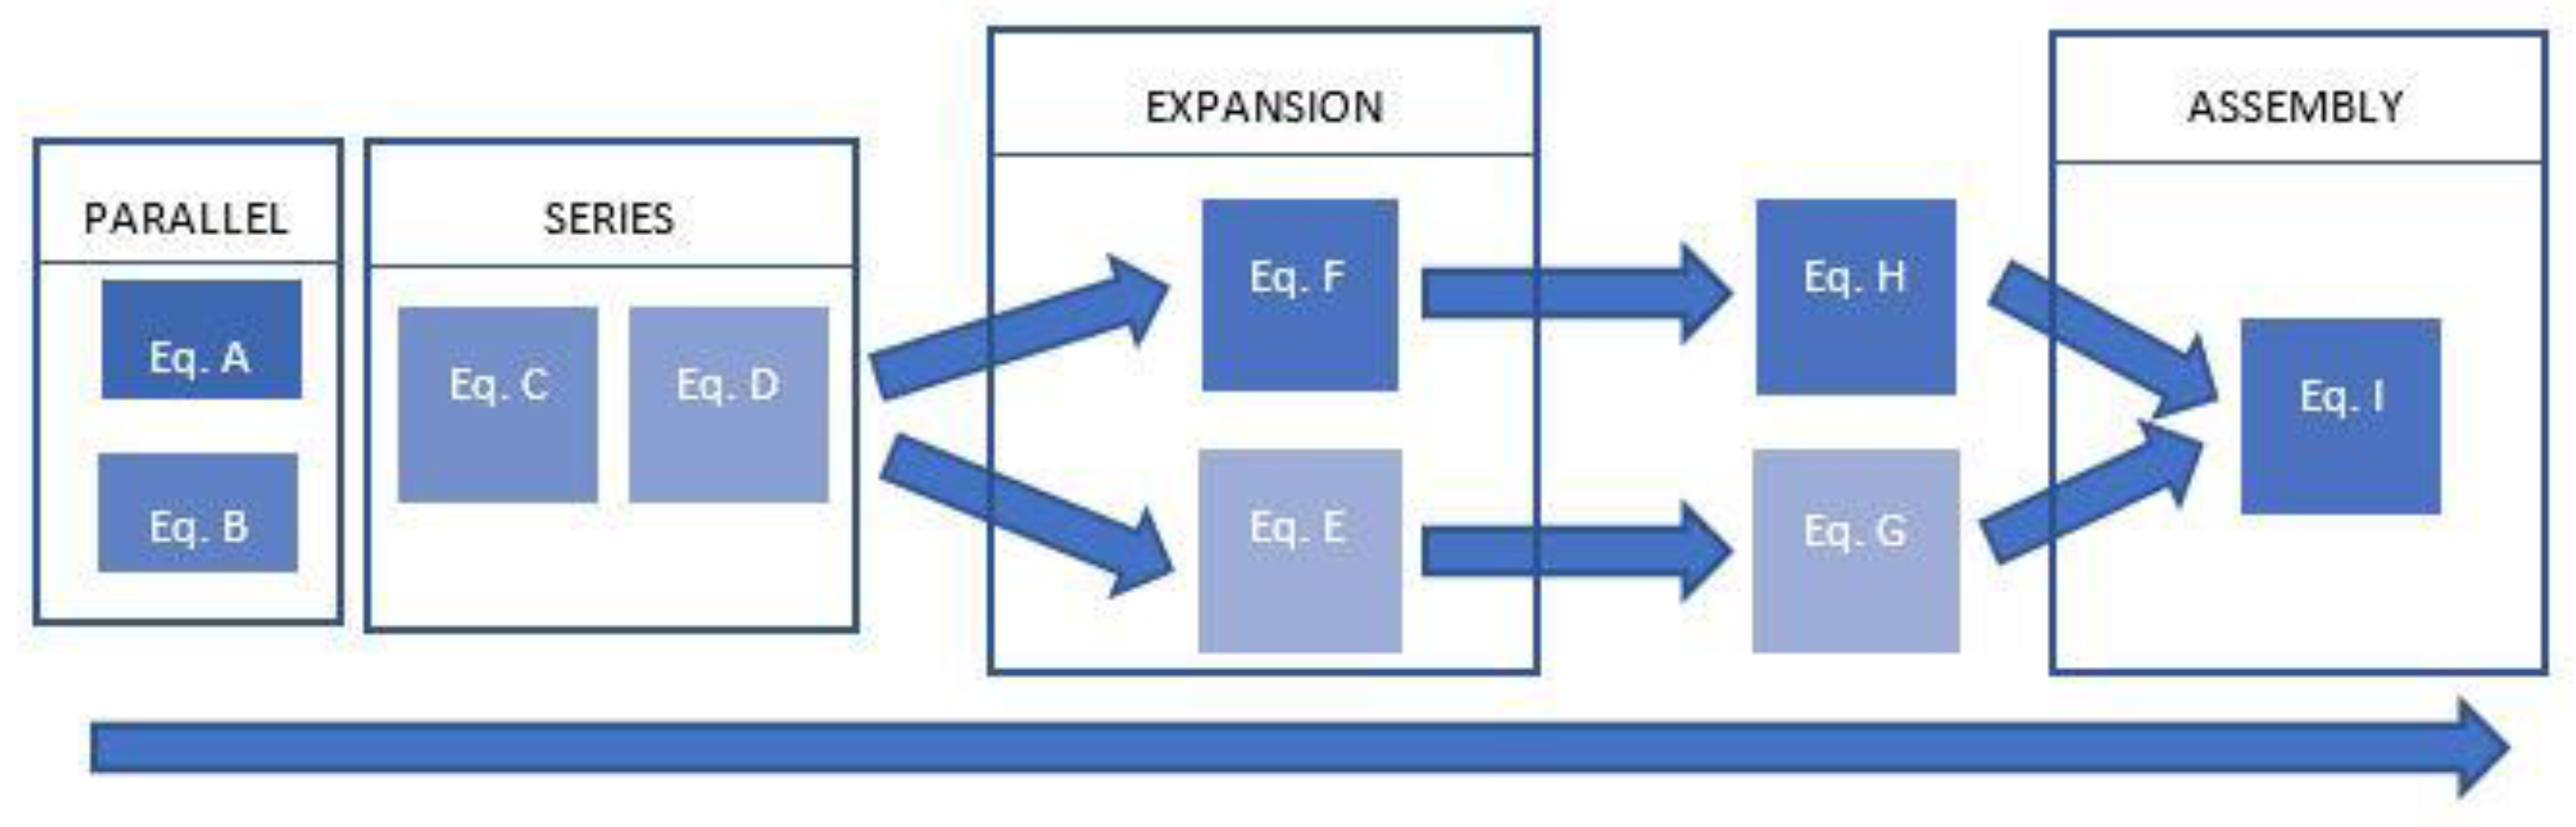
In every production system, each machine or equipment contributes in different degrees to overall results and to its throughput. This situation can be represented by a function of a complex set of cause-effect interrelationships and synergies [
24]. Therefore, it is necessary to be aware that not every piece of equipment contributes with the same intensity to the performance of the system considering its specific levels of availability, utilization, and productivity. Indeed, not only the availability (a maintenance KPI) of each piece of equipment will determine its importance, but a combination between this and the levels of effective capacity utilization and productivity of each of them is needed, taking into account the general taxonomy of the productive system. In the literature, there is no model or technique that allows the measurement of this impact, taking into account the different configurations of the productive system (series, parallel, and others).
This is why machine level metrics, as well as also other indices that take into account the contribution each machine makes to the performance of the entire system, are required. A series of global performance indices focused on determining bottlenecks and identifying hidden capabilities have been proposed [
16,
35]. Gólcher-Barguil et al. [
36] presented an interesting research stream of the OEE which analyze the scope and calculations modifications of about 10 new developments. However, none of these indices are intended to determine the impact of maintenance actions have at the systemic level.
From the point of view of the systemic impact, it is necessary to establish a hierarchy of physical assets regarding the degree of influence or impact that each equipment provokes into efficiency of the overall performance (throughput) of the system.
Such prioritization efforts have to take into account the performance and the impact generated at the systemic level by an increase or reduction in their availability, utilization levels, and performance (i.e., OEE fluctuations). The model for maintenance management developed by [
37] precisely includes the prioritization of assets as the second phase of his model. There are several approaches that can be used to prioritize assets looking for optimized asset management decisions. The most commonly used techniques for prioritizing physical assets are Pareto Diagrams, Jack Knife and Multicriteria Methods (MCDM), such as AHP and Delphi. It is also important to remember that criticality analysis is a fundamental phase of RCM and FMECA [
38]. Regarding those techniques, the Risk Priority Number (RPN) is used as a multicriteria index of evaluation [
37]. Kristjanpoller et al. [
39] proposed a methodology called RAM-C, which reveals the effect of each equipment on the system that contains it, including situations where the logical configuration is not serially dependent. This methodology establishes a hierarchy among the assets of a productive system using as base the so-called impact factor of each one of them. For the calculation of this index, the availability and configuration of the equipment is taken into consideration, but not the effect that the loss of availability may generate in the production rates at system level. Recently, Pascual et al. [
40] proposed a method for prioritizing equipment using a technique called System Efficiency Influence Diagram (SEID), which allows for the identification of equipment on a production line that generates the greatest impact on production rates in order to define appropriate maintenance policies. Later, Pascual et al. [
41] applied the aforementioned methodology as an iterative optimization procedure based on the performance of the production system through concepts of constraint theory and bottleneck detection.
The hierarchy of assets requires a “comparison” between them. This comparison must necessarily be made from a higher level of analysis than that of the machine level, providing a systemic vision of the whole. Thus, there are two levels of analysis for the unavailability: (i) Machine level, (ii) systemic. In this sense, an equipment will be more critical if its unavailability leads to the unavailability of the system [
42]. In many cases, local unavailability does not cause a severe impact on production at the system level. This should be reflected in maintenance planning and decisions. This is the case, for example, of an event of unavailability in a redundant equipment. It is this redundancy that prevents the unavailability of a piece of equipment from being transferred to the system in a certain degree of influence. Thus, it is necessary to distinguish equipment that present a lower criticality level from others with greater criticality, and consequently, create adjusted maintenance plans taking into account these differences.
Consequently, the present work raises the following hypothesis: “It is possible to define a prioritization list of equipment to plan maintenance actions according to the impact that the variation of the operational variables (availability, use, and productivity) of each individual equipment causes in the global throughput and in the generation of value for sustainable manufacturing”.
The aim is to generate a technique that take into account these key aspects, which are directly related to the business objectives, the generation of value, and the maintenance of a sustainable productive system. In this paper, we try to make a contribution in this sense.
4. Methodology
Regarding the OTE indicator, it is possible to carry out a sensitivity study with respect to variations in the availability and utilization of each equipment within a production system. That is, the systemic impact of the percentage increase or decrease in the availability and/or in the utilization of each piece of equipment. From this sensitivity analysis, it is possible to obtain a ranking of the equipment according to its impact on overall performance either from the availability or the utilization point of view. As the objective of this model is to prioritize maintenance actions toward the equipment that can “take better advantage” of the improvement in its availability, another aspect must be taken into account: Its effective utilization. In other words, what is the percentage of the available time which is being used? One can easily see that the higher the utilization, the better use is being made of the available time. A piece of equipment that is in this situation can be considered as constrained by the availability (therefore, by maintenance performance). On the other hand, the equipment, which is underutilized despite of having high levels of availability, is constrained by operational issues, such as an unprepared workplace, operator absence, or other kind of idleness.
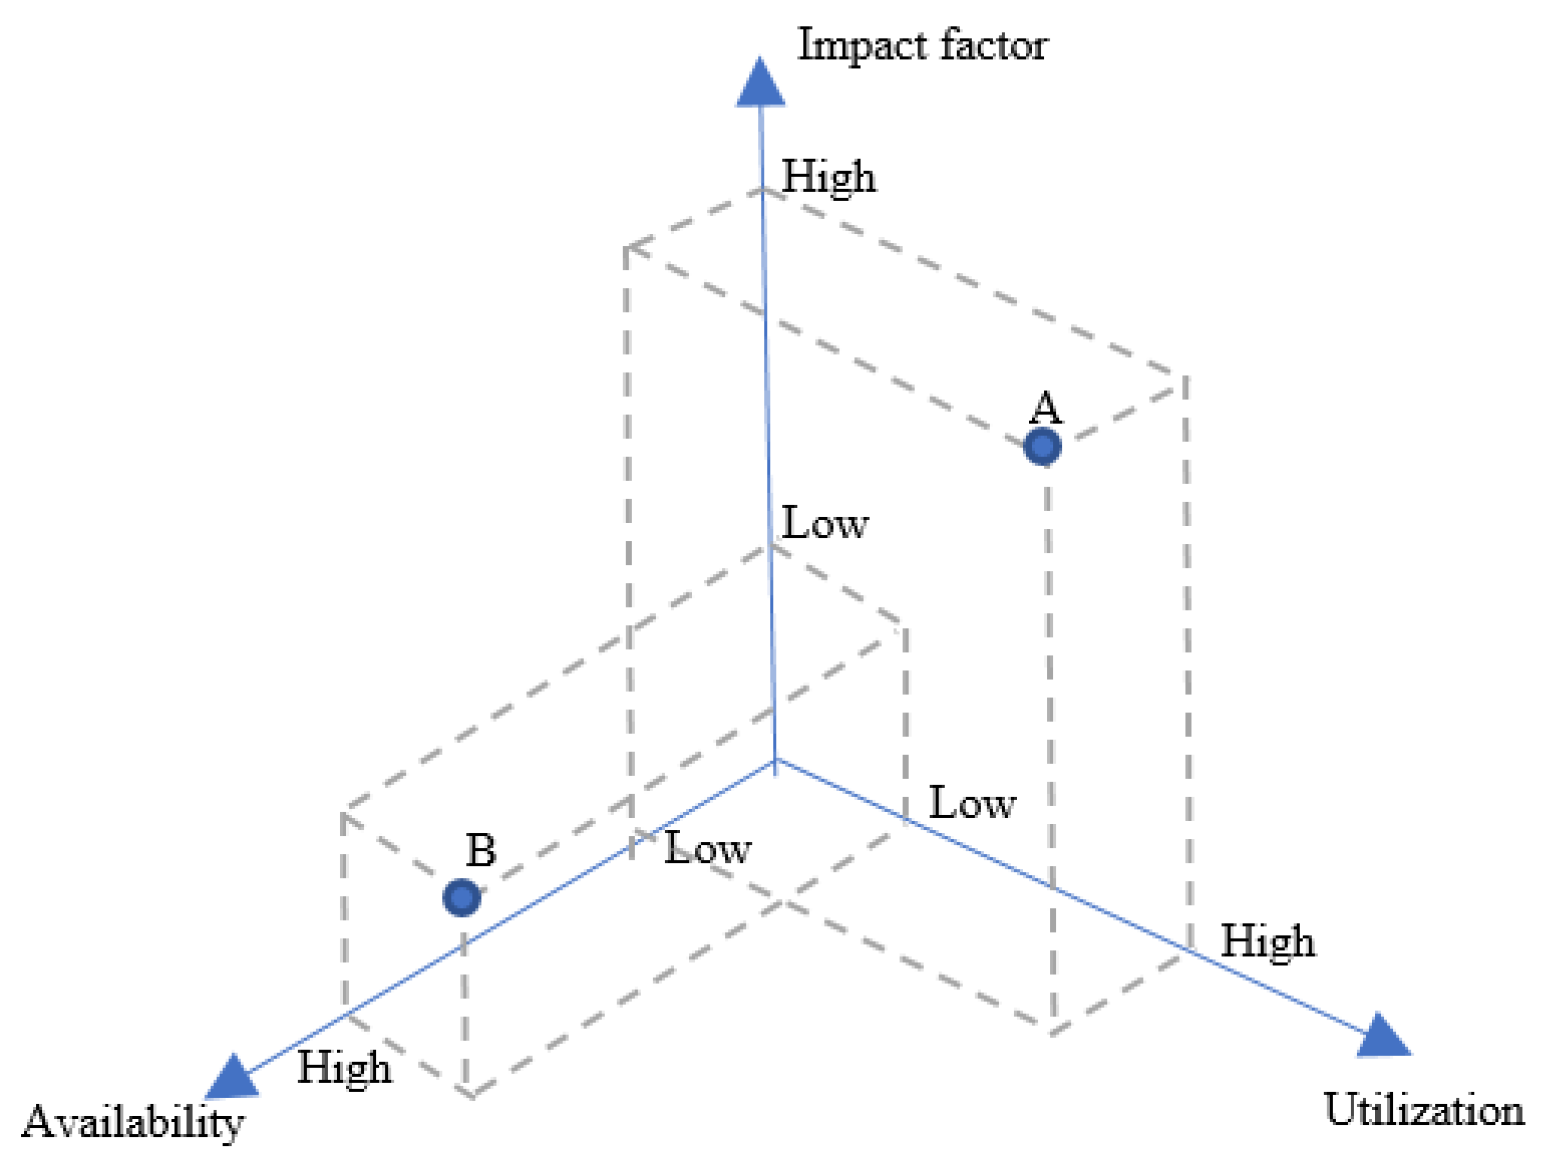
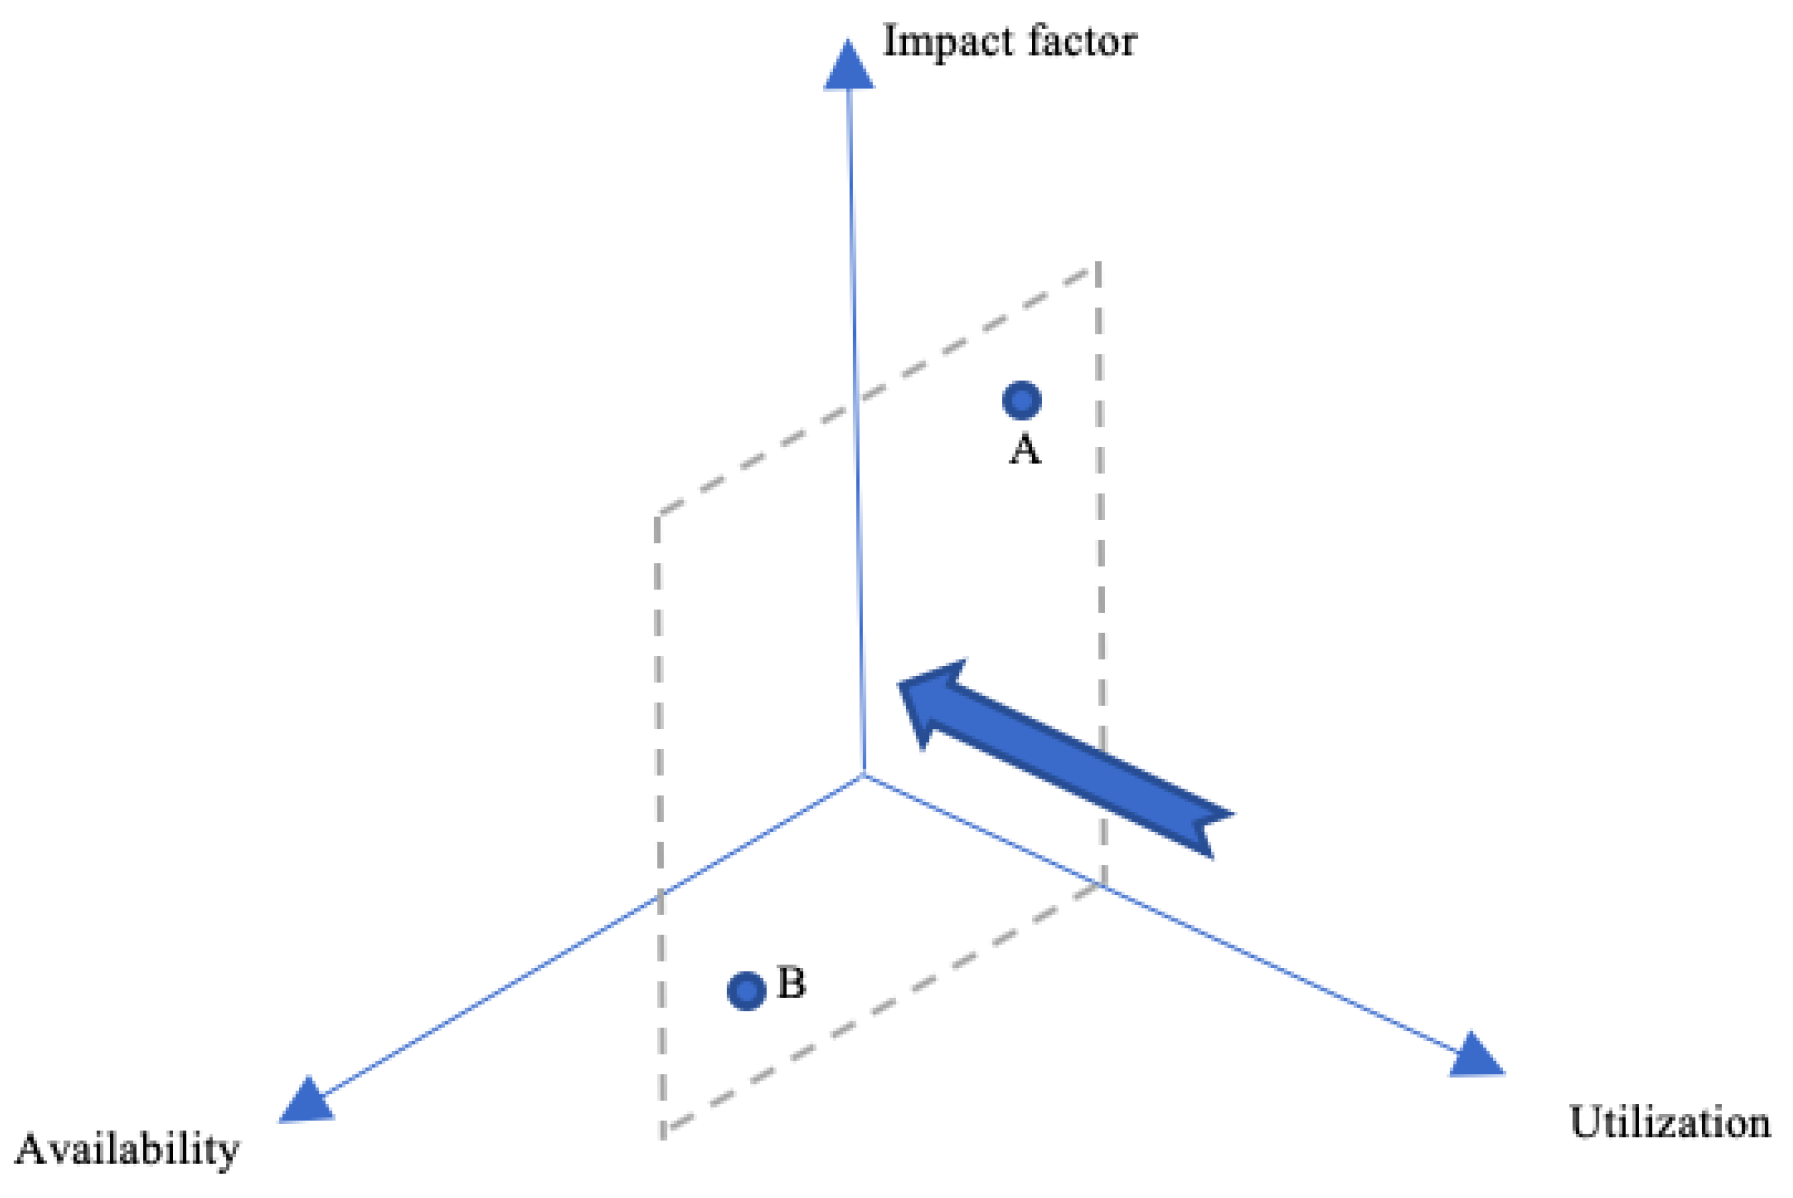
Finally, as previously mentioned, it is not equally worthwhile to increase performance of any equipment, but it is strongly recommended to increase the equipment’s performance that generates the greatest impact at the system level and a throughput increment. Therefore, priority should be given to maintenance actions that will increase the availability of equipment that meets the following requisites: Low maintenance performance, high level of utilization, and a high impact on overall efficiency. The equipment is represented by point A in
Figure 4. Another equipment may have high availability, but low levels of utilization and lower impact factors (point B in
Figure 4). That is, from the maintenance point of view, such equipment must be considered with a lower level of priority, because an improvement in its availability will not directly imply an increase if the overall throughput.
Therefore, three perspectives can be extracted from this approach.
Figure 5 shows perspective I. In perspective I, the relationships between machine availability and impact factor can be observed. From this perspective, we can identify the physical assets which present low levels of availability in conjunction with high impact factor (equipment A). Those assets need to increase their maintenance performance because such increment will impact significantly in the overall throughput.
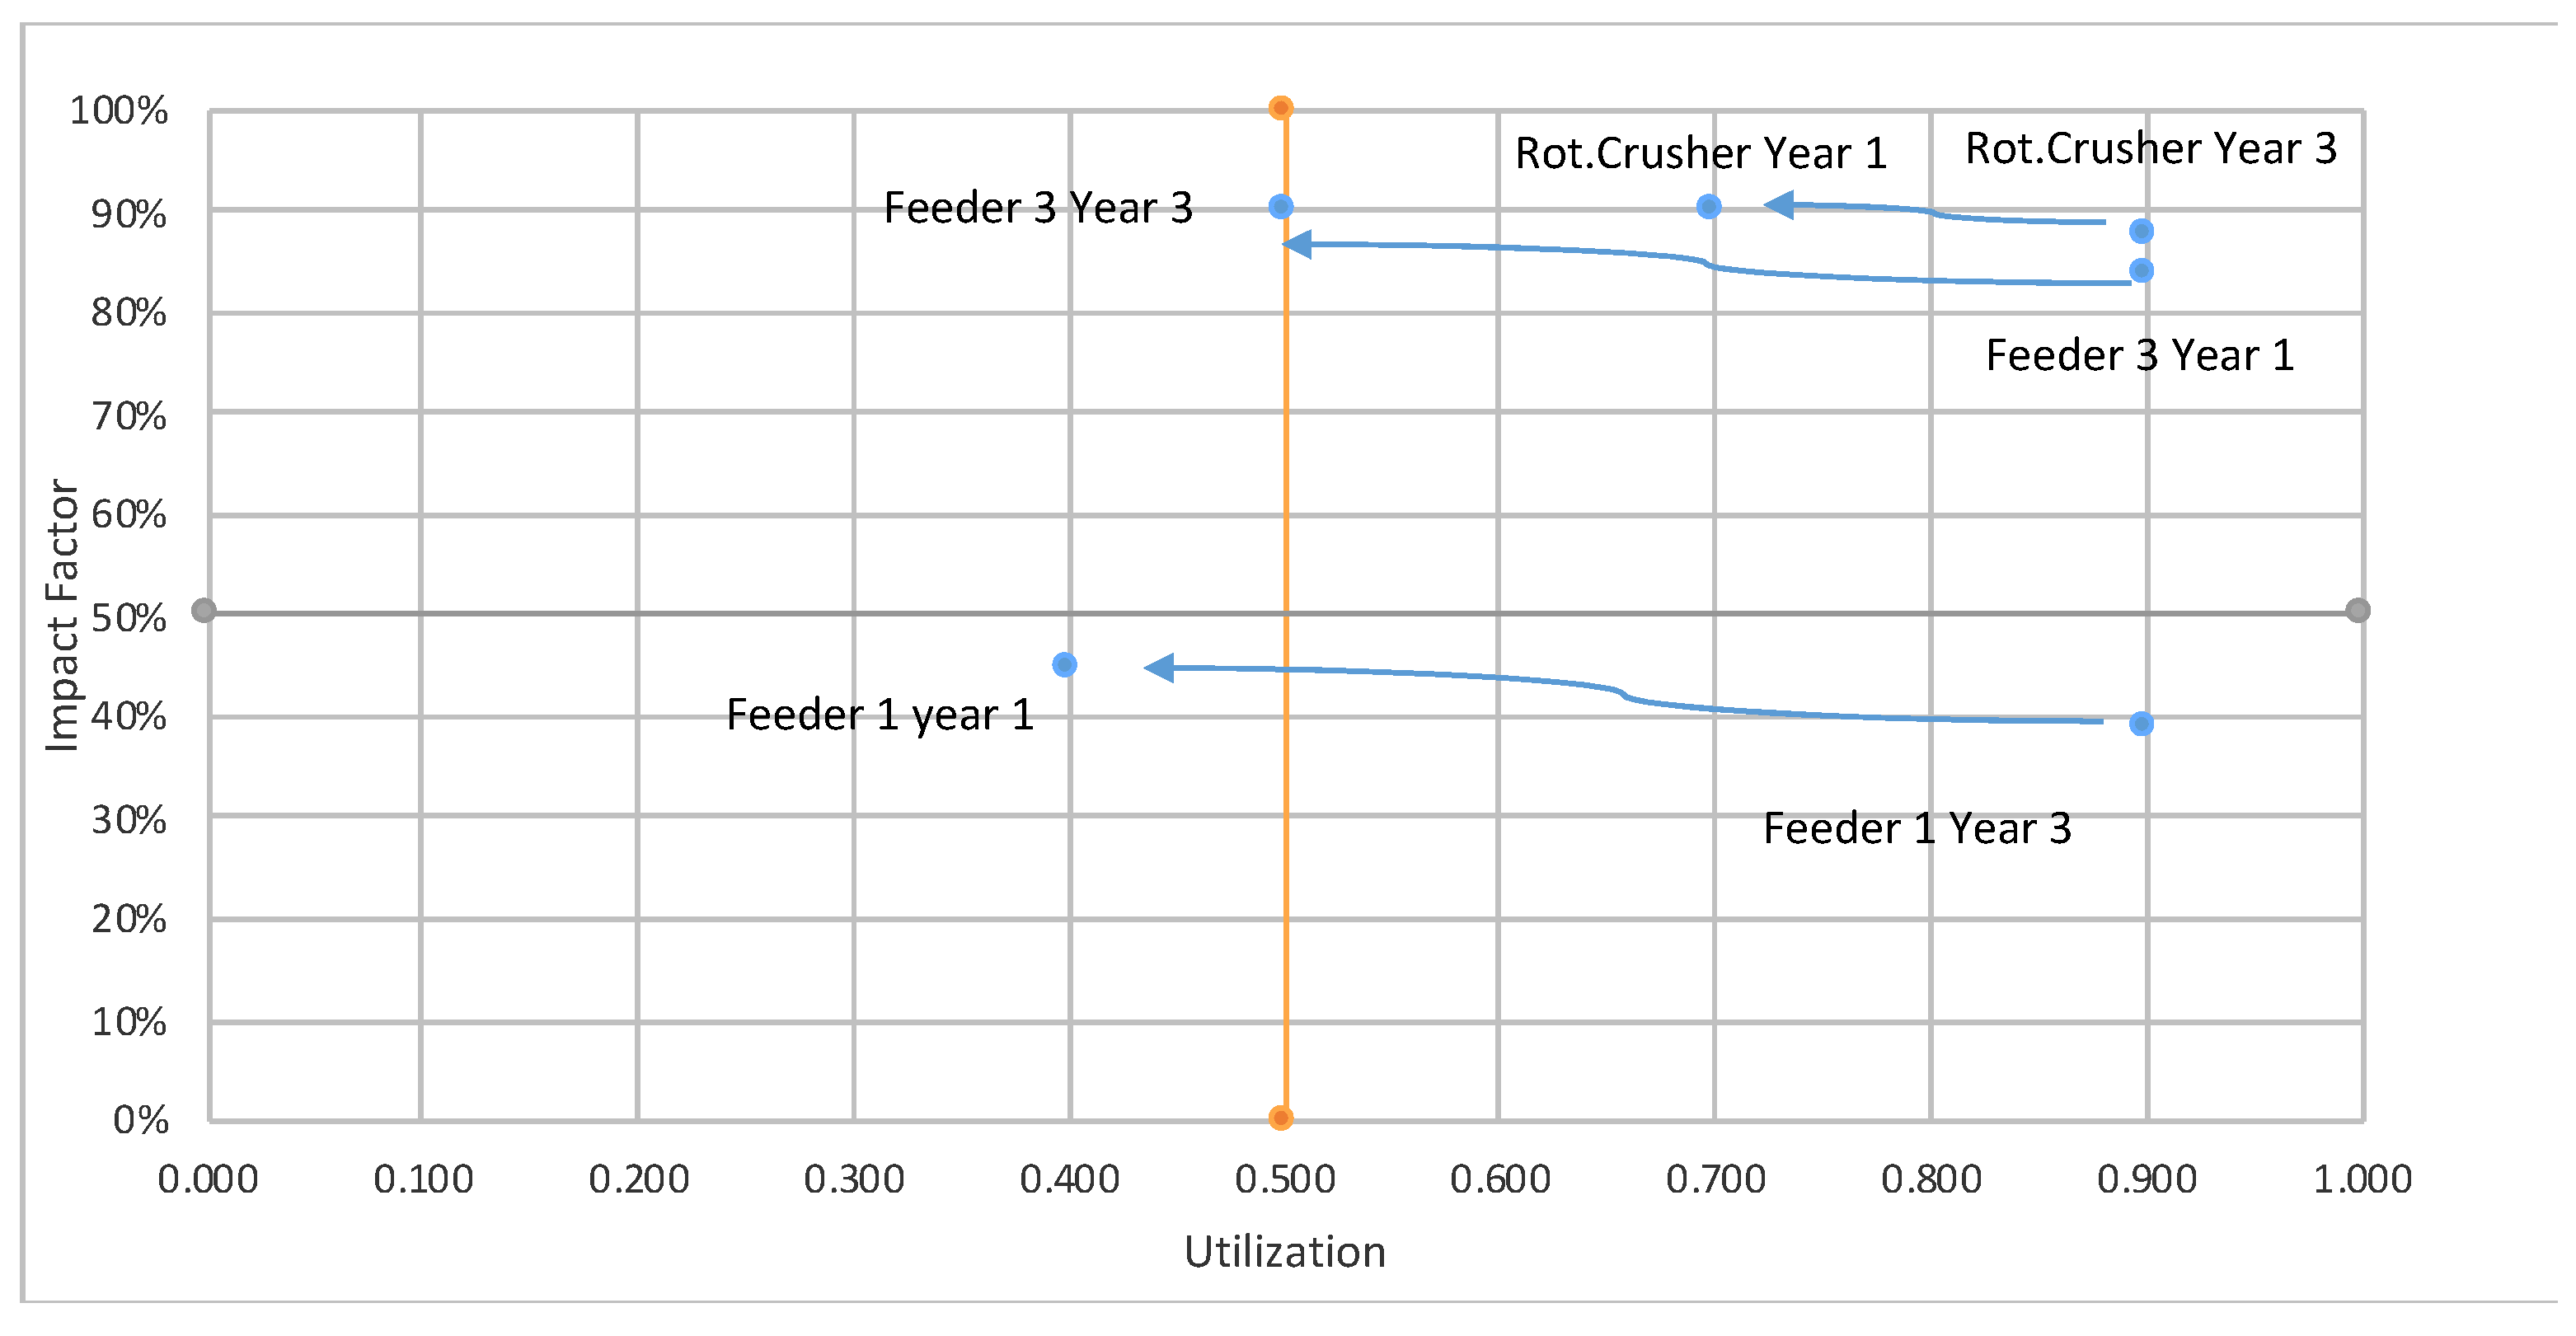
Figure 6 depicts the relationship between the equipment utilizations and the impact factor (perspective II). Similar to perspective I, here it is possible to identify the equipment which present low levels of utilization and high impact factor (equipment B). This is the case of physical assets which are stressed to increase their utilization because such increment will impact directly in the OTE.
Through the use of both perspectives, the equipment with the lowest availability and utilization, but with great systemic impact factor, have to be recognized as priorities from the point of view of maintenance and operations.
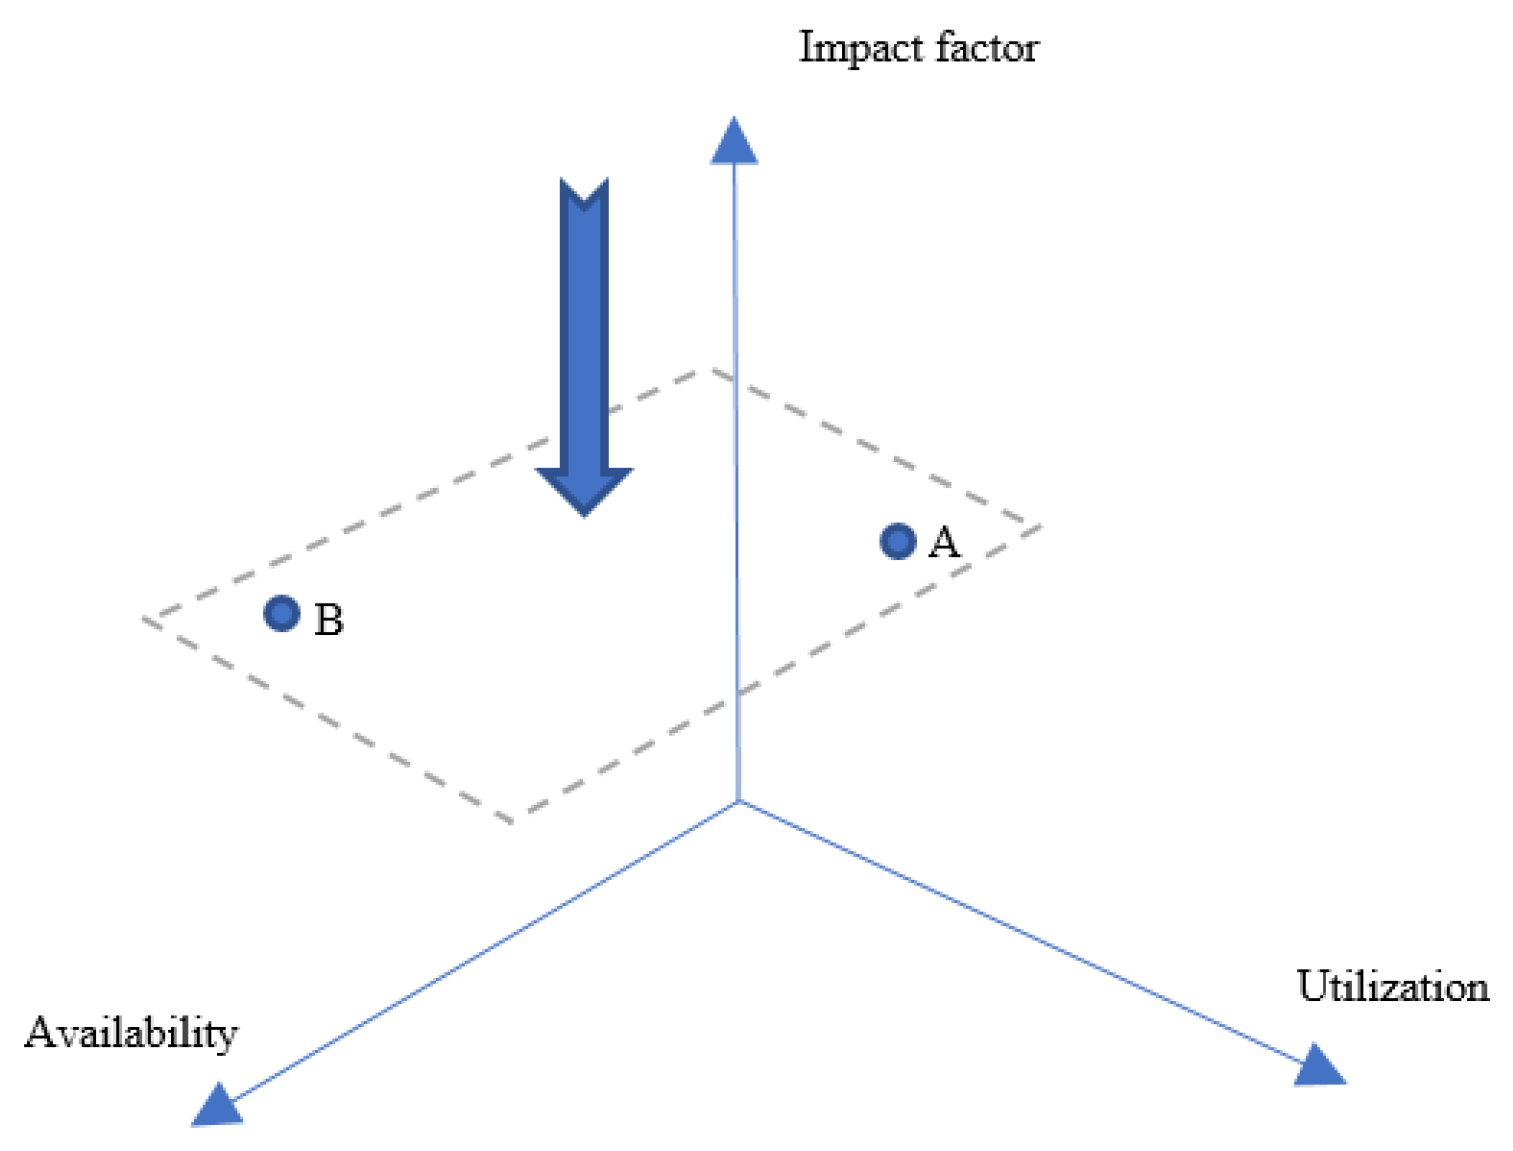
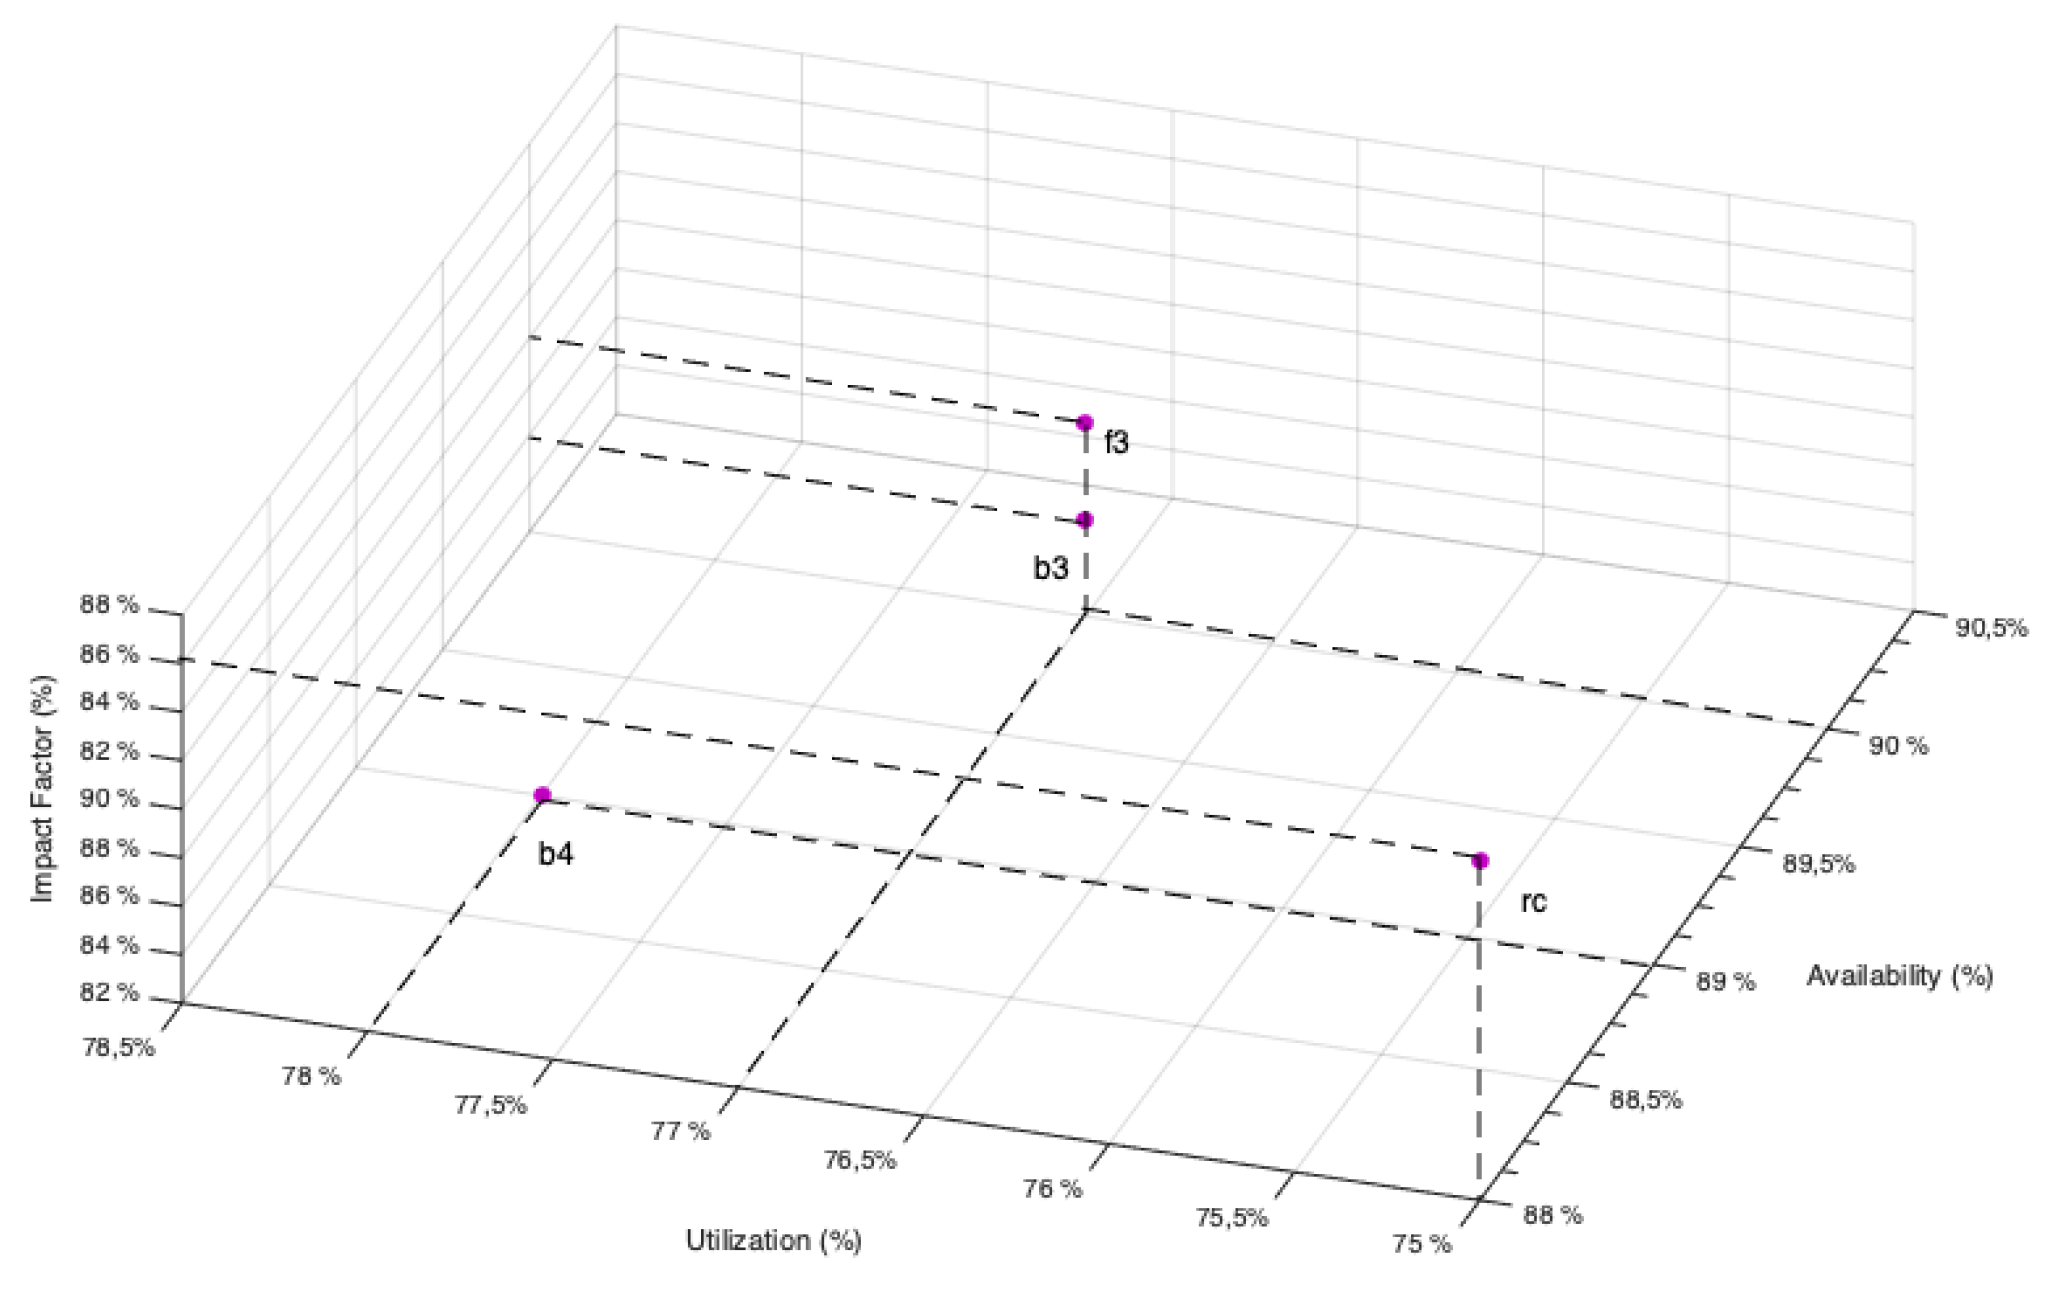
In the third perspective (
Figure 7), the relationship between availability and utilization can be analyzed. This perspective is vital for determining what assets are presenting low levels of availability in combination with higher levels of utilization (equipment A). In such category, the equipment which need to increase their availability levels are positioned. This is true under the assumption that any increment in availability can be translated into additional utilization with the consequent increment in the overall throughput (the highest possible).
In order to estimate the impact factor, a sensitivity study of the OTE to variations in the availability values of each piece of equipment must be carried out. This analysis is carried out by varying the availability value of a piece of equipment, ceteris paribus, and measuring the variation of the OTE. Once the effect of the variations in the availability of each of the equipment has been measured, the so-called impact factor (IF) is calculated, which will allow each equipment to be ranked according to this value:
where
and
are the values of the OTE obtained by varying between the ranges of variation of the available equipment
j. The greater the value of
IF, the greater the systemic impact caused by the variability of the availability of such equipment.


