Abstract
Improving the resilience of enterprise safety production is one of the important ways to deal with the frequency of safety accidents. Based on the definition of enterprise safety production resilience, we fully consider the impacts of recovery resilience, self-organizing resilience, and learning resilience as the three dimensions of enterprise safety production resilience. We build a back propagation (BP) neural network model that analyzes the main factors of enterprise safety production resilience using the results of gray relational analysis as an input that can assess the resilience of enterprise safety production and provide a valuable reference for the improvement of an enterprise’s safety production level. The results show that the resilience of production safety obviously increased after the Chinese enterprises with low resilience (as predicted by the model) adopted the corresponding early warning methods. The gray relational degree analysis method can incorporate well the variables for the establishment of the BP neural network prediction model.
1. Introduction
At present, China is not only in the critical period of comprehensive and profound economic transformation and social transformation, but also in the process of large-scale industrialization and urbanization. The complexity of technology, the tasks, and the organizational structure of various enterprise projects are increasing daily, which leads to unpredictability in safety risks. This phenomenon poses a great challenge to the traditional safety management methods of enterprises [1,2]. Resilience engineering is considered as a potential method to solve the problem of the increasing complexity and unpredictability of social and technological systems for which traditional safety management methods cannot cope [3]. Therefore, this paper introduces the term “enterprise safety production resilience”, which presents a new perspective in the field of Chinese enterprise safety production management.
At the end of the 20th century, resilience was introduced into many disciplines, such as ecology, social ecology, and disaster science, and its research results have made great progress. In 2003, Woods first introduced the concept of “resilience” into the security field [4]. Then, scholars at home and abroad from the perspective of the entire system and with the organizational, cultural, management, safety and health, oil, electricity, and aviation industries as the background, determined the components, evaluation indicators, frameworks, conceptual models, and mathematical model of resilience. Tveiten [5] analyzed oil and gas production operations for the first time in 2012, emphasizing three factors: early risk forecasting; links between participants in emergency linkage; and information exchange, communication sharing, and building a resilient emergency management system. Huber [6] first used the PDCA (plan, do, check, act) cycle method to establish initial Organizational Resilience indicators for complex systems or organizations in 2012, and constructed a four-dimensional conceptual model of Organizational Resilience based on commitment, awareness, efficiency, and adaptation. In 2016, Huang Lang constructed the conceptual model on shaping a system of system safety resilience from three dimensions, and constructed the mathematical model for assessment of system safety resilience based on the curves of system safety resilience [7].
In light of the previously mention works, this paper adopts the gray correlation analysis method to quantify the influencing factors of unclear boundaries and difficult quantifications, and uses the screening result as the input variable of the BP neural network model of enterprise safety production resilience to scientifically and accurately assess the recovery of enterprise safety production. This process provides decision-making information for enterprise safety management and can ensure that production safety is resilient and stable.
2. Theory
2.1. Proposed Definition of Enterprise Safety Production Resilience
There are two main views on the definition of resilience: engineering resilience and ecological resilience. Engineering resilience was proposed by Pimm in 1984, and it is expressed as the speed or time at which the measurement system returns to its original equilibrium state after being disturbed [8]. Ecological resilience was introduced by Holling, and it refers to the amount of disturbance that a system can absorb after adjusting the behavioral control parameters and procedures under the premise of maintaining its own structure [9]. In fact, the difference between engineering resilience and ecological resilience lies in the different perspectives on system stability; the former emphasizes the maintenance of functional effectiveness, while the latter focuses on the continuation of system functions [10].
As shown in Table 1, there is not one unified definition of resilience, but the research has been extended from a simplified abstract ecosystem or a traditional engineering system to a complex multistable system, thus gradually being adapted to various fields. The early resilience research has brought us some inspiration; the resilience of enterprise safety production should include the absorption capacity after steady, safety production and also the ability of the whole system to operate normally under the risk of shocks [11]. In addition, early research emphasized the continuous learning ability and adaptability of the whole system after instability [12]. Therefore, this paper concludes that enterprise safety production resilience is a function of the system to include resilience, self-organizational resilience, and learning resilience. (1) Absorption resilience diverts the disturbance to an unaffected part of the system while ensuring that the function and structure of the production system are essentially unchanged. (2) Self-organizing resilience refers to the self-improving organizational evolution of the enterprise safety production system while maintaining the same functional structure. (3) Learning resilience is a driver of recovery and reproduction through the adjustment of personnel and system functions after a safety production accident. Therefore, the author believes that enterprise safety production resilience refers to the ability of the entire system to maintain, learn, and restore itself to a stable, safety production operating state by adjusting internal personnel and system functions when subjected to risk disturbances.

Table 1.
Definitions of resilience in each field.
2.2. The Change Law of Enterprise Safety Production Resilience
Some scholars’ research on financial systems provides a feasible way to improve the theory of enterprise safety production resilience assessments. Xu Rongzhen believes that under financial liberalization, the steady migration of the financial ecosystem and the adaptive cyclical structure and functions [16], such as reversing the flow, will not advance, but will retreat. Xu Rongzhen also believes that the three stages of financial resilience in the adaptive cycle are similar to those in Figure 1. When , the enterprise safety production system enters the developmental stage, has good absorption resilience, and continuously self-improves by adopting self-organizing resilience when dealing with internal and external disturbances. When , with the development of enterprise safety production, the enterprise safety production system enters the regulation and control stage, and it becomes increasingly more sensitive to disturbances. The absorption and recovery effectiveness also wane, which leads to an overall decline in the level of resilience of safety production. When , the system enters the crisis stage. Under the pressure of an enterprise safety production crisis, it has to use its self-organization resilience to rapidly respond and use the learning and resilience of the enterprise safety production system to reestablish enterprise safety production. In the reestablishment phase, when , the enterprise uses its resilience, self-organizing resilience, and learning resilience to gradually become more stable and enters the developmental stage of the next cycle. During the reconfiguration phase, the system can be restored to the pre-existing security state (B), it can not be restored to the pre-existing security state (C), or it can improve its security resilience and reach a better security state (A).
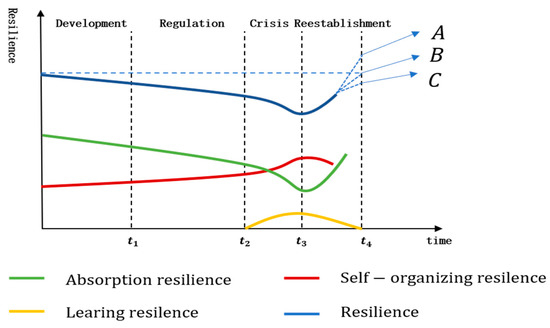
Figure 1.
The evolutionary process of enterprise safety production safety resilience.
The resilience of enterprise safety production based on the combination of the three types of resilience is unsteady, and the four evolutionary stages are repeated. However, possessing resilience and self-organizing resilience are the key guarantees for Chinese enterprises to maintain safety production and restore the evolution of a cycle to a better, safer production state. Learning resilience is the reserve force for the unbalanced safety production systems of Chinese enterprises and can even enable the rapid emergency response to safety production accidents. Therefore, only three types of resilience can guarantee the normal operations of safety production.
3. Methods
3.1. Analysis of Factors Affecting the Resilience of Safety Production
Based on the above analysis results, this paper takes the absorption resilience, self-organization resilience, and learning resilience as the starting points of the research on the resilience of enterprise safety production, and it determines and evaluates the factors affecting the resilience of enterprise safety production, as shown in Equation (1).
Before an accident, absorption resilience is determined by the employees, production facilities, and environmental conditions, and self-organizing resilience is determined by the enterprise’s safety production management strategy and methods. Both have great impacts on the overall resilience of the enterprise. After the occurrence of a safety production accident, the company’s rapid emergency response mechanism is the main reflection of the company’s learning resilience. By summarizing, analyzing, and comparing the domestic and foreign information on the influencing factors, components, dimensions, and indicators of the system, taking the organizational resilience measurements, evaluating research, and consulting experts, we establish a comprehensive application of an enterprise safety production resilience measurement impact system and summarize the commonalities by means of classification, splitting, and merging. Figure 2 shows the factors influencing the resilience of enterprise safety production and emphasizes absorption resilience, self-organizing resilience, and learning resilience. In order to facilitate the follow-up analysis of the results of the indicators, represents the first level heading, that is, the resilience of enterprise safety production; is the second level heading, that is, the absorptive resilience, self-organizational resilience and learning resilience; represents the third level heading, that is, 16 influencing factors, such as represents the first index under the first secondary heading, that is, the safety ability and literacy.
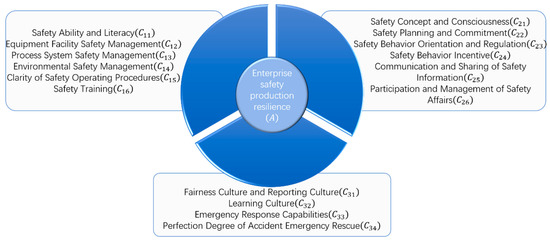
Figure 2.
Factors affecting the resilience of enterprise safety production.
Safety ability and literacy refers to the safety production technology and the knowledge, high sense of responsibility, and dedication of employees. Safety management of equipment and facilities refers to the system safety management mode of equipment and the whole process of production, which insists on the continuous updating and transformation of equipment to eliminate the unsafe factors in the process of equipment operation in a timely and effective manner. Process system safety management refers to the improvement of process safety management standards such as process hazard analysis and process safety information, and the matching improvement of relevant systems of process safety management. Environmental safety management refers to enterprises consciously and comprehensively fulfilling their environmental security responsibility, carrying out risk assessments, formulating emergency plans, building preventive measures, and self-checking and self-correcting hidden dangers. Clarity of safety operating procedures refers to the clarity of rules and procedures that employees must observe when operating machinery and equipment and adjusting instruments. Safety training refers to the education and training aimed at improving the safety quality of safety supervisors, employees of production, business units, and relevant personnel engaged in safety production.
Safety concept and consciousness refers to both the concept that production must be safe in the minds of employees and to the most basic moral norms and ideas to measure right and wrong, good and bad in terms of safety. Safety planning and commitment refers to the commitment of managers to balance the relationship between organizational production pressure and long-term healthy development in order to first focus on prevention and then the reduction of losses to ensure their effectiveness. Safety behavior orientation and regulation refers to employees having common behavior characteristics and working principles, with obvious orientations and restrictions, to standardize the behavior and work habits of employees. Safety behavior incentive refers to the process in which enterprises design fair and appropriate incentives and penalties through business to guide and strengthen the employees to meet the safety and safety needs of the enterprises and coordinate and achieve the safety production objectives of the companies. Communication and sharing of safety information refers to the information exchange and feedback mechanism within the organization. Participation and management of safety affairs refers to the personal participation of employees in enterprise system formulation, safety decision-making, activity implementation process and various management affairs to varying degrees, especially to the equal position of ordinary employees and managers to jointly study and discuss safety production issues.
Fairness culture and reporting culture refers to an atmosphere of mutual trust established within the system or organization, which encourages employees to report security risks positively and authentically. Learning culture refers to the analysis and experience of learning lessons from accidents and daily work. Emergency response capability refers to the ability of crisis prevention, event identification, emergency response, emergency decision-making, handling, and response evaluation to reduce the damage caused by crisis. Perfection degree of accident emergency rescue refers to the perfection degree of the action plan formulated in advance by enterprises in order to carry out emergency action quickly and orderly in response to possible accidents.
3.2. Gray Correlation Degree Verification Factors Affecting the Recovery Ability of Enterprise Safety Production
Whether the influencing factors that are given in Figure 2 affect the resilience of enterprise safety production requires further verification. In this paper, the gray correlation analysis method is used to study the influences of various factors on the interrelation and interaction of other various factors.
If the changes of each factor are basically the same, it can be considered that the degree of correlation between the factors is relatively large, and the impacts on the resilience of enterprise safety production are synchronous; that is, it can be used as an influencing factor in the model of the resilience of enterprise safety production [17]. It is generally considered that when the gray correlation degree is 0.6 or more, the correlation between the subsequence and the parent sequence is good.
The data in the correlation analysis are set as , that is, . is the optimal sequence, where is the fifteenth optimal value of the index. is the index of item , . is the value of index of item , . We set the enterprise safety production resilience () as the reference sequence; we set the safety ability and literacy (X1), equipment and facility safety management (X2), and emergency rescue plan quality (X16) as the comparison sequence; and the gray correlation model was established as follows.
- Step 1.
- Find the difference sequence of index and − .
- Step 2.
- Find the maximum difference and the minimum difference between the two poles.
- Step 3.
- Find the correlation coefficient .where is the resolution coefficient. When , the resolution is the best, and usually [18,19].
- Step 4.
- Calculate the degree of association −.
3.3. Construction of the Enterprise Safety Production Resilience Model Based on a BP Neural Network
The enterprise safety production resilience evaluation model based on a BP neural network realizes the input–output mapping function, and automatically extracts the reasonable rules between the input and output data using learning. Second, the BP neural network has great adaptability to evaluate an enterprise’s safety production resilience. For different management decision makers and different enterprise safety production systems, the relative weights of the factors affecting the resilience of safety production are not very different. In addition, after continuous genetic iterations, the individual’s fitness continuously decreases, and the individual’s adaptability continuously strengthens. After many iterations, the individual’s fitness is basically stable.
3.3.1. BP Neuron
Figure 3 shows the jth basic BP neuron (node), which mimics only the three most basic and important functions of biological neurons: weighting, summation, and transfer. Where represent the inputs from neurons , respectively. respectively, indicate the connection strengths of neurons and the j-th neuron, which are the weights. is the threshold, is the transfer function, and is the output of the th neuron.
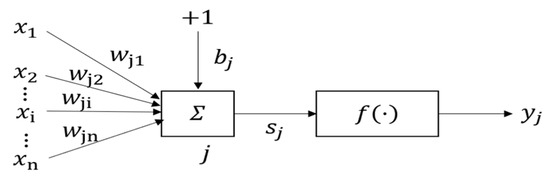
Figure 3.
Back propagation (BP) neuron.
The net input value of the jth neuron is calculated as follows:
Here, and .
After the net input passes the transfer function , the output of the jth neuron is obtained:
where is a monotonically increasing function and must be a bounded function, since the signal that is transmitted by the cell cannot be indefinitely increased and must have a maximum.
3.3.2. BP Neural Network
The use of the BP neural network is a way to build a model for enterprise safety production resilience. The influencing factors of enterprise safety production resilience are transmitted forward, and after the layer is processed by the hidden layer, the output layer outputs the result. Let the BP neural network have nodes in the input layer, nodes in the hidden layer, and nodes in the output layer. The number of nodes in the hidden layer is mainly determined by the following empirical Equation (9):
where a is a random integer between 1 and 10.
(i) Forward propagation
Figure 4 shows the topological structure of the cubic neural network. Among them, As shown in Figure 4, the weight between the input layer and the hidden layer is , the weight between the hidden layer and the output layer is , the transfer function of the hidden layer is , and the transfer function of the output layer is .
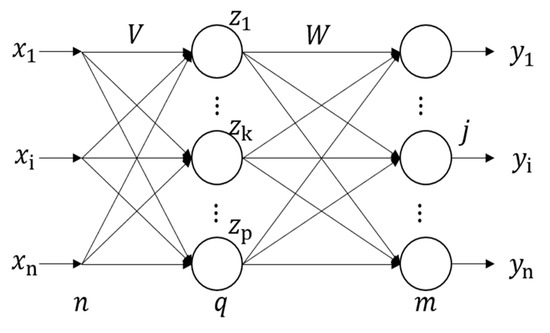
Figure 4.
Topology of a cubic neural network.
The output of the hidden layer node is:
The output of the output layer node is:
So far, the BP network has completed the approximate mapping of the dimensional space vector to the -dimensional space.
(ii) Back propagation
If the output value of the BP neural network model does not meet the expected requirements, then it is transferred to the back propagation. Through the alternation of these two processes, the error function gradient-descent strategy is executed in the weight vector space, and a set of weight vectors is dynamically, iteratively searched to maximize the network error function, thus completing the information extraction and memory process.
(1) Define the error function
We use learning samples, which are denoted as . The th sample is input to the network to obtain the output (j = 1, 2, … m). Using the squared error function, the error of the sample is obtained:
where is the expected output.
For samples, the global error is:
(2) Output layer weight change
The cumulative error BP algorithm is used to adjust to decrease the global error .
where is the learning rate.
(3) Hidden layer weight change
The weight adjustment equation of each neuron in the hidden layer is:
4. Empirical Analysis
4.1. Data Collection
The data collection strategy used multi-industry companies and random stratified sampling surveys. From July 2015 to July 2016, the multisector multilevel unit management, technical personnel, and field staff from a total of 20 power, aviation, and other Chinese enterprises were investigated. The data were collected using questionnaires and employee discussions. For each business, at least three research assistants distributed the surveys to field staff. The research assistants responded immediately to any questions asked by participants, which increased the reliability and integrity of the data. The specific data of the safety resilience evaluation results of 20 companies are shown in Table 2.
Table 2.
Enterprise safety production resilience influencing factors score sheet.
4.2. Data Processing
4.2.1. Gray Correlation Analysis Results
The results of the gray correlation analysis are shown in Figure 5. The correlation between each factor and the recovery performance of the company’s safety production is >0.6, and the correlation is good.
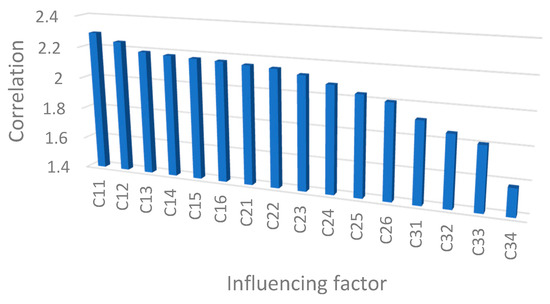
Figure 5.
Influencing factor correlation analysis results.
4.2.2. BP Neural Network Model Analysis Results
The 16 resilience factors were used as inputs to the BP neural network model of enterprise safety production resilience. The enterprise safety production resilience was the output, the number of input layer nodes was 16, and the number of output layer nodes was 1. Based on Equation (9), the number of hidden layer nodes was set as . When training the BP network using the sample set that is described in Section 3.1, it was found that the transfer function that used the tansig function provided a lower error than did the logsig function. Therefore, in training, the hidden layer transfer function used the tansig function, and the output layer transfer function used the purelin function. The training parameter set the target error as 0.0005. After testing, the results were satisfactory, and it can be considered that the neural network can be used to implement this relationship mapping. The structure of the network is shown in Figure 6:
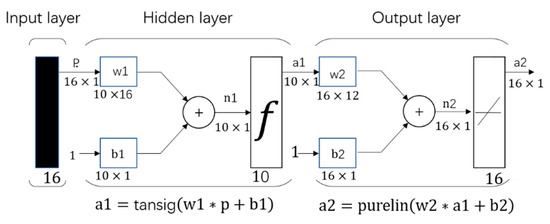
Figure 6.
Three-layer BP neural network structure for enterprise safety production safety resilience.
The enterprise safety production resilience BP neural network reached the preset convergence value at the 757th iteration, and the training mean square errors are shown in Figure 7.
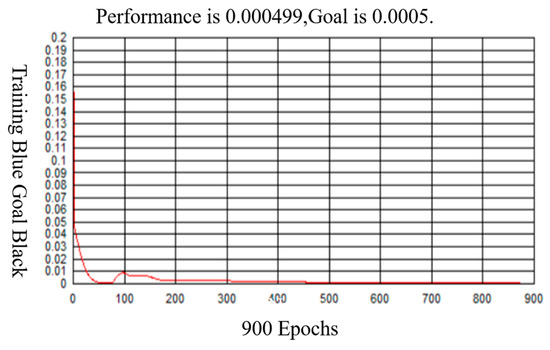
Figure 7.
Neural network training process with implicit layer 10.
4.3. Model Application
Through the continuous learning and fitting that determines the weight of each node, the enterprise safety production resilience evaluation model was constructed. According to the model’s evaluation results, the enterprise safety production resilience was divided into three levels: low-level enterprise safety production resilience, which is a score of 65 points or less; medium-level enterprise safety production resilience, which is a score of 65–85 points; and high-level enterprise safety production resilience, which is a score of 85–100 points.
At the beginning of June 2017, the results of the 16 influencing factors of the five companies (which were no longer selected from the previous sample) were randomly selected as the model’s input, and the safety production resilience was evaluated using the enterprise safety production resilience model. The results of the safety production resilience assessment of the abovementioned enterprises that are given in Table 3 show that the two companies have low levels of safety production resilience. After adopting relevant management measures, the safety production resilience of these two companies rose to the middle level at the end of August 2017. The large increase indicates that the evaluation of the enterprise safety production resilience model has achieved good practical results.
Table 3.
Model application results.
5. Conclusions
Due to the diversity and randomness of external stress factors and the requirement to restore the steady state in time after the external stress disappears, there are large pressures on the production safety of Chinese enterprises. This requires enterprises to effectively evaluate their resilience, predict development trends, and adopt effective prevention and control measures based on their own experience and skills.
The values of the factors influencing the resilience of enterprise safety production are input into the BP neural network model, and the level of resilience of safety production of enterprises can be evaluated and determined. If the level of enterprise safety production resilience is low, an early warning mechanism will be initiated, which may include the following: (1) an increase in the frequency and number of inspections for low-impact factors, and (2) publishing the level of safety production resilience of enterprises that have been at a low level for a long time, and improving the level of safety production resilience of enterprises by means of market.
The high-precision, high-stability, and generalized enterprise safety production resilience evaluation model based on gray correlation analysis and the BP neural network solves the complex problem of determining internal influencing factors and realizes the initial weight and threshold of each factor. The overall optimization of the company provides a reliable basis for decision-making regarding enterprise safety production resilience.
It should be pointed out that the innovative point of this research on the enterprise safety market from the perspective of safety toughness is the perspective and method of looking at the problem. Although safety toughness as a new theoretical paradigm, it still has some defects, such as the uncertain time nodes of the four stages of its evolution process and the unquantified value of the resilience of the evolution process; its theoretical impact and the theoretical significance of the paradigm transformation are not clear. In practice, in order to improve the accuracy and scope of the application of the model, it is necessary to increase the volume of data of relevant indicators of industries and enterprises in China and constantly improve the data structure.
Author Contributions
J.P. contributed to the theory of the study and contributed significantly to analysis and manuscript preparation. W.L. performed the data analyses, wrote the manuscript and helped perform the analysis with constructive discussions.
Funding
This research was funded by the National Key Technologies Research and Development Program of China (No.2017YFC0804900). And the APC was funded by Fundamental Research Funds for the Central Universities.
Conflicts of Interest
We have no conflict of interest to declare.
References
- Bergström, J.; van Winsen, R.; Henriqson, E. On the rationale of resilience in the domain of safety: A literature review. Reliab. Eng. Syst. Saf. 2015, 141, 131–141. [Google Scholar] [CrossRef]
- Dekker, S. Drift into Failure: From Hunting Broken Components to Understanding Complex. Systems; Ashgate Publishing Ltd.: Farnham, UK, 2012. [Google Scholar]
- Pęciłło, M. The resilience engineering concept in enterprises with and without occupational safety and health management systems. Saf. Sci. 2016, 82, 190–198. [Google Scholar] [CrossRef]
- Woods, D.D. Creating Foresight: How Resilience Engineering Can Transform NASA’s Approach to Risky Decision Making. Testimony on the Future of NASA for Committee on Commerce. Science and Transportation, John Mc Cain, Chair. 2003. Available online: https://www.researchgate.net/publication/237353911_Creating_Foresight_How_Resilience_Engineering_Can_Transform_NASA’s_Approach_to_Risky_Decision_Making (accessed on 15 April 2019).
- Tveiten, C.K.; Albrechtsen, E.; Wærø, I.; Wahl, A.M. Building resilience in to emergency management. Saf. Sci. 2012, 50, 1960–1966. [Google Scholar] [CrossRef]
- Huber, G.J.; Gomes, J.O.; de Carvalho, P.V. A program to support the construction and evaluation of resilience indicators. Work 2012, 41 (Suppl. 1), 2810–2816. [Google Scholar]
- Huang, L.; Wu, C.; Wang, B. Modeling on shaping and assessment of system safety resilience. J. Saf. Sci. Technol. 2016, 12, 15–21. [Google Scholar]
- Pimm, S.L. The complexity and stability of ecosystems. Nature 1984, 307, 321–326. [Google Scholar] [CrossRef]
- Holling, C.S. Resilience and stability of ecological systems. Annu. Rev. Ecol. Syst. 1973, 4, 12–23. [Google Scholar] [CrossRef]
- Ge, Y.; Shi, P.; Xu, W.; Liu, J.; Qian, Y.; Chen, L. New progress and review on resilience research. J. Catastrophol. 2010, 25, 119–124. [Google Scholar]
- Hollnagel, E.; Woods, D. Epilogue: Resilience Engineering-Concept Sand Precepts; Ashgate Publishing: Aldershot, UK, 2006; pp. 347–358. [Google Scholar]
- Speranze, C.I.; Wiesmann, U.; Rist, S. An indicator framework for assessing livelihood resilience in the context of social-ecological dynamics. Glob. Environ. Chang. 2004, 28, 109–119. [Google Scholar] [CrossRef]
- Hollnagel, E. IO07 presentation: Resilience Engineering and Proactive Safety Management, presentation held at the IO07. In Proceedings of the 3rd International Conference on Integrated Operations in the Petroleum Industry, Trondheim, Norway, 2–3 October 2007. [Google Scholar]
- The White House. Presidential Policy Directive (PDD)-21: Critical in Frastructure Security and Resilience; The White House: Washington, DC, USA, 2003.
- United Nations Office for Disaster Risk Reduction (UNISDR). Disaster Risk and Resilience. U N System Task Force on the Post-2015 UN Development Agenda; UNISDR: Geneva, Switzerland, 2012. [Google Scholar]
- Xu, R.; Liu, M.; Yao, W. Systemic risk from the perspective of financial ecological resilience. Syst. Eng. 2017, 35, 30–35. [Google Scholar]
- Shi, Y.; Li, J. MATLAB Language TOOLBOX—TOOLBOX Practical Guide; Northwestern Polytechnical University Press: Xi’an, China, 1999. [Google Scholar]
- Liu, S. Grey System Theory and Its Application; Science Press: Beijing, China, 1999. [Google Scholar]
- Deng, J. Grey Prediction and Grey Decision; Huazhong University of Science and Technology Press: Wuhan, China, 2002. [Google Scholar]


© 2019 by the authors. Licensee MDPI, Basel, Switzerland. This article is an open access article distributed under the terms and conditions of the Creative Commons Attribution (CC BY) license (http://creativecommons.org/licenses/by/4.0/).