Sustainability Assessment of Smallholder Farmland Systems: Healthy Farmland System Assessment Framework


Abstract
:1. Introduction
2. Methodology
2.1. Construction of HFSAF
2.2. Designation of Indicator System
2.3. Regionalization of Indicator System
2.4. Method of Multi-Level Aggregation
2.5. Method of Composite Assessment
3. Study Area and Data
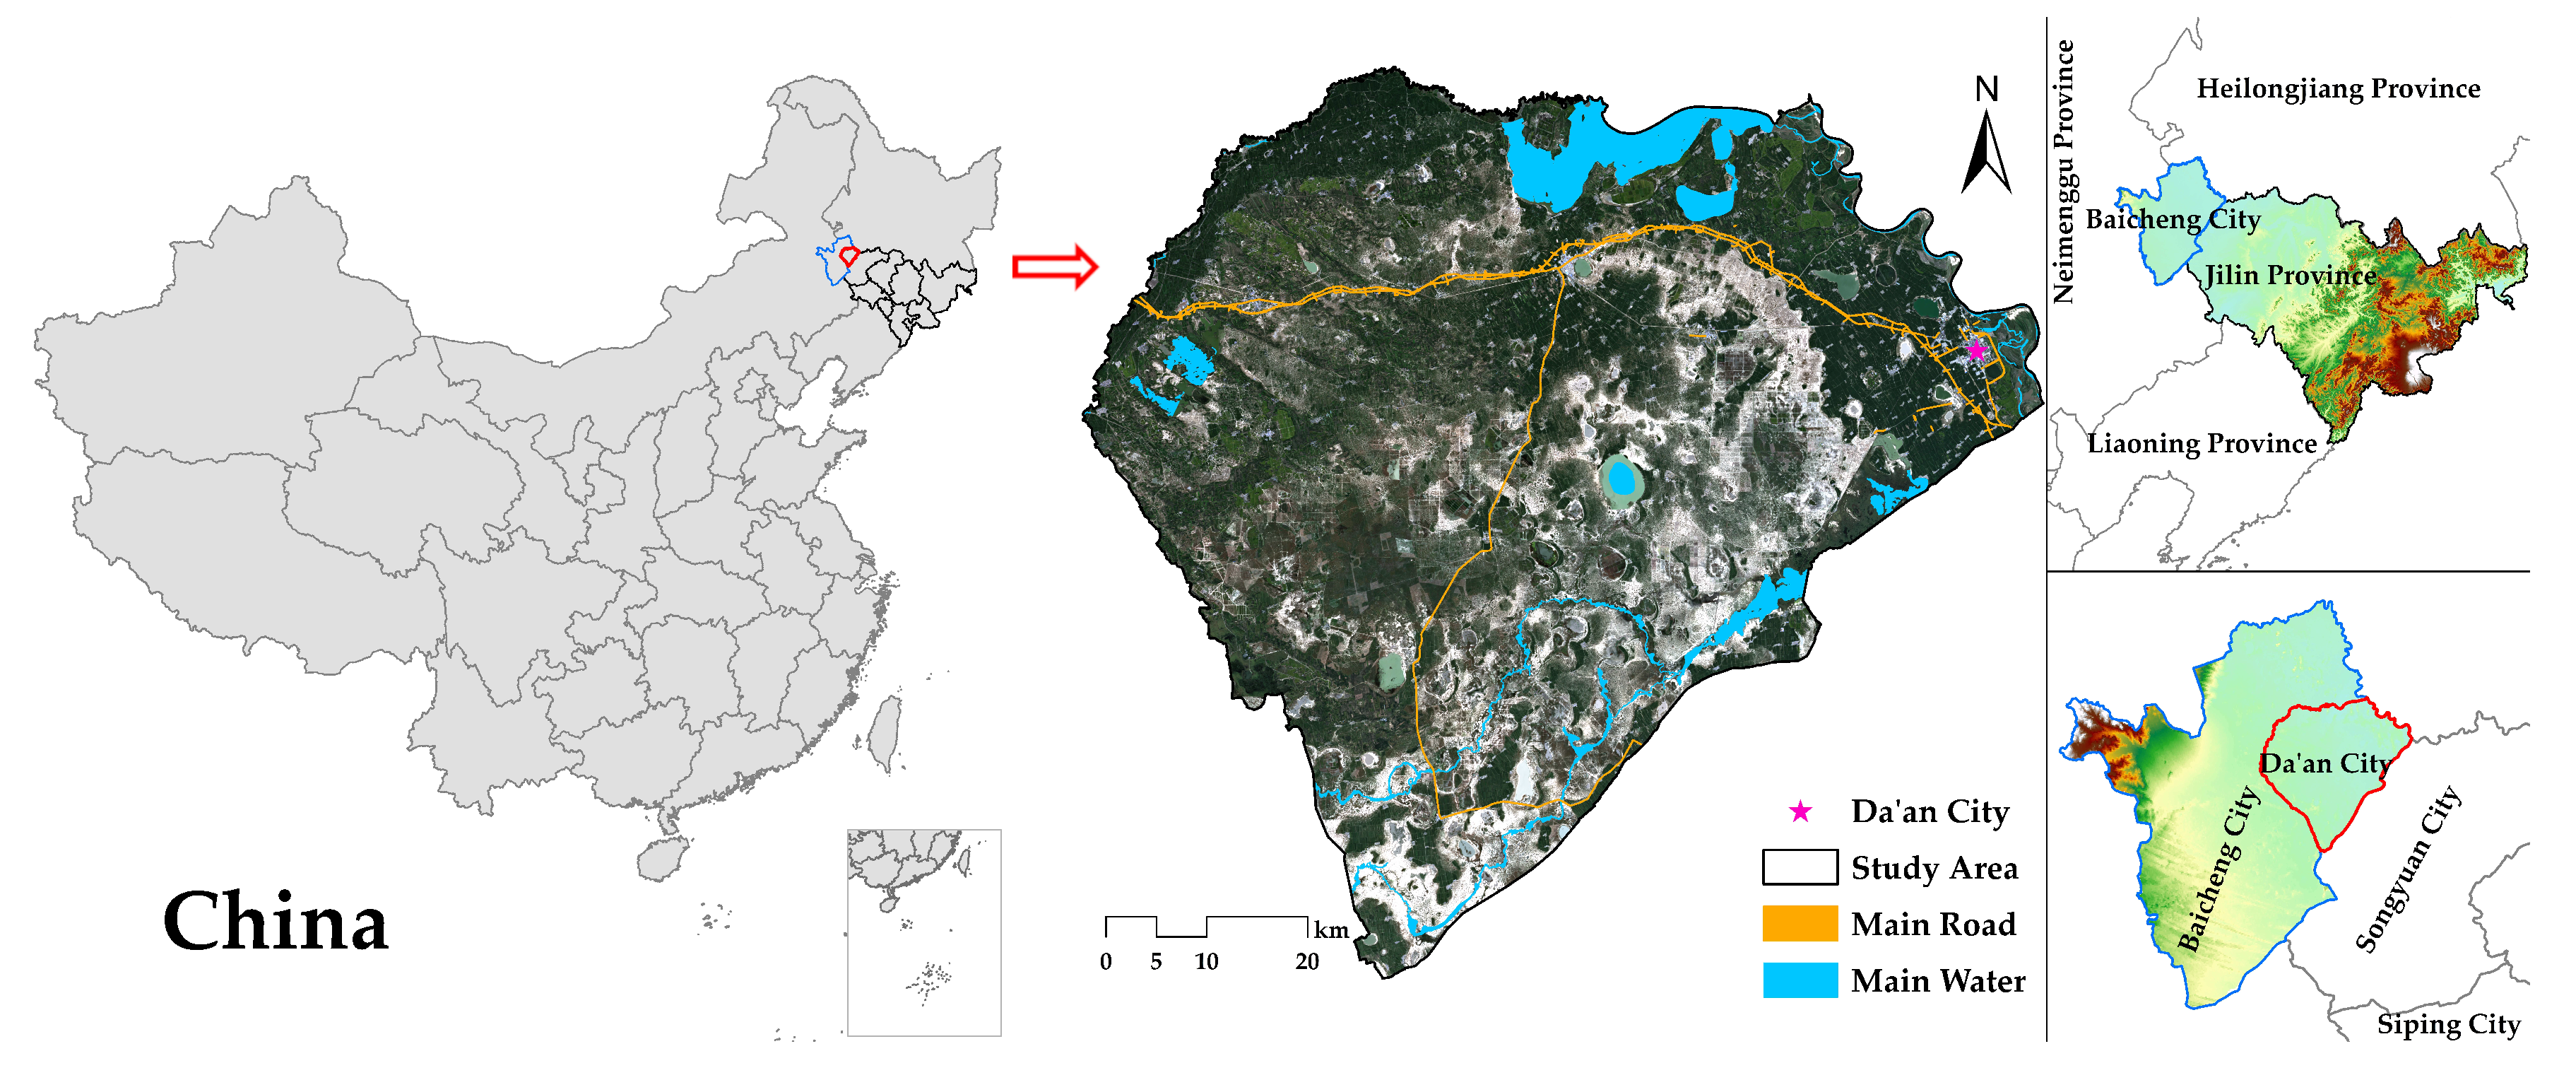
3.1. Study Area
3.2. Data and Processing
4. Results and Discussion
4.1. Necessary Weightings of HFSAF
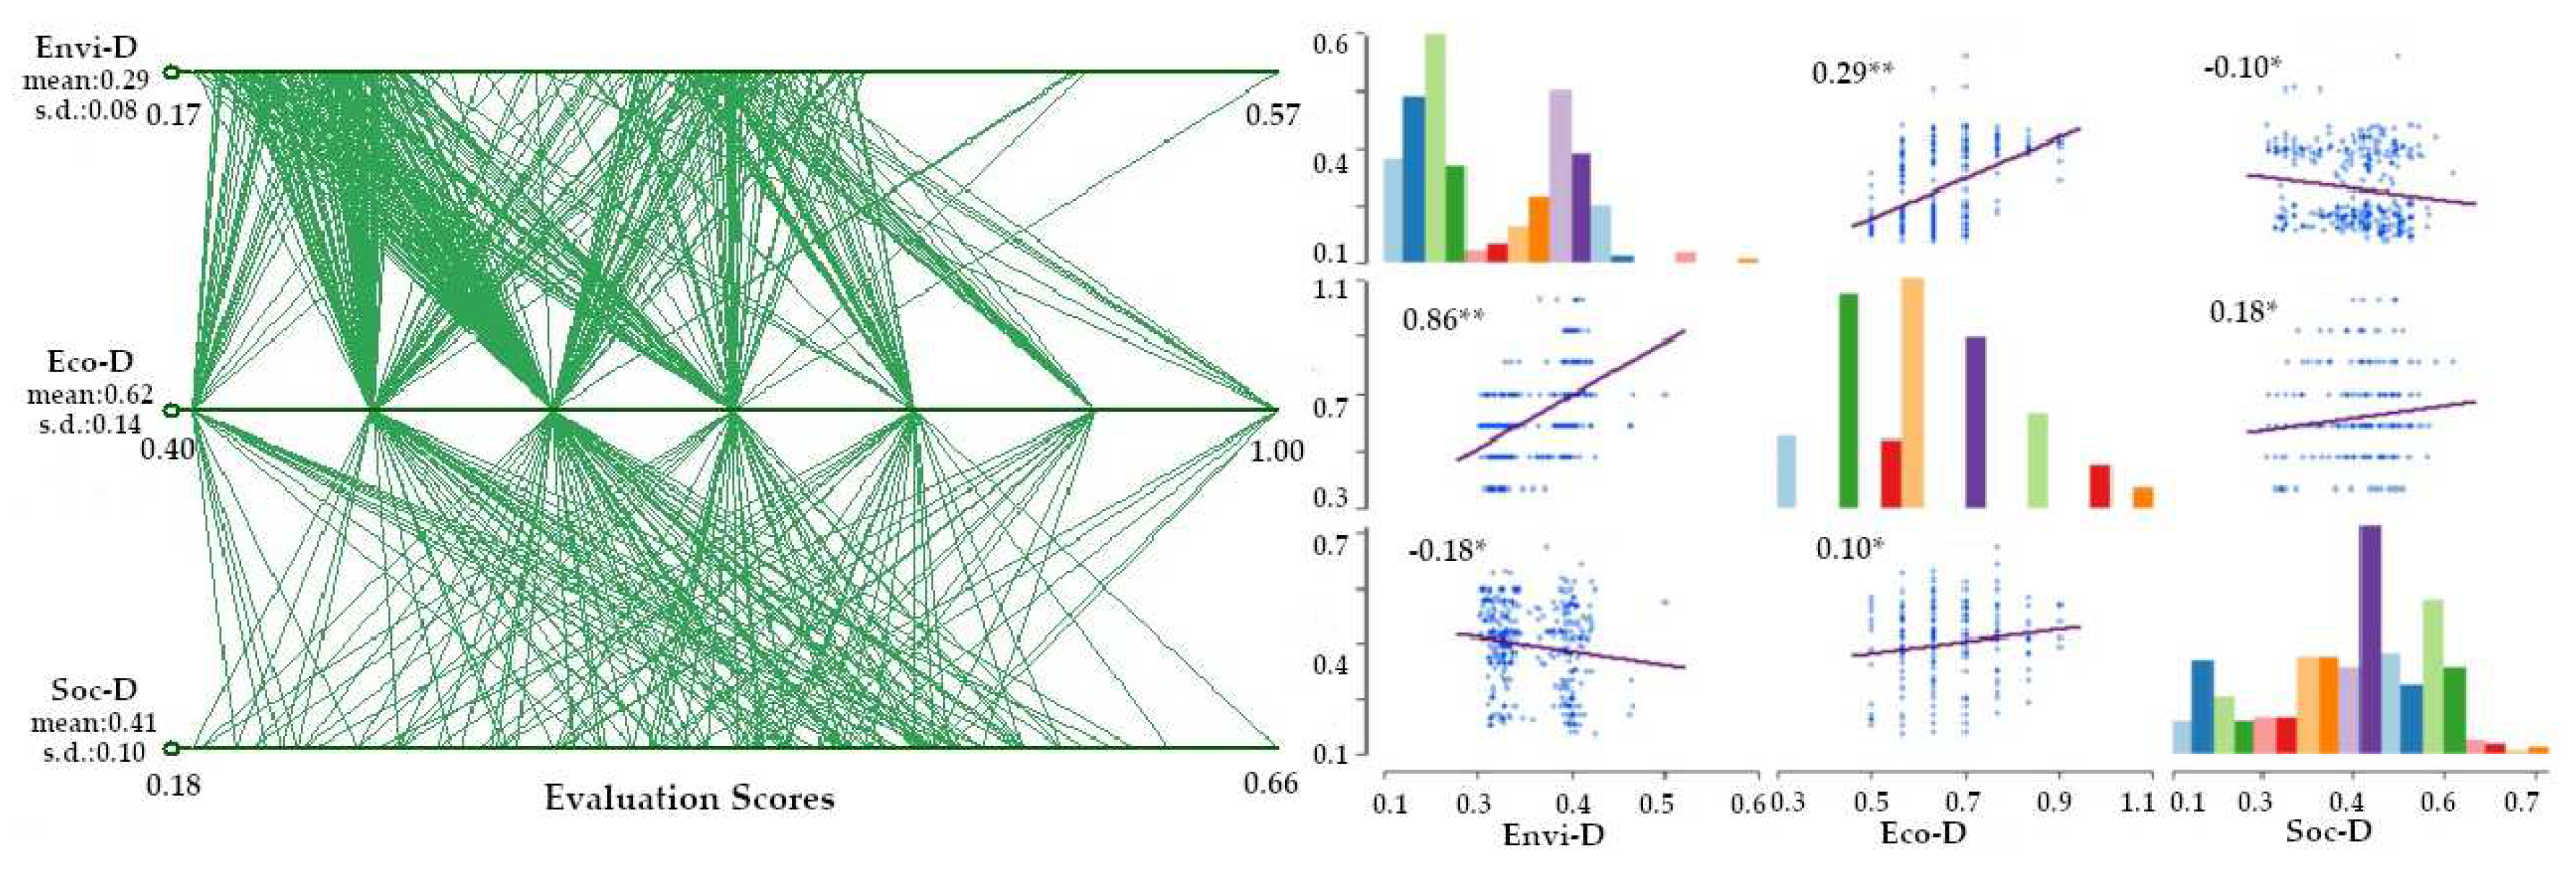
4.2. Composite Assessment of Indicator System
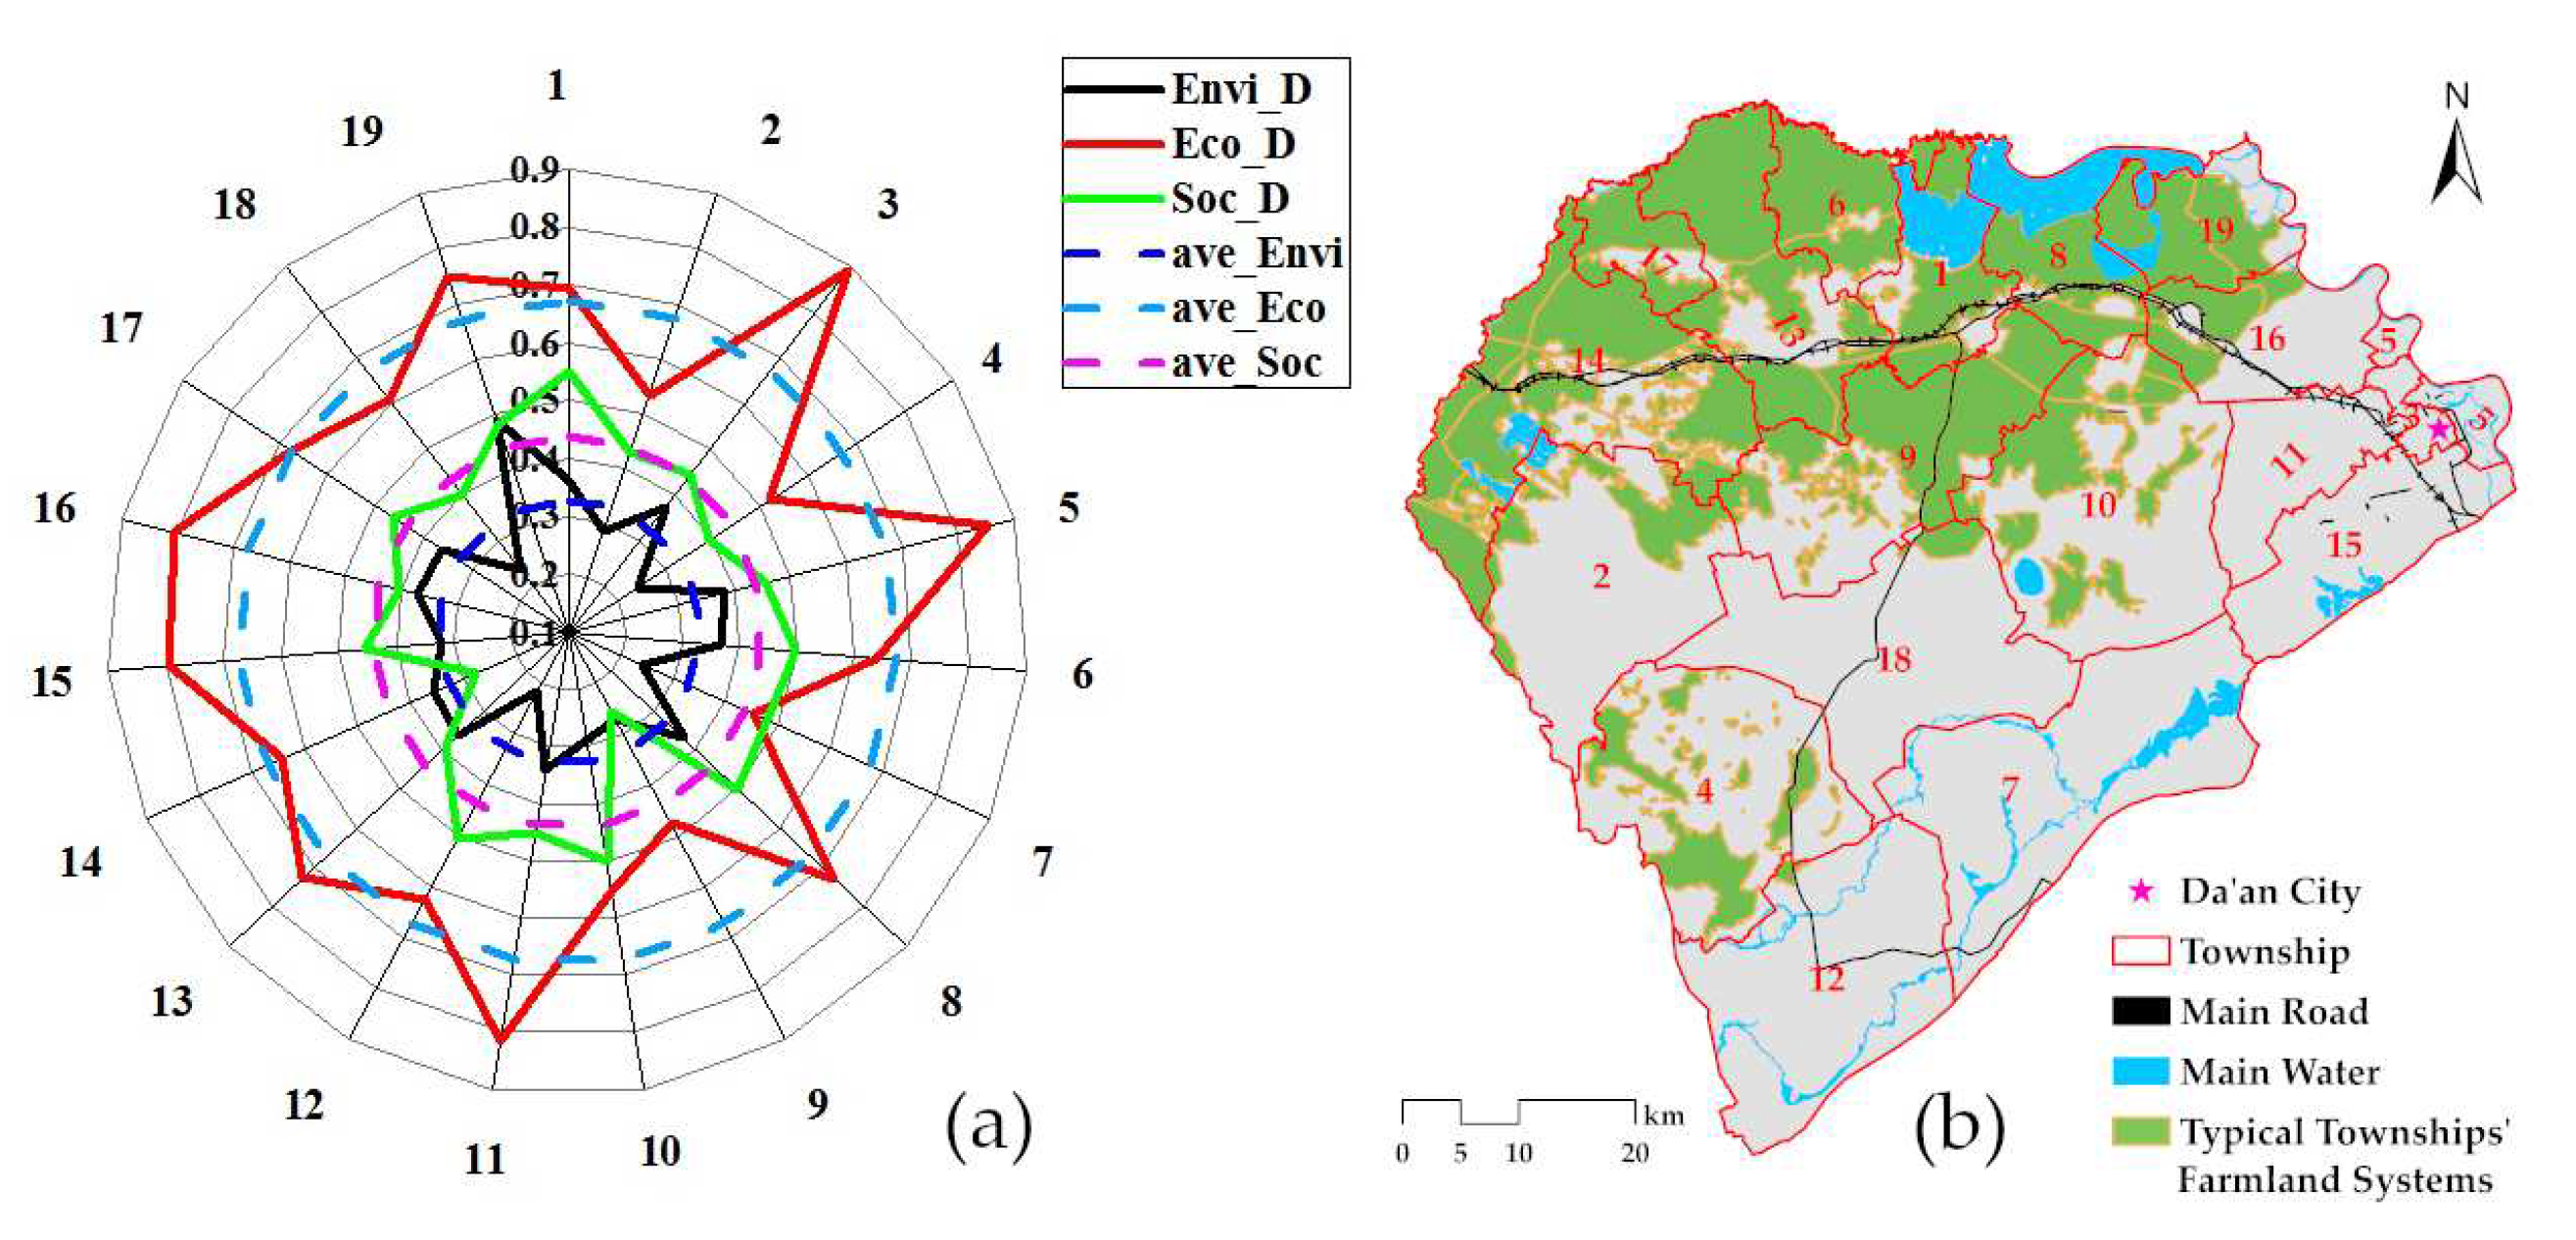
4.3. Multi-Level Refinement Analysis
4.4. Overall Discussion
5. Conclusions
Author Contributions
Funding
Acknowledgments
Conflicts of Interest
References
- Brown, L.R. Who Will Feed China; World Watch Institute: Washington, DC, USA, 1995. [Google Scholar]
- Brundtland, G.H.; Khalid, M.; Agnelli, S.; Al-Athel, S. Our Common Future; World Commission on Environment and Development: New York, NY, USA, 1987. [Google Scholar]
- United Nations. United Nations Sustainable Development Goals; The United Nations Conference on Sustainable Development: Rio de Janeiro, Brazil, 2012. [Google Scholar]
- Colglazier, W. Sustainable development agenda: 2030. Science 2015, 349, 1048–1050. [Google Scholar] [CrossRef] [PubMed]
- Tanaka, D.; Krupinsky, J.; Merrill, S.; Liebig, M.; Hanson, J. Dynamic cropping systems for sustainable crop production in the northern Great Plains. Agron. J. 2007, 99, 904–911. [Google Scholar] [CrossRef]
- Martínez-Castillo, R. Sustainable agricultural production systems. Rev. Technol. Marcha 2016, 29, 70–85. [Google Scholar]
- Andersen, E.; Baldock, D.; Bennett, H.; Beaufoy, G.; Bignal, E.; Bouwer, F.; Elbersen, B.; Eiden, G.; Giodeschalk, F.; Jones, G. Developing a High Nature Value Farming Area Indicator: Final Report; Wageningen Environmental Research: Wageningen, The Netherlands, 2004. [Google Scholar]
- Wenju, Y.; Huaizhi, T.; Mengyin, L.; Jinme, F. “13th Five-Year” land improvement plan: Ecological good land construction in a prominent position. Rural Work Bull. 2015, 7, 32–34. [Google Scholar]
- Ministry of Natural Resources of the People’s Republic of China. Rules of Well-Facilitied Farmland Construction (GB/T30600); MNR: Beijing, China, 2014. (In Chinese) [Google Scholar]
- Liding, C.; Bojie, F. Farm ecosystem management and control of nonpoint source pollution. Environm. Sci. 2000, 21, 98–100. [Google Scholar]
- Yanqing, C. A Cultivated Land Quality Evaluation Method Based on Multi-Scale Indicators’ System in Grid Environment; China Agricultural University: Beijing, China, 2015. [Google Scholar]
- Pengshan, L. Integrated Ecological Assessment of Farmland System and Trade-Offs Analysis of Functions; China Agricultural University: Beijing, China, 2017. [Google Scholar]
- Trivino-Tarradas, P.; Gomez-Ariza, M.R.; Basch, G.; Gonzalez-Sanchez, E.J. Sustainability assessment of annual and permanent crops: The Inspia model. Sustainability 2019, 11, 738. [Google Scholar] [CrossRef]
- Hani, F.; Braga, F.S.; Stampfli, A.; Keller, T.; Fischer, M.; Porsche, H. RISE, a tool for holistic sustainability assessment at the farm level. Int. Food Agribus. Manag. Rev. 2003, 6, 78–90. [Google Scholar]
- Zahm, F.; Viaux, P.; Vilain, L.; Girardin, P.; Mouchet, C. Assessing farm sustainability with the IDEA method—From the concept of agriculture sustainability to case studies on farms. Sustain. Dev. 2008, 16, 271–281. [Google Scholar] [CrossRef]
- Van Passel, S.; Meul, M. Multilevel and multi-user sustainability assessment of farming systems. Environ. Impact Assess. Rev. 2012, 32, 170–180. [Google Scholar] [CrossRef]
- Food and Agriculture Organization of the United Nations. SAFA. Sustainability Assessment of Food and Agriculture Systems. TOOL. User Manual Beta Version 2.1.50; FAO: Rome, Italy, 2014. [Google Scholar]
- Peano, C.; Tecco, N.; Dansero, E.; Girgenti, V.; Sottile, F. Evaluating the sustainability in complex agri-food systems: The SAEMETH framework. Sustainability 2015, 7, 6721–6741. [Google Scholar] [CrossRef]
- Van Cauwenbergh, N.; Biala, K.; Bielders, C.; Brouckaert, V.; Franchois, L.; Cidad, V.G.; Hermy, M.; Mathijs, E.; Muys, B.; Reijnders, J. SAFE—A hierarchical framework for assessing the sustainability of agricultural systems. Agric. Ecosyst. Environ. 2007, 120, 229–242. [Google Scholar] [CrossRef]
- Paracchini, M.L.; Bulgheroni, C.; Borreani, G.; Tabacco, E.; Banterle, A.; Bertoni, D.; Rossi, G.; Parolo, G.; Origgi, R.; De Paola, C. A diagnostic system to assess sustainability at a farm level: The SOSTARE model. Agric. Syst. 2015, 133, 35–53. [Google Scholar] [CrossRef]
- De Luca, A.I.; Falcone, G.; Stillitano, T.; Iofrida, N.; Strano, A.; Gulisano, G. Evaluation of sustainable innovations in olive growing systems: A life cycle sustainability assessment case study in southern Italy. J. Clean. Prod. 2018, 171, 1187–1202. [Google Scholar] [CrossRef]
- Król, A.; Księżak, J.; Kubińska, E.; Rozakis, S. Evaluation of sustainability of maize cultivation in Poland: A prospect Theory—PROMETHEE approach. Sustainability 2018, 10, 4263. [Google Scholar] [CrossRef]
- Smyth, A.; Dumanski, J. FESLM: An International Framework for Evaluating Sustainable Land Management; FAO: Rome, Italy, 1993. [Google Scholar]
- Van Ittersum, M.K.; Ewert, F.; Heckelei, T.; Wery, J.; Olsson, J.A.; Andersen, E.; Bezlepkina, I.; Brouwer, F.; Donatelli, M.; Flichman, G. Integrated assessment of agricultural systems—A component-based framework for the European Union (SEAMLESS). Agric. Syst. 2008, 96, 150–165. [Google Scholar] [CrossRef]
- Ripoll-Bosch, R.; Díez-Unquera, B.; Ruiz, R.; Villalba, D.; Molina, E.; Joy, M.; Olaizola, A.; Bernués, A. An integrated sustainability assessment of mediterranean sheep farms with different degrees of intensification. Agric. Syst. 2012, 105, 46–56. [Google Scholar] [CrossRef]
- Rigby, D.; Woodhouse, P.; Young, T.; Burton, M. Constructing a farm level indicator of sustainable agricultural practice. Ecol. Econ. 2001, 39, 463–478. [Google Scholar] [CrossRef]
- Nambiar, K.; Gupta, A.; Fu, Q.; Li, S. Biophysical, chemical and socio-economic indicators for assessing agriculture sustainability in the Chinese coastal zone. Agric. Ecosyst. Environ. 2001, 87, 209–214. [Google Scholar] [CrossRef]
- Pacini, C.; Lazzerini, G.; Migliorini, P.; Vazzana, C. An indicator-based framework to evaluate sustainability of farming systems: Review of applications in Tuscany. Ital. J. Agron. 2009, 4, 23–40. [Google Scholar] [CrossRef]
- Van Passel, S.; Nevens, F.; Mathijs, E.; Van Huylenbroeck, G. Measuring farm sustainability and explaining differences in sustainable efficiency. Ecol. Econ. 2007, 62, 149–161. [Google Scholar] [CrossRef]
- Bohanec, M.; Cortet, J.; Griffiths, B.; Žnidaršič, M.; Debeljak, M.; Caul, S.; Thompson, J.; Krogh, P.H. A qualitative multi-attribute model for assessing the impact of cropping systems on soil quality. Pedobiologia 2007, 51, 239–250. [Google Scholar] [CrossRef]
- Gómez-Limón, J.A.; Sanchez-Fernandez, G. Empirical evaluation of agriculture sustainability using composite indicators. Ecol. Econ. 2010, 69, 1062–1075. [Google Scholar] [CrossRef]
- Dantsis, T.; Douma, C.; Giourga, C.; Loumou, A.; Polychronaki, E.A. A methodological approach to assess and compare the sustainability level of agricultural plant production systems. Ecol. Indic. 2010, 10, 256–263. [Google Scholar] [CrossRef]
- Lebacq, T.; Baret, P.V.; Stilmant, D. Sustainability indicators for livestock farming. A review. Agron. Sustain. Dev. 2013, 33, 311–327. [Google Scholar] [CrossRef]
- Van Asselt, E.; Van Bussel, L.; Van der Voet, H.; Van der Heijden, G.; Tromp, S.; Rijgersberg, H.; Van Evert, F.; Van Wagenberg, C.; Van der Fels-Klerx, H. A protocol for evaluating the sustainability of agri-food production systems—A case study on potato production in peri-urban agriculture in The Netherlands. Ecol. Indic. 2014, 43, 315–321. [Google Scholar] [CrossRef]
- Boyle, P.; Hayes, M.; Gormally, M.; Sullivan, C.; Moran, J. Development of a nature value index for pastoral farmland—A rapid farm-level assessment. Ecol. Iindic. 2015, 56, 31–40. [Google Scholar] [CrossRef]
- Lynch, J.; Donnellan, T.; Finn, J.A.; Dillon, E.; Ryan, M. Potential development of Irish agriculture sustainability indicators for current and future policy evaluation needs. J. Environ. Manag. 2019, 230, 434–445. [Google Scholar] [CrossRef]
- Slätmo, E.; Fischer, K.; Röös, E.J.S.R. The framing of sustainability in sustainability assessment frameworks for agriculture. Sociol. Rural. 2017, 57, 378–395. [Google Scholar] [CrossRef]
- Meul, M.; Van Passel, S.; Nevens, F.; Dessein, J.; Rogge, E.; Mulier, A.; Van Hauwermeiren, A. MOTIFS: A monitoring tool for integrated farm sustainability. Agron. Sustain. Dev. 2008, 28, 321–332. [Google Scholar] [CrossRef]
- Wenju, Y.; Mengyin, L.; Huaizhi, T. Improving the quality of arable land focuses on building healthy production capacity. China Land 2015, 3, 22–23. [Google Scholar]
- Xingqing, Y. Evolution track, the policy choice of getting rid of the dilemma and changing the mode of agricultural development in China. Refrom 2016, 6, 22–39. [Google Scholar]
- Dalsgaard, K. Defining soil quality for a sustainable environment. Geoderma 1995, 66, 163–164. [Google Scholar] [CrossRef]
- Food and Agriculture Organization of the United Nations. Current World Fertilizer Trends and Outlook to 2015; FAO: Rome, Italy, 2013; Volume 5. [Google Scholar]
- Li, Q.; Su, Q.; Zhao, Y.; Yun, W.-J.; Sun, L.; Li, W.-Y.; Li, T.-J. Exploration of the evaluation system and method for agriculture land health in Suburb based on land productivity. Geogr. Geo-Inf. Sci. 2008, 24, 70–74. [Google Scholar]
- Food and Agriculture Organization of the United Nations. Global Soil Health Indicators and Assessment; FAO: Rome, Italy, 2011. [Google Scholar]
- Ministry of Nature Resources of the Republic of China. Specification of Land Quality Geochemical Evaluation Chinese National Standard Agency (DZ/T 0295-2016); MNR: Beijing, China, 2016. (In Chinese) [Google Scholar]
- Bünemann, E.K.; Bongiorno, G.; Bai, Z.; Creamer, R.E.; De Deyn, G.; de Goede, R.; Fleskens, L.; Geissen, V.; Kuyper, T.W.; Mäder, P.; et al. Soil quality—A critical review. Soil Biol. 2018, 120, 105–125. [Google Scholar] [CrossRef]
- Chen, L.; Fu, N.; Zhao, W. Source-sink landscapetheory and itsecologicalsignificance. Acta Ecol. Sin. 2006, 26, 1444–1449. [Google Scholar]
- Ministry of Environmental Protection of the people’s Republic of China. Soil Environmental Quality-Risk Control Standard for Soil Contamination of Agriculture Land (GB15618-2018); MEP: Beijing, China, 2018. (In Chinese)
- Ministry of Environmental Protection of the People’s Republic of China. Environmental Quality Evaluation Standards for Farmland of Edible Agricultural Products (HJ/T 332-2006); MEP, China Environmental Science: Beijing, China, 2006. (In Chinese)
- Lv, Y.; Yun, W.; Zhang, C.; Zhu, D.; Yang, J.; Chen, Y. Multi-characteristic comprehensive recognition of well-facilitied farmland based on TOPSIS and BP neural network. Trans. Chin. Soc. Agric. Mach. 2018, 49, 196–204. [Google Scholar]
- Van der Werf, H.M.; Petit, J. Evaluation of the environmental impact of agriculture at the farm level: A comparison and analysis of 12 indicator-based methods. Agric. Ecosyst. Environ. 2002, 93, 131–145. [Google Scholar] [CrossRef]
- Ministry of Water Resources of the People’s Republic of China. National Professional Standards for Classification and Gradation of Soil Erosion (SL190-2007); China Hydraulic and Hydropower Press: Beijing, China, 2007. (In Chinese) [Google Scholar]
- Ministry of Ecology and Environment of the People’s Republic of China. Standards for Irrigation Water Quality (GB 5084-2005); MEE: Beijing, China, 2005. (In Chinese)
- Ministry of Agriculture and Rural Affairs of the People’s Republic of China. Procedural Regulation Regarding the Environment Quality Monitoring of Air in Agricultural Regions (NY/T 397-2000); MARA: Beijing, China, 2000. (In Chinese)
- Ministry of Ecology and Environment of the People’s Republic of China. Technical Criterion for Ecosystem Status Evaluation (HJ 192-2015); MEE: Beijing, China, 2015. (In Chinese)
- Edwards, W.; Barron, F.H. SMARTS and SMARTER: Improved simple methods for multiattribute utility measurement. Organ. Behav. Hum. Decis. Process. 1994, 60, 306–325. [Google Scholar] [CrossRef]


| Scientific Theory | Stressed Sustainability Theme |
|---|---|
| Healthy farmland [8] | Production function, quality of agro-products, self-regulation ability |
| Healthy production capacity [39,40] | Soil environment, landscape environment, natural production resources, engineering facilities resources, self-regulation ability, utilization intensity, quality of agro-products, production function, ecological safety, welfare of members |
| Soil quality [41] | Ecological function, production function, soil environment, landscape environment, member well-being |
| Soil health [42] | Production function, ecological function, environmental quality, member welfare |
| Cultivated land health [43] | Production function, ecological function, environmental quality, quality of agro-products, self-regulation ability |
| Dimension | Vision | Theme | Sub-Theme | Basic Indicator |
|---|---|---|---|---|
| Environmental (Envi-D) | Ecological-security | Soil-environment-quality | Soil-cleanliness; Soil-organic-matter-degradation-degree; Soil-PH; Soil-salinization-degree; Soil-erosion-degree | |
| Landscape-environment-quality | Irrigation-water-environment; Atmospheric-bulk-deposition; Historical-meteorological-disaster-rate | |||
| Production-resource | Natural-resource | Cultivated-land- quantity-retention-rate | Cultivated-land-perennial-average-reduction-rate | |
| Engineering-facility | Soil-basic-productivity | Soil-productivity; Feasible-productive-capacity | ||
| Ditch | Ditch-density | |||
| Road | Road-accessibility | |||
| Shelterbelt | Shelterbelt-density | |||
| Field | Field-conditions | |||
| Management | Use-intensity | Cultivation-intensity | ||
| Planting-structure | Crop-abundance | |||
| System-elastic | Production-function-sustainability | Soil-productivity-fluctuation; Potential-productivity | ||
| Ecology-function-sustainability | Pedodiversity; Soil-microbial-activity; Soil-texture; Soil-organic-matter; Agrobiodiversity; Wetland-proportion; Emi-Natural-buffer-proportion; Soil-water-conservation-capacity; Gas-regulation-capacity; Environmental-purification-capacity | |||
| System-self-regulation-ability | Terrain; Landscape-diversity; Landscape-heterogeneity; Vegetation-coverage; Source-Sink-landscape-area-ratio | |||
| Economic (Eco-D) | Economic-benefit | Economic-benefit | Average-annual-output | |
| Economic-stability | Economic-stability | Per-capita-GDP | ||
| Social (Soc-D) | Member-welfare | Member-welfare | Per-capita-income | |
| Agro-product-quality | Agro-product-security | Food-safety | ||
| Agro-product-character | Main-nutrient-content | |||
| Agro-activity-dependence | Agro-activity-dependence | Agricultural-labor-proportion | ||
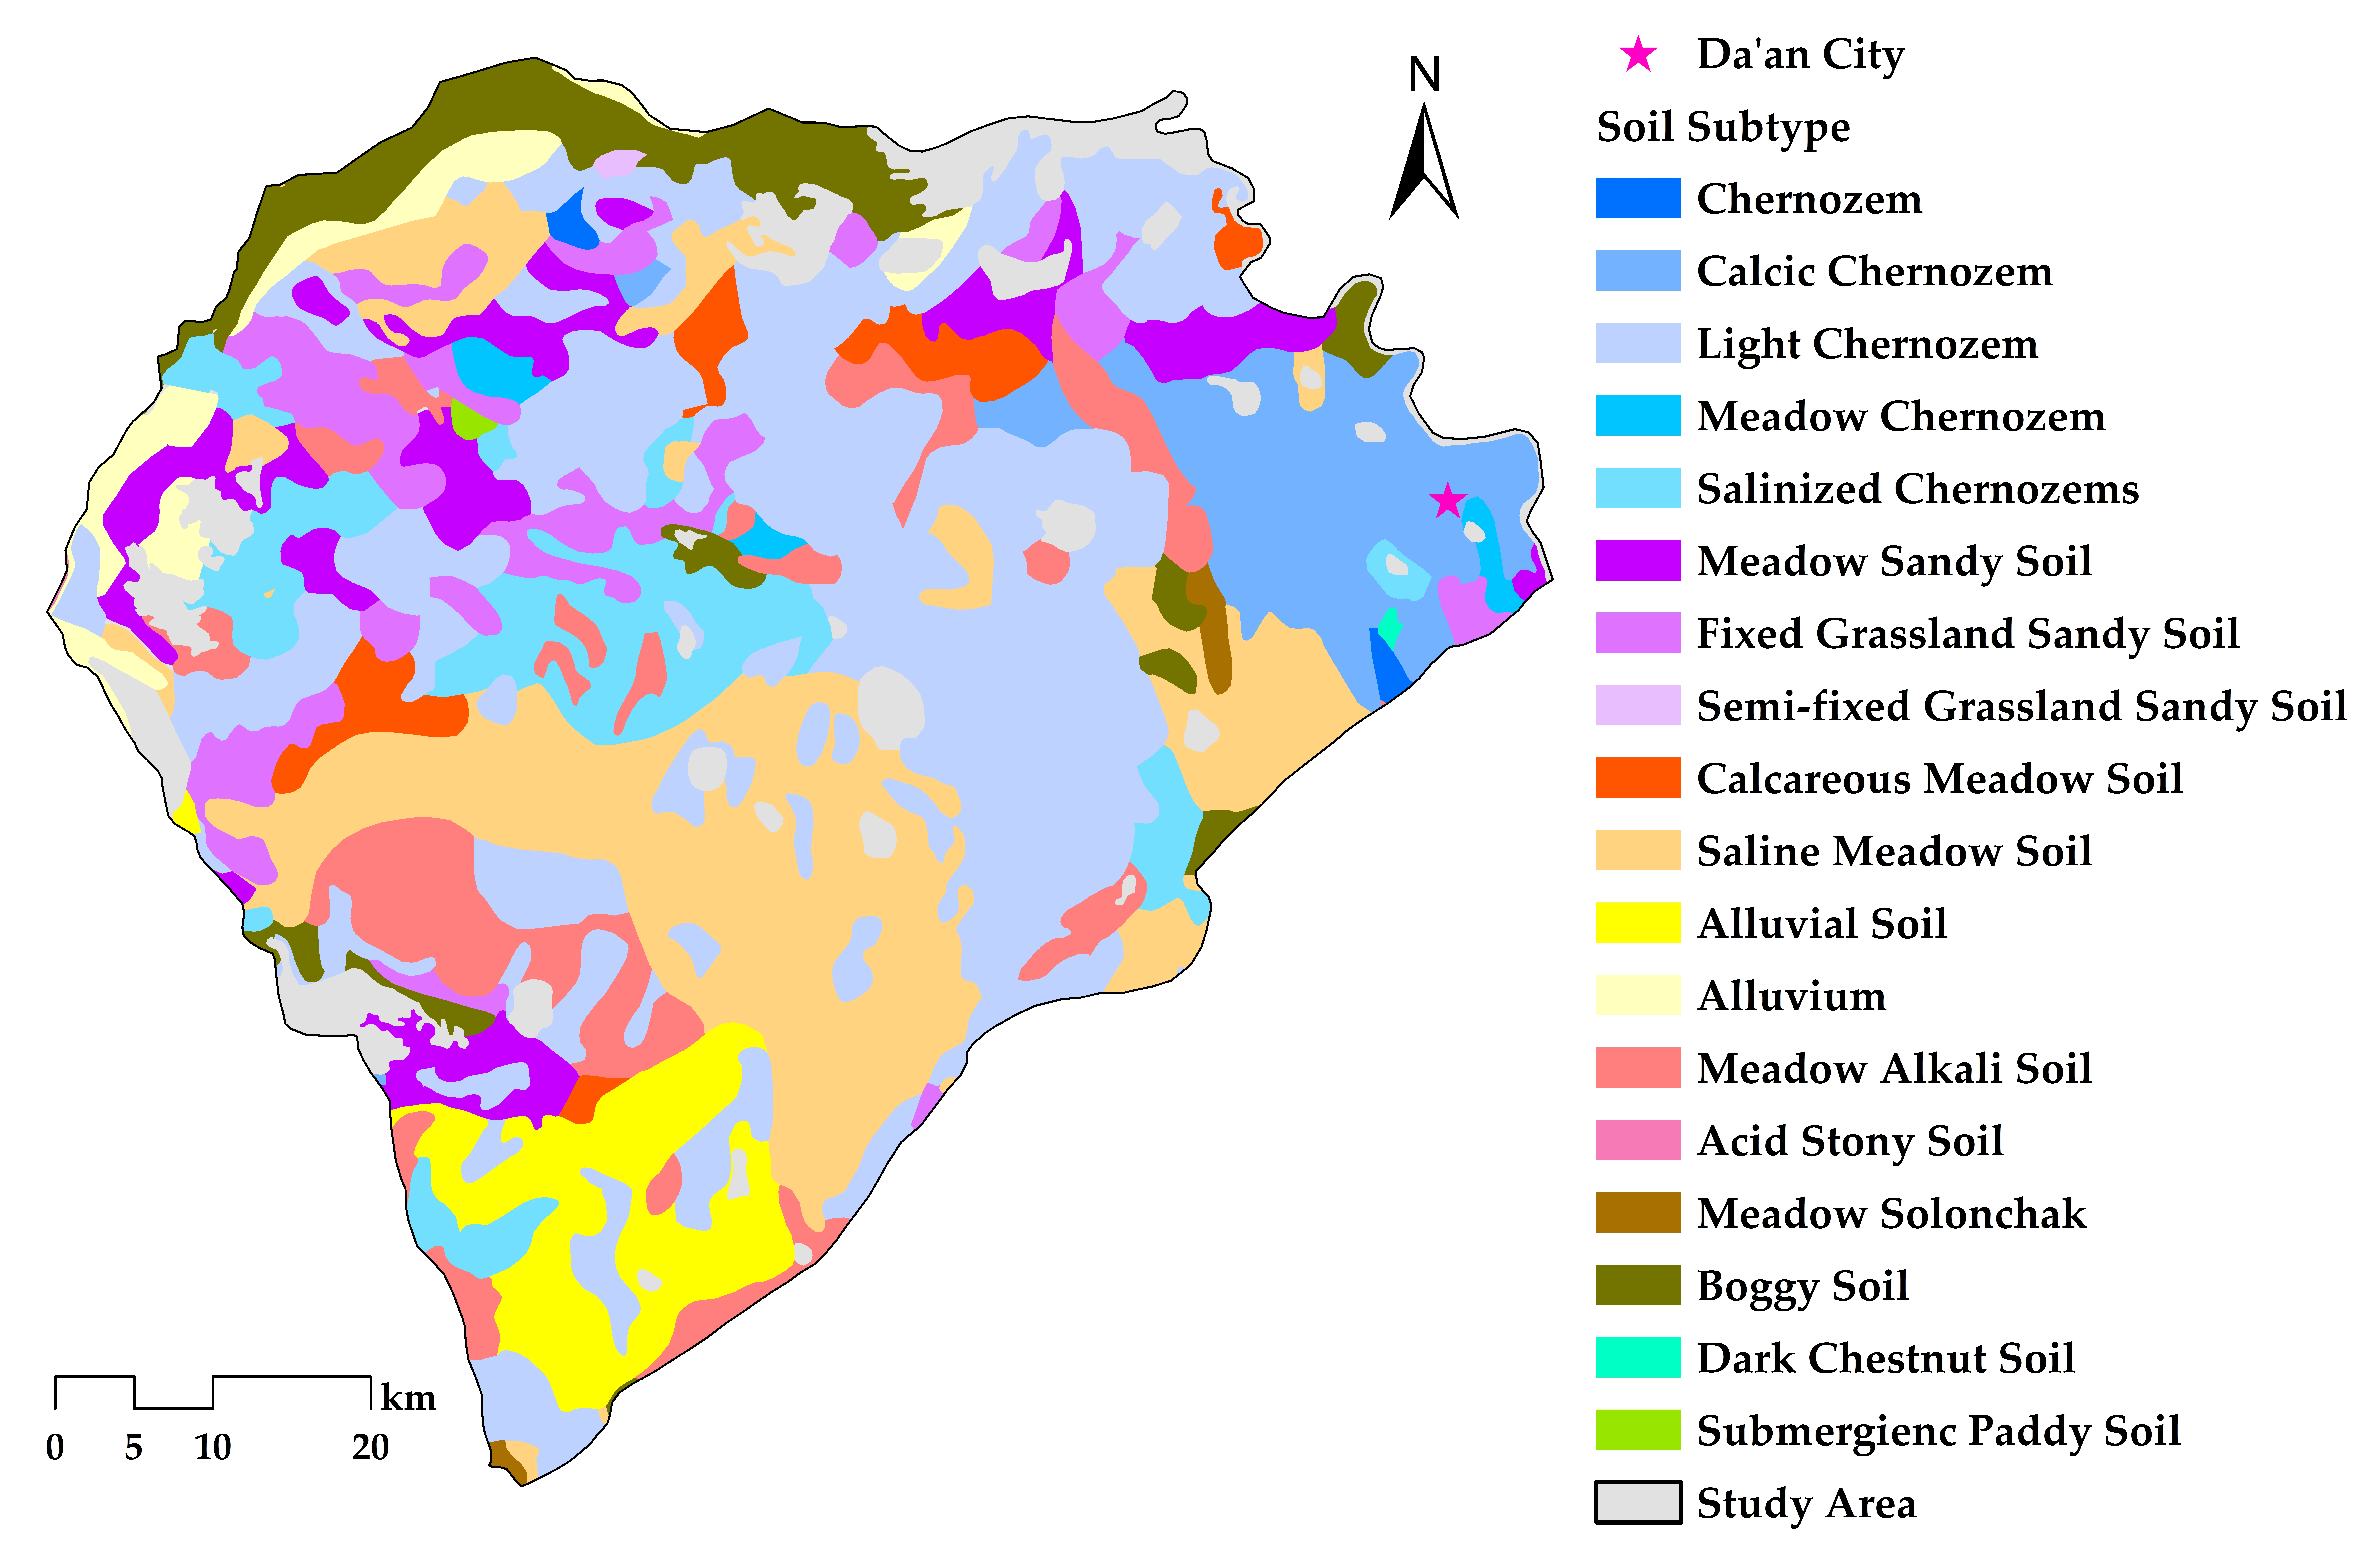
| Soil Type | Soil Subtype | Area (ha) | Summation (ha) |
|---|---|---|---|
| Chernozem | Chernozem | 1354.64 | 198,803.39 |
| Calcic Chernozem | 34,280.55 | ||
| Light Chernozem | 130,613.35 | ||
| Meadow Chernozem | 3364.83 | ||
| Salinized Chernozems | 29,190.02 | ||
| Sandy Soil | Meadow Sandy Soil | 25,235.59 | 54,003.52 |
| Fixed Grassland Sandy Soil | 28,354.89 | ||
| Semi-fixed Grassland Sandy Soil | 413.04 | ||
| Meadow Soil | Calcareous Meadow Soil | 13,941.96 | 115,781.26 |
| Saline Meadow Soil | 101,839.30 | ||
| Alluvial Soil | Alluvial Soil | 26,701.07 | 39,736.32 |
| Alluvium | 13,035.25 | ||
| Alkali Soil | Meadow Alkali Soil | 36,897.74 | 36,897.74 |
| Stony Soil | Acid Stony Soil | 35.48 | 35.48 |
| Solonchak | Meadow Solonchak | 1601.59 | 1601.59 |
| Boggy Soil | 24,927.55 | 24,927.55 | |
| Chestnut Soil | Dark Chestnut Soil | 243.87 | 243.87 |
| Paddy Soil | Submergienc Paddy Soil | 442.31 | 442.31 |
© 2019 by the authors. Licensee MDPI, Basel, Switzerland. This article is an open access article distributed under the terms and conditions of the Creative Commons Attribution (CC BY) license (http://creativecommons.org/licenses/by/4.0/).
Share and Cite
Lv, Y.; Zhang, C.; Ma, J.; Yun, W.; Gao, L.; Li, P. Sustainability Assessment of Smallholder Farmland Systems: Healthy Farmland System Assessment Framework. Sustainability 2019, 11, 4525. https://doi.org/10.3390/su11174525
Lv Y, Zhang C, Ma J, Yun W, Gao L, Li P. Sustainability Assessment of Smallholder Farmland Systems: Healthy Farmland System Assessment Framework. Sustainability. 2019; 11(17):4525. https://doi.org/10.3390/su11174525
Chicago/Turabian StyleLv, Yahui, Chao Zhang, Jiani Ma, Wenju Yun, Lulu Gao, and Pengshan Li. 2019. "Sustainability Assessment of Smallholder Farmland Systems: Healthy Farmland System Assessment Framework" Sustainability 11, no. 17: 4525. https://doi.org/10.3390/su11174525