1. Introduction
Global climate change attracts interest from the government and the scientific community [
1]. Carbon emissions are widely regarded as a leading cause of climate change. From an industrial perspective, the construction sector has gradually become a major source of carbon emissions in recent years. Therefore, reducing the carbon emissions caused by the construction sector is a major challenge in mitigating climate change [
2].
To estimate the carbon emissions from residential buildings in different periods, previous research has performed extensive life cycle assessments [
3,
4]. Such research has demonstrated that the majority of carbon emissions arise during the operation period [
5,
6,
7]. Therefore, research on carbon emissions reduction has focused on exercising control over emissions from residential buildings during the operation period [
8].
At the spatial–temporal scale, carbon emissions from residential buildings during the operation period stem from activities such as heating, cooking, and cooling [
9,
10]. Carbon emissions from different types of activities have noticeable differences given the geographic heterogeneity of climate and development. For instance, carbon emissions during a long heating period are a major source in cold regions. Such a problem is particularly noticeable in north China, where cold regions are concentrated. Therefore, research on the prediction of peak carbon emissions and reduction pathways in residential buildings during operation is a key issue to control carbon emissions in China. Hence, this research focuses on two questions. First, the factors influencing carbon emissions from residential buildings during the operation stage should be identified. Second, how to propose reduction pathways and measure the availability of these pathways in cold regions should be studied.
The impact of influencing factors on carbon emissions and the prediction of peak emissions have been widely discussed [
11]. In summary, the existing research has covered three fields, namely, identifying impact factors, calculating the contribution of factors, and predicting emissions.
In the first field, existing research has shown that influencing factors included population, urban scale, economic development, construction area per person, structure of energy end use, carbon intensity, and habit of energy end use [
12,
13]. Nejat et al. [
14] demonstrated the current tendencies of carbon emissions, energy consumption, and energy policy in residential building sectors in the global top 10 emitters. The results showed that population, urbanization, and economic development led to an accelerated increase in carbon emissions from the residential building sector in developing countries. Meanwhile, energy policy was the key indicator of control over energy end use. The multilevel parallel model and Fisher index were adopted to analyze the impact made by residential consumption on carbon emissions [
15]. The results demonstrated that income per person, size of population, and degree of urbanization were positive factors influencing carbon emissions, whereas the intensity of energy end use and structure of energy consumption were negative factors. Mavromatidis et al. [
16] measured the contribution of different factors to the carbon emissions of residential buildings in Switzerland using the Kaya equation. The results revealed that carbon emissions increased with construction area, but decreased with intensity of energy. Xian et al. [
5] used data envelopment analysis (DEA) to explore the inherent trade-offs between environmental benefits and cost outcomes among different types of energy consumption across the construction industry in China. The results indicated that the construction industry in China could create its current level of industrial added value with low CO
2 emissions and energy input cost by removing technical inefficiency and adjusting the energy consumption structure. According to existing research, enhancing technical efficiency and adjusting the energy consumption structure were major useful reduction pathways. However, the abovementioned research only identified influencing factors; the quantitative contributions of these factors were not presented. In summary, the Fisher index, that is, the geometric average of the Laspeyre and Passche indexes, has been widely used to handle the conflict between the two indexes in econometrics. Meanwhile, in research on carbon emissions, the Fisher index can only identify positive and negative factors but cannot calculate the contribution of these factors. In addition, the Kaya equation is widely used to identify the drivers of emissions. However, the impact of the driving factors on carbon emissions cannot be identified with the Kaya equation. Compared with the Fisher index and the Kaya equation, DEA is widely used to evaluate relative carbon efficiency. However, the causes of low efficiency and inefficiency remain unclear based on the DEA results.
In the second field, index decomposition analysis, especially the logarithmic mean Divisia index (LMDI) method, has been widely used to conduct research on carbon emissions from residential buildings and evaluate the contributions of the influencing factors [
17,
18]. In the LMDI method, residual error is eliminated, and a zero value in data can be treated in calculation. In addition, the contributions of different factors can be calculated. Liu et al. [
19] used the LMDI method to calculate the contributions of population, urbanization, construction area per person, energy intensity, structure of industry, and technology to carbon emissions. The results showed that energy intensity had a negative effect on carbon emissions, whereas population and construction area per person had a positive effect. Jiang [
20] obtained similar results. Although the LMDI method has been widely applied in the quantitative contributions of driving factors, this method was unavailable for use in forecasting the peak value and time of carbon emissions. Therefore, different models representing the relationship between the driving factors and carbon emissions have been introduced to predict the peak values on the basis of the contributions of the driving factors.
In the third field, macroscale and bottom-up microscale models have been used to forecast carbon emissions. Stochastic impacts by regression on population, affluence, and technology (STRIPAT) was used to measure the contribution of the driving factors to carbon emissions from the residential building sector [
21]. STRIPAT is a kind of extended stochastic environmental impact assessment model, which was used to analyze the relationships between population, wealth, and technology. On the basis of these relationships, the carbon emissions could be predicted. The results showed that construction area per person and energy intensity contributed 21.12% and 20.2%, respectively, to carbon emissions. Wu et al. [
22] conducted similar research in Qingdao: they discuss the reduction in carbon emissions under eight different scenarios from 2015 to 2030 based on the STRIPAT model. Shimoda et al. [
23] predicted the number of households, the carbon efficiency of power grid and fuel gas, and the popularization of household appliances using the residential energy end-use model. The results demonstrated that the carbon emissions of residential energy end use in Japan decreased by 24%. In accordance with previous research on STRIPAT, carbon emissions could be predicted using macroscale factors, such as population, economy, and technologies, but not microscale factors, such as activities and energy types. Tan et al. [
24] predicted the carbon emissions of residential buildings in 2050 from the perspectives of heating, urban buildings, and rural buildings using the Chinese Academy of Science’s bottom-up model. However, they only made predictions using one aspect, that is, either energy end use or energy types. Both factors affected the prediction of carbon emissions [
25,
26,
27]. Therefore, for the consideration of energy end use and energy types, the LEAP model was suitable for identifying influencing factors and predicting carbon emissions. From the energy type perspective, the carbon emissions from the residential building sector in Thailand and Vietnam were predicted using LEAP [
28]. From an energy end use perspective, carbon emissions from the residential building sector of Korea in 2030 were forecasted [
29]. The results indicated that the total emissions in 2030 were 73.07 Mt, with 65% contributed by heating. Moreover, LEAP was used to predict the carbon emissions of energy end use in rural buildings in Thailand. Results demonstrated that the energy-saving label and the popularization of light-emitting diodes were the two most significant contributors to the reduction in carbon emissions [
30]. According to previous research, LEAP was advantageous in identifying the driving factors and predicting carbon emissions under the dual perspective of energy end use and energy types. Similar results were obtained by different studies.
For the second question, we focused on life-related activities performed in residential buildings during the operation period to reduce carbon emissions. For example, Siller et al. [
31] discussed the reduction in carbon emissions from energy end-use activities until 2050 in Switzerland using the system dynamics model. Meanwhile, heating and boiling water were activities that contributed to carbon emissions over a long time. Wu et al. [
32] measured the carbon emissions from office buildings during the operation period. The results showed that the power used for heating, cooling, and ventilation was a major source of carbon emissions. Fan, Yu, and Wei [
9] calculated the carbon emissions stemming from heating, cooling, cooking, illumination, private transport, and household appliances and analyzed the trends displayed by carbon emissions from 1996 to 2012. The results revealed that heating and cooling were primarily responsible for the emissions. Similar results were found by different studies. Cooking, heating, cooling, and illumination were all considered major contributors to carbon emissions [
6,
10,
33,
34]. Asaee et al. [
7] revealed that the obstacles to zero carbon emissions were low energy efficiency and high consumption of fossil fuels. In their research, the geographic heterogeneity of the climate was neglected for the reduction pathway. The consumption of heating in cold regions was evidently higher than that in warm regions. Therefore, the pathways to reduce carbon emissions in cold regions is essential to answering the second question.
In summary, the carbon emissions from residential buildings during the operation period in cold regions account for a large proportion of total emissions. Therefore, considering the heterogeneity of the climate, finding a reasonable way to reduce carbon emissions is crucial. Forecasting carbon emissions based on the driving factors provides a basis for strategies for reducing carbon emissions. In consideration of the dual effects of energy end use and energy types on the driving factors and prediction, LEAP was selected to identify the driving factors and forecast peak carbon emissions from residential buildings in cold regions. In consideration of the energy end use, such as heating, cooling, cooking, washing, and illumination, and the varieties of energy, such as coal, gas, liquified petroleum gas (LPG), solar energy, and bioenergy, driving factors were identified, and peak emissions from residential buildings in cold regions were forecasted. The deviation in carbon emissions was corrected under the sole impact of energy end use or energy types in traditional research. Combined with the climatic characteristics in cold regions, the pathway to reducing carbon emissions aimed at different energy end use and energy types was presented in baseline, energy-saving, energy-saving low-carbon, and low-carbon scenarios. Comparing the peak emissions under different scenarios illuminated the situation of cold regions. This pathway compensated for the deficiency, with no consideration given to the geographic heterogeneity of the climate in the traditional pathway.
2. Methodology
A technical roadmap of the present study is shown in
Figure 1. Coal, LPG, natural gas, bioenergy, solar, fuel gas, and electricity were considered as energy end use in buildings to predict the peak carbon emissions in the cold region. Meanwhile, heating, cooking, cooling, water heating, washing, and illumination were considered energy consumption activities. On the basis of the interactions between energy end-use types and activities, the LEAP model framework and the carbon coefficient of the Intergovernmental Panel on Climate Change (IPCC) were introduced to build a model that simulates carbon emissions from different activities in buildings located in cold regions. Four different scenarios for the different levels of activities and planning goals were presented. The carbon emissions from 2015 to 2050 under the four scenarios were predicted by combining the model with the scenarios. The peak value and time point were obtained on the basis of the predictions. A pathway to balance low carbon emissions and social development in the cold regions was explored by comparing the peak value and time under the different scenarios.
2.1. LEAP Model Framework
Residential and public buildings were taken as the research object in this study. Heating, cooling, cooking, washing, and boiling water during the operation stage were regarded as the activities that contribute to carbon emissions from residential buildings. In accordance with the above activities and energy end-use types, LEAP was developed to identify the driving factors and predict the peak value of carbon emissions from residential buildings in the cold regions. The time span of LEAP was set to 2014 to 2050, with 2014 as the baseline and 2020 and 2050 as the target times. Meanwhile, the five levels of sectors in LEAP were constructed to represent the different energy end use and energy types. The five different levels are listed in
Figure 2.
In consideration of the bottom–top process of LEAP, the macro and micro scales were considered. Therefore, five levels in the different scales were introduced in LEAP. In the first level, the buildings in the cold region were categorized into residential and public buildings. These building types have different carbon emissions. In residential buildings, carbon emissions come from heating, cooling, and cooking; in public buildings, emissions mostly come from air conditioning. In the second level, residential buildings were divided into urban and rural sectors, whereas public buildings were divided into offices, schools, hospitals, malls, hotels, and others. In the third level, heating, cooking, illumination, cooling, washing, boiling water, and others were the energy end-use activities performed in residential buildings. Heating, illumination, boiling water, and others were the energy end-use activities conducted in public buildings. In the fourth level, the energy end-use types were further classified depending on the different types of appliances. With respect to cooking activities, different cooking ranges led to different kinds of carbon emissions due to different energy types. For example, cooking ranges were operated by electricity, but cooking stoves consumed wood to function. In the fifth level, different energy types were consumed by different energy terminals. In this study, the eight common energy types were electricity, LPG, coal, bioenergy, solar, coal gas, fuel gas, and natural gas.
2.2. Carbon Emissions Accounting Method
According to the different energy end use and energy types, the carbon emissions were accounted for based on Equations (1)–(8) as follows.
where
CH is the carbon emissions of heating in urban, Mt;
PCH represents the service ability of central heating;
PNCH represents the service ability of non-central heating;
ECH indicates the energy consumption of the central heating,
ENCH indicates the energy consumption of the non-central heating; and
fc is the carbon factors of coal.
where
CCK is the carbon emissions of cooking, Mt;
Pm,n,c represents the service ability of the
nth terminal appliance in the cooking activity, year or m
2;
Em,n,c indicates the energy consumption of the
mth energy type from the
nth terminal appliance in the cooking activity; and
fm is the carbon factors of the
mth energy type.
where
CI is the carbon emissions of illumination, Mt;
Pn,I represents the service ability of the
nth terminal appliance in the illumination activity, year or m
2;
En,I indicates the energy consumption of the electricity from the
nth terminal appliance in the illumination activity; and
fe is the carbon factors of electricity.
where
CCL is the carbon emissions of cooling, Mt;
Pr represents the service ability of the refrigerator;
Pa represents the service ability of the air conditioning;
Er indicates the energy consumption of the refrigerator; and
Ea indicates the energy consumption of the air conditioning.
where
CW is the carbon emissions of washing, Mt;
Pm,w represents the service ability of the
nth terminal appliance in the washing activity, year or m
2; and
Em,w indicates the energy consumption of the electricity from the
nth terminal appliance in the washing activity.
where
CHW is the carbon emissions of heating water in residential building, Mt;
Pm,n,h represents the service ability of the
nth terminal appliance in water heating, year or m
2; and
Em,n,h indicates the energy consumption of the
mth energy type from the
nth terminal appliance in water heating.
where
CO is the carbon emissions from other sources, Mt;
Pm,n,o represents the service ability of the
nth terminal appliance in other activities, year or m
2; and
Em,n,o indicates the energy consumption of the
mth energy type from the
nth terminal appliance in other activities.
where
CT is the total carbon emissions of the
mth energy type from building sectors during the operation in cold regions, Mt.
5. Conclusions
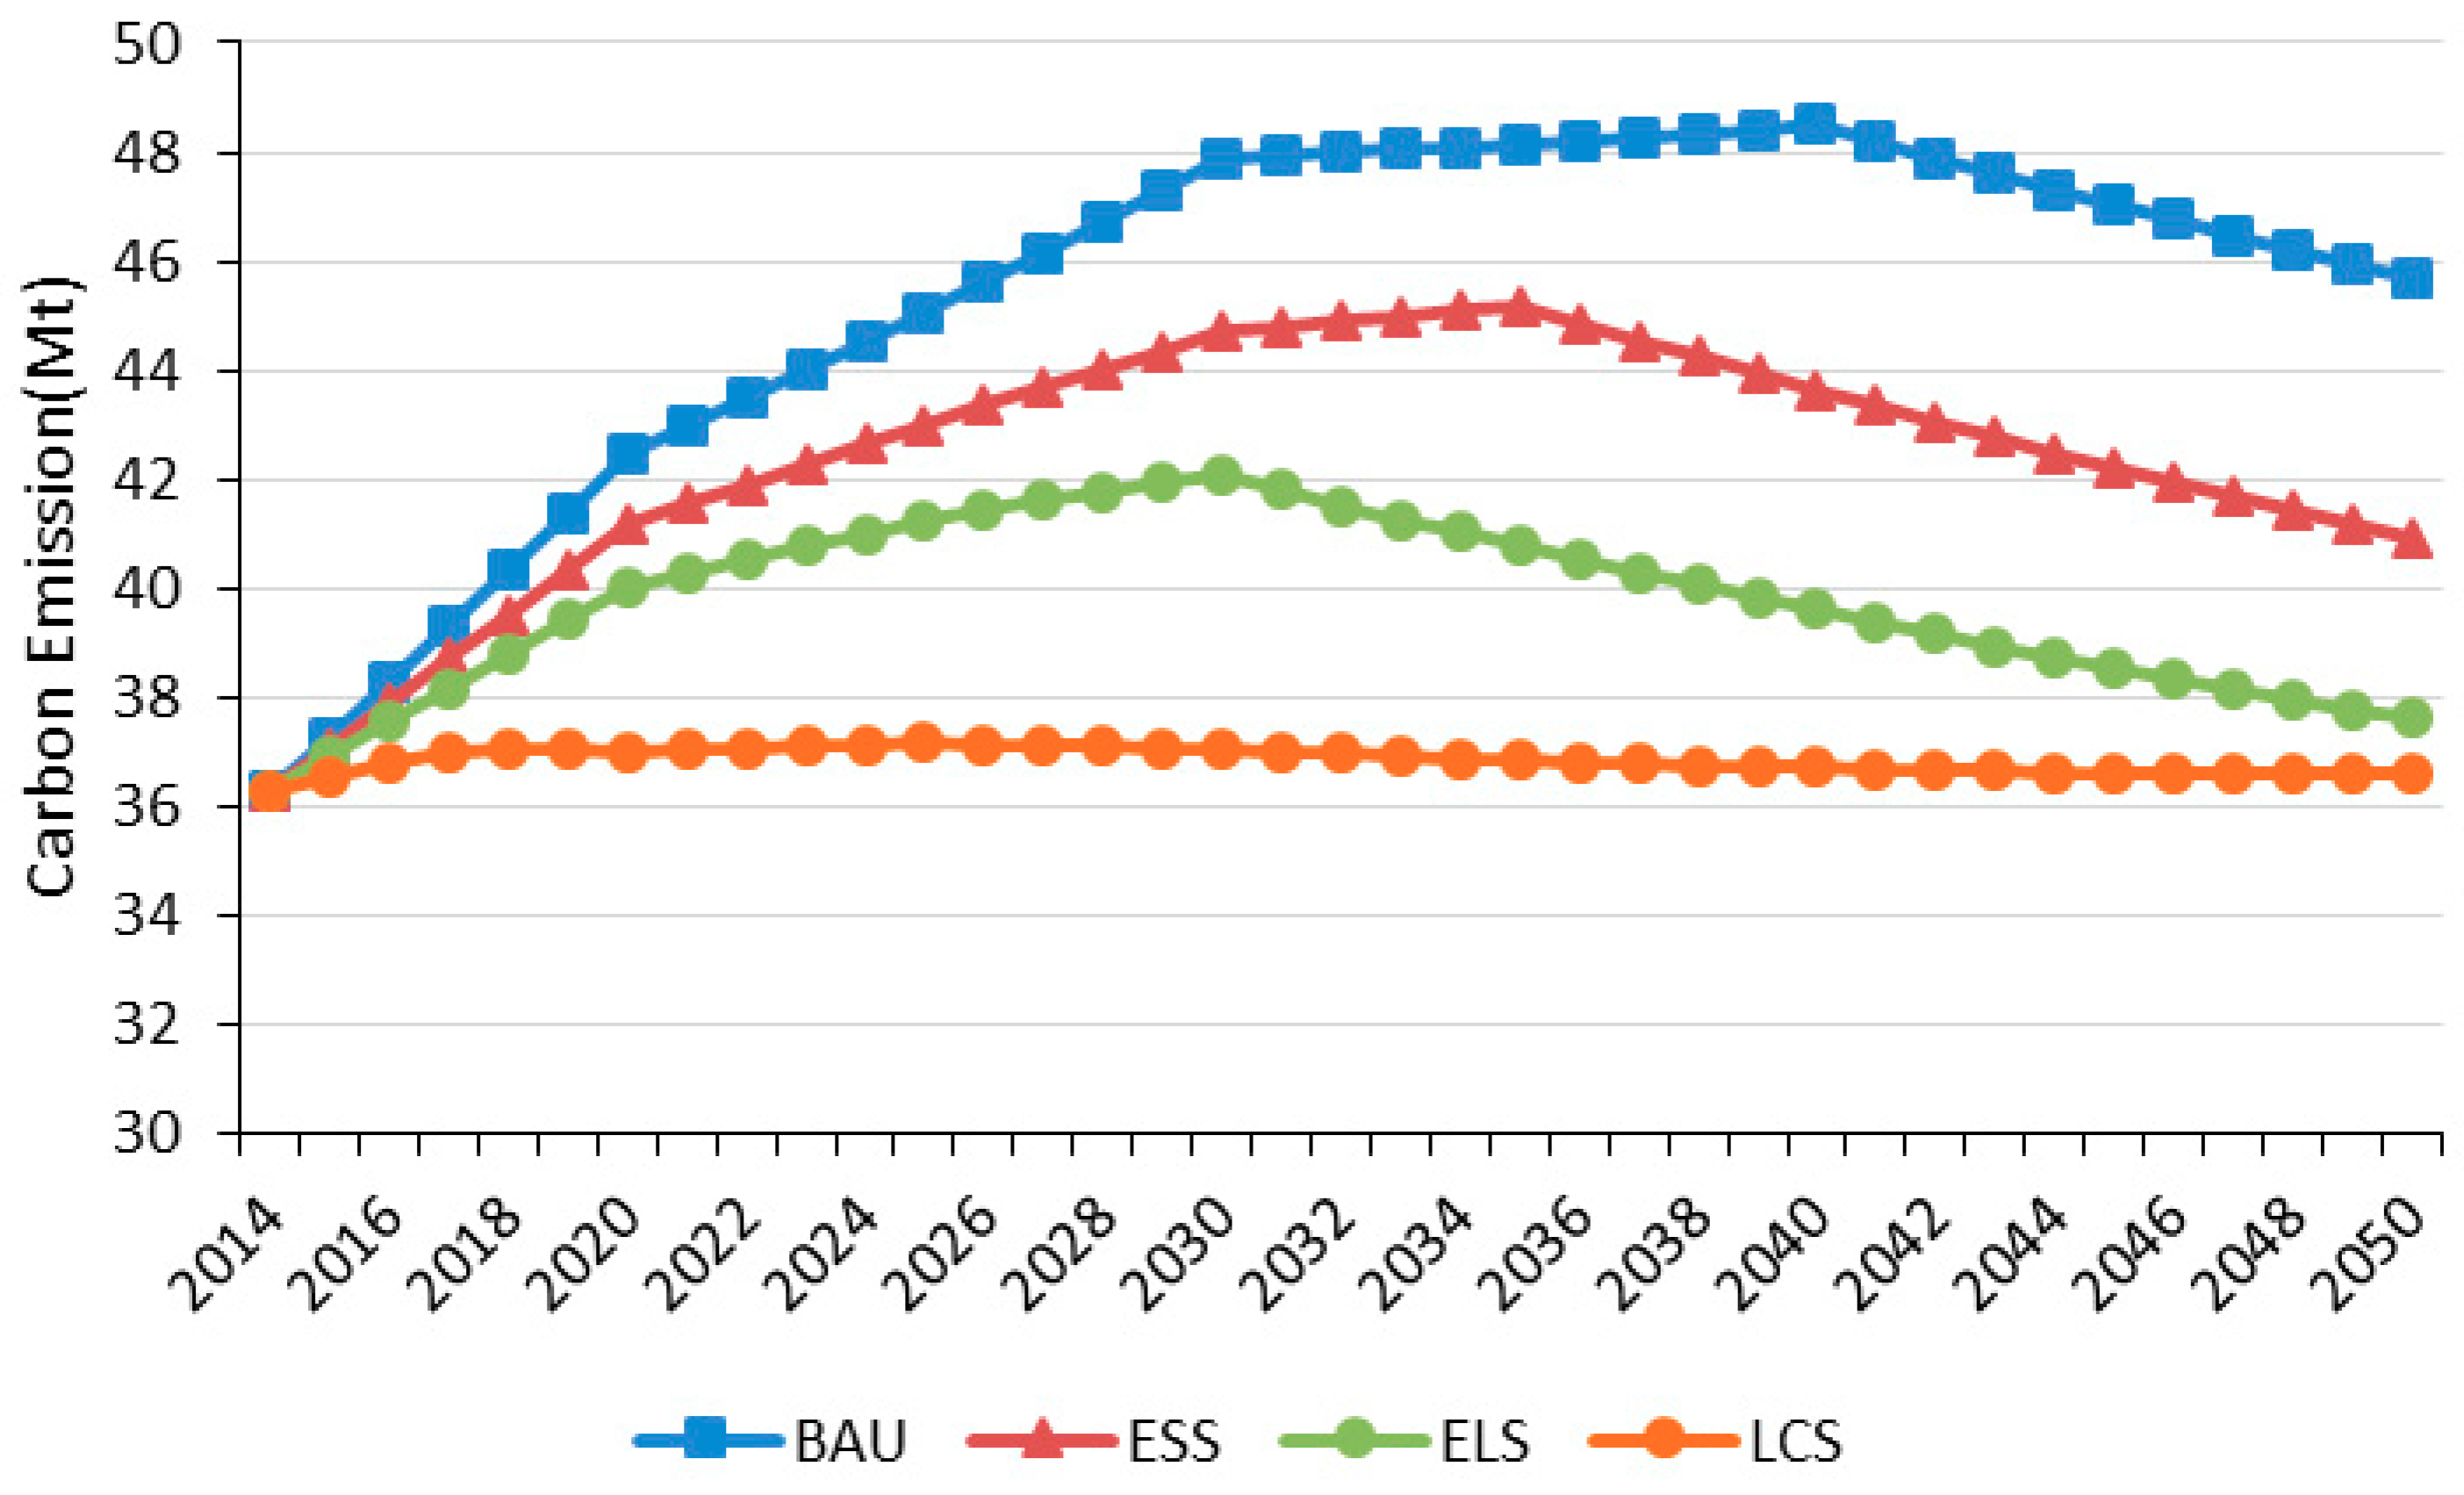
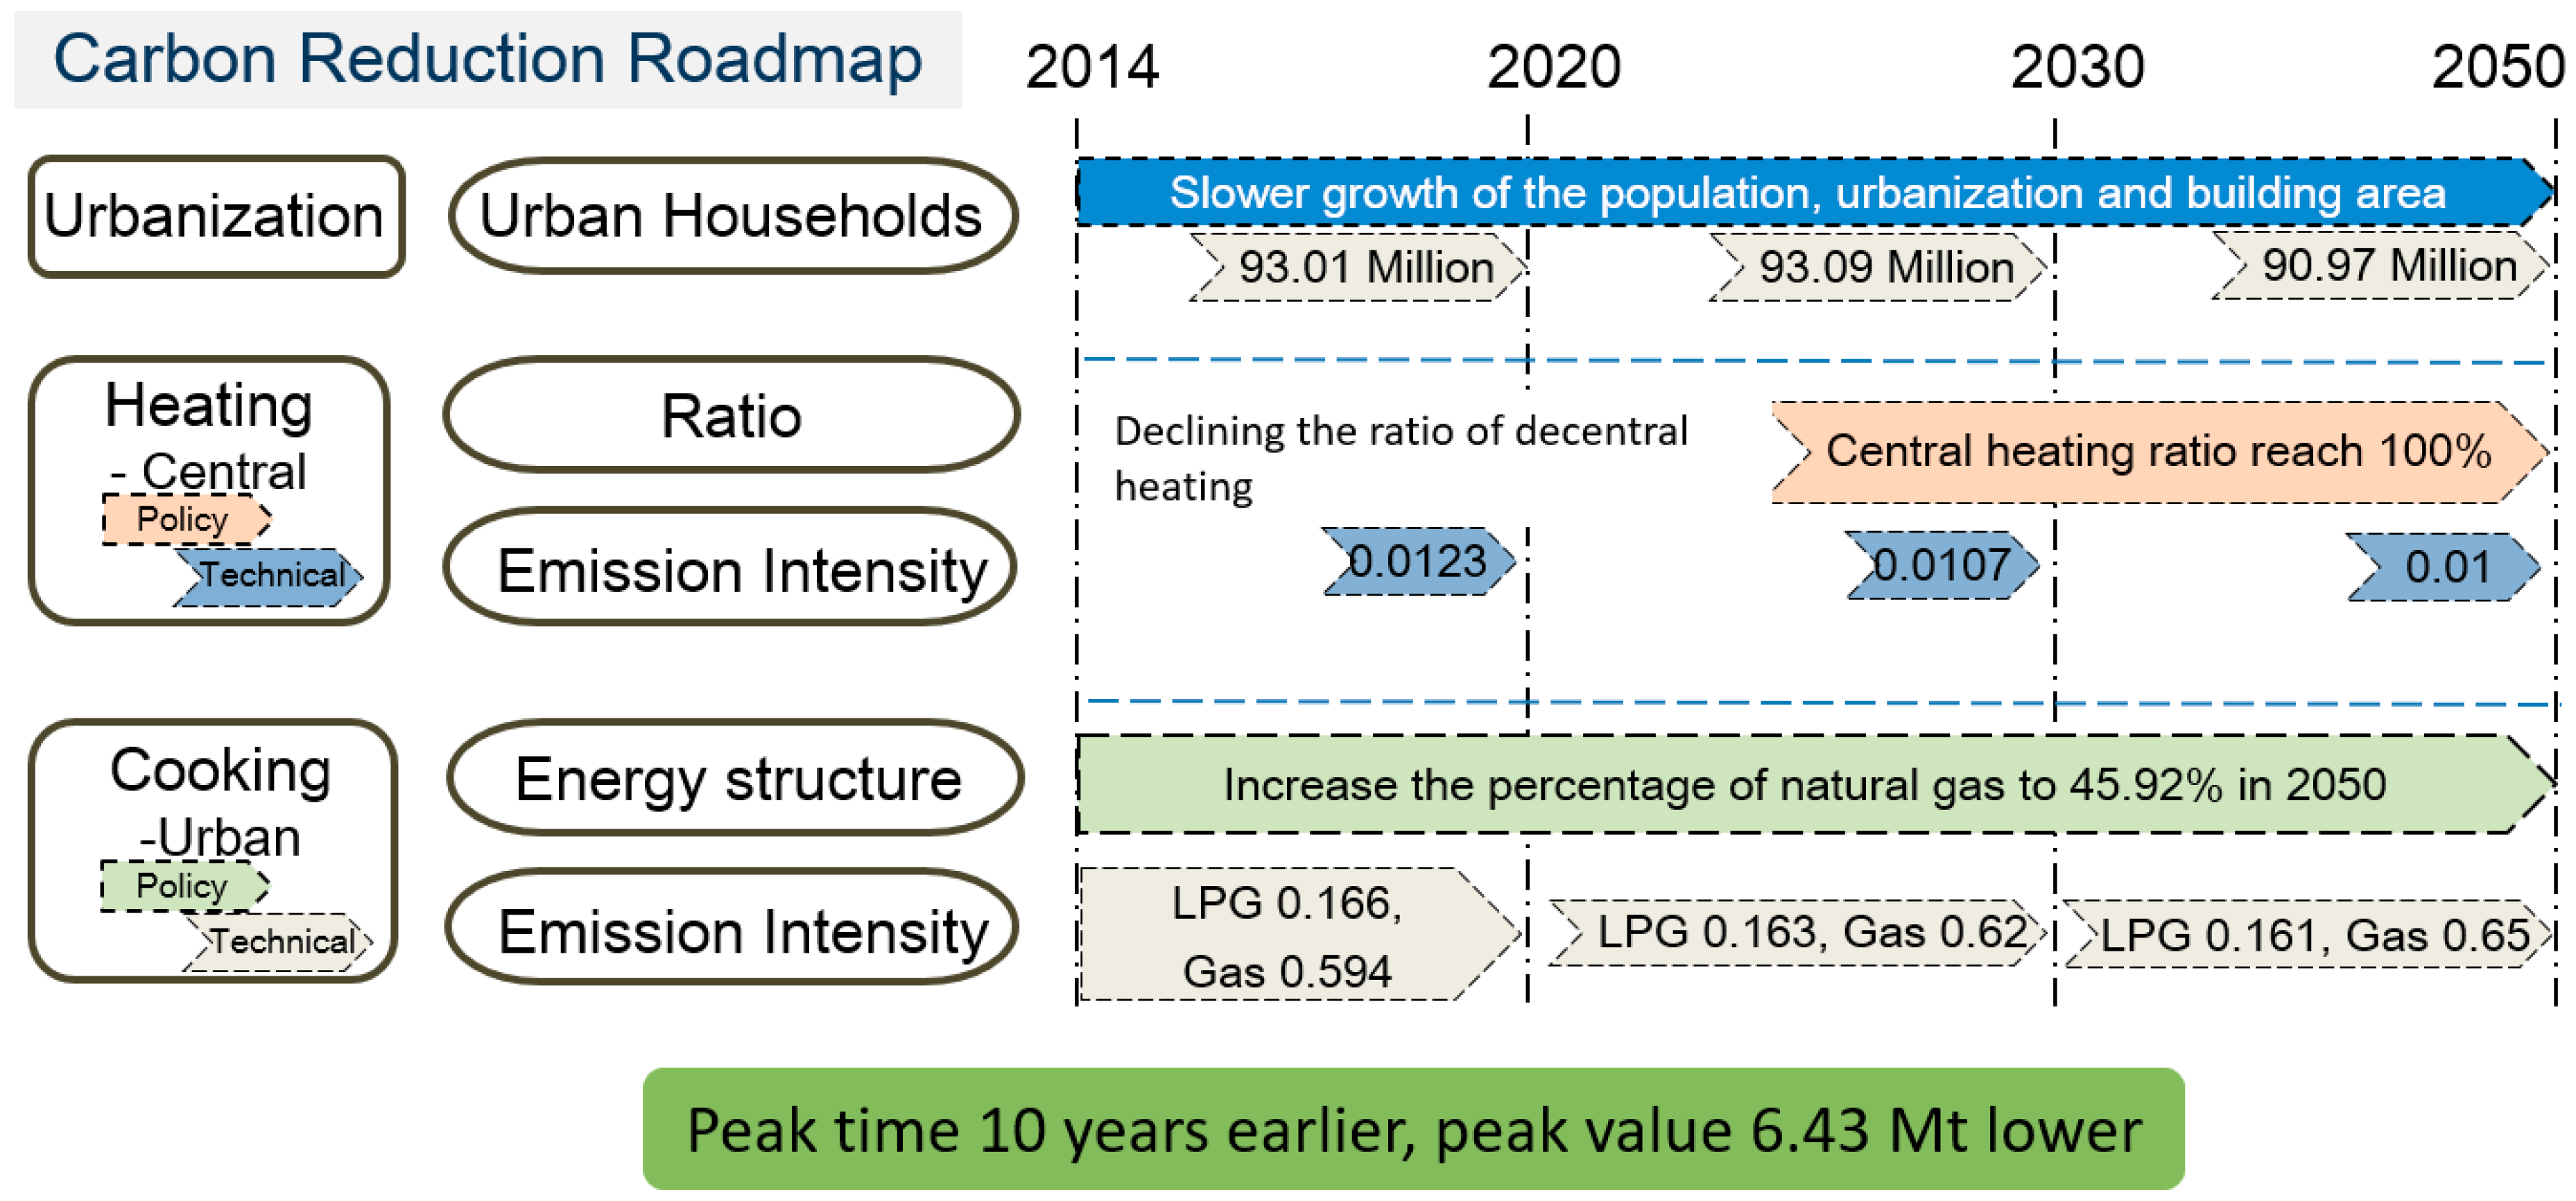
In view of the growing carbon emissions from buildings during operation in cold regions, LEAP, sensitivity analysis, and scenario analysis were used to forecast the peak value, identify the driving factors, and search for a way to reduce emissions. The results revealed that the peak and peak time varied between the scenarios. On the basis of the balance between development and low carbon, ELS was regarded as the optimal scenario. Under ELS, the peak time was 2030 according to the national target. After comparing the four scenarios, heating was found to be the top-ranking driving factor of carbon emissions in the cold region. Heating contributed 20–30 Mt carbon emissions, and accounted for 54–62% of total emissions in buildings. Cooling and cooking were the second-highest carbon-emitting activities, with a value of 6–8 Mt. The emissions from cooling and cooking comprised 11–20% of the total emissions. The results obtained from the sensitivity analysis indicated that two negative indexes refer to urban size, and 30 positive indexes had a relationship with urban size and activities such as heating, cooking, and cooling. After combining policy and technology, pathways to reducing carbon emissions under different scenarios were suggested. In view of the assessment of carbon emissions based on the number of households, percentages of central heating, carbon intensity of central heating, public building area, carbon intensity of air conditioning, cooking structure, and carbon intensity of furnaces, the BAU-ELS pathway was considered to offer the optimal balance between development and low carbon.
No optimization function was available in the LEAP model. The optimal scenario could not be obtained from LEAP. Thus, a scenario analysis for identifying the reduction pathway must be introduced. In our future work, the optimization model may be introduced quantitatively into LEAP for the optimal reduction pathway. In addition, with Jilin Province representing a vast cold region in China, uncertainty of coefficients exists in the study. Without considering the geographic heterogeneity in carbon emissions, the relationship between carbon emissions and the cold was not discussed in our research, but it will be tackled in our next work.

 ,
, 


