Abstract
In the last few decades, the progression of climate change has made people aware of the need to reduce CO2 emissions. In this study, the effect of this awareness on container transport in Northeast China is used as an empirical case study. Firstly, we propose that the freight demand index, calculated by the entropy weight TOPSIS (technique for order preference by similarity to an ideal solution) method, reflects the degree of container demand in destination cities. Then, we describe five scenarios against the background of China’s container development plan and use them to evaluate the cost and carbon emissions of container rerouting. The overall objective of the study is to assess the effects of changes in port selection on the formation of new routes and multimodal transport. The results show that carbon taxes do not significantly affect multimodal transport networks, and the impact of loading and unloading costs on the total cost is far greater than that of corresponding carbon emissions. Despite the railway transportation capacity of Dalian Port, the results show that Yingkou Port and Dandong Port will expand by 227.8% and 191.4% over 2017, respectively. Therefore, Liaoning Port Group needs to reposition its different ports.
1. Introduction
The increase in greenhouse gas (GHG) emissions, which is partially attributed to the rapid development of the world’s economy, is a global concern [1]. According to the statistics of the International Energy Agency (IEA), transportation accounted for 24.5% of pollution produced in 2017, representing the world’s second-largest source [2]. Almost 80% of the transportation sector, and thus, the source of carbon emissions from transportation, is accounted for by roading, while maritime, railway, and air transport contribute to the remaining 20%. Therefore, much attention has been given to carbon emission generation by road freight and the growing problem of port choice [3,4,5,6].
Ports are important nodes in international trade networks, as their location and efficiency can significantly affect the performance of the global supply chain. Therefore, the economic aspects of port selection, such as port efficiency [7], port distribution [8], and port cost [9], have been emphasized in academic literature. However, these studies did not include changes in decisions regarding port selection under the conditions of carbon emission and road freight reduction. In addition, although the IMO has established emission control areas (ECAs), some shipping companies have not yet incorporated reductions in carbon emissions into their port selection factors.
An effective way to improve the environmental performance of the freight chain is to transfer goods from high-carbon highways to low-carbon transportation modes, such as rail or waterway transportation [10]. In the context of the global freight transportation chain, shipping companies can reduce their carbon emissions by choosing ports closer to the hinterland of the market or with multimodal rail transport. Recently, Notteboom considered the complementarity and substitution of container ports among a range of ports [11]. Sanchez et al. [12,13] studied the possibility of using alternative ports as part of a global supply chain carbon reduction strategy. However, these studies did not investigate the effects of changing the freight routes in cases where there are multiple alternative ports or using other low-carbon transport modes, including land transport, to decrease the carbon intensity. While conditions for lowering freight rates are very important, a more comprehensive method is needed to determine the freight demand of a destination city in order to reflect the actual situation. Therefore, more scenario analyses are needed to assess port selection decisions under different scenarios, including the sensitivity analysis of road transport carbon costs and intensity reduction.
This paper expands on the work of Sanchez et al. [12,13] by using alternative ports as a supply chain carbon reduction strategy. The multimodal transport model presented in this paper is a strategic level, an activity-based model that can measure the impacts of the baseline scenarios and future proposed scenarios outlined in this paper. The model includes a sensitivity analysis of road cost reduction and carbon reduction to explain road freight price flexibility and possible future carbon emission reductions. Northeast China (Figure 1) was selected as a case study, as although the traditional industrial base has the country’s densest railway network, the railway network is not effectively utilized. The ports in northeast China are simultaneously facing problems, due to hinterland overlap and vicious competition. Following the investment of the China Merchants Group in the Dalian and Yingkou ports in 2018, port integration may change the cut-throat competition seen among Northeast China ports. However, the following questions still require answers: How can the proportion of railway transport in Northeast China be increased in order to reduce carbon emissions? What is the key limiting point of road and rail competition? How will the integrated ports develop? [14]. The use of a multimodal transportation network model with statistical data has rarely been seen in previous research, mainly because obtaining the required data is difficult [15]. At the same time, the related literature is lacking scenarios designed to match real-world conditions. Thus, in order to answer the above questions and fill the academic gap, we propose the use of the multimodal transport model as a macro model at the strategic level. In addition, we consider the implications of modeling the dry port to reflect the ambitious plans of the Chinese government to increase the proportion of multimodal transport [16].
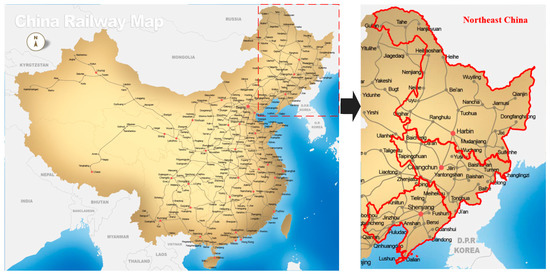
Figure 1.
Railway map of Northeast China.
The contributions of our research are as follows:
- In the studies presented by Sanchez et al. [12,13], the demand for freight in the destination city was determined by the population size. However, freight demand is associated with many economic indicators. Thus, in this study, in order to determine the freight demand of the destination city, a comprehensive multi-criteria decision-making (MCDM) approach is used to measure city freight performance. All relevant criteria for freight demand are taken into account, including the GDP, population size, and consumption level.
- For the modeling approach adopted in this study, a number of variables that affect the overall cost and carbon emissions are considered, including the multimodal freight costs, transportation handling costs, carbon tax, and carbon emissions from the use of alternative modes and routes. The scenarios modeled in this paper include a baseline scenario and a series of scenarios that capture the results of using alternative routes, which also reflect carbon emissions and the role of multimodal transport in port selection.
- In the sensitivity analysis, road cost reduction is taken into account to reflect the flexibility of road freight price during the imbalance between supply and demand. For example, when Shenyang port has a large number of goods to transport, and Dalian port has no goods, truck drivers will go to Shenyang to canvas more goods at lower prices.
The rest of this paper is presented as follows: Section 2 summarizes the relevant literature on port selection, carbon emissions from container transport, and multimodal transport network planning; Section 3 introduces the methodology; Section 4 describes the data collection and discusses the results; and brief conclusions are made in Section 5.
2. Literature Review
Ports play an important role in the integrated hub of a maritime supply chain. However, port selection has not yet fully considered the reduction of carbon emissions. Rather, port choices regarding factors, such as port location [17,18], port spatial accessibility [19], port efficiency [20] and port tariffs [21] have been more focused on economic benefits and keeping costs low. However, the increase in global climate change caused by carbon emissions has increased carbon emission awareness, which may lead to increased conversion of road transport to low-carbon transportation methods, such as railway or water transport. This means that the choice of ports needs to consider whether other low-carbon transport transits are available and whether the ports are closer to the hinterland cities, so that the routes can be changed to a low-carbon model and road transport can be reduced.
As mentioned above, even ignoring port selection as an important part of the carbon reduction strategy, a growing number of studies are focusing on carbon reduction strategies in the transport chain and modal shifts to low carbon intensity modes, for example, using slow streaming to reduce the carbon emissions of the maritime leg of freight transportation chains [22], using coastal shipping services as a low-carbon alternative to road transport [23,24], and transferring road freight to railway to effectively reduce carbon emissions and costs [25]. The above studies investigated carbon reduction strategies from a transport chain perspective and concluded that the transformation of the transport mode is an effective low-carbon measure. At the same time, some scholars have focused on the tactical and operational levels, such as multimodal transport network planning and transport route optimization, to increase the carbon efficiency of transport modes.
Multimodal transport network planning research is not new. For instance, studies have been conducted on hub-and-spoke multimodal transport networks considering stakeholders [26], an integrated Petri net (TPN) and data envelope analysis (DEA) model under multiple resources [27], an integrated long-haul routing model considering rest and railway planning capabilities [28], and the relocation of empty containers considering carbon emissions and stochastic demand [29]. However, the above-mentioned studies focused on model design or algorithm design by constructing multimodal transport models at operational and tactical levels. In practice, some government policies, such as carbon tax and port integration, may have profound impacts on multimodal transport organizations. For example, Christodoulou et al. [30] studied the operation of Nordic Ro-Ro shipping services, taking the cooperation between Stora Enso and Swedish Orient Line (SOL) as a case study. Their research helped to identify barriers that prevent roll-on transport from becoming a viable alternative to road transport on certain routes, as well as incentives for sustainable multimodal transport. However, their study was qualitative and required supplementation with a quantitative model study of the multimodal transport network at the strategic level. Additionally, previous studies did not include a low-carbon strategy based on road freight transport from the start to the end of the campaign, such as road freight and carbon intensity reduction scenarios. This paper discusses this issue.
An overview of research on port selection, carbon emissions from container transport and the multimodal transport network can be found in Table 1.

Table 1.
Overview of literature review.
3. Materials and Methods
3.1. Description of the Case Study
In terms of coastal freight transportation, Northeast China is dominated by bulk materials, such as oil, coal, ore, and grains. However, with the development of the “Belt and Road” initiative and the China Railway Express (CR Express) routes in Northeast China, such as “Ying-Man-Europe” and “Liao-Man-Europe”, the container throughput in the Northeast China port is also rising.
As Liaoning is the only coastal province in Northeast China, four major container ports in Liaoning Province—Dalian, Yingkou, Jinzhou, and Dandong—were selected as starting ports in the multimodal transport network. Data related to the four ports used in the model are shown in Table 2. Panjin and Huludao ports were not considered because of their relatively small contributions to container transportation. Regarding the hinterland setting, three main inland transport modes were included: Truck, rail, and coastal shipping. Twelve destination cities, which are heavily involved in Northeast China’s multimodal transportation were included: Harbin, Daqing, Qiqihar, Jiamusi, Changchun, Jilin, Songyuan, Siping, Shenyang, Anshan, Benxi, and Fushun.
Table 2.
Selected ports and their throughputs.
3.2. Freight Demand in Destination Cities
In the studies by Rodrigues [12,13], freight demand was recalibrated using population data. However, freight demand is closely related to various economic indicators [31,32], including the population size, GDP, and consumption level. Thus, we constructed a freight demand index (FDI) to reflect the degree of urban freight demand.
Firstly, the FDI evaluation index system was established (Table 3).
Table 3.
Index system of the freight demand index (FDI).
Then, the FDI in the destination cities was calculated by the entropy–weight–TOPSIS (technique for order preference by similarity to an ideal solution) method, a MCDM (multi-criteria decision-making) method that has been used in numerous fields, such as highway transportation [33], sustainable capacity [34], and sustainable development [35]. Entropy is a thermodynamic concept, which was introduced by C. E. Shannon. Information entropy, which is an applicable method for confirming weight value, was introduced into the model, where a higher information entropy indicates a greater effect [36]. The basic principle of the TOPSIS method, presented by Chen and Hwang, is that the chosen alternative should have the shortest distance from the ideal solution and the farthest distance from the negative ideal solution [37]. The entropy–weight–TOPSIS method first uses entropy to calculate the weight of the index, and then the TOPSIS method is used to align the approaching degree with the target.
Finally, using the sum of the port container throughput in Northeast China, freight demand was allocated according to the FDI of the destination city.
In this paper, we adopted this method to calculate the FDI in destination cities. The model procedure consists of the following steps:
- 1.
- Data Standardization Processing
Different economic indicators have different dimensions and orders of magnitude, so standardization is needed to eliminate the dimensions. A range of methods is used to deal with this.
Consider the matrix , where denotes the number of cities, denotes the number of economic indicators, , , and denotes the value of the index of the city,
for positive indicators, the standardization is as follows:
for negative indicators, the standardization is
The matrix is a normalized range matrix.
- 2.
- Determination of Index Weight by the Entropy Weight Method
Firstly, the ratio is calculated by using the matrix :
Then, the information entropy is calculated using
Finally, the weight of index is as follows:
where , and .
- 3.
- Confirm Freight Demand by TOPSIS
The weighted matrix is calculated by using :
The ideal and negative-ideal solutions are determined using
The Euclidean distances between the index and positive and negative ideal solutions are calculated using
The relative closeness to the ideal solution is calculated using
Finally, the FDI and freight demand of each destination city are calculated using
where denotes the freight demand of destination city , and denotes the total port throughput.
3.3. Model and Scenario Design
Based on the above-mentioned entropy–weight–TOPSIS method, the container demand of the destination city was calculated. We constructed the following multimodal transportation network planning model, which is suitable for the planning of a multimodal transport network at the tactical level. Containers arrive at domestic ports from several overseas ports. After the loading and unloading operations, three different inland transportation modes—road, railway, and waterway—are used to transport the containers to the destination city. In cities with railway stations or inland river ports, railway and waterway transport can be carried out, followed by road, namely hub-and-spoke transport. Obviously, without such facilities, a road can also be used for direct transport.
3.3.1. Decision Variables and Parameters
Consider a multimodal transport network with , where denotes the set of nodes in the transport network, and denotes the set of links in the transport network. Let represent the set of foreign ports, represent the set of origin ports, represent the set of destination cities, represent the set of railway transfer stations, and represent the set of waterway transfer stations. Clearly, and . For any , represents the network arc from node to node , where . In this study, we focused on land transportation and did not consider the cost of international shipping.
To clearly express the model of this paper, we present the notations in Table 4.
Table 4.
Notations and descriptions in the model.
3.3.2. Multimodal Transportation Network Planning Model
In our model, the objective function (11) minimizes the total cost of containers flowing through the multimodal network. The costs include transportation costs (12), handling costs (13), and carbon emission costs (14). Functions (15–19) are different constraints. Constraint (15) is designed to maintain the equilibrium of transport flow in different transit nodes; constraint (16) is designed to maintain the equilibrium between supply and demand of container transport; constraint (17) denotes the capacity limitation of the transit node in handling containers; constraint (18) means that the demand of the destination city should be met; and constraint (19) defines the non-negative of the decision variables.
To inform the readers about how to change from one mode of transportation to another, we give a simple example. As shown in Figure 2, O1 and O2 represent two origin ports, which can also serve as transit points for water transport. R represents the railway transfer station, and D represents the destination city. The numbers on the links are the distances between two nodes. Because railway and waterway transportation are low-carbon intensive transportation modes, the O1–D transport route can be as follows:
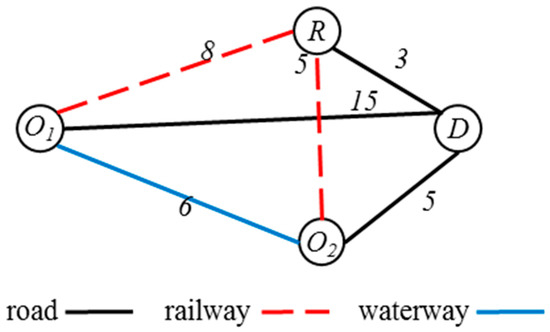
Figure 2.
A simple example of the model.
- O1–D: All containers are transported by road.
- O1–R–D: This route depends on the capacity constraints of the railways. At the same time, according to the different freight rates and carbon intensities of the railway, the O2–R–D route is also possible.
- O1–O2–D: This route depends on whether the port of O2 is expanded or not. If the port of O2 can be expanded, then a large number of containers will be transported in O2 to reduce the total cost.
We assumed that the total supply of containers equals the total demand in each scenario. The problem is represented by transporting standard containers from a specific port location to the destination city with minimal transport costs. Figure 3 shows an overview of the model used in this paper.
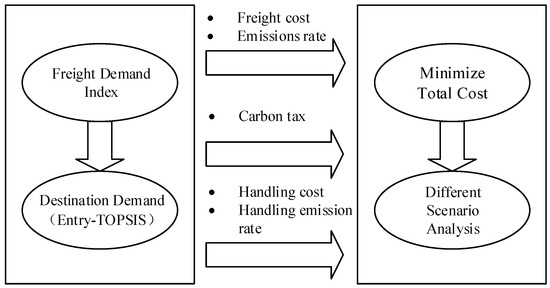
Figure 3.
Overview of the model.
In order to establish the impact of multimodal transport on transportation costs and carbon emissions in different situations, this study designed the following five scenarios for empirical simulation:
- Scenario A (basic scenario): Assuming that all containers are transported by road, this scenario was used as the comparison scenario, which served as the benchmark comparison between multimodal transport and single road transport.
- Scenario B: Assuming that all containers are transported by road and rail, Shenyang, Changchun and Harbin were selected as dry ports, Yingkou Port and Dalian Port can transport containers by rail, and Dalian can be expanded. The purpose of this scenario was to study the role of multimodal transport in port selection. In order to be consistent with the reality, the railway capacity limit was set to less than 5.4% of the total route capacity, which is, according to the 13th Five-Year Plan for the Development of Railway Container Multimodal Transport (13th FPDRCMT), the proportion of railway container transport in China—far lower than that in developed countries.
- Scenario C: On the basis of scenario B, we assumed that containers arriving at Dalian port could be trans-shipped to Yingkou port and Dandong port along the coast. At the same time, Yingkou port and Dandong port could be expanded. The purpose of this scenario was to study the impact of reducing road transport through the use of alternative ports or rail transport on the port selection and carbon emissions.
- Scenario D: On the basis of scenario C, we assumed that the railway traffic volume was limited to less than 20% of the total traffic volume. The purpose of this scenario was to reflect the 13th FPDRCMT, where the freight volume of China’s container railway is predicted to reach 20% by 2020.
- Scenario E: On the basis of scenario C, we assumed that the railway traffic volume was limited to less than 50% of the total traffic volume. The purpose of this scenario was to reflect the influence of multimodal transport and port selection when railway transport is more developed in the future. China’s ambition to vigorously promote multimodal transport and the integration of Liaoning Port Group strongly confirm this scenario.
Each scenario was formulated as a transport problem with minimal transport costs, constrained by capacity, and with the volumes of different routes and modes determined in order to satisfy all customer demand. In the multimodal transport network, only one mode of transport can be selected for all the transport modes from the origin to the destination, except for the trans-shipment circumstances set in the scenario. Furthermore, trans-shipment is not limited by the port throughput. The container handling cost of the destination city is not considered, and the site and facilities meet the container handling requirements.
The movement of containers in ports and railway stations also affects the overall transport pattern, and these movements are very complicated. Decisions regarding these movements include whether to change the route of containers on the terminal, which way the containers are transported out of the yard, whether the containers need to be quickly transported out of the yard, and finally, which type of equipment is used to move the containers. The same problem exists in railway yards. In order to simplify the calculation of this part, this paper assumed that one-third of the containers are transported directly by truck for immediate onward transport, and two-thirds of the containers are shipped out of the port through the stack prior. As for the carbon emissions generated by the loading and unloading operations of containers at ports and railway stations, Yang calculated that Shenzhen port’s overall carbon emissions in 2014 were 23.49 kg/TEU, on average, including 3.6 kg/TEU for the transport vehicles in the port and 5.27 kg/TEU for heavy machinery [38]. Therefore, in order to explain the operational variability of containers during their transfer to different transportation modes, this study assumed that the carbon emissions are 5.27 kg/TEU from the direct loading of road, 8.87 kg/TEU from the direct loading of railway, and 14.14 kg/TEU from loading through the stacking yard. As port handling costs vary greatly from port to port, it was assumed that the cost of container trans-shipment to the highway is 500 RMB/TEU, while the cost of container trans-shipment to railway needs to be increased, so the assumed cost was 695 RMB/TEU.
4. Results and Discussion
4.1. Model Results
The data were collected from the Liaoning Statistical Yearbook 2017, Jilin Statistical Yearbook 2017, and Heilongjiang Statistical Yearbook 2017. The FDIs of the destination cities were calculated according to the entropy–weight–TOPSIS method presented in the preceding section, as shown in Table 5. The freight demands of the destination cities are shown in Table 6.
Table 5.
FDI in destination cities (%).
Table 6.
Container demand in destination cities (000′TEU).
Then, the container demand and throughput of the origin port were introduced into the multimodal network model of 2.3 to solve the different scenarios. Carbon emission parameters and transport cost parameters were obtained by consulting relevant data sources [39], as shown in Table 7, and the carbon tax was set at 0.02 RMB/kg.
Table 7.
Cost and carbon emission parameters.
Finally, IBM WebSphere ILOG CPLEX 12.5 software was used to calculate the results of the five scenarios. Table 8 summarizes the costs and carbon emissions of the different modes of transport, including the costs and carbon emissions of container handling operations at the ports. It can be seen that scenario E is the lowest carbon producing and most economical transportation mode, with a whole process total cost of 70.37 billion RMB and total carbon emissions of 8.464 million tons, reductions from scenario A of 41.47% and 39.64%, respectively. Thus, the lowest freight costs and carbon emissions can be achieved by moving container transport from highways to railways. In addition, as can be seen in scenarios C–E, although some of the shipping costs and carbon emissions increase, the overall transport costs and carbon emissions can be reduced to a certain extent through the shipping of containers to Dalian Port.
Table 8.
Results of five scenarios.
Table 8 also shows that the cost of container handling has an impact on the total cost of about 7–16%, and the corresponding carbon emissions have an impact on the total carbon emission production of about 1–3%. It can be seen that the cost impact of loading and unloading is far greater than the corresponding carbon emission impact. Furthermore, the cost of shipping in scenarios C–E is influenced by the expansion of Yingkou and Dandong ports, which causes the cargo originally intended for Dalian Port to go to these two ports. However, the total cost and total carbon emissions are still the lowest in terms of transportation as a whole.
An important contribution of this study is the impact of multimodal transport and carbon emissions on port selection, so it is necessary to assess the changes in port capacity. As shown in Figure 4, scenario A is the baseline for the throughput change ratio of each port. In scenario B, Dalian Port can expand and include railway transportation, thus increasing its capacity by 105.33%. However, in scenario C, Yingkou Port can be expanded to attract more containers in more hinterland locations, with a capacity increase of 156.6%. Interestingly, in scenarios D and E, although the railway capacity constraints were gradually increased, the capacity of Dalian Port did not expand, but gradually decreased to 0%. Yingkou Port and Dandong Port expanded by 227.8% and 191.36%, respectively. This shows that, from a geographical perspective, Yingkou Port and Dandong Port have locational advantages, as they are closer to the hinterland resources and so their development of containers is more competitive. In all five scenarios, the capacity of Jinzhou Port remains unchanged.
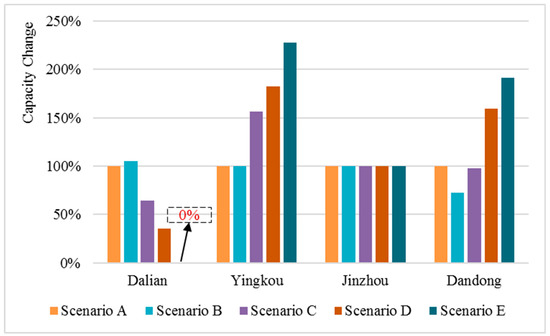
Figure 4.
Overall capacity change of the four selected ports.
Table 9 shows the carbon tax revenue and its proportion of the total cost under different scenarios. It can be seen that the carbon tax expenditure is insignificant compared with the high transportation and loading and unloading costs. To some extent, this reflects the relatively straightforward modes of transportation used in our organization. The single carbon tax policy is not very good guidance for enterprises who are looking to choose more environmentally friendly modes of transportation. Thus, other policies, such as establishing and perfecting the mechanism of carbon trading and intermodal transportation government subsidies, need to be developed and are worthy of further research.
Table 9.
Carbon tax and total cost under different scenarios.
4.2. Sensitivity Analysis
4.2.1. The Impact of Highway Unit Cost Reduction
In reality, road transportation has strong flexibility. For example, under the conditions of sufficient return cargo and insufficient capacity, road carriers usually reduce freight rates to improve their competitiveness. Therefore, we set a 50% reduction in the highway unit freight rate to study its impact on the overall cost and carbon emissions. The results are shown in Table 10.
Table 10.
Result of highway unit cost reduction.
As can be seen from Table 10, a 50% reduction in the unit freight rate on roads has no impact on the carbon emissions in scenarios A and B, which only involve reductions in the road cost and total cost. However, for scenarios C to E, the road cost and total cost are reduced, but the carbon emissions increase. Through in-depth observation, it was found that the railway cost and carbon emissions produced by the three scenarios all reduce to different degrees, while the reductions in handling cost and carbon emissions also reflect the reduced railway container volume. To sum up, under these circumstances, the railway pricing mode of China is “base price 1 + base price 2 × mileage”, which leads to a competitive advantage in the price of road over railway transport for short and medium distances. Although the total cost is reduced, there is also an increase in carbon emissions. According to the notice of the National Development and Reform Commission on Relevant Issues Concerning Deepening the Marketization Reform of Railway Freight Price, railway transport enterprises can adjust their price within 15% of the benchmark freight rates stipulated by the state and within a limited range. Therefore, railway transport enterprises should develop more flexible transport products, enhance their price competitiveness with road transport, and achieve comprehensive transport energy savings and emission reductions. Shipping costs and carbon emissions did not differ among scenarios, indicating that shipping transit is still the most effective mode of transportation for cost reduction and emission reduction.
4.2.2. Impact of Road Carbon Emission Reduction
According to Hao’s research on truck fuel consumption in China, by improving the mileage utilization rate and fuel consumption rate, the total fuel consumption can be reduced by 23.4%, 38.7% and 42.9% by 2020, 2030, and 2050, respectively [40]. Therefore, in order to further analyze the impact of highway carbon emissions on overall carbon emissions, we conducted a sensitivity analysis by comparing highway carbon emission coefficients λ of 0%, 10%, 20%, 30%, 40%, and 50%. Considering that the road cost is a combination of various parts of which fuel consumption costs account for the largest portion [41], we only considered the reduction in highway fuel consumption costs when a change in highway carbon emission coefficient affects the highway cost. The results can be seen in Figure 5 and Table 11.
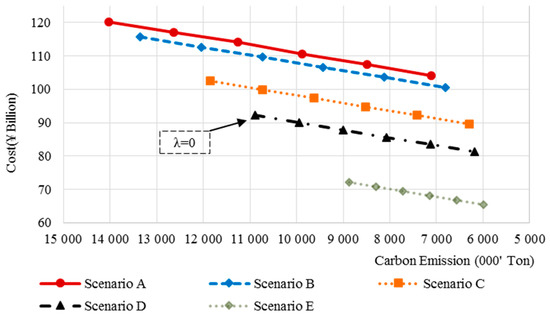
Figure 5.
Results of highway unit emission reduction.
Table 11.
Results of highway unit emission reduction.
The sensitivity analysis of highway carbon emission factor λ changes, shown in Figure 5 and Table 11, shows that by improving the efficiency of road transport by adopting new energy and other measures to improve the highways, a 50% reduction in carbon intensity will occur, so scenarios C–E have carbon emissions of 6.473 million tons, 6.19 million tons and 5.588 million tons, respectively. If the highway carbon emission intensity is reduced by 30%, Scenario A will have lower carbon emissions than the initial conditions of Scenarios B to D, but the transportation costs will still be higher than in those scenarios. Scenario E shows a more compact distribution under the change of highway carbon emission intensity, indicating that when many containers are transferred from road to railway transportation, the change of highway carbon emission intensity has no significant impact on the overall carbon emissions and cost of transportation. In addition, unless the future carbon emission intensity of roads is very optimistic and can be reduced by 40%, neither Scenario A, which adopts a single transportation mode, nor Scenario B, which takes a very low proportion of railway transportation, can achieve the carbon emissions seen in Scenario E, which adopts more railway and sea transportation.
5. Conclusions
Generally speaking, the focus of research on carbon emissions from freight transport is on the conversion from road transport to low-carbon transport, such as rail and water transport. As ports are important nodes of the international trade network, it is very important to incorporate carbon emissions and multimodal transport into port selection as key activities to improve the environmental performance of the maritime supply chain. Therefore, the economic aspects of port selection, such as port efficiency [7], port distribution [8], and port cost [9], have been emphasized in previous academic literature.
In the past few years, Sanchez et al. [12,13] have studied the possibility of using alternative ports as part of a global supply chain carbon reduction strategy. This study expanded the research of Sanchez et al. [12,13] using a comprehensive MCDM approach called entropy–TOPSIS to measure city freight performance. Additionally, this study integrated some important decision factors that are closer to reality, such as the reduction in road freight caused by the imbalance of freight supply and demand and the carbon tax to reflect government decision-making. Furthermore, previous studies did not link port selection to carbon emissions and multimodal transport, nor did they consider the carbon reduction effects of container route re-planning.
Specifically, this study constructed the entropy–TOPSIS freight demand allocation model and then proposed a multi-modal transport model based on the minimum freight rate to select five scenarios in Northeast China. The construction of the future road carbon emission reduction parameter λ reflects the future reduction of road carbon emissions, and the sensitivity of road freight reduction. Of the five scenarios, scenario E was shown to produce the lowest carbon emissions and cost. However, despite the railway transportation capacity of Dalian Port, the results show that Yingkou Port and Dandong Port will expand by 227.8% and 191.4% over 2017, respectively. Following the recent establishment of the Liaoning Port Group, a number of ports in Liaoning need to determine their functional positioning. In addition, the reduction in road freight will reduce the competitiveness of railway transportation and require more flexible pricing methods to improve railway competitiveness.
The model in this paper can be used as a starting point for future research. For example, with the rise of maritime supply chains, it will be interesting to consider full multimodal transport combining sea and land transportation. As the carbon emission intensity varies with different transport speeds, the speed variable should be added into the model in the future to evaluate the economic speed.
Author Contributions
Conceptualization, H.K.; Data curation, Y.H.; Formal analysis, X.L.; Methodology, X.L.; Project administration, H.K.; Supervision, H.K.; Writing—original draft, X.L.; Writing—review and editing, Y.H. All authors reviewed the results and approved the final version of the manuscript.
Funding
This research was funded by National Natural Science Foundation of China (grant number 71831002, 71672016), Program for Innovative Research Team in University of Ministry of Education of China (grant number IRT_17R13) and the Fundamental Research Funds for the Central Universities (grant number 3132019501, 3132019502).
Conflicts of Interest
The authors declare no conflicts of interest.
References
- D’Avignon, A.; Carloni, F.A.; Rovere, E.L.L.; Dubeux, C.B.S. Emission inventory: An urban public policy instrument and benchmark. Energy Policy 2010, 38, 4838–4847. [Google Scholar] [CrossRef]
- International Energy Agency (IEA). World Energy Outlook 2018; IEA: Paris, France, November 2018. [Google Scholar]
- Liao, C.-H.; Tseng, P.-H.; Lu, C.-S. Comparing carbon dioxide emissions of trucking and intermodal container transport in Taiwan. Transp. Res. Part Transp. Environ. 2009, 14, 493–496. [Google Scholar] [CrossRef]
- Liao, C.-H.; Tseng, P.-H.; Cullinane, K.; Lu, C.-S. The impact of an emerging port on the carbon dioxide emissions of inland container transport: An empirical study of Taipei port. Energy Policy 2010, 38, 5251–5257. [Google Scholar] [CrossRef]
- Hui-Huang, T. A comparative study on pollutant emissions and hub-port selection in Panama Canal expansion. Marit. Econ. Logist. 2015, 17, 163–178. [Google Scholar] [CrossRef]
- Corbett, J.J.; Deans, E.; Silberman, J.; Morehouse, E.; Craft, E.; Norsworthy, M. Panama Canal expansion: Emission changes from possible US west coast modal shift. Carbon Manag. 2012, 3, 569–588. [Google Scholar] [CrossRef]
- Ugboma, C.; Ugboma, O.; Ogwude, I.C. An Analytic Hierarchy Process (AHP) Approach to Port Selection Decisions—Empirical Evidence from Nigerian Ports. Marit. Econ. Logist. 2006, 8, 251–266. [Google Scholar] [CrossRef]
- Veldman, S.; Garcia-Alonso, L.; Vallejo-Pinto, J.Á. Determinants of container port choice in Spain. Marit. Policy Manag. 2011, 38, 509–522. [Google Scholar] [CrossRef]
- Chang, Y.-T.; Lee, S.-Y.; Tongzon, J.L. Port selection factors by shipping lines: Different perspectives between trunk liners and feeder service providers. Mar. Policy 2008, 32, 877–885. [Google Scholar] [CrossRef]
- Kengpol, A.; Tuammee, S.; Tuominen, M. The development of a framework for route selection in multimodal transportation. Int. J. Logist. Manag. 2014, 25, 581–610. [Google Scholar] [CrossRef]
- Notteboom, T.E. Complementarity and Substitutability among Adjacent Gateway Ports. Environ. Plan. Econ. Space 2009, 41, 743–762. [Google Scholar] [CrossRef]
- Sanchez Rodrigues, V.; Beresford, A.; Pettit, S.; Bhattacharya, S.; Harris, I. Assessing the cost and CO2e impacts of rerouteing UK import containers. Transp. Res. Part Policy Pract. 2014, 61, 53–67. [Google Scholar] [CrossRef]
- Sanchez Rodrigues, V.; Pettit, S.; Harris, I.; Beresford, A.; Piecyk, M.; Yang, Z.; Ng, A. UK supply chain carbon mitigation strategies using alternative ports and multimodal freight transport operations. Transp. Res. Part E Logist. Transp. Rev. 2015, 78, 40–56. [Google Scholar] [CrossRef]
- Wang, C.; Ducruet, C.; Wang, W. Port integration in China: Temporal pathways, spatial patterns and dynamics. Chin. Geogr. Sci. 2015, 25, 612–628. [Google Scholar] [CrossRef]
- Lam, J.S.L.; Gu, Y. Port hinterland intermodal container flow optimisation with green concerns: A literature review and research agenda. Int. J. Shipp. Transp. Logist. 2013, 5, 257–281. [Google Scholar] [CrossRef]
- Monios, J.; Wilmsmeier, G. The role of intermodal transport in port regionalisation. Transp. Policy 2013, 30, 161–172. [Google Scholar] [CrossRef]
- Malchow, M.B.; Kanafani, A. A disaggregate analysis of port selection. Transp. Res. Part E Logist. Transp. Rev. 2004, 40, 317–337. [Google Scholar] [CrossRef]
- Garcia-Alonso, L.; Sanchez-Soriano, J. Port selection from a hinterland perspective. Marit. Econ. Logist. 2009, 11, 260–269. [Google Scholar] [CrossRef]
- Sanchez, R.J.; Ng, A.K.Y.; Garcia-Alonso, L. Port Selection Factors and Attractiveness: The Service Providers’ Perspective. Transp. J. 2011, 50, 141–161. [Google Scholar] [CrossRef]
- Tongzon, J.L. Port choice and freight forwarders. Transp. Res. Part E Logist. Transp. Rev. 2009, 45, 186–195. [Google Scholar] [CrossRef]
- Wiegmans, B.W.; Hoest, A.V.D.; Notteboom, T.E. Port and terminal selection by deep-sea container operators. Marit. Policy Manag. 2008, 35, 517–534. [Google Scholar] [CrossRef]
- Psaraftis, H.N.; Kontovas, C.A. Ship speed optimization: Concepts, models and combined speed-routing scenarios. Transp. Res. Part C Emerg. Technol. 2014, 44, 52–69. [Google Scholar] [CrossRef]
- Chen, K.; Yang, Z.; Notteboom, T. The design of coastal shipping services subject to carbon emission reduction targets and state subsidy levels. Transp. Res. Part E Logist. Transp. Rev. 2014, 61, 192–211. [Google Scholar] [CrossRef]
- Liao, C.-H.; Lu, C.-S.; Tseng, P.-H. Carbon dioxide emissions and inland container transport in Taiwan. J. Transp. Geogr. 2011, 19, 722–728. [Google Scholar] [CrossRef]
- Chen, L.; Lin, B.L.; Wang, L.; Wen, X.H.; Li, J. Transfer of freight flow between highway and railway based on carbon emissions. J. Southeast Univ. (Nat. Sci. Ed.) 2015, 45, 1002–1007. (In Chinese) [Google Scholar]
- Meng, Q.; Wang, X. Intermodal hub-and-spoke network design: Incorporating multiple stakeholders and multi-type containers. Transp. Res. Part B Methodol. 2011, 45, 724–742. [Google Scholar] [CrossRef]
- Cavone, G.; Dotoli, M.; Epicoco, N.; Seatzu, C. Intermodal terminal planning by Petri Nets and Data Envelopment Analysis. Control Eng. Pract. 2017, 69, 9–22. [Google Scholar] [CrossRef]
- Heggen, H.; Molenbruch, Y.; Caris, A.; Braekers, K. Intermodal Container Routing: Integrating Long-Haul Routing and Local Drayage Decisions. Sustainability 2019, 11, 1634. [Google Scholar] [CrossRef]
- Zhao, Y.; Xue, Q.; Zhang, X. Stochastic Empty Container Repositioning Problem with CO2 Emission Considerations for an Intermodal Transportation System. Sustainability 2018, 10, 4211. [Google Scholar] [CrossRef]
- Christodoulou, A.; Raza, Z.; Woxenius, J. The Integration of RoRo Shipping in Sustainable Intermodal Transport Chains: The Case of a North European RoRo Service. Sustainability 2019, 11, 2422. [Google Scholar] [CrossRef]
- Patil, G.R.; Sahu, P.K. Estimation of freight demand at Mumbai Port using regression and time series models. KSCE J. Civ. Eng. 2016, 20, 2022–2032. [Google Scholar] [CrossRef]
- Fite, J.T.; Taylor, G.D.; Usher, J.S.; English, J.R.; Roberts, J.N. Forecasting freight demand using economic indices. Int. J. Phys. Distrib. Logist. Manag. 2002, 32, 299–308. [Google Scholar] [CrossRef]
- Li, Y.; Zhao, L.; Suo, J. Comprehensive Assessment on Sustainable Development of Highway Transportation Capacity Based on Entropy Weight and TOPSIS. Sustainability 2014, 6, 4685–4693. [Google Scholar] [CrossRef]
- Liang, X.; Liu, C.; Li, Z. Measurement of Scenic Spots Sustainable Capacity Based on PCA-Entropy TOPSIS: A Case Study from 30 Provinces, China. Int. J. Environ. Res. Public. Health 2018, 15, 10. [Google Scholar] [CrossRef]
- Dai, S.; Niu, D. Comprehensive Evaluation of the Sustainable Development of Power Grid Enterprises Based on the Model of Fuzzy Group Ideal Point Method and Combination Weighting Method with Improved Group Order Relation Method and Entropy Weight Method. Sustainability 2017, 9, 1900. [Google Scholar]
- Liu, L.; Zhou, J.; An, X.; Zhang, Y.; Yang, L. Using fuzzy theory and information entropy for water quality assessment in Three Gorges region, China. Expert Syst. Appl. 2010, 37, 2517–2521. [Google Scholar] [CrossRef]
- Opricovic, S.; Tzeng, G.-H. Compromise solution by MCDM methods: A comparative analysis of VIKOR and TOPSIS. Eur. J. Oper. Res. 2004, 156, 445–455. [Google Scholar] [CrossRef]
- Yang, L.; Cai, Y.; Zhong, X.; Shi, Y.; Zhang, Z. A Carbon Emission Evaluation for an Integrated Logistics System—A Case Study of the Port of Shenzhen. Sustainability 2017, 9, 462. [Google Scholar] [CrossRef]
- Downie, J.; Stubbs, W. Evaluation of Australian companies’ scope 3 greenhouse gas emissions assessments. J. Clean. Prod. 2013, 56, 156–163. [Google Scholar] [CrossRef]
- Hao, H.; Wang, H.; Ouyang, M. Fuel consumption and life cycle GHG emissions by China’s on-road trucks: Future trends through 2050 and evaluation of mitigation measures. Energy Policy 2012, 43, 244–251. [Google Scholar] [CrossRef]
- Wang, L. An Empirical Study on the Structure and Driving Factors of China’s Road Transportation Cost Based on GTC Model. J. Beijing Jiaotong Univ. (Soc. Sci. Ed.) 2013, 12, 7–13. (In Chinese) [Google Scholar]


© 2019 by the authors. Licensee MDPI, Basel, Switzerland. This article is an open access article distributed under the terms and conditions of the Creative Commons Attribution (CC BY) license (http://creativecommons.org/licenses/by/4.0/).