Abstract
The rapid growth of crop yield in China was maintained by more fossil fuel inputs in the past years, causing concern about the greenhouse gas (GHG) emissions related to crop production. Therefore, this study analyzed historical dynamics of carbon footprint (CF) of 11 major crops in China during 2000–2016 and estimated possible GHG emissions of the system in 2020 under different scenarios. Results indicated that the GHG emissions of the Chinese crop system increased by 20.07% from 2000 to 2016, in which the grain crops contributed to more than 80% of the total emissions. The GHG emissions from grain crops including maize, wheat, and rice as well as sugar crops including sugarcane and sugar beet were increased by 28.07% and 14.27% in the study period, respectively, making up the primary factor of increased GHG emissions of crop system in China. Moreover, if the cropping pattern and agricultural practices is not improved in the future, the GHG emissions from Chinese crop system are estimated to increase by 346.19 million tons in 2020. If advanced agricultural policies and practices are implemented, the GHGs emissions of crop system in China in 2020 are estimated to be 2.92–12.62% lower than that in 2016. Overall, this study illustrated that the crop system in China contributed to the growth of GHG emissions in China over the past decades. Improving utilization efficiency of fertilizers and crop structure in China are the most important ways to reduce GHG emissions from the Chinese crop system.
1. Introduction
Global warming is a significant challenge that humans have to confront. The global surface average temperature is likely to rise 0.3 °C to 1.7 °C and 2.6 °C to 4.8 °C in the lowest and highest emissions scenarios, respectively, toward the end of the 21st century [1]. The climate warming may result in melting glaciers, meteorological disaster, and ecological degradation. The recent IPCC report addressed that the climate-related risks for natural and human systems were higher for global warming of 1.5 °C than at present [2]. A sharp increase in anthropogenic greenhouse gas (GHG) emissions is a major contributor to rising temperatures. Greenhouse gases absorb radiant energy, accelerating the potential for global warming (GWP). Therefore, how to reduce the diffusion of GHG into the atmosphere by different sectors to reduce global warming has become an important issue.
Agriculture has an important role in mitigating climate change [3,4], contributing to about 14% to the total GWP in the world [5]. Annual total non-CO2 GHG emissions from agriculture in 2010 were estimated to be 5.2–5.8 Gt CO2-eq per year, comprising about 10–12% of global anthropogenic emissions [6]. Globally, feed production, processing, and transport contributed about 3.2 Gt CO2-eq, accounting for about 45% of the livestock sector’s emissions [7]. Gan et al. [8] reported that agriculture in Canada produced approximately 62 million tons of CO2-equivalent emissions in 2008, about 8% of Canada’s total emissions. Webb et al. [9] showed that agricultural production caused about 9.0% of GHG emissions in UK in 2012. Edenhofer [10] indicated that GHG emissions from agriculture, forestry and relative sectors accounted for 24% of total anthropogenic GHG emissions activity in 2010, among which agricultural emissions from livestock, soil, and nutrient management held a dominating share. Thus, agriculture sector has become increasingly important as a global solution to stabilize anthropogenic GHG emissions [11].
China is one of the largest agricultural countries in the world. In the past decades, the crop sector in China has developed rapidly in its yields and varieties. For example, the production quantities of grain and oil crops in China increased by 42.90% and 15.07% from 2000 to 2016, respectively [12]. However, the rapid growths of crop yields were primarily maintained by more agricultural inputs. In 2016, 59.8 million tons of chemical fertilizers and 923.8 billion kWh of electricity were consumed on 166.94 million ha arable land for crop production in China [10]. These inputs result in GHG emissions after the application of agricultural inputs on field, and a large amount of GHG are also generated during the inputs’ upstream production [13]. Hence, the quantitative analysis on the GHG emissions of the cropping system in China contributes to setting a research foundation for the reduction of GWP in the Chinese crop sector.
Carbon footprint (CF) refers to calculating the sum of greenhouse gas emission and consumption in the production system based on the life-cycle assessment method and evaluating the impact on climate change in the form of CO2-equivalent [14]. By now, the CF has been widely applied to the studies of agricultural systems and products over the world, such as durum wheat in Canada [15], tomato in Spain and Portugal [16], soybean and maize in Argentina [17], etc. A few researchers have paid attention on the CF quantification of crop products in China in recent years. Huang et al. [18] calculated the regional carbon footprints of rice, maize, and soybean production in Northeast China during 2004–2013 using provincial statistical data. Huang et al. [19] quantified the CFs of rice, wheat, and maize production based on agricultural inputs from 1978 to 2012. Zhang et al. [13] investigated the CFs of the same crops by matching local emission factors to production practices in the current cropping system. Wang et al. [20] analyzed the change of CFs of maize, rice, wheat, and soybean during 2000–2015. Moreover, some studies calculated the CFs of crop production by comparing the diversified cropping systems. For example, Yang et al. [21] compared the CFs of five cropping rotation systems in the North China Plain, which referred to peanut, cotton, and sweet potato, besides the main grains. Wang et al. [22] quantitatively analyzed the CFs of the cotton system in the North China Plain in different fertilization and irrigation conditions. Ma et al. [23] analyzed the CFs of maize in a continuous monoculture and in rotation with a leguminous crop. China is one of the largest agricultural countries in the world and the crop sector in China has developed rapidly in its yields and varieties in the past decades. Researches have made great contributions to further the understanding of the effects of crop production in China on GWP. However, the published studies primarily focused on grain crops including wheat, rice, and maize, while the CFs of other crops that accounted for large area in China are rarely reported. This limit has resulted in the exact situation of the GWP of cropping system in China not being comprehensively reflected. Meanwhile, the majority of published papers only considered CFs from the upstream production of agricultural inputs but neglected on-farm emissions from agricultural operation, leading to incomplete quantitative results. Moreover, the studies have only paid attention to the historical change of CFs of specific crops but do not estimate the future trend of CFs of the cropping system in China.
Based on the considerations above, in this article, the CFs of primary cropping products in China were calculated based on the national statistical data during 2000–2016. Then, the total GHGs emissions of the cropping system in China were calculated based on the CFs achieved in this study. Finally, possible quantity of GHGs emissions of crop production in China in 2020 was estimated under different scenarios. This new information contributes to comprehensively understanding the GHGs emissions of Chinese agriculture.
2. Methods
2.1. Research Boundary
This study considered the primary crop products in mainland China including maize, wheat, rice, soybean, peanut, cotton, oilseed rape, sugarcane, sugar beet, mulberry, and tobacco. The seeding area of the crops accounted for over 71% of total seeding area in China in 2016 [10]. Thus, the quantification of CF on the cropping systems could reflect the basic characteristics of GHG emissions of the cropping system in China.
Figure 1 presents the system boundary of CF accounting of the crops. The 11 crops were divided into four categories in this study, including grain, oil, sugar, and other cash crops. The GHGs considered in the study include CO2, CH4, and N2O of crop production.
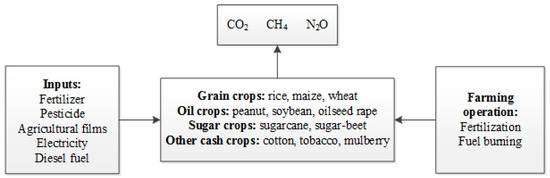
Figure 1.
Research boundary of carbon footprint calculation of the crop systems in China in this study.
The CF calculation of the cropping systems consisted of two components based on the Equation (1)—those (CFinputs) from the manufacturing and transportation of agricultural inputs such as fertilizers, pesticides, agricultural films, electricity, and diesel fuel, as well as those (CFon-field) from the application of fertilizer and fuel for field operations.
where i referred to the crop types.
2.2. Carbon Footprint Calculation
2.2.1. CFinputs Estimation
The CFinputs,i emissions (kg CO2-eq ha−1) was calculated according to Equation (2) as follows:
where i referred to the crop types; was the amount of agricultural input; was the emission factor of the nth agricultural input (Table 1).

Table 1.
Greenhouse gases (GHGs) emission coefficients of agricultural input used in the case.
2.2.2. CFon-field Estimation
The CFon-field (kg CO2-eq ha−1) is primarily derived from the emissions of N2O, CO2, and CH4. The CFon-field emissions were calculated according to Equation (3). It should be noted that the CH4 emission is normally negligible for the upland crops, expect for rice.
where i referred the crop types.
The anthropogenic emission of N2O (, kg CO2-eq ha−1) generally occurs through a direct pathway () (application of chemical nitrogen fertilizer and manure on field, crop straw burning, crop straw returned directly to the field, and residual nitrogen in the root stubble) and through two indirect pathways (following volatilization of NH3 and NOx () and after leaching and runoff of N from managed soils () [26]. In this study, the N2O emissions from crop burning, straw returning, and root stubble on field were not considered due to the unavailable data. Therefore, the was calculated according to Equation (4) as follows:
where i referred to the crop types; was the factor of the direct N2O emission, which was 0.01 according to IPCC [26]; the factors of indirect N2O emission from NH3 volatilization and N leaching/runoff, which were 1% (EF2) and 0.75% (EF3), respectively [26]; C was the conversion factor of N2O (1.57) [26]; the single molecule warming potential of N2O is 265 times than that of CO2 [27].
NH3NF,i was calculated according to the following Equation (5):
where i referred to the crop types; and were the factors of NH3 volatilization, which were estimated for 10% (EF4) of N application from chemical nitrogen fertilizers and 20% from animal manure (EF5), respectively [26]; and referred to the application amount of chemical nitrogen fertilizer and manure for i crop, respectively.
was calculated according to the following Equation (6):
where i referred to the crop types; was the factor of N leaching/runoff, which was estimated for 30% of total N input based on IPCC [26]; referred to the N inputs from chemical fertilizer and manure for i crop.
According to IPCC [26], the CO2 emission on field primarily derives from fuel burning and urea fertilization on field. In this study, the CF of fuel burning was included in the calculation of indirect CFs. Thus, only the CF of urea fertilization was estimated by Equation (7):
where i referred to the crop types; referred to the CO2 emissions for crop i, kg CO2-eq ha−1; referred to the input amount of urea fertilization; the emission factor (EF7) was 0.20 [26].
The CH4 emission from rice field was estimated based on Equation (8) [26]
where referred to the CH4 emissions of rice field, kg CO2-eq ha−1; t was the cultivation period of rice, which was estimated to 180 days in the case; EFC referred to the baseline emission factor for continuously flooded fields without organic amendments, which was 1.30 kg CH4 ha−1 d−1; SFW referred to the scaling factor to account for the differences in water regime during the cultivation period, which was 0.78; SFP was 1.00, referring to the scaling factor to account for the differences in water regime in the pre-season before the cultivation [26]; ROA referred to the application amount of manure on field each year; CFOA referred the conversion factor for manure, which was 0.14 according to Zhang [13]. The 100-year GWP of CH4 is 28 times the intensity of CO2 on a mass basis [27].
2.3. CF Indices
The CFs accounting of agricultural systems is always expressed in terms of the CF on unit area. In order to avoid the one-sided result deriving from the application of a single functional unit, this study analyzed the CFs of different crops based on a multiple perspectives, including the CFs on unit area (CFA, kg CO2-eq ha−1) and on unit yield (CFY, kg CO2-eq kg−1).
2.4. Total GHGs Emission Estimation of Cropping System in China
There is practical significance in the calculation of total GHG emissions of cropping system in China, especially when determining the potential scale of reducing emissions. The total GHG emissions of the cropping system in China was estimated by Equation (9) as follows:
where i refers to the crop types; (kg CO2-eq) referred to the total GHG emissions of cropping system in China; (ha) was the seeding area of the crop i; (kg CO2-eq ha−1) was the CF of the crop i on unit area.
2.5. Scenario Analysis
Based on the historical CFs accounting of the main crops in China, this study intended to estimate the GHG emissions of cropping system in China in the following several years. Therefore, we set five possible scenarios of affecting the GHG emissions of crop system in China according to China’s official agricultural policies and FAO’s projection (Table 2).
Table 2.
Potential scenarios affecting the GHG emissions of the crop system in China.
2.5.1. Scenario A: Population Change
If the dietary structure of Chinese was assumed to be constant in the following several years, the ratios of grain, oil, sugar crops, cotton, tobacco, and mulberry accounting for the cropping system in China would be considered to be stable. In this context, the total GHGs of the cropping system in China would be positively correlated to the population in China. According to the projection of United Nations [28], the total population in China will be 1.44 billion in 2020. Accordingly, the total GHGs emissions of Chinese crop production in 2020 were estimated under the scenario A.
2.5.2. Scenario B: Improved Crops Structure
In 2016, the Ministry of Agriculture and Rural Affairs in China issued a “National plan for adjustment of planting sector structure” [29]. This official document set a series of goals of adjust the seeding area of crops in China by 2020 (Table 2). The objectives were selected as basis to estimate the possible GHG emissions of the crop system in China. Moreover, the seeding area of tobacco in China was estimated to be 858.3 thousand ha in 2020 based on the annual declined rate of 7.4% from 2013 to 2017 [12]. The GHG emissions of mulberry production was not considered in Scenario B due to unavailable data source.
2.5.3. Scenario C: Reduced Fertilizer Input
In order to deal with the excessive application of chemical fertilizer in China, the Ministry of Agriculture and Rural Affairs in China issued an official plan named “zero growth action plan for mineral fertilizer and pesticide use by 2020” in 2015 [30]. According to the plan, the use efficiency of chemical fertilizer (UECF) was expected to increase by more than 40% by 2020. In general, the UECF in China was presently considered to be only about 30% [31]. Therefore, Scenario C estimates that the application amount of mineral fertilizer will be reduced by 10% if the UECF in China reaches its official objective in 2020.
2.5.4. Scenario D: Integrated Livestock-Cropping Approach
An integrated livestock-cropping agricultural system is an important approach to develop organic agriculture. Today, there are a few significant policies and practical experimentations in China meant to reconstruct the integrated agricultural system. One of their core points is to increase the application proportion of animal manure to farmland. According to the Chinese government’s plan, the nutrient returning rate of animal manure should be increased by 10% by 2020 [30]. These objectives were selected as basis to estimate the possible GHG emissions of crop system in China.
2.5.5. Scenario E: Increase Biodiversity
Biological control was an effective approach to increase biodiversity in farmland and reduce the pesticide use. According to the official “zero growth action plan for mineral fertilizer and pesticide use by 2020”, the proportion of biological control in farmland in China was expected to be 10% higher in 2020 than that in 2014 [30]. Accordingly, this study assumed that the application quantity of pesticide in cropping system in China would be reduced by 5% by 2020 due to the larger area of biological control.
2.6. Raw Data Sources
In this study, three data sets were applied. The first one was about inputs and outputs details of each crop, which were from the National Agricultural Cost-Benefit Data Assembly [32] and the Price Yearbook of China [33] during 2000–2016. The inputs of pesticide, agricultural film, and electricity were recorded in money (RMB) per unit area in the National Agricultural Cost-Benefit Data Assembly), thus the consumed quantities of the inputs were calculated according to the price and the money input for each crop. The data set was used for the CFs calculation of different crops. The second data set was the seeding area of the crops in China over the same period [12], which were applied for estimating the total GHG emissions of the cropping system in China. The third data set was raw data for scenario analysis in the study, which were specifically indicated in the scenario analysis section.
3. Results
3.1. Total GHG Emissions of Cropping System in China
As shown in Table 3, the total GHGs of cropping system in China was increased from 272.37 million tons CO2-eq in 2000 to 332.48 million tons CO2-eq in 2016. During the period, there was a reduction from 2000 to 2005 and then a steady increase in the following years. The variation trend of GHGs of the grain and oil crops was consistent with the total variation trend. The GHGs from grain and oil crops increased by 28.07% and 0.43% during 2000–2016, respectively. The GHGs of sugar crop showed the highest increased ratio (14.27%), from 5.80 million tons CO2-eq in 2000 to 6.63 million tons CO2-eq in 2016. However, the other cash crops decreased by 6.11% from 2000 to 2016.
Table 3.
The total GHGs of crop systems in China (unit: million tons CO2-eq).
The proportion of GHG emissions from grain crops has always been the highest, and the proportion was slightly increased from 79.41% in 2000 to 83.32% in 2016. Instead, the GHG emissions of oil and other cash crops both showed a reduction, from 9.20% and 9.25% in 2000 to 7.65% and 5.70% in 2016, respectively. The share of GHG emissions of sugar crops was also decreased from 2.13% in 2000 to 1.99% in 2016. Generally, the total GHGs of the cropping system in China was increased by 20.07% during 2000–2016. This increase in GHGs was mainly derived from the increased agricultural inputs of grain and sugar crops during the past few years. On the other hand, the reduced planting areas of tobacco, cotton, and mulberry contributed to the decreased GHG emissions of other cash crop.
3.2. CFs of Different Crops in China During 2000–2016
3.2.1. Grain Crops
Figure 2a,b, respectively, show the change of CFA and CFY of the grain crops including maize, wheat, and rice from 2000 to 2016. The CFA of wheat increased by 21.73% in this period, reaching to 3186.33 kg CO2-eq ha−1 in 2016. The CFY of wheat showed an obvious fluctuation in the same period, from 0.67 kg CO2-eq kg−1 in 2000 to 0.42 kg CO2-eq kg−1 in 2008, and then from the lowest point to 0.52 kg CO2-eq kg−1 in 2016. Nevertheless, the CFY of wheat still decreased by 22.4% during 2000–2016. The CFA of maize showed a slight growth of 3.90% from 2000 to 2016, while the CFY of maize reduced by 22.73% in the same period. Additionally, the CFA of rice changed insignificantly, but the CFY of rice showed a stable decline trend, from 0.50 kg CO2-eq kg−1 in 2000 to 0.41 kg CO2-eq kg−1 in 2016. Generally, an increasing trend could be seen in the CFA of wheat and maize during 2000–2016, while the CFA of rice basically remained stable during this period. The CFY of grain crops presented a declining trend.
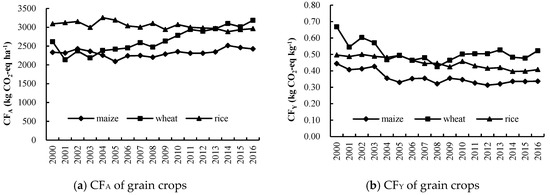
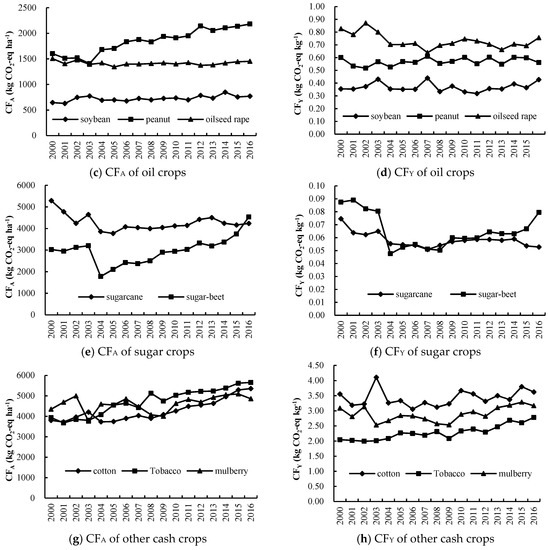
Figure 2.
The change of CFA and CFY of 11 types of crops between 2000 and 2016.
3.2.2. Oil Crops
Figure 2c,d illustrated the change of the CFA and CFY of oil crops including peanut, oilseed rape, and soybean during 2000–2016. The CFA of peanut in 2016 was increased by 36.10% compared to that in 2000. The CFA of soybean rose up by 19.43% during 2000–2016. A different tendency was reflected to the CFA of oilseed rape, which showed a bit reduction rate of 3.53% over the same decades. The CFY of oil crops showed the similar fluctuation from 2000 to 2016. However, the CFY of peanut and oilseed rape, respectively, dropped by 6.46% and 8.52% during the period, while the CFY of soybean in 2016 was increased by 20.43% compared to that in 2000. Generally, the CFs of oil crops were not significantly changed during the past years, except for the rapid growth of peanut CFA.
3.2.3. Sugar Crops
Figure 2e,f indicated the change of CFA and CFY of sugar crops including sugarcane and sugar-beet from 2000 to 2016. There was an overall upward trend for the CFA of sugar-beet, from 3024.87 kg CO2-eq ha−1 in 2000 to 4531.40 kg CO2-eq ha−1 in 2016. Rather, the CFA of sugarcane decreased from 5287.15 kg CO2-eq ha−1 in 2000 to 4531.40 kg CO2-eq ha−1 in 2016. For the CFY, a reduction trend is presented for both of the sugar beet and sugarcane from 2000 to 2004. After that, the CFY of the crops were closed during 2004–2014. Since 2015, however, the CFY of sugar beet rose gradually to 0.07951 kg CO2-eq kg−1 while the CFY of sugarcane went down to 0.05274 kg CO2-eq kg−1 in 2016. Generally, the CFY of sugar beet and sugarcane in 2016 were 9.12% and 29.28% lower than that in 2000, respectively.
3.2.4. Other Cash Crops
Figure 2g,h showed the change of CFA and CFY of cotton, tobacco, and mulberry during 2000–2016. The CFA of cotton, tobacco, and mulberry grew up during the past years with an increasing rate of 48.83%, 43.74%, and 11.79%, respectively. Meanwhile, the CFY of cotton, tobacco, and mulberry in 2016 were increased by 1.94%, 3.61%, and 2.56%, respectively, compared to 2000. In general, the CF of other cash crops presented a clear growth trend during 2000–2016.
3.3. Contributions Analysis
Figure 3 showed the source of the carbon footprint of cropping system in China during 2000–2016. On-field emission from fertilization was continuously the largest source of GHG during the study period, although the percentage of it to the total GHG was decreased from 51.82% in 2000 to 38.67% in 2016. The contribution from upstream emissions of fertilizers remained approximately 22.38% during 2000–2016, making up the second largest item. Moreover, the contribution of pesticides, electricity, and fuel for total GHG emissions of the cropping system in China continuously increased during 2000–2016.
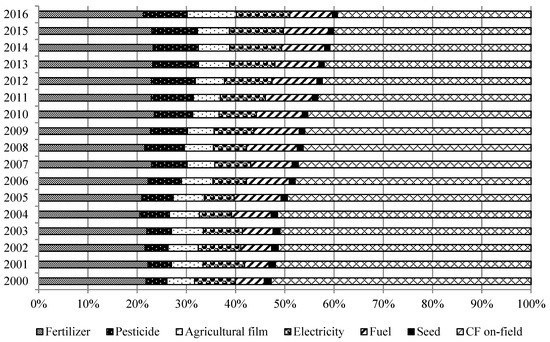
Figure 3.
The source of the carbon footprint of crop systems in China from 2000 to 2016.
3.4. Scenario Analysis
The estimated GHGs emissions of cropping system in China in 2020 are presented in Table 4. Compared to the GHGs emissions of the Chinese crop system in 2016, the GHG emissions will rise to 346.19 million tons CO2-eq in 2020 if only considering the change in the Chinese population. Under the scenario of improved cropping structure, the value will be reduced to 301.90 million tons CO2-eq in 2020. Compared to the GHGs emissions in 2016, the emissions under scenarios C, D, and E will decrease by 0.41−6.77% if the plan of “zero growth action for mineral fertilizer and pesticide use” can be well implemented by 2020. Therefore, the reduction of mineral fertilizer input would be the most effective approach. In addition, if all the scenarios are comprehensively considered, the GHGs emissions of crop system in China in 2020 are estimated to be 2.92−12.62% lower than in 2016. This result reflects that the GHGs emissions of the Chinese cropping system can be expected to be reduced when the advanced agricultural policies and practices were well performed in the following years.
Table 4.
Scenario analysis of GHGs emission from crop system in China in 2020 (Unit: million tons CO2-eq).
4. Discussion
4.1. Historical Dynamics of GHG Emissions from the Cropping System in China
This study quantitatively accounted the GHG emissions of cropping system in China during 2000–2016. The results showed a fluctuating rising state of the total GHGs of the system in the study period. The total GHGs of cropping system in China was 332.48 million tons CO2-eq in 2016, increasing by 20.07% compared to that in 2000. At present, China has been the largest contributor to global CO2 emissions, with 29% of global CO2 emission in 2015 [34]. The Chinese government promised to reach tthe highest point of GHG emissions in 2030 through diversified technologies for reducing emissions. This promise means that the amount of GHG emissions in China are required to decrease by 4.98 billion tons CO2-eq before 2030 [35]. Recently, it was reported that the CO2 emissions in China have reduced by 0.2% or 0.5% in 2016 compared to 2015 [34]. This result implied that the cropping system in China did not contribute to the reduction of GHGs emissions during the past decade. Instead, the cropping system was pushing up the growth of GHGs emissions in China. Duan et al. [36] found similar results, indicating the GHG intensity of farmland in China was increased from 0.46 t ha−1 in 1990 to 0.71 t ha−1 in 2009. Zhen et al. [37] reported that the agricultural GHG emissions in China exhibited an increasing trend from 1997 to 2014. Liu et al. [35] indicated that the carbon emission of China’s crops production increased significantly during 1993–2013. Therefore, the studies illustrated that the mission of lowering GHG emissions from cropping sector should receive more attention from the Chinese government.
According to the results in the study, the proportion of GHG emissions from grain crops has been the highest from 2000 to 2016. Specifically, the CFA of wheat and maize was on the rise, while that of rice was basically stable during this period. Zhang et al. [38] simulated CH4 emissions of rice cultivation in China and showed that the amount of CH4 emissions gradually increased to 6.85 Tg yr−1 in 2009. Xu and Lan [39] reported that the GHG emissions from wheat, maize, and rice increased by 1.94% each year from 2004 to 2013. Huang et al. [19] indicated that the average increase rates for rice, wheat and maize production in China from 1978 to 2012 were correspondingly 41, 60 and 41 kg CO2-eq ha−1 per year. Clearly, the GHGs emissions of grain crops in China kept an uptrend for a long time. Therefore, wheat production presented the most rapid growth of GHG emissions during the past few years, followed by maize and rice.
Other economic crops including cotton, tobacco, and mulberry showed the fastest growth for the GHGs emission from 2000 to 2016. Specifically, the CF of cotton, tobacco, and mulberry in China presented the obvious rising trend during the research period. Wang et al. [22] analyzed the CF of cotton production in Hebei province in China and concluded that the CF per unit area reached to 3.27 t CO2-eq ha−1. Günther et al. [40] showed the average increase rate of cotton’s CF in Xinjiang region in China was 21.29% during 2007–2012. Liu et al. [41] reported that the cotton cropping system functioned as a large GHG source, averagely producing 4.60 t CO2-eq ha−1 yr−1 in China. Moreover, the information on CF of tobacco and mulberry in China has been lacking. The rapid growths of GHG emissions from cotton, tobacco, and mulberry in China can be expected because the economic crops always require more agricultural inputs to increase their yields. The result in the present case also implies that more attention should be paid to the GHG emissions from the economic crops in China in the future due to the obvious increase during 2000–2016.
Furthermore, the CFs of oil crops did not change significantly in the past years, except for the rapid growth of peanut CF on unit area. The CFs of sugar crops also maintained an increase trend from 2004 to 2016, in which sugar beet CF per unit area rapidly increased by 154.7% in 2016 compared to 2004. Cheng et al. [42] presented that the CF of soybean in China was 222 kg CO2-eq ha−1. Huang et al. [18] calculated the CF of soybean production in the Northeast China Plain during 2004–2013, showing a similar increased trend. Zou et al. [43] reported the CF of peanut on unit area in Shandong province in China was 3.93 t CO2-eq ha−1. However, the studies did not show the temporal patterns of the crops’ CFs. Meanwhile, the research on the CFs of peanut, sugarcane, and sugar beet in China have been rarely reported. Nevertheless, the increased trend of GHG emissions from the crops, especially the peanut and sugar beet, in China in the research period has been noticed.
In conclusion, the GHG emission of the cropping system in China generally showed an obvious growth during the past few decades. Therefore, the increase rates of CF on unit area of wheat, peanut, sugar beet, cotton, tobacco, and mulberry were clearly higher than other crops in China.
4.2. Comparison of Crops’ CFs in Different Nations
CF has been widely accepted as an effective indictor to compare the amount of GHG emissions induced by agricultural production in different nations. According to the results of this research, the average CFs of grain, oil, sugar, and other cash crops were, respectively, 2.67 t CO2-eq ha−1, 1.33 t CO2-eq ha−1, 3.62 t CO2-eq ha−1, and 4.53 t CO2-eq ha−1 in China during the past few years (Table 5). It should be noted that the CF values of the crops showed clear difference with the ones in other countries.
Table 5.
Comparison of Crops’ CFs in different nations (unit: million tons CO2-eq).
Nicola et al. [44] indicated that the CF of durum wheat in Italy was 2.34 t CO2-eq ha−1 and 22.69% lower than that in China. Pittelkow et al. [45] presented that the CFA of rice in Uruguay was 1.06 t CO2-eq ha−1, while the CF of rice in China was 63.93% higher than that. Vetter et al. [46] reported that the CF of wheat production in India was decreased by 67.77% compared to that in China. Singh and Ahlawat [47] found that the CFs of peanut and cotton production in India were 1.06 t and 1.30 t CO2-eq ha−1, respectively, which were 50.12% and 73.79% lower than that in China. García et al. [48] reported that the CF of sugarcane in Mexico was 3.44 t CO2-eq ha−1, reducing by 20.17% compared to the one in China. Of course, the CFs of agricultural products in some regions are always higher than that in China. For instance, Arrieta et al. [17] found that the average CF of soybean in Argentine was 2.18 t CO2-eq ha−1, which was 179.03% higher than that in China. Forleo et al. [49] found the average CF of Italian oilseed rape was 1.47 t CO2-eq ha−1, which was 3.55% higher than that in China. Arrieta et al. [17] reported that the CF of maize in Argentine was 5.41 t CO2-eq ha−1, 124.26% higher than that of Chinese maize.
Generally, the difference among the results might be caused by various climate factors in different regions that influenced the selections of crop varieties and agricultural practices. On the other hand, the higher level of CFs of crops in China, compared to some nations, possibly showed the existing potential to lower the CFs of these Chinese crops in the future. Moreover, the results also implied that the GHG emissions of a country could be reduced by importing some agricultural products, which were domestically produced with the higher CFs, from other countries that produces the crops with the lower CF. The point is being paid more attention all over the world [50,51,52].
4.3. Future Estimation of GHGs from Cropping System in China
In this study, the total GHG emissions from cropping system in China was estimated to be 346.19 million tons CO2-eq in 2020 under current agricultural condition, increasing by 4.10% compared to that in 2016. It showed that the challenge of lowering GHG from cropping system in China would still be huge and even be aggravated in 2020 because the Chinese government promised a heavy task to reduce GHG in the future. In fact, considering the rapid growth rate of CFs of crops in China during 2000–2016, the total GHG emissions from the cropping system in China would likely be higher than the current estimated results in the study. In addition, the estimated results in the paper were based on the assumption of unchanged planting areas of different crops. However, according to the forecast of the agricultural outlook report on the production of major agricultural products in China [53], the consumption of animal products in China will maintain a rapid growth due to increased incomes and accelerated urbanization. For example, the requirements for egg, meat, and milk were expected to be 40.98, 156.34, and 83.72 million tons by 2050 [53], respectively. As a result, the demand of crop products, especially corn, soybean, etc., will likely be increased. In other words, Chinese demand for crop products will be higher than the direct demand resulted from population growth in the future.
Of course, the Chinese government issued an official plan named the “zero growth action plan for mineral fertilizer and pesticide use by 2020” in 2015 [30]. The GHG from the cropping system in China will be reduced if the objectives of this plan can be well implemented. According to the official statistics in China [12], the application quantity of mineral fertilizer in China decreased from 60.23 million tons in 2015 to 58.59 million tons in 2017. The results in this study demonstrate that the GHG emissions derived from the upstream production and application of field of mineral fertilizer was the largest contribution to the cropping system. Therefore, we can expect the possibility of GHG reduction for crop production in China in the future due to the implementation of the official plans. The scenario analysis results also demonstrated the projection.
Generally, the problem about how to reduce GHG emissions from cropping system in the future will still be a severe challenge for China, although we can expect some positive changes due to the effective implementation of restricting the use of mineral fertilizers and pesticides.
4.4. Mitigation Measures
This study illustrated that the GHG emissions from the cropping system in China increased during 2000–2016 and will still cause huge pressure in the future for developing a low-carbon economy in China. Therefore, the urgent task faced by the Chinese government is how to effectively mitigate the GHG emissions from the cropping system in China.
First, we found that the crops’ CFs on unit area and unit yield normally presented different change trend during the research period. For example, the CFA of grain crops were rapidly increased from 2000 to 2016, while CFY showed downtrend in the same period. Wang et al. [54] also presented decreased CFs per unit yield for wheat, maize, rice, and soybean in China during 2000–2015. In fact, the change trends of CFA and CFY primarily resulted from the fact that output was not taken into account during the calculation of CFA. In other words, crop products with higher CFA and higher yields possibly showed the lower CFY. Wang et al. [54] indicated that the increase of crop production input could result in the decrease of CFY. Thus, it implied that increasing yield would be an effective way to reduce GWP in cropping systems.
Moreover, improved agricultural practices can significantly reduce GHG emissions of agricultural production [55]. The GHG from mineral fertilizer including production and application on field was continuously the largest source of GHGs of cropping system during the study period. The result is consistent with other studies [8,47,48]. Therefore, the most key point for GHG mitigation of the cropping system is to improve the utilization rate of mineral fertilizer. Gan et al. [8] indicated that the CFs of canola and wheat could be decreased by 7% if the use efficiency of nitrogen fertilizer increased by 10%. Cheng [42] found improved nitrogen fertilization for maize and wheat in China could reduce N2O emission to 540 kg and 760 kg CO2-eq ha−1 per year, respectively. Zhang [13] reported that the CFA of wheat, maize, and rice, respectively, would be reduced by 304, 1349, and 798 kg CO2-eq ha−1 when applying advanced techniques for nitrogen fertilizer.
Irrigation, agricultural machines, and pesticide are also important reasons for the GHG emission of the cropping system. Carrillo Cobo et al. [56] found that an advanced irrigation pattern could reduce the current GHG emissions of crop production by 8.56% in Spain. Singh and Ahlawat [47] reported that transgenic technology could reduce the use of pesticides and increase the yield of cotton production in India. García et al. [48] indicated that improving irrigation technology contributed to reduce the CF of sugarcane production in Mexico.
Meanwhile, a diversified cropping system also contributes to the development of low-carbon agriculture in China. Gan et al. [8] suggested a rotation system including nitrogen fixation crops and durum wheat could reduce CF by 20% compared to a monoculture cereal system. Chai et al. [57] illustrated that maize intercropping with rape, pea and wheat in arid irrigation areas produced 68−256% more energy yield with 42−52% less carbon emission compared with the sole maize crop. Gan et al. [58] reported the per-area CF of the rotation system of lentil-wheat was 226.22% lower than the traditional fallow-wheat-wheat system. Zou et al. [43] showed that the intercropping of maize and peanut led to lower CF on unit area than monoculture system. Samarappuli et al. [59] suggested that maize-forage sorghum intercrop could reduce CF by 7.3% compared to the maize mono-cropping system.
Finally, it is worth considering that the Chinese government should adjust the cropping structure in China. Zhang et al. [13] and Wang et al. [20] both indicated the GHG emissions from grain crops could be reduced by substituting a higher CF crops with lower CF ones. The Ministry of Agriculture and Rural Affairs of China also issued the “adjustment plan of national planting structure during 2016–2020” [29]. Consequently, it will be of significant importance to adjust the cropping structure in China based on a low-carbon perspective in the future.
Advanced agricultural practices contribute to reduce GHG emissions of a cropping system. Improved crop layout at the national level is also an important factor to lower the total GHG of the cropping system in China. Of course, regional advantages and disadvantages are quite various due to large differences of natural and economic conditions in different areas in China. Thus, the effects and costs of specific technologies that are suitable for the cropping systems in different regions should be carefully considered. In other words, it is very necessary to apply a comprehensive evaluation method, based on ecological, economic, and social perspectives, to estimate the potentials of low-carbon agricultural technologies and policies in different regions in the future.
4.5. Limitations in the Study
We noticed that the specific CF values of the are slightly different between the present study and other published papers. For example, the results from Huang et al. [19] and Xu and Lan [39] were smaller than that from this study in the same year. The CF of cotton from Wang et al. [20] was lower than the results in this study. The difference among the results mainly derived from different system boundaries among the studies. The majority of published papers on CF accounting of agricultural products in China only considered the GHG emissions from upstream (indirect emissions) of agricultural inputs but ignored the direct emissions from crop production on field. The calculation always resulted in the underestimation of GHG emissions from agricultural production. This study and some other published papers have demonstrated that the on-field emissions derived from nitrogen fertilizer application was the largest contribution to the GHG emissions of a cropping system [11,18,20]. Therefore, it is necessary to include the direct emissions from agricultural operation during calculating the CFs of agricultural systems.
Recently, Zhang [13] reported that maize, wheat, and rice production in China were 4.05 t, 5.46 t, and 11.88 t CO2-eq ha−1 in 2013, which were 72.74%, 84.14%, and 300.16% higher than that in this study, respectively. The primary reason leading to the significant difference of the results was derived from the use of local models on N2O emissions, N leaching/runoff, and N volatilization in the study of Zhang [13]. The models were calculated and published based on a huge number of field trials in China [60]. Therefore, this seems to imply that the GHG emissions of the cropping system in China is underestimated when calculating through the default factors provided by IPCC [26] instead of available country-specific factors. In other words, the actual situation on GHG emissions of the cropping system in China is likely much higher than the calculation results in the present study.
In addition, this study did not consider the sequestering carbon of the cropping system due to the lack of available data. Crop production actually plays an important role in carbon sequestration. Gan et al. [59] introduced soil carbon sequestration into the CF calculation of wheat production in Canada. Yang et al. [21] also considered soil carbon storage as comparing the CF of different rotation cropping systems in the North China Plain. Liu et al. [41] indicated that the wheat-maize cropping system still behaved as an important GHG sink because of the tremendous net carbon sequestration, although high irrigation water and chemical fertilizer inputs stimulated N2O emissions of the system. Therefore, the function of carbon sequestration of the cropping system should be considered when evaluating the GHG emissions of agricultural production. Otherwise, it is not fair for the GWP evaluation of a cropping system. Nevertheless, Gao et al [61] recently illustrated that Chinese cropping systems were a net source of greenhouse gases despite soil carbon sequestration. These results showed that the general conclusion “crop production pushes up greenhouse gases emissions in China” in the present paper would not be changed if soil carbon sequestration was considered.
5. Conclusions
Crop production in China is exhibiting a trend of rapid yield growth. However, the high yield of the cropping system is always maintained by more fossil fuel inputs such as mineral fertilizer, pesticides, and electricity. Thus, the discussion about the cost of energy and climate change related to crop production needs to be had. Developing low-carbon agriculture has become an important way to cope with global climate change. By analyzing the historical dynamics of the CFs of main crops in China during 2000–2016 and estimating the possible future GHG emissions, this study drew the following conclusions.
First, the GHG emissions of the Chinese cropping system generally increased from 2000 to 2016, although the lowest point was observed in 2005. The increased GHGs were mainly derived from the grain crops and other economic crops.
Second, the grain crops have been the largest contribution to the GHG emissions of the cropping system in China since 2000, followed by oil and other economic and sugar crops. Therein, the increase rates of CFs on unit area of wheat, peanut, sugar beet, cotton, tobacco, and mulberry were clearly higher than other crops in China.
Third, if the cropping pattern and agricultural practices are improved in China in the future, the GHG emissions from the Chinese cropping system are projected to increase from 2016 to 2020. However, these emissions could be expected to decrease by 12.62% by 2020 due to the implementation of advanced agricultural policies and practices.
Fourth, the CFs of crop production in China could be reduced by some effective measures. Improving utilization efficiency of fertilizers was the most important method to reduce GHG emissions from the cropping system in China. Meanwhile, other advanced agricultural practices including irrigation, machine service, weed and pest control, and diversified cropping patterns could also contribute to the development of low-carbon agriculture in China. Moreover, improving the yield of crops on unit area was an indirect way to decrease the CF of crop production.
Overall, this study illustrated that the cropping system in China is pushing up the growth of GHG emissions in China. Also, the challenge of reducing GHG emissions of crop production is more serious for China. The Chinese government should pay more attention to develop various advanced measures for solving this problem.
Author Contributions
Conceptualization, X.W.; Data Curation, Y.G. (Yueshan Guan); Formal Analysis, R.H.; Investigation, X.C. and Y.C.; Project Administration, Y.C.; Writing—Original Draft, Y.G. (Yawen Gu) and R.H.; Writing—Review & Editing, X.W.
Funding
This work was financially supported by the National Natural Science Foundation of China (31800465), Natural Science Foundation of Guangdong Province (2017A030310055) and the National Key Research and Development Program of China (2017YFD0201305).
Acknowledgments
We thank anonymous reviewers and editors for very helpful comments and suggestion of the manuscript.
Conflicts of Interest
The authors declare no conflict of interest.
References
- The Intergovernmental Panel on Climate Change (IPCC). Climate Change 2013: The Physical Science Basis. Available online: https://www.ipcc.ch/site/assets/uploads/2018/02/WG1AR5_all_final. pdf (accessed on 30 August 2019).
- The Intergovernmental Panel on Climate Change (IPCC). 2018 Global Warming of 1.5 °C. Available online: http://report.ipcc.ch/sr15/pdf/sr15_spm_final.pdf (accessed on 30 August 2019).
- Lal, R. Agricultural activities and the global carbon cycle. Nutr. Cycl. Agroecosyst. 2004, 70, 103–116. [Google Scholar] [CrossRef]
- van Groenigen, K.J.; van Kessel, C.; Hungate, B.A. Increased greenhouse-gas intensity of rice production under future atmospheric conditions. Nat. Clim. Chang. 2013, 3, 288–291. [Google Scholar] [CrossRef]
- The Intergovernmental Panel on Climate Change (IPCC). 2014AR5 Synthesis Report: Climate Change 2014. Available online: https://www.ipcc.ch/report/ar5/syr/ (accessed on 30 August 2019).
- FAO. Global Database of GHG Emissions Related to Feed Crops: Methodology. Version 1. Livestock Environmental Assessment and Performance Partnership; FAO: Rome, Italy, 2017.
- Smith, P.; Bustamante, M. Agriculture, Forestry and Other Land Use (AFOLU). In Climate Change 2014: Mitigation of Climate Change. Contribution of Working Group III to the Fifth Assessment Report of the Intergovernmental Panel on Climate Change; Cambridge University Press: Cambridge, UK; New York, NY, USA, 2014. [Google Scholar]
- Gan, Y.; Liang, C.; Hamel, C.; Cutforth, H.; Wang, H. Strategies for reducing the carbon footprint of field crops for semiarid areas. A review. Agron. Sustain. Dev. 2011, 31, 643–656. [Google Scholar] [CrossRef]
- Webb, J.; Audsley, E.; Williams, A.; Pearn, K.; Chatterton, J. Can UK livestock production be configured to maintain production while meeting targets to reduce emissions of greenhouse gases and ammonia? J. Clean. Prod. 2014, 83, 204–211. [Google Scholar] [CrossRef]
- Edenhofer, O. Climate policy: Reforming emissions trading. Nat. Clim. Chang. 2014, 4, 663–664. [Google Scholar] [CrossRef]
- Yan, M.; Cheng, K.; Luo, T.; Yan, Y.; Rees, R.M. Carbon Footprint of Grain Crop Production in China-Based on Farm Survey Data. J. Clean. Prod. 2015, 104, 130–138. [Google Scholar] [CrossRef]
- National Bureau of Statistic of China (NBSC). National Bureau of Statistics Database. Available online: http://www.stats.gov.cn/tjsj/ndsj/ (accessed on 30 August 2019).
- Zhang, D.; Shen, J.; Zhang, F.; Li, Y.E.; Zhang, W. Carbon footprint of grain production in China. Sci. Rep.-UK 2017, 7, 4126. [Google Scholar] [CrossRef] [PubMed]
- International Organization for Standardization (ISO). TS-EN ISO 14067 Greenhouse Gases—Carbon Footprint of Products—Requirements and Guidelines for Quantification and Communication; International Organization for Standardization: Geneva, Switzerland, 2013.
- Gan, Y.; Liang, C.; Wang, X.; McConkey, B. Lowering carbon footprint of durum wheat by diversifying cropping systems. Field Crop Res. 2011, 122, 199–206. [Google Scholar] [CrossRef]
- Wan, Y.L.; Zelm, R.V.; Benítez-López, A.; Kulak, M.; Huijbregts, M.A.J. Variability of greenhouse gas footprints of field tomatoes grown for processing: Inter-year and inter-country assessment. Environ. Sci. Technol. 2018, 52, 135–144. [Google Scholar]
- Arrieta, E.M.; Cuchietti, A.; Cabrol, D.; González, A.D. Greenhouse gas emissions and energy efficiencies for soybeans and maize cultivated in different agronomic zones: A case study of Argentina. Sci. Total Environ. 2018, 625, 199. [Google Scholar] [CrossRef]
- Huang, X.M.; Chen, C.Q.; Chen, M.Z.; Song, Z.W.; Zhang, W.J. Carbon footprints of major staple grain crops production in three provinces of Northeast China during 2004–2013. Chin. J. Appl. Ecol. 2016, 27, 3307–3315. [Google Scholar]
- Huang, X.; Chen, C.; Qian, H.; Chen, M.; Deng, A.; Zhang, J.; Zhang, W. Quantification for carbon footprint of agricultural inputs of grains cultivation in China since 1978. J. Clean. Prod. 2017, 142, 1629–1637. [Google Scholar] [CrossRef]
- Wang, X.; Wang, W.; Guan, Y.; Xian, Y.; Huang, Z.; Feng, H.; Chen, Y. A joint use of emergy evaluation, carbon footprint and economic analysis for sustainability assessment of grain system in China during 2000–2015. J. Integr. Agric. 2018, 17, 226–239. [Google Scholar] [CrossRef]
- Yang, X.; Gao, W.; Zhang, M.; Chen, Y.; Sui, P. Reducing agricultural carbon footprint through diversified crop rotation systems in the North China Plain. J. Clean. Prod. 2014, 76, 131–139. [Google Scholar] [CrossRef]
- Wang, Z.; Chen, J.; Zhang, L.; Chen, F.; Sun, H.; Liu, L.; Song, W.; Li, C.D.; Li, Y. Carbon Footprint Analysis of Cotton Production in Hebei Province. Cotton Sci. 2016, 28, 594–601. (In Chinese) [Google Scholar]
- Ma, B.L.; Liang, B.C.; Biswas, D.K.; Morrison, M.J.; McLaughlin, N.B. The carbon footprint of maize production as affected by nitrogen fertilizer and maize-legume rotations. Nutr. Cycl. Agroecosyst. 2012, 94, 15–31. [Google Scholar] [CrossRef]
- Chen, S.; Lu, F.; Wang, X.K. Estimation of greenhouse gases emission factors for China’s nitrogen, phosphate, and potash fertilizers. Acta Ecol. Sin. 2015, 35, 6371–6383. (In Chinese) [Google Scholar]
- Huang, J.X.; Chen, Y.Q.; Sui, P.; Gao, W.S. Estimation of net greenhouse gas balance using crop- and soil-based approaches: Two case studies. Sci. Total Environ. 2013, 456, 299–306. [Google Scholar] [CrossRef]
- The Intergovernmental Panel on Climate Change (IPCC). 2006 IPCC Guidelines for National Greenhouse Gas Inventories (5 Volumes). Available online: https://www.ipcc-nggip.iges.or.jp/public/2006gl/index.html (accessed on 30 August 2019).
- Myhre, G.; Shindell, D.; Bréon, F.M.; Collins, W.; Fuglestvedt, J.; Huang, J.; Koch, D.; Lamarque, J.F.; Lee, D.; Mendoza, B.; et al. Anthropogenic and Natural Radiative Forcing; Cambridge University Press: Cambridge, UK; New York, NY, USA, 2013. [Google Scholar]
- United Nations (UN). World Population Prospects 2017—United Nations Population Division. 2017. Available online: https://population.un.org/wpp/DataSources/ (accessed on 30 August 2019).
- Ministry of Agriculture and Rural Affairs of the People’s Republic of China (MARA). National Plan for Adjustment of Planting Sector Structure during 2016–2020. 2016. Available online: http://www.gov.cn/xinwen/2016-04/28/content_5068722.htm (accessed on 30 August 2019).
- Ministry of Agriculture and Rural Affairs of the People’s Republic of China (MARA). Action Plan for Zero Growth in Fertilizer and Pesticide Use by 2020. 2015. Available online: http://jiuban.moa.gov.cn/zwllm/tzgg/tz/201503/P02 015031850888920671 3.ceb (accessed on 30 August 2019).
- Ju, X.T. The concept and meanings of nitrogen fertilizer availability ratio–Discussing misunderstanding of traditional nitrogen use efficiency. Acta Pedol. Sin. 2014, 51, 921–933. (In Chinese) [Google Scholar]
- Department of Price in National Development and Reform Commission of China (DPNDRC). 2000–2016 Compilation of the National Agricultural Costs and Returns; China Statistics Press: Beijing, China, 2016.
- Writing Committee for Price Yearbook of China (WC-PYC). Price Yearbook of China; China Prices Press: Beijing, China, 2011. [Google Scholar]
- Quéré, C.L.; Andrew, A.; Canadell, J.G.; Sitch, S.; Korsbakken, J.I.; Peters, P.; Manning, A.; Boden, T.A.; Tans, P.P.; Houghton, R.A. Global Carbon Budget 2016. Earth Syst. Sci. Data 2016, 7, 521–610. [Google Scholar]
- Yang, L.; Jingyun, Z.; Quansheng, G.E.; Fang, W. China’s greenhouse gas emissions in low-carbon planning and contribution to global reductions. Resour. Sci. 2017, 39, 2399–2407. (In Chinese) [Google Scholar]
- Duan, H.P.; Zhang, Y.; Zhao, J.B.; Bian, X.M. Carbon Footprint Analysis of Farmland Ecosystem in China. J. Soil Water Conserv. 2011, 25, 203–208. [Google Scholar]
- Zhen, W.; Qin, Q.; Wei, Y. Spatio-temporal patterns of energy consumption-related GHG emissions in China’s crop production systems. Energ. Policy 2017, 104, 274–284. [Google Scholar] [CrossRef]
- Zhang, W.; Yu, Y.; Huang, Y.; Li, T.; Wang, P. Modeling methane emissions from irrigated rice cultivation in China from 1960 to 2050. Glob. Chang. Biol. 2011, 17, 3511–3523. [Google Scholar] [CrossRef]
- Xu, X.; Ying, L. A Comparative Study on Carbon Footprints between Plant- and Animal-based Foods in China. J. Clean. Prod. 2016, 112, 2581–2592. [Google Scholar] [CrossRef]
- Günther, J.; Thevs, N.; Gusovius, H.R.; Sigmund, I.; Brückner, T.; Beckmann, V.; Abdusalik, N. Carbon and phosphorus footprint of the cotton production in Xinjiang, China, in comparison to an alternative fibre (Apocynum) from Central Asia. J. Clean. Prod. 2017, 148, 490–497. [Google Scholar] [CrossRef]
- Liu, C.; Yao, Z.; Wang, K.; Zheng, X.; Li, B. Net ecosystem carbon and greenhouse gas budgets in fiber and cereal cropping systems. Sci. Total Environ. 2019, 647, 895–904. [Google Scholar] [CrossRef]
- Cheng, K.; Yan, M.; Nayak, D.; Pan, G.X.; Smith, P.; Zheng, J.F.; Zheng, J.W. Carbon footprint of crop production in China: An analysis of National Statistics data. J. Agric. Sci.-Camb. 2015, 153, 422–431. [Google Scholar] [CrossRef]
- Zou, X.X.; Zhang, X.J.; Wang, Y.F.; Wang, M.L. Carbon footprint of wheat-summer direct-seeding peanut planting system in Shandong Pro-vince, China. Chin. J. Appl. Ecol. 2018, 29, 850–856. (In Chinese) [Google Scholar]
- Casolani, N.; Pattara, C.; Liberatore, L. Water and Carbon footprint perspective in Italian durum wheat production. Land Use Policy 2016, 58, 394–402. [Google Scholar] [CrossRef]
- Pittelkow, C.M.; Zorrilla, G.; Terra, J.; Riccetto, S.; Macedo, I.; Bonilla, C.; Roel, A. Sustainability of rice intensification in Uruguay from 1993 to 2013. Glob. Food Secur. 2016, 9, 10–18. [Google Scholar] [CrossRef]
- Vetter, S.H.; Sapkota, T.B.; Hillier, J.; Stirling, C.M.; Macdiarmid, J.I.; Aleksandrowicz, L.; Green, R.; Joy, E.J.M.; Dangour, A.D.; Smith, P. Greenhouse gas emissions from agricultural food production to supply Indian diets: Implications for climate change mitigation. Agric. Ecosyst. Environ. 2017, 237, 234–241. [Google Scholar] [CrossRef] [PubMed]
- Singh, R.J.; Ahlawat, I.P.S. Energy budgeting and carbon footprint of transgenic cotton–wheat production system through peanut intercropping and FYM addition. Environ. Monit. Assess. 2015, 187, 282. [Google Scholar] [CrossRef] [PubMed]
- García, C.A.; García-Treviño, E.S.; Aguilar-Rivera, N.; Armendáriz, C. Carbon footprint of sugar production in Mexico. J. Clean. Prod. 2016, 112, 2632–2641. [Google Scholar] [CrossRef]
- Forleo, M.B.; Palmieri, N.; Suardi, A.; Coaloa, D.; Pari, L. The eco-efficiency of rapeseed and sunflower cultivation in Italy. Joining environmental and economic assessment. J. Clean. Prod. 2018, 172, 3138–3153. [Google Scholar] [CrossRef]
- Bai, X.; Dawson, R.J.; Urge-Vorsatz, D.; Delgado, G.C.; Barau, A.S.; Dhakal, S.; Dodman, D.; Leonardsen, L.; Masson-Delmotte, V.; Roberts, D.; et al. Six research priorities for cities and climate change. Nature 2018, 555, 19–21. [Google Scholar] [CrossRef]
- Martinez-Melendez, L.A.; Bennett, E.M. Trade in the US and Mexico helps reduce environmental costs of agriculture. Environ. Res. Lett. 2016, 11, 55004. [Google Scholar] [CrossRef]
- Zhou, Y.; Bao, M.; Chen, X.; Xu, X. Co-op advertising and emission reduction cost sharing contracts and coordination in low-carbon supply chain based on fairness concerns. J. Clean. Prod. 2016, 133, S1991410654. [Google Scholar] [CrossRef]
- China Agricultural Outlook Conference (CAOC). China Agricultural Outlook Report (2016–2025). 2016. Available online: http://www.agri-outlook.cn/aoc/2016aoc/cn/aocreport.html (accessed on 30 August 2019).
- Wang, Z.B.; Wang, M.; Yin, X.G.; Zhang, H.L.; Chu, Q.Q.; Wen, X.Y.; Chen, F. Spatiotemporal change characteristics of heat and rainfall during the growth period of winter wheat in North China Plain from 1961 to 2010. China Agric. Univ. Sci. 2015, 20, 16–23. [Google Scholar]
- Smith, P.; Martino, D.; Cai, Z.; Gwary, D.; Janzen, H.; Kumar, P.; McCarl, B.; Ogle, S.; Mara, F.O.; Rice, C.; et al. Sustainable Agriculture II Greenhouse Gas Mitigation in Agriculture. Philos. Trans. Biol. Sci. 2008, 369, 789–813. [Google Scholar] [CrossRef]
- Carrillo Cobo, M.T.; Camacho Poyato, E.; Montesinos, P.; Rodríguez Díaz, J.A. New model for sustainable management of pressurized irrigation networks. Application to Bembézar MD irrigation district (Spain). Sci. Total Environ. 2014, 473–474, 1–8. [Google Scholar] [CrossRef] [PubMed]
- Chai, Q.; Qin, A.; Gan, Y.; Yu, A. Higher yield and lower carbon emission by intercropping maize with rape, pea, and wheat in arid irrigation areas. Agron. Sustain. Dev. 2014, 34, 535–543. [Google Scholar] [CrossRef]
- Gan, Y.; Liang, C.; Chai, Q.; Lemke, R.L.; Campbell, C.A.; Zentner, R.P. Improving farming practices reduces the carbon footprint of spring wheat production. Nat. Commun. 2014, 5, 5012. [Google Scholar] [CrossRef] [PubMed]
- Samarappuli, D.; Berti, M.T. Intercropping forage sorghum with maize is a promising alternative to maize silage for biogas production. J. Clean. Prod. 2018, 194, 515–524. [Google Scholar] [CrossRef]
- Chen, X.; Cui, Z.; Fan, M.; Vitousek, P.; Zhao, M.; Ma, W.; Wang, Z.; Zhang, W.; Yan, X.; Yang, J.; et al. Producing more grain with lower environmental costs. Nature 2019, 514, 486–489. [Google Scholar] [CrossRef] [PubMed]
- Gao, B.; Huang, T.; Ju, X.; Gu, B.; Huang, W.; Xu, L.; Rees, R.M.; Powlson, D.S.; Smith, P.; Cui, S. Chinese cropping systems are a net source of greenhouse gases despite soil carbon sequestration. Glob. Chang. Biol. 2018, 24, 5590–5606. [Google Scholar] [CrossRef] [PubMed]


© 2019 by the authors. Licensee MDPI, Basel, Switzerland. This article is an open access article distributed under the terms and conditions of the Creative Commons Attribution (CC BY) license (http://creativecommons.org/licenses/by/4.0/).