Abstract
Protection of surface water quality plays a crucial role for sustainable urban watershed management since the wash-off from impervious contaminated surfaces generates transport phenomena from a range of pollutants (like nutrients, such as total nitrogen (Ntot) and total phosphorus (Ptot)). This leads to the consequent reduction of water quality, and to phenomena, such as eutrophication and the presence of algae blooms. For this reason, a comprehensive understanding of nutrient build-up and wash-off is essential for efficient stormwater treatment design. However, data scarcity could represent one of the main limitations in this context. This manuscript presents a methodological framework able to tackle such limitations by an in-depth investigation of the main factors that influence the build-up and wash-off from impervious surfaces, including rainfall, watershed, and drainage-network characteristics. The outcomes highlight the key role played by the antecedent dry period, among the rainfall characteristics, and the width of the overland flow path, among the catchment/drainage characteristics. It is also confirmed as appropriate to use suspended solids as a surrogate for the investigation of the behavior of other pollutant species. Additionally, the capability of this approach in assessing modeling performance was successfully tested. The results of the present study are expected to contribute valuable knowledge for defining effective management strategies to minimize stream pollution and protect the health of aquatic ecosystems in urban watersheds characterized by data scarcity.
1. Introduction
Stormwater runoff from urban impervious surfaces is considered one of the most critical non-point source (NPS) pollution since it contains contaminants that deteriorate water quality and represent a detriment to the surrounding ecological environment [1,2,3]. In particular, NPS nutrients are currently the main cause of lake, stream, and coastal area eutrophication all over the world [4]. Eutrophication of surface waters could cause increases in both phytoplankton biomass (generating the declines in water clarity), and in incidences of nuisance and toxic algal blooms (with taste and odor problems) with consequent implications in treatment costs for drinking water facilities [5]. Therefore, the protection of surface water quality plays a crucial role for sustainable urban watershed management.
NPS nutrients are difficult to quantify due to their diffuse nature and the fact that many small sources might contribute to the generation of NPS pollutants. Another aspect to take into account is related to the adsorption of loose soil or sediment particles, which is the primary form by which nutrient offsite movement takes place in soil-water or sediment-water continuums. Therefore, the uncertainty in the evaluation of cleaning processes for urban impervious surfaces, in terms of particle quantity and granulometry, makes the quantification of nutrients in the urban environment even more challenging.
The first step in controlling the impact of NPS nutrients on water quality is the development of a thorough understanding of their sources. Therefore, it is important to create an in-depth knowledge of nutrient build-up and wash-off from impervious surfaces and their affecting factors. In recent years, there have been considerable research efforts to investigate the relationships between rainfall, catchment characteristics, and stormwater quality. Liu et al. [6], using a total of 41 rainfall events in three different monitoring sites, found that the influence of rainfall characteristics on pollutant (total nitrogen (Ntot), total phosphorus (Ptot), total suspended solids (TSS), and total organic carbon (TOC)) wash-off is step-wise, based on specific thresholds. Additionally, pollutant build-up and wash-off processes were found to be significantly influenced by a range of catchment characteristics like land use, impervious area fraction, and urban characteristics [6]. Yuan et al. [7], exploiting a data set of 30 rainfall events, found that the effects of rainfall conditions on pollutant concentration (Ntot, Ptot, TSS, chemical oxygen demand (COD), ammonium nitrogen (NH4–N), nitrate-nitrogen (NO3–N), phosphate (PO4–P), and heavy metals) depend on the nature of the pollutant itself. In particular, the antecedent dry period tended to affect the particle wash-off from impervious areas due to the predominance of particles with size <30 μm. Liu et al. [8] found that pollutant inputs (total inorganic carbon (TIC), nitrate (NO3−), phosphate (PO43−), iron (Fe), and TOC) into estuarian and freshwater areas were found to be notably affected by seasonal factors, with the dominant pollutant sources differing between wet and dry seasons. This study was supported by extensive field sampling (96 surface water samples at eight monitoring locations).
To the authors’ knowledge, a significant research effort was spent on catchments characterized by a comprehensive record of rainfall, flow rate, and water-quality data. However, less attention has been given to the investigation of these correlations in watersheds where data availability may present a limitation. In general, the lack of a sufficient amount of hydrological data like precipitation, discharge, and water quality may induce inadequate representation of the complexity of responses to any type of precipitation input in urban systems. Furthermore, the lack of available data makes it difficult to assess pollutant build-up/wash-off and their impact parameters. In such a case, the system behavior is usually investigated through simulations of numerical models; nevertheless, these models are usually deterministic and based on the adoption of design rainfall events rather than real observations. This could lead to inefficiencies in the treatment of stormwater quality due to inadequate design. In any case, before undertaking expensive studies to gather and analyze additional data, it is reasonable first to understand what enhancement, in estimates of system performance, would result in an increased amount of available data.
On the basis of these considerations, the main objective of this work is to develop a methodological framework able to assess how rainfall, catchment, and drainage characteristics affect urban nutrient runoff in poorly gauged watersheds. The second objective of this study is to evaluate the diagnostic capacity of the proposed approach in assessing hydrologic/hydraulic and water-quality modeling performance.
Two real-world case studies with their practical specifications and challenges are reported in this work while testing the proposed methodology based on principal component analysis (PCA) and hierarchical cluster analysis (HCA) to cope with data scarcity.
The remainder of this paper is organized as follows. In Section 2, an overall description of the study approach, along with a thorough description of each phase, is presented. In Section 3, the parameter selection and the results of the influence of the rainfall and basin/drainage characteristics on stormwater quality are reported. The main conclusions are presented in Section 4.
2. Materials and Methods
2.1. Study Approach
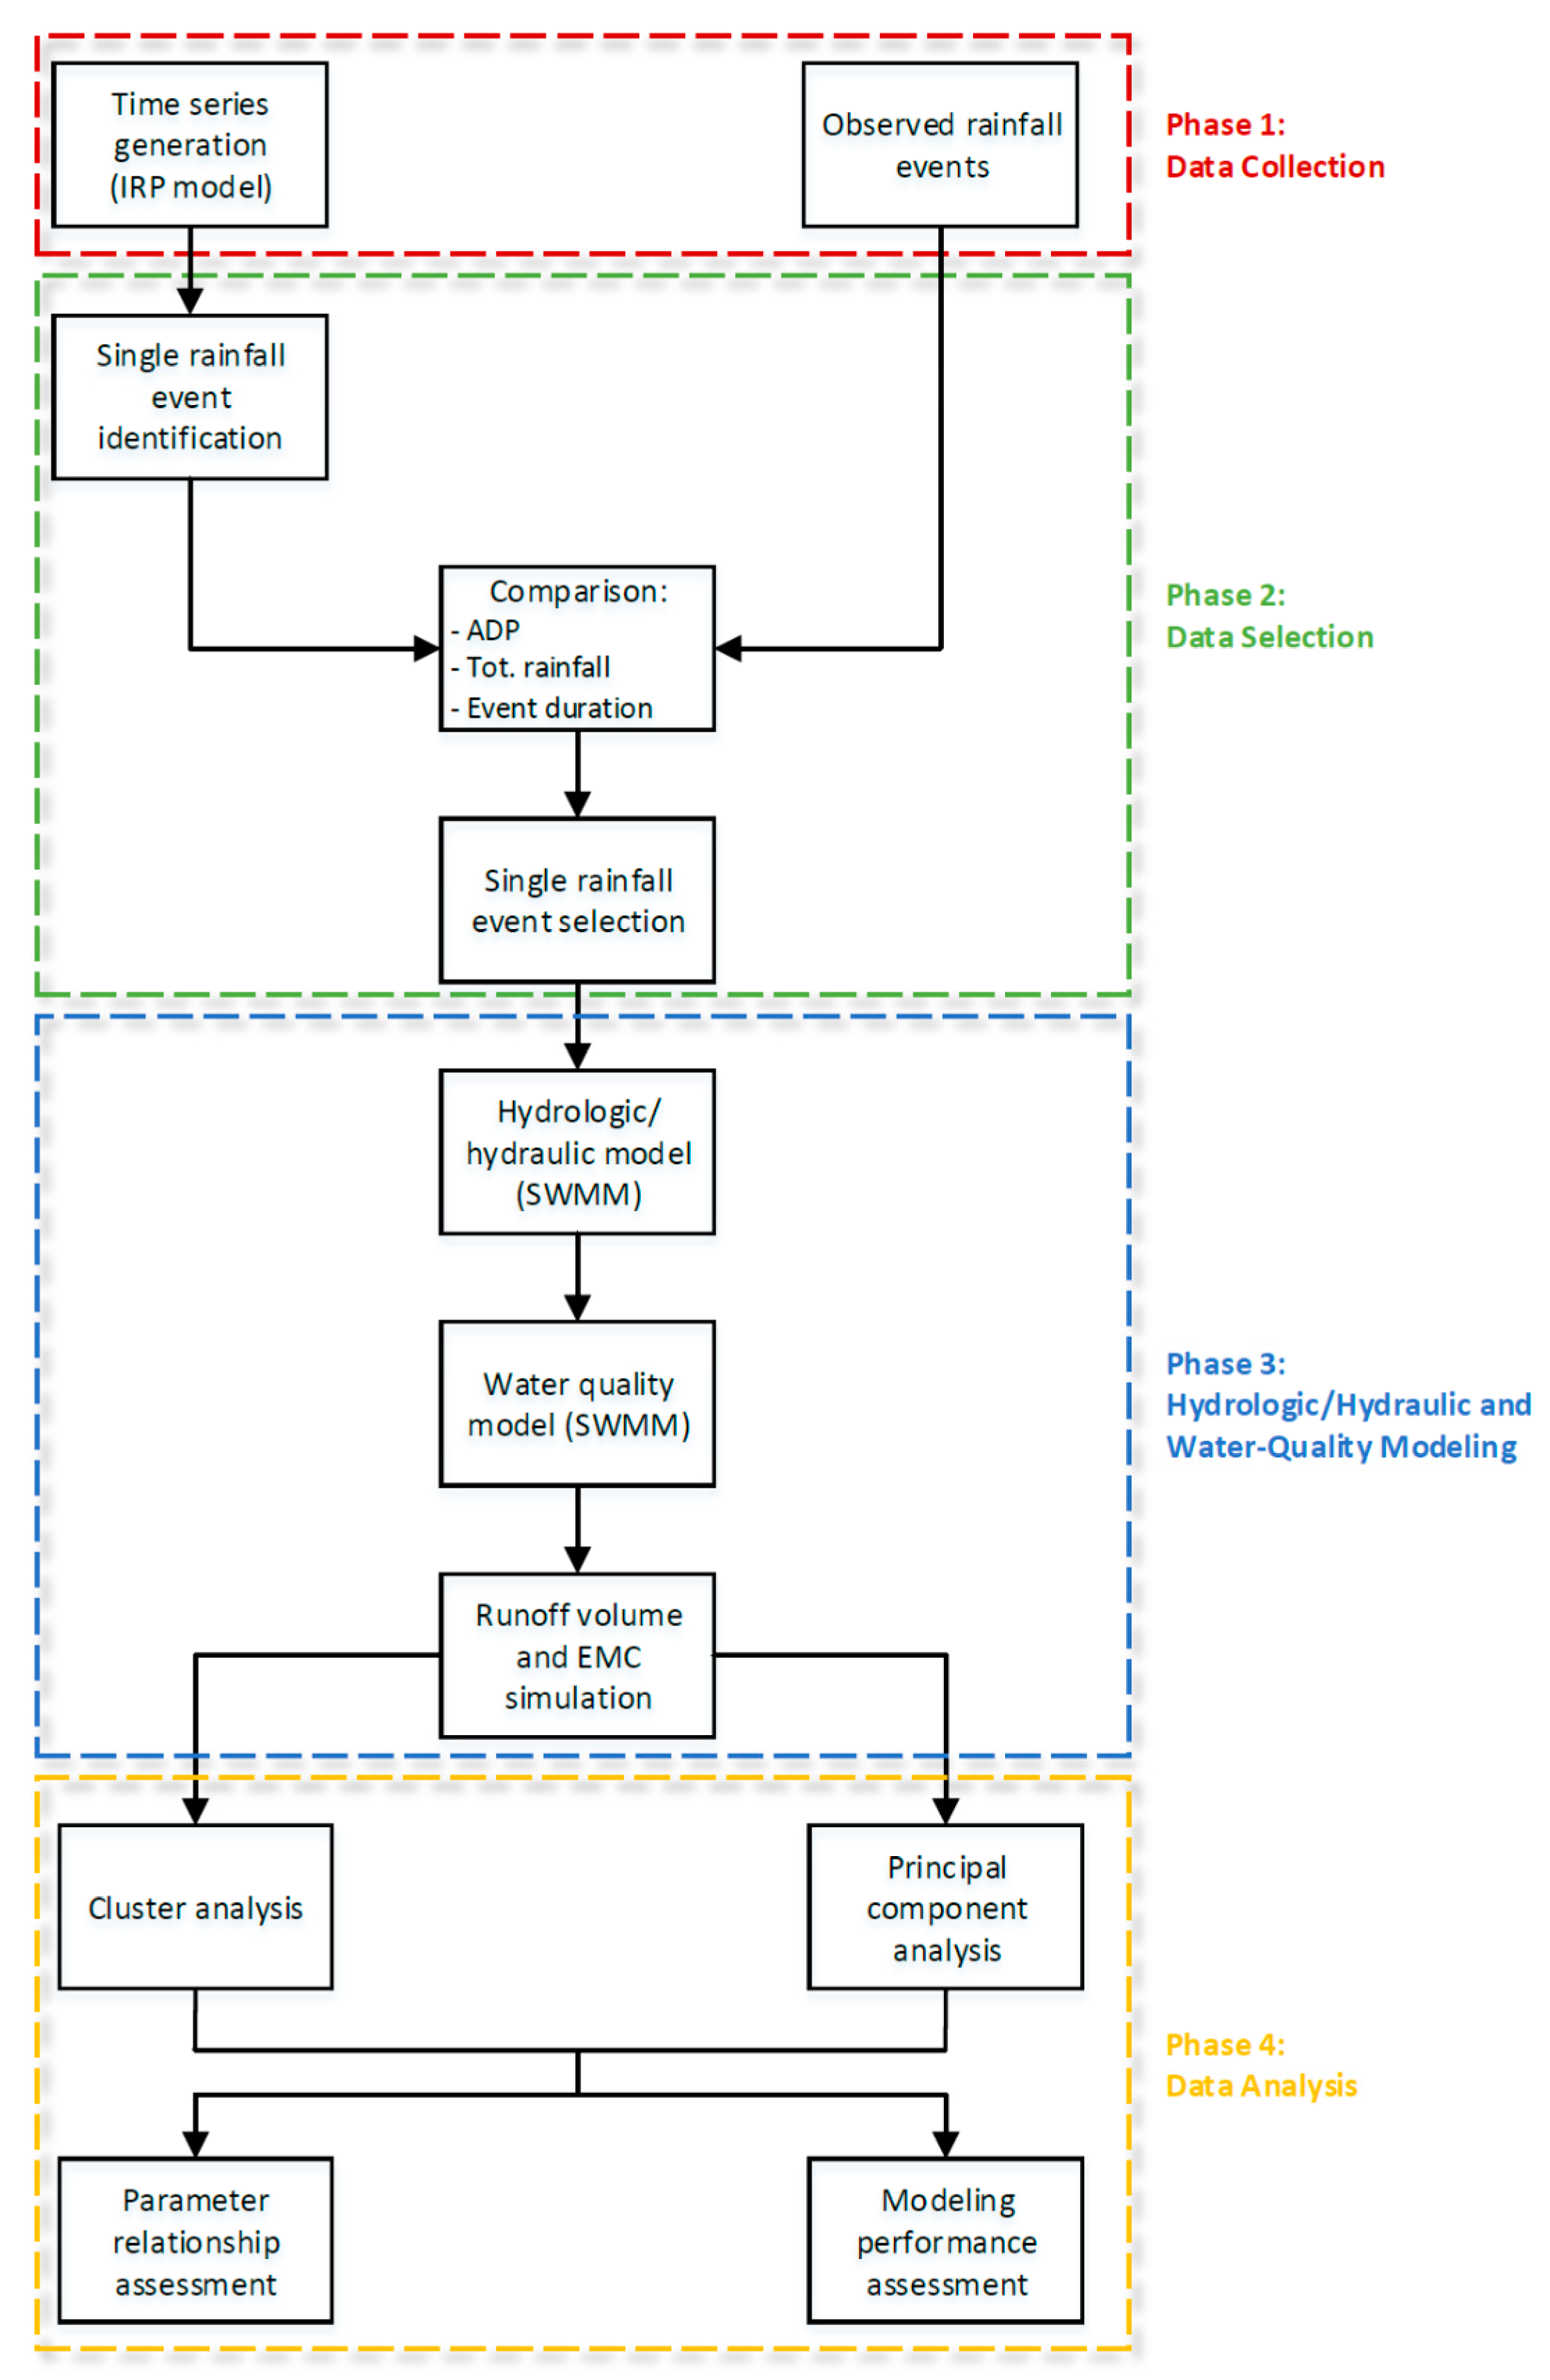
The proposed methodology is presented in Figure 1. It consists of four main phases. In Phase 1, Data collection, observed rainfall events were analyzed over the study areas and rainfall time series of 15 minutes of aggregation over ten years were generated using the iterated random pulse (IRP) rainfall generator proposed by Veneziano and Iacobellis [9]. In Phase 2, Data selection, a comparison between the generated and observed rainfall events was performed to select, among those generated, the most similar ones to those observed. For this purpose, the parameters in the antecedent dry period (ADP), total rainfall (TR), and event duration (ED) were taken into account. In Phase 3, Hydrologic/hydraulic and water-quality modeling, the hydrologic/hydraulic and water-quality models were implemented to analyze and reproduce the water quality and flow rate of the selected events. In order to carry out the second objective of this study, two models implemented in two different watersheds (Sannicandro di Bari and Ruvo di Puglia) were considered. The hydrologic/hydraulic and water-quality models implemented in Sannicandro di Bari were successfully calibrated and validated, while at Ruvo di Puglia, only the hydrologic/hydraulic model was calibrated. In Phase 4, Data analysis, the simulation outcomes were analyzed using two multivariate data analysis techniques: principal component analysis (PCA) and hierarchical cluster analysis (HCA). The results were properly examined and discussed to accomplish the two main aims of this study.
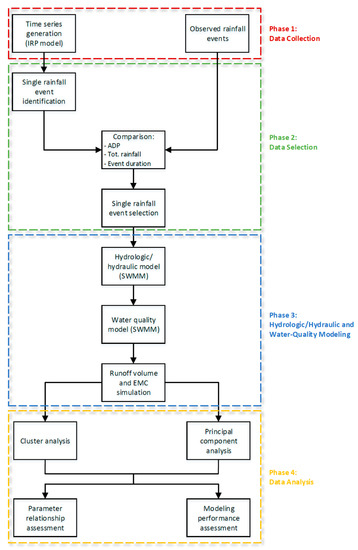
Figure 1.
Conceptualization of the proposed approach.
2.2. Study Area
The study area includes two watersheds belonging to Sannicandro di Bari and Ruvo di Puglia municipalities, located in the Puglia region (Southern Italy).
The drainage area of the watershed located in Sannicandro di Bari (hereafter called SB) is equal to 31.24 ha and, covering approximately 60% of the total urban area, and is characterized by 21.87 ha (70%) of impervious surface. The land-use map, extracted from the regional geographical information system (SIT Puglia), shows that the entire drainage area is exclusively residential and only 3.80% of the basin (1.20 ha) is covered by urban-green. The drainage basin has an average slope of 1.56% and the drainage network, used only for stormwater, has a total length of 1.96 km and collects water into a concrete rectangular (1.20 m wide and 1.70 m high) channel [10]. The rainfall measurement is carried out by using a rain gauge installed close to the outlet of the drainage network. The water-quality data are observed by collecting samples through an autosampler with 24 bottles of 0.5 L each.
The Ruvo di Puglia watershed (hereafter called RP) is located in the suburban area of the same town. The drainage area, with a surface equal to 51.56 ha, is characterized by 41.25 ha (80%) of impervious surface and average slope of 2.20%. Similar to SB, RP is characterized exclusively by residential land use. The drainage network used only for stormwater has a total length of 5.86 km and ends with a circular pipe with 1.30 m in diameter. A rain gauge, a current meter sensor and an autosampler are installed close to the outlet of the drainage network to get rainfall, discharge, and water-quality data.
In Figure 2, the area of the two watersheds, the drainage network, and the respective outfalls are shown.
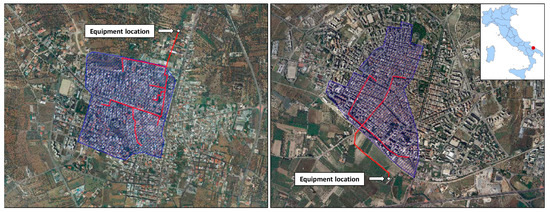
Figure 2.
Area of the watersheds (blue), drainage networks (red lines), and location of their outfalls (SB on the left and RP on the right) (Adapted from Google Earth https://earth.google.com/web/).
It is worth remarking that these two watersheds were selected for the following reasons: i) they are situated in urban areas; ii) they are located in a semi-arid environment where precipitation events mostly occur in the winter season; iii) a monitoring campaign (that provided water quality and quantity data) was carried out in a previous study [10].
2.3. Data Collection
Two different sets of data were used in this study: (i) observed rainfall, flow rate, and water-quality data derived from monitoring campaigns, used for model calibration and validation; (ii) generated rainfall time series obtained through numerical simulation, used as input data in the hydrologic/hydraulic and water-quality models for producing flow rate and water-quality data.
Regarding the observed data, the monitoring campaigns provided rainfall, flow rate, total suspended solids (TSS) and nutrients (Ntot and Ptot) for five rainfall events occurred on SB (11/10/2006, 11/22/2006, 12/17/2006, 01/24/2007 and 02/10/2007) and two rainfall events occurred on RP (09/18/2006 and 09/23/2006). Table 1 and Table 2 summarize, respectively, hydrologic data (including rainfall event duration [h], length of antecedent dry weather [day], total runoff volume [m3], runoff peak flow rate [m3/s], and total depth measured at the outfall [m]) and water-quality data (including maximum, minimum and mean concentration [mg/L]) related to all the observed events.

Table 1.
Summary of the rainfall-runoff data for the monitored events at SB and RP.
Table 2.
Summary of the water-quality data for the monitored events at SB and RP.
Synthetic rainfall time series were generated through the IRP rainfall model (proposed by Veneziano and Iacobellis [9] and Veneziano et al. [11]) providing a time series of 15 minutes of aggregation and length of 10 years. The IRP rainfall generation uses the classical representation of the exterior process of the rainfall, as an alternating sequence of dry and wet periods with independent durations, which characterizes the arrival, duration, and average intensity of rainfall events at the synoptic scale. The wet and dry periods are respectively assumed exponentially and Weibull distributed. The average rainfall intensities in different wet periods are independent and identically distributed as an exponential distribution. In particular, the wet periods of the exterior model are scattered through the “interior” scheme, in which the rainfall is represented as the superposition of pulses with a hierarchically nested structure of temporal occurrences, with multifractal properties of location and intensity.
The model consists of six parameters in total. The exterior process is characterized by four parameters: the mean duration of the wet (mτwet) [h] and dry periods (mτdry) [h], the exponent k of the Weibull distribution of the dry intervals, and the mean value (mI) of the average of the rainfall intensity during the synoptic events [mm/h]. For the definition of the interior process, two other parameters related to its multifractality are introduced: the parameter C1 that controls the multifractal properties of rainfall at small scales and the multiplicity r that controls the quasi-fractal behavior of the rainfall support at small scales. To calculate mI, Veneziano and Iacobellis [9] proposed the following relationship:
where R is the annual mean hourly rainfall intensity over the entire investigation period [mm/h]:
where htot is the total annual precipitation mean value for each rain gauge station [mm].
The model was applied to SB and RP watersheds, whose generated rainfall time series are reported in the Supplementary Material (SM-1). For the sake of simplicity, the generated rainfall series are reported in chronologic sequence, considering the first data associated with the 01/01/2014. In Table 3, the model parameters (extracted from [12]) for the two catchments are reported.
Table 3.
Parameters of the IRP model for SB and RP municipalities.
2.4. Data Selection
In this section, a comparison between generated and observed rainfall events was performed to select the generated events more similar to the observed ones. In particular, the following steps were considered for data selection:
- 1)
- In the generated time series of 15 minutes of aggregation and a length of 10 years, single rainfall events were identified. Taking into account the regional regulation [13], a criterion of 48 hours of dry weather was used to define single rainfall events. Accordingly, 408 rainfall events for SB and 117 for RP were identified.
- 2)
- For each identified rainfall event, antecedent dry period, total rainfall, and event duration were calculated.
- 3)
- The generated rainfall events were compared with the observed ones to choose those with the most similar characteristics. The comparison was carried out considering, for the seven observed events (for SB and RP), the following range of the difference between observed and generated values of the three investigated rainfall parameters, assuming that the variation of each parameter within this range will not affect the modeling outcomes:
- Antecedent Dry Period (ADP) = ±1 day;
- Total Rainfall (TR) = ±1 mm;
- Event Duration (ED) = ±15 min.
- 4)
- An index of similarity between observed and generated rainfall events was defined. It ranges from 1 to 3 since there are three rainfall parameters used for the comparison (ADP, TR, and ED). For instance, if only the ADP value of a generated rainfall event falls within the corresponding range, the index of similarity is equal to 1. If all three parameters fall within the corresponding ranges, the index of similarity is equal to 3. Following this approach, we have selected the events characterized by the highest index of similarity for both study areas. In particular, twelve generated rainfall events for SB and eight for RP were identified (see Table 4 and Table 5, respectively).
Table 4. Selected generated rainfall events for SB basin.
Table 5. Selected generated rainfall events for RP basin.
2.5. Hydrologic/Hydraulic and Water-Quality Model Implementation
The Storm Water Management Model (SWMM) simulates the hydrograph and the pollutograph for a real storm event (for a single and long-term event) based on the rainfall and other meteorological inputs, and system characteristics (catchment, conveyance, and storage/treatment) for urban and rural areas [14]. SWMM has been designed in operating units or blocks. The runoff block, as well as the transport block, were adopted for this study. To simulate the runoff from urban surfaces, the kinematic-wave equation was chosen. In addition, the water losses taken into account are due to the depression storage on the impervious area of the basin and to the infiltration process on the remaining portion of the catchment. The latter is based on Horton’s equation, whose parameter values have been chosen according to the representative values reported in the literature, in relation to soil type [15].
Water-quality processes include the generation of surface runoff constituent loads through the build-up of pollutants during dry weather, wash-off during wet weather, and first-order decay with the simulation of resuspension and deposition within the sewer system. An in-depth explanation of the mathematical representation of these physical processes is reported in the recent scientific literature [3,10,16]. In particular, Di Modugno et al. [10] showed good performances in predicting the quantity response of SB by using a hydrologic/hydraulic model with different sets of input parameters; moreover, the simulation of sediment build-up and wash-off was successfully tackled.
With the aim of accomplishing the second objective of this study, i.e., evaluating the diagnostic capacity of the proposed framework in assessing model performance, the water-quality model implemented in RP was not calibrated.
For both water-quality models, nutrients were simulated, considering the power build-up and exponential wash-off functions for high-density residential land use [17].
2.6. Data Analysis
Two multivariate data analysis techniques, the PCA and HCA, were applied to identify linkages between pollutant parameters and correlations with rainfall, catchment, and drainage system characteristics. They were coded and run in R [18], by using the libraries “devtools” and “ggbiplot.”
PCA is a technique that reduces a set of parameters into a number of principal components (PCs), which explain the most variance within the original data with the aim of identifying possible patterns between variables and data points. In particular, in its graphical visualization (PCA biplot), correlated parameters are represented by vectors that form an acute angle, while those that are uncorrelated are represented by perpendicular vectors. This technique has been extensively used for several applications related to water quality [19,20,21]. A detailed description of PCA and its applications can be found in the literature [22,23]. PCA was chosen for this study because it provides a holistic vision of all the variables involved in the system. Particularly, this analysis offers a meta-description of all the variables, which has the advantage of gathering possible emerging properties of the system. These could be hidden, instead, if we focus only on the physical meaning of each original variable (macro-description).
HCA is typically used for clustering complex data sets and, in this study, it is considered as a complementary technique to PCA. Both PCA and HCA are unsupervised methods, meaning that no information about cluster belonging, or other response variables, are used to obtain the graphical representation. This makes these methods suitable for exploratory data analysis, where the aim is hypothesis generation rather than hypothesis verification [24]. The goal of the clustering algorithm is then to partition the data points into homogeneous groups, such that the within-group similarities are large compared to the between-group similarities. These groups can reveal patterns related to the phenomenon under study. A distance function is used to evaluate the similarity between data points. The similarity is calculated first between the observations and, once the observations begin to be grouped into clusters, between the groups as well. To calculate the similarity, several metrics could be used, and the choice of the similarity measure could have a large effect on the result. This analysis also requires a priori choice of the number of clusters (k) that is arbitrary.
3. Results and Discussion
3.1. Rainfall, Catchment, Drainage, and Water-Quality Characteristic Selection
A pre-analysis was conducted to identify proper rainfall characteristics and eliminate correlated parameters to avoid overshadowing of critical relationships between rainfall and water-quality characteristics. Considering the seven monitored rainfall events, six rainfall characteristics (ADP, total rainfall, event duration, maximum rainfall intensity, runoff volume, runoff peak) were investigated using a correlation matrix (Table 6).
Table 6.
Correlation matrix of rainfall characteristics of monitored events.
From Table 6, it can be noted that runoff volume and runoff peak are strongly correlated (0.97), as well as total rainfall and event duration (0.92). The maximum rainfall intensity is correlated to the total rainfall (0.62) and ADP to runoff volume (−0.66) and runoff peak (−0.61). On the basis of these results, event duration, maximum rainfall intensity, and runoff peak were discarded from the next analysis. However, we decided to consider ADP in order to have both dry and wet periods captured by the chosen variables. In particular, ADP symbolizes the dry period, while total rainfall and runoff volume, which represent the input and the output of the hydrologic/hydraulic component, respectively, characterize the wet period.
Concentration is a useful parameter to assess water quality because it has biological significance with reference to the involved organisms. A high concentration of nitrogen and phosphorus in surface water spurs the growth of phytoplankton, which lowers dissolved oxygen levels, generating damage to fish and other aquatic organisms. However, the concentration of nutrients or sediments in the discharge may vary significantly during a day, week, or month, depending on the constituent of interest, the cleaning of the impervious surfaces, the amount of sediment/nutrient available to runoff extraction, and so on. Evaluating the load of nutrients or sediments discharged during a defined rainfall event may be a more accurate procedure for assessing water quality. However, measuring load can be problematic because the runoff volume must be accurately estimated. On the basis of these considerations, the event mean concentration (EMC) and event mean load (EML) of the monitored pollutants (TSS, Ntot, and Ptot) were considered. In particular, we used the following definition of EMC:
while EML was calculated by multiplying EMC and the runoff volume:
where V is the total runoff volume per event [L], Vi is the runoff volume proportional to the flow rate at time i [L], Ci is the average pollutant concentration at time step i [mg L−1], and n is the total number of samples collected during a single storm event.
In our previous work [12,25], the calibration parameters of the runoff block of the SWMM were categorized in two groups: i) traditional parameters, easily extractable from the literature; ii) non-Traditional parameters, whose values have a greater uncertainty since they are obtained from measures and interpretation of topographic maps, aerial, and satellite images, and land use maps. The parameters that are part of this second group are the watershed area (Area), the width of the overland flow path (Width), the slope (% Slope), the fraction of the imperviousness (% Imperv), and the roughness coefficient for the channel (Roughness). For the purpose of this study, the non-traditional parameters, considered to represent the catchment and drainage network characteristics, were used to evaluate their effect on urban water quality in poor-gauged watersheds.
In Table 7, all the rainfall, water quality, catchment, and drainage characteristics selected for this study are summarized.
Table 7.
Rainfall, water quality, catchment, and drainage parameters selected.
3.2. Influence of Rainfall Characteristics on Water Quality
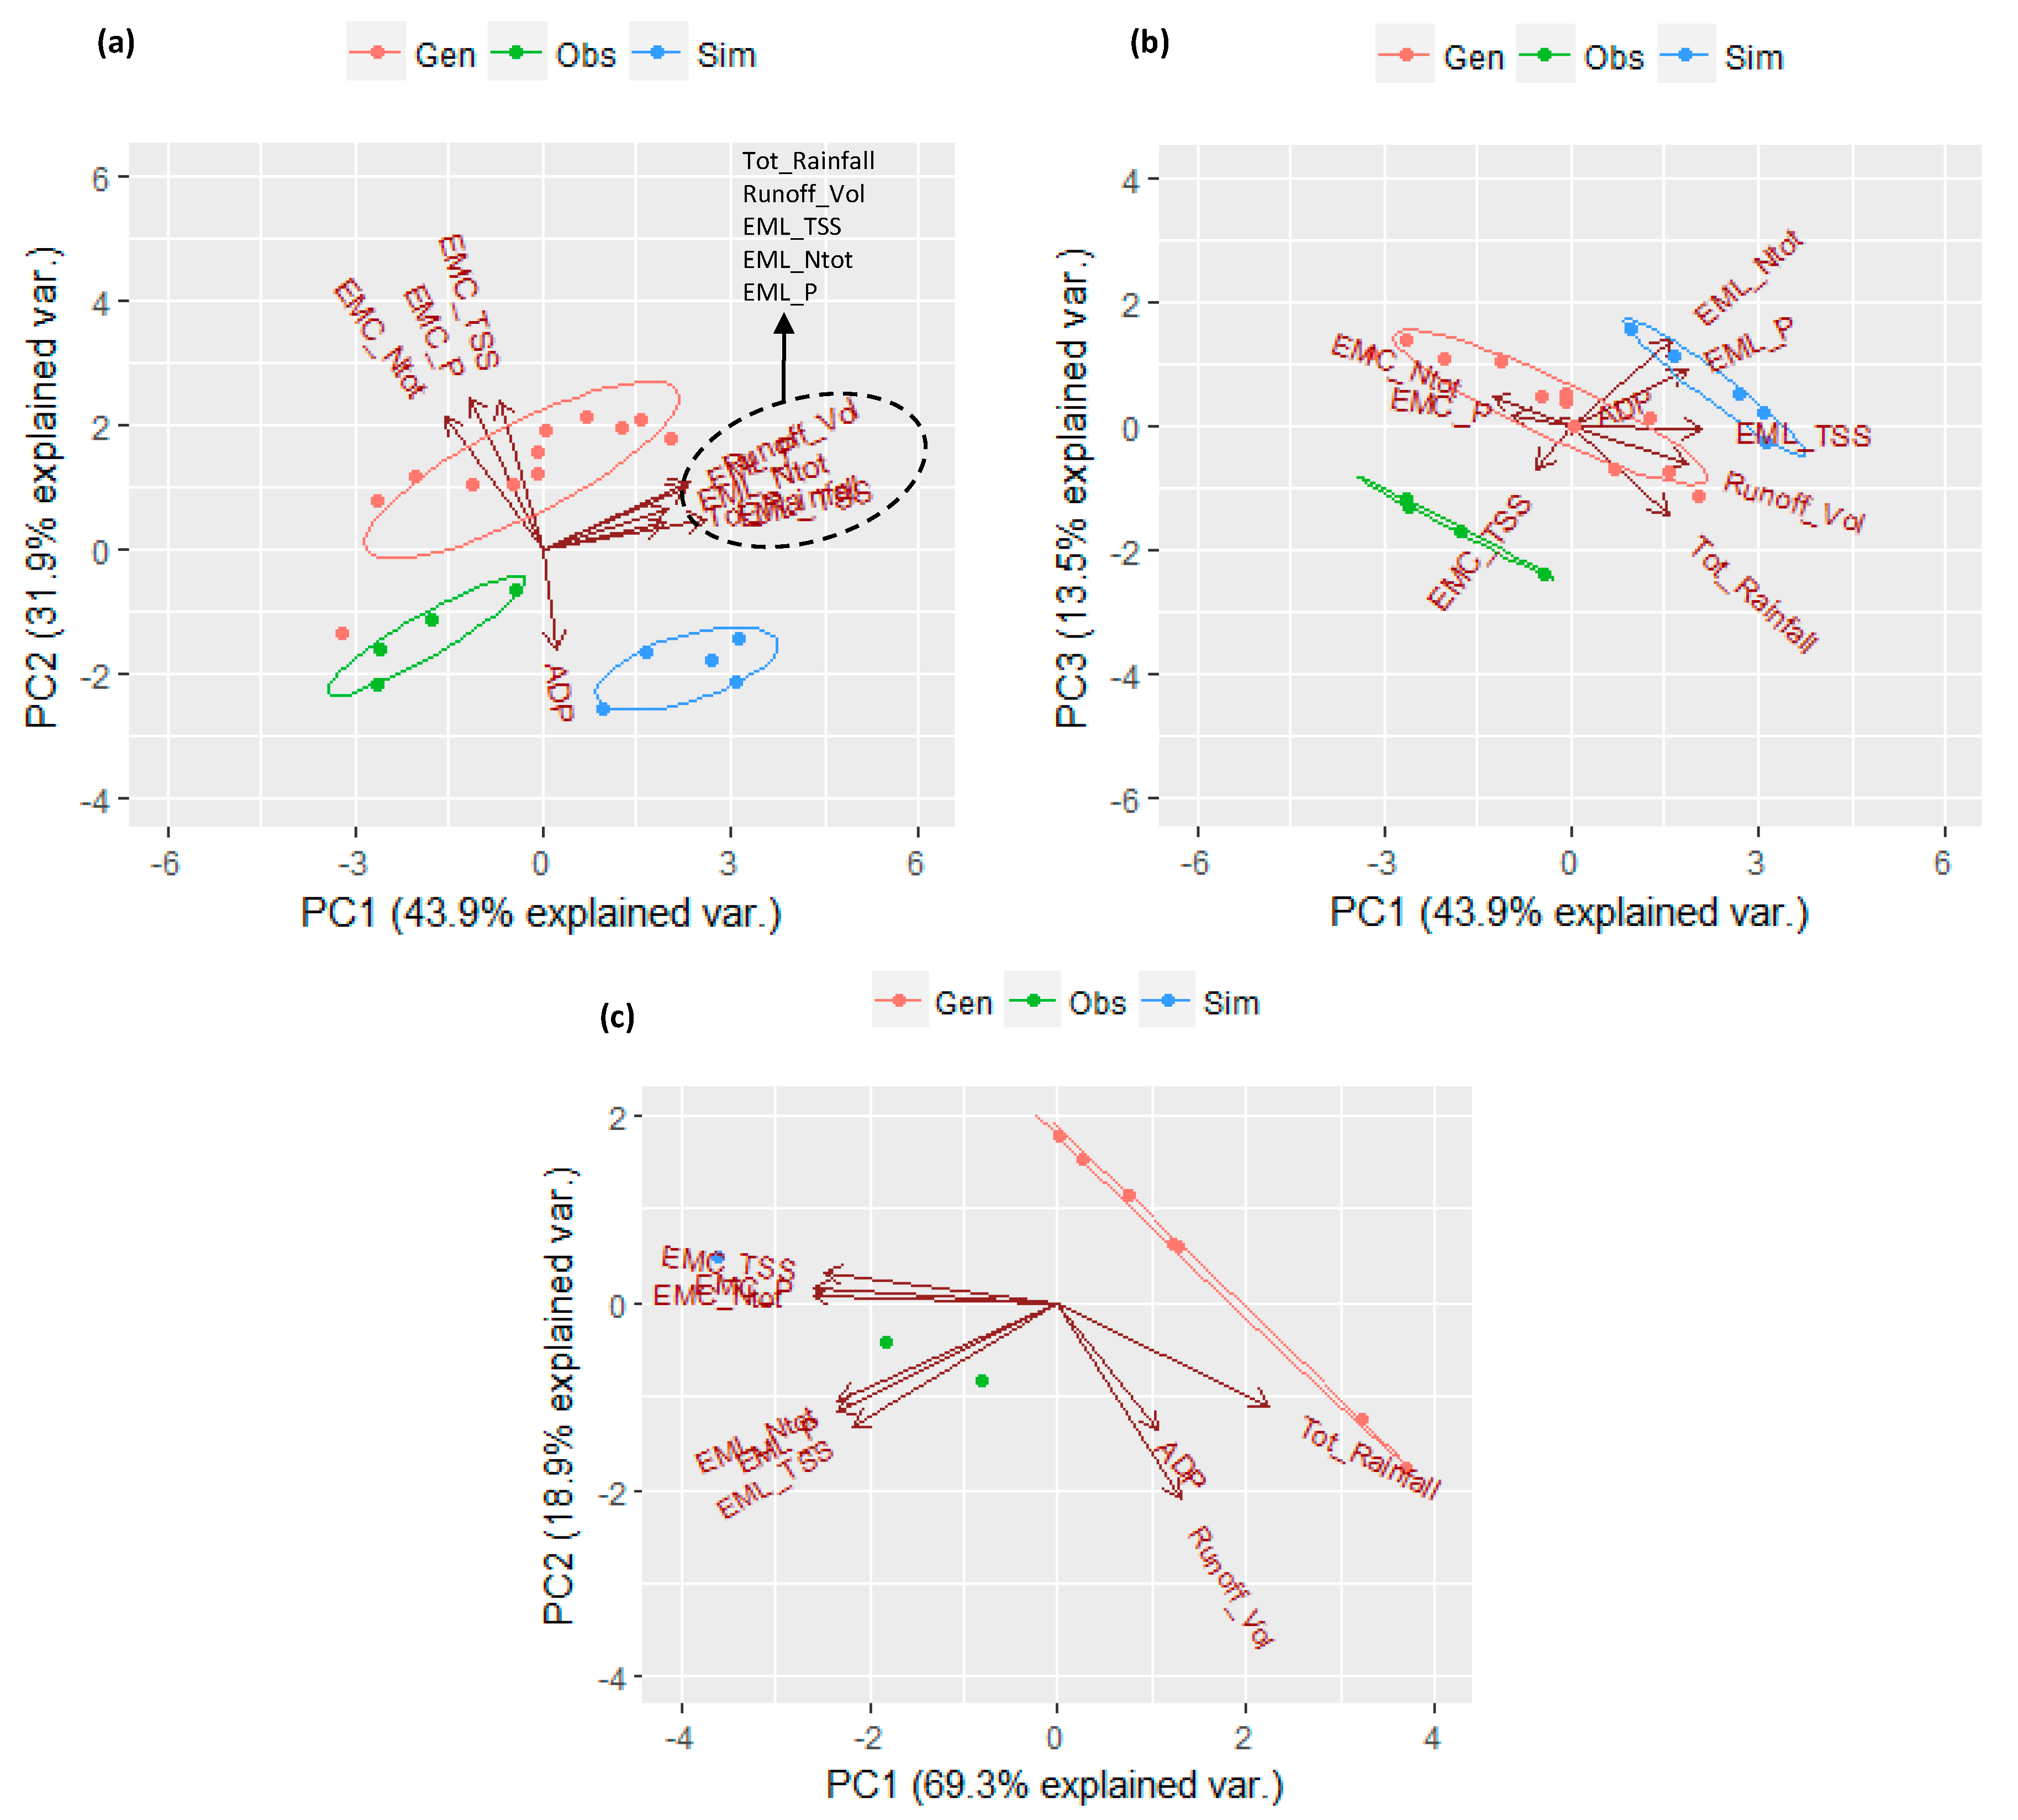
This analysis was conducted for each study area. For this purpose, ten variables were considered: among these, six are related to pollutant EMC values (TSS, Ntot, Ptot) and pollutant EML values (TSS, Ntot, Ptot); three other variables are represented by rainfall characteristics (ADP, total rainfall, runoff volume); and the last one is useful for identifying the type of event as observed (obs), generated (gen), or simulated (sim). For the sake of clarity, from here on we will call “generations” or “generated events” those events whose rainfall was generated with the IRP and whose flow rate and pollutant concentrations were simulated with SWMM; whereas “simulations” or “simulated events” are those events whose rainfall was measured and flow rate and pollutant concentrations were simulated with SWMM. Considering that SB is characterized by five monitored events, 12 generations, and five simulations, and RP is characterized by two monitored events, seven generations, and two simulations, a matrix (10 × 22) for SB and a matrix (10 × 11) for RP were submitted to PCA. The first three principal components (PCs) were selected for SB since they represent 89.3% of the variance. While for RP, the first two PCs were considered since they represent 88.2% of the variance. In Figure 3, the resulting PCA biplots are shown for SB (Figure 3a,b) and RP (Figure 3c).
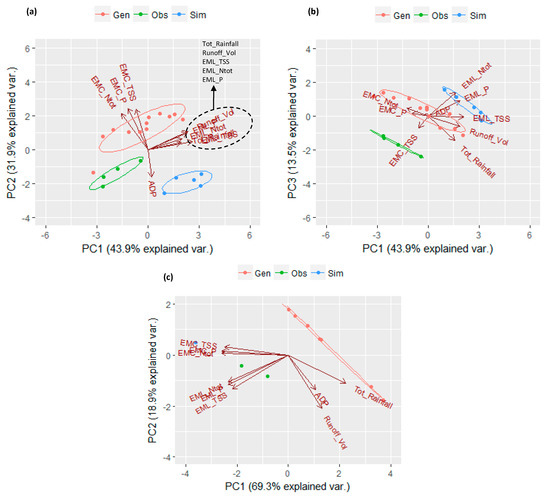
Figure 3.
PCA biplot for identifying relationships between rainfall and water-quality characteristics: (a) PC1 vs. PC2 at SB, (b) PC1 vs. PC3 at SB, and (c) PC1 vs. PC2 at RP.
The scores plot summarizes the behavior of the data points in the two components and their similarities. In Figure 3, the scores plots show three clusters for both SB and RP: one for the observed data points, one for the simulations, and the other one for the generated data points. It is worth mentioning that, considering the first two PCs for both sites, the observed data points are located between the generated and simulated ones. This outcome reassures about the quality of IRP and SWMM model performance. However, only for SB, the three clusters have the same trend. This is justified from the fact that the hydrologic and water-quality models built for this study area were calibrated and validated [10], while for RP, only the hydrologic model was calibrated. Furthermore, we remind that all the generated events for SB are characterized by an index of similarity equal to 2, while this index is equal to 1 for all the generations of RP. These results substantiate the diagnostic capacity of this technique that allows evaluating the model performance in a qualitative way.
The loadings plot analyzed the role of all the variables in the two PCs chosen, their correlations and their importance in the system. Considering the rainfall-related variables, the three loadings plots presented in Figure 3 show reasonable results. This strong three-vectors relationship is driven by the ADP vector. The longer the ADP, the higher the water loss in the system, the bigger the distance between total-rainfall and runoff-volume vectors. Among the water quality-related variables, two groups of vectors could be identified: pollutant EMC and pollutant EML. One of the most significant results obtained from this analysis is the robust correlation between the EML_TSS and nutrient EMLs, and between the EMC_TSS and nutrient EMCs. This relationship suggests that sediment transport plays an important role in the mobilization of nutrients from urban impervious surfaces. Therefore, this confirms that TSS could be considered as a synthetic index of the general level of pollution in urban areas. Furthermore, if we look at the projections of total rainfall, runoff volume, and EMLs vectors on PC1 for SB and on PC2 for RP, we can see that the longer the total-rainfall vector, the longer the runoff-volume vector, the bigger are the EMLs vectors. This correlation suggests that the more it rains, the bigger is the volume of water that washes off the impervious surface, and the bigger is the amount of pollutant load washed off. Considering the projections of EMCs and runoff volume on PC1 for both SB and RP, it is clear that the bigger the volume of runoff, the smaller the pollutant concentrations due to the dilution effect. The ADP behaves in a particular way; at RP, it is clear that the longer the dry period, the higher is the number of pollutants (EMLs) accumulated on impervious surfaces (projections on PC2). At SB, this relationship is less clear. It is worth mentioning that for SB, the ADP values are higher (up to one order of magnitude) than the ones measured/generated for RP; therefore, it is more probable that in a long dry period, degradation processes (not considered in this study) play a critical role in the urban pollutant build-up.
3.3. Influence of Catchment and Drainage Characteristics on Water Quality
With the aim of assessing the influence of catchment and drainage characteristics on water quality, we ran a unique PCA for the two study areas since the four parameters selected vary only from one site to the other. The variables considered were pollutant EMC values (TSS, Ntot, Ptot), pollutant EML values (TSS, Ntot, Ptot), rainfall characteristics (ADP, total rainfall, runoff volume), and catchment/drainage characteristics (% of impervious area, % of slope, basin area, width, conduit roughness). For this analysis, we decided to keep the rainfall characteristics to evaluate a possible combined impact on water quality from precipitation-related and catchment-related parameters. Also, in this case, the fifteenth variable considered was introduced for selecting the type of event as observed (obs), generated (gen), or simulated (sim).
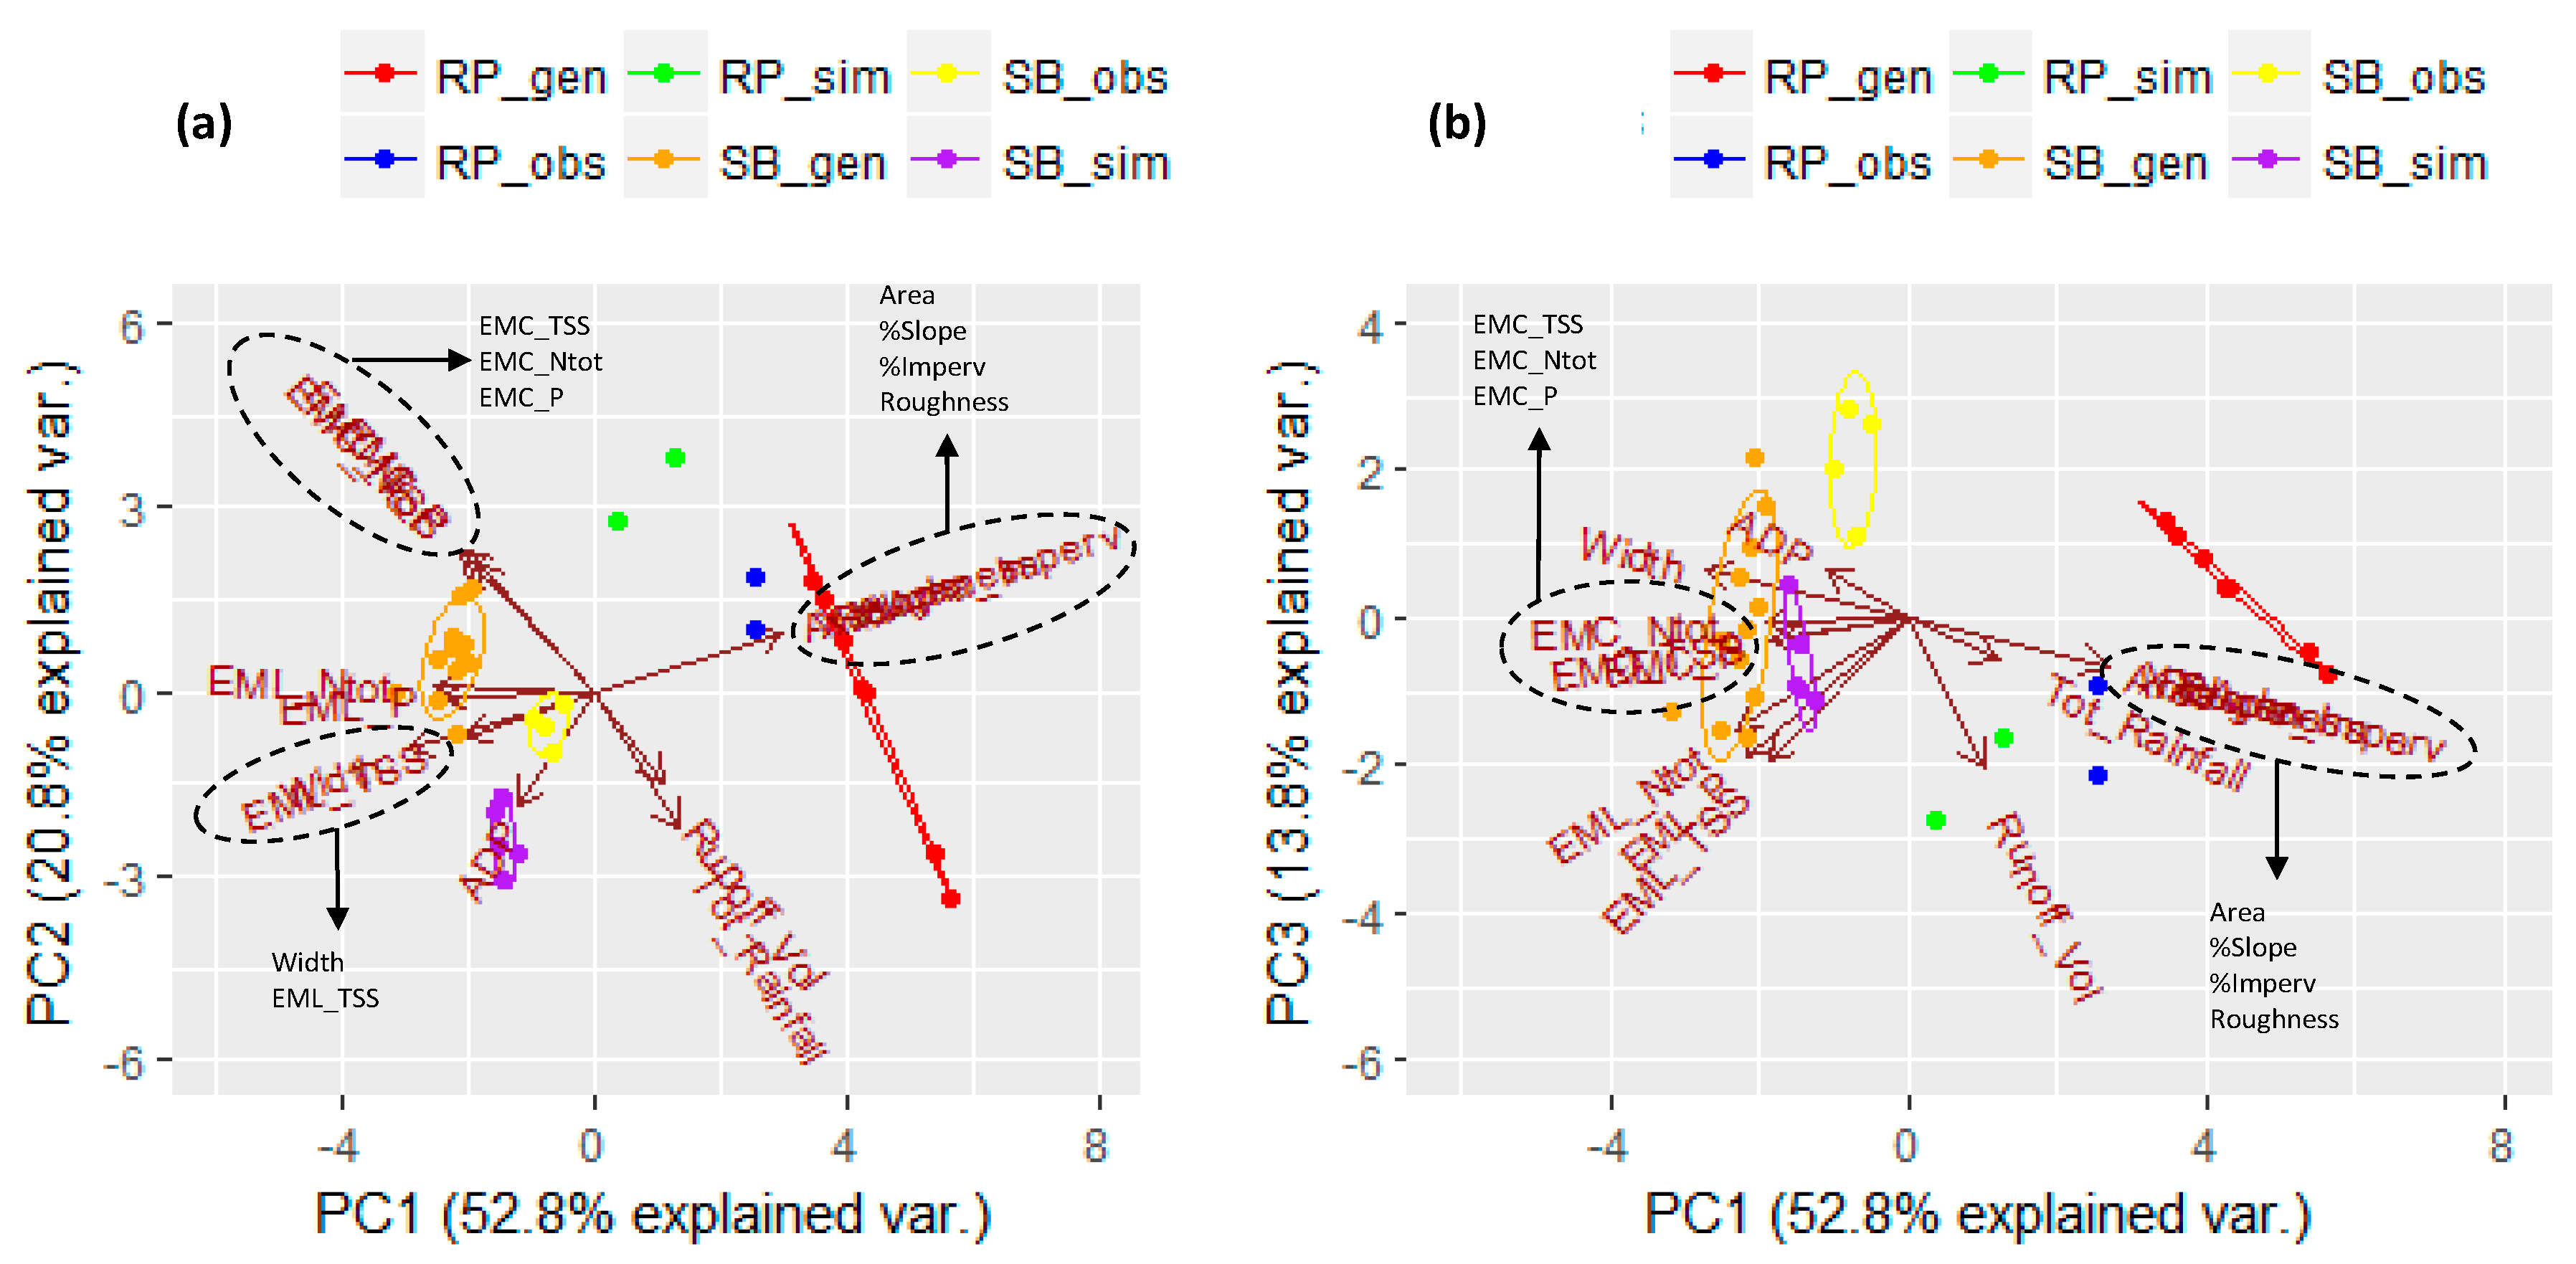
A data matrix (15 × 33) was the input for this PCA analysis. Since the first two PCs represented only 73.4% of the variance, the third PC was also taken into account. In this way, 87.2% of the variance is shown. In Figure 4, the resulting PCA biplots PC1 vs. PC2 (73.4% of the variance) (Figure 4a) and PC1 vs. PC3 (66.6% of the variance) (Figure 4b) are presented. The third biplot PC2 vs. PC3, in which only 34.6% of the variance is represented, is not reported.
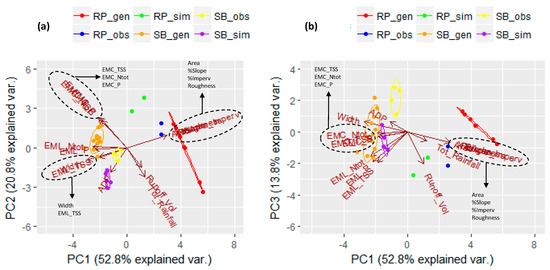
Figure 4.
PCA biplot (a) PC1 vs. PC2 and (b) PC1 vs. PC3 for identifying relationships between catchment/drainage and water-quality characteristics at SB and RP.
In Figure 4, the scores plots show two big clusters, one for the observed, generated, and simulated data points of SB (on the left of the biplots) and the other one for the observed, generated, and simulated data points for RP (on the right of the biplots). Furthermore, the main six clusters that identify generations, observations, and simulations of the two study areas are also represented. The overall analysis confirms the considerations made for Figure 3, but further investigation on the similarity of these data points is possible.
Considering the loading plots, the relationships obtained from the previous PCA (Figure 3) are confirmed here. In particular, the two net clusters representing EMCs and EMLs are also visible here, confirming that sediments play a fundamental role in transporting nutrients offsite via surface runoff. It is worth noting that, considering the two study areas together, the relationship between ADP and EMLs is better defined. In fact, if a long dry period occurs, the amount of pollutants that accumulate on the impervious urban surfaces is higher in terms of mass. Considering the runoff-volume projection on PC1, the previous result is confirmed, i.e., the higher the runoff volume, the bigger is the amount of pollutant load washed off. Moreover, further information can be added, considering the EMCs projections of PC1. The higher the runoff volume; the smaller the EMCs, justifying the dilution effects of the pollutants in a bigger amount of water. Considering the catchment-related variables, it is clear that % of impervious-area, % of slope, basin-area, and conduit-roughness vectors almost overlap, while the width is diametrically opposed. This is understandable if we consider a hypothetical hydraulic section (H × L), where L represents the width and H the water depth; under the same runoff condition, the bigger L, the smaller H. It is worth noting that width vector is always very close to water-quality vectors. Since width represents the distance over which overland flow leaves the sub-catchment surface and enters into the main drainage conduit, the bigger width, the higher is the number of pollutants that enter the drainage network.
On the basis of these results, it is worth remarking the key role played by ADP among rainfall characteristics and width among catchment and drainage characteristics.
3.4. Modeling Performance Assessment
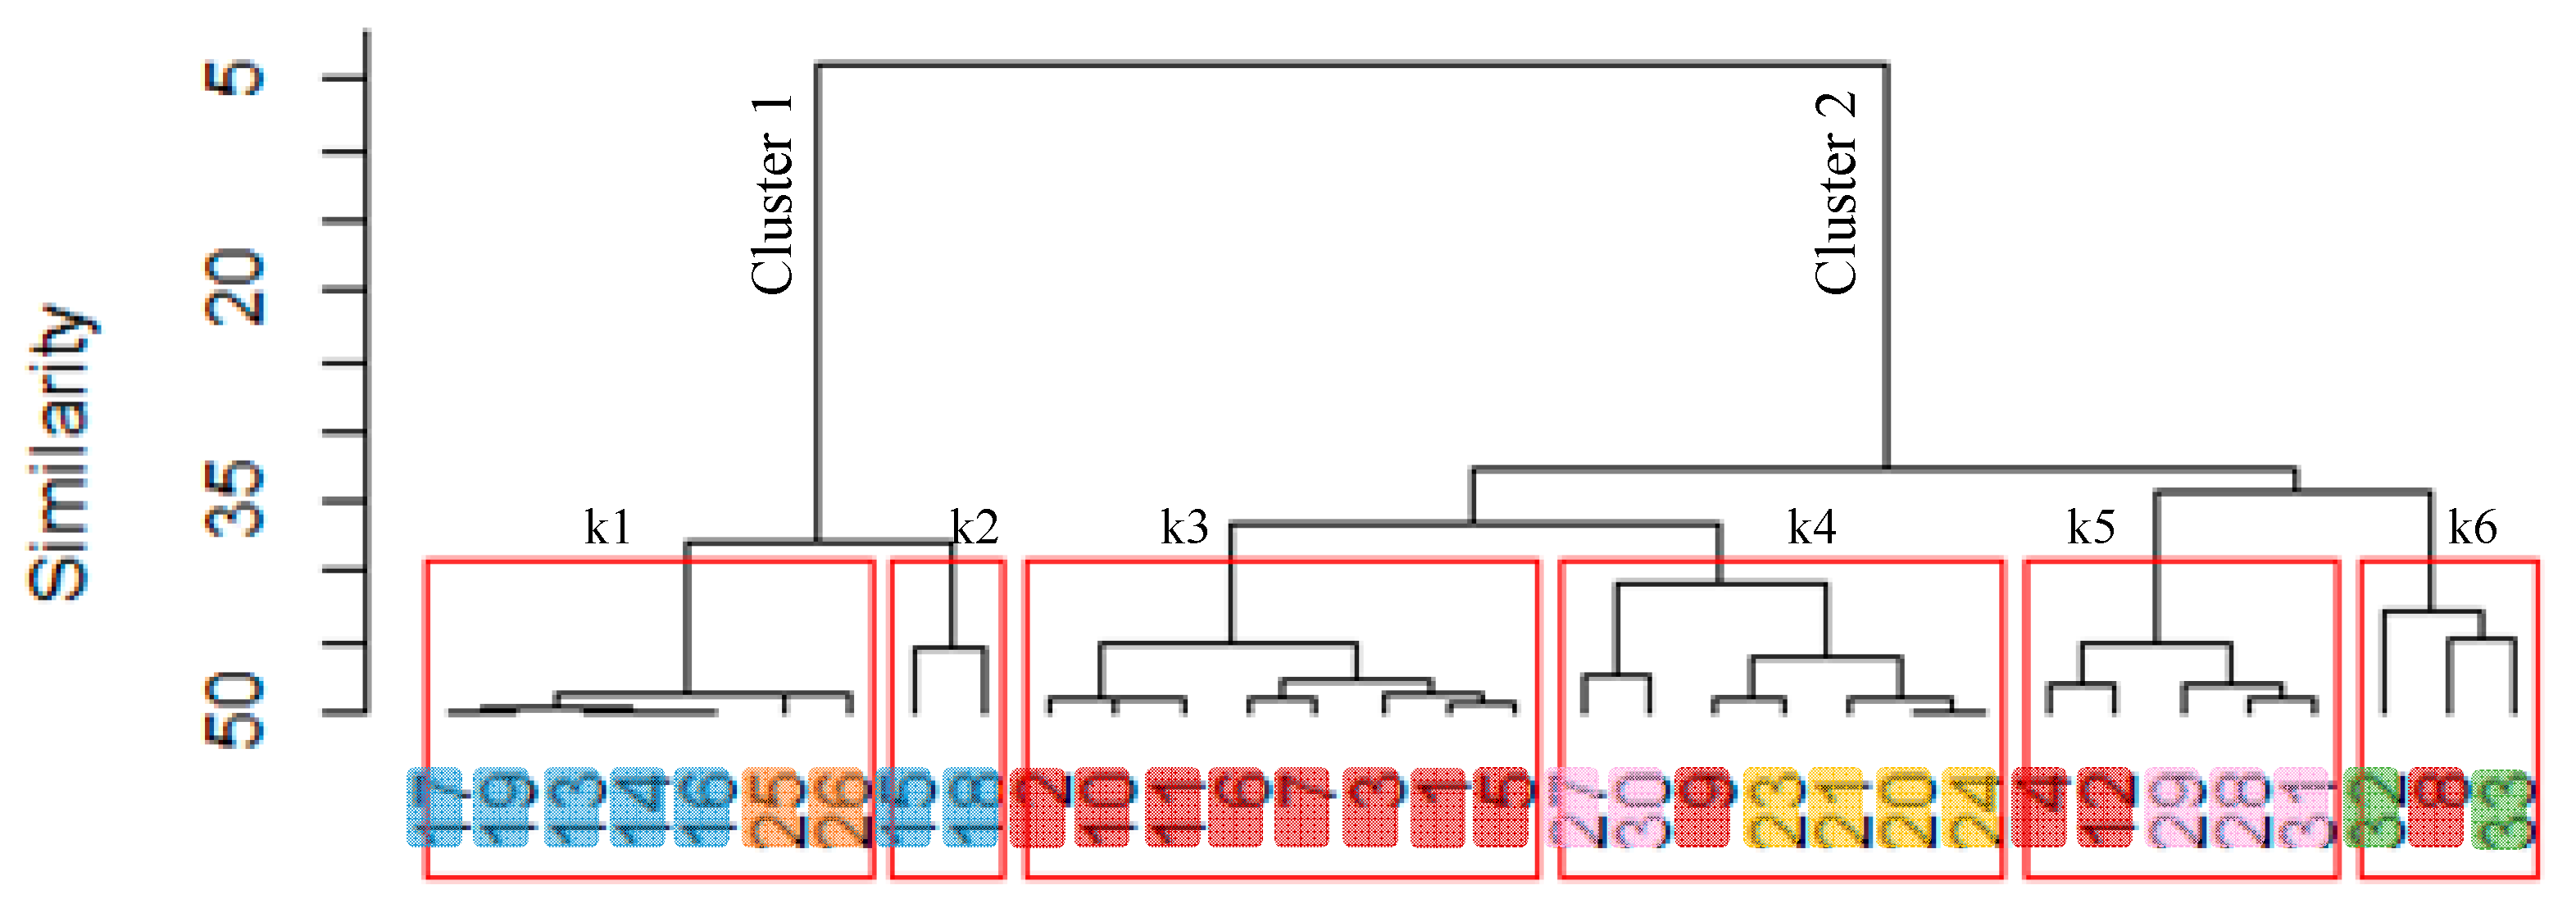
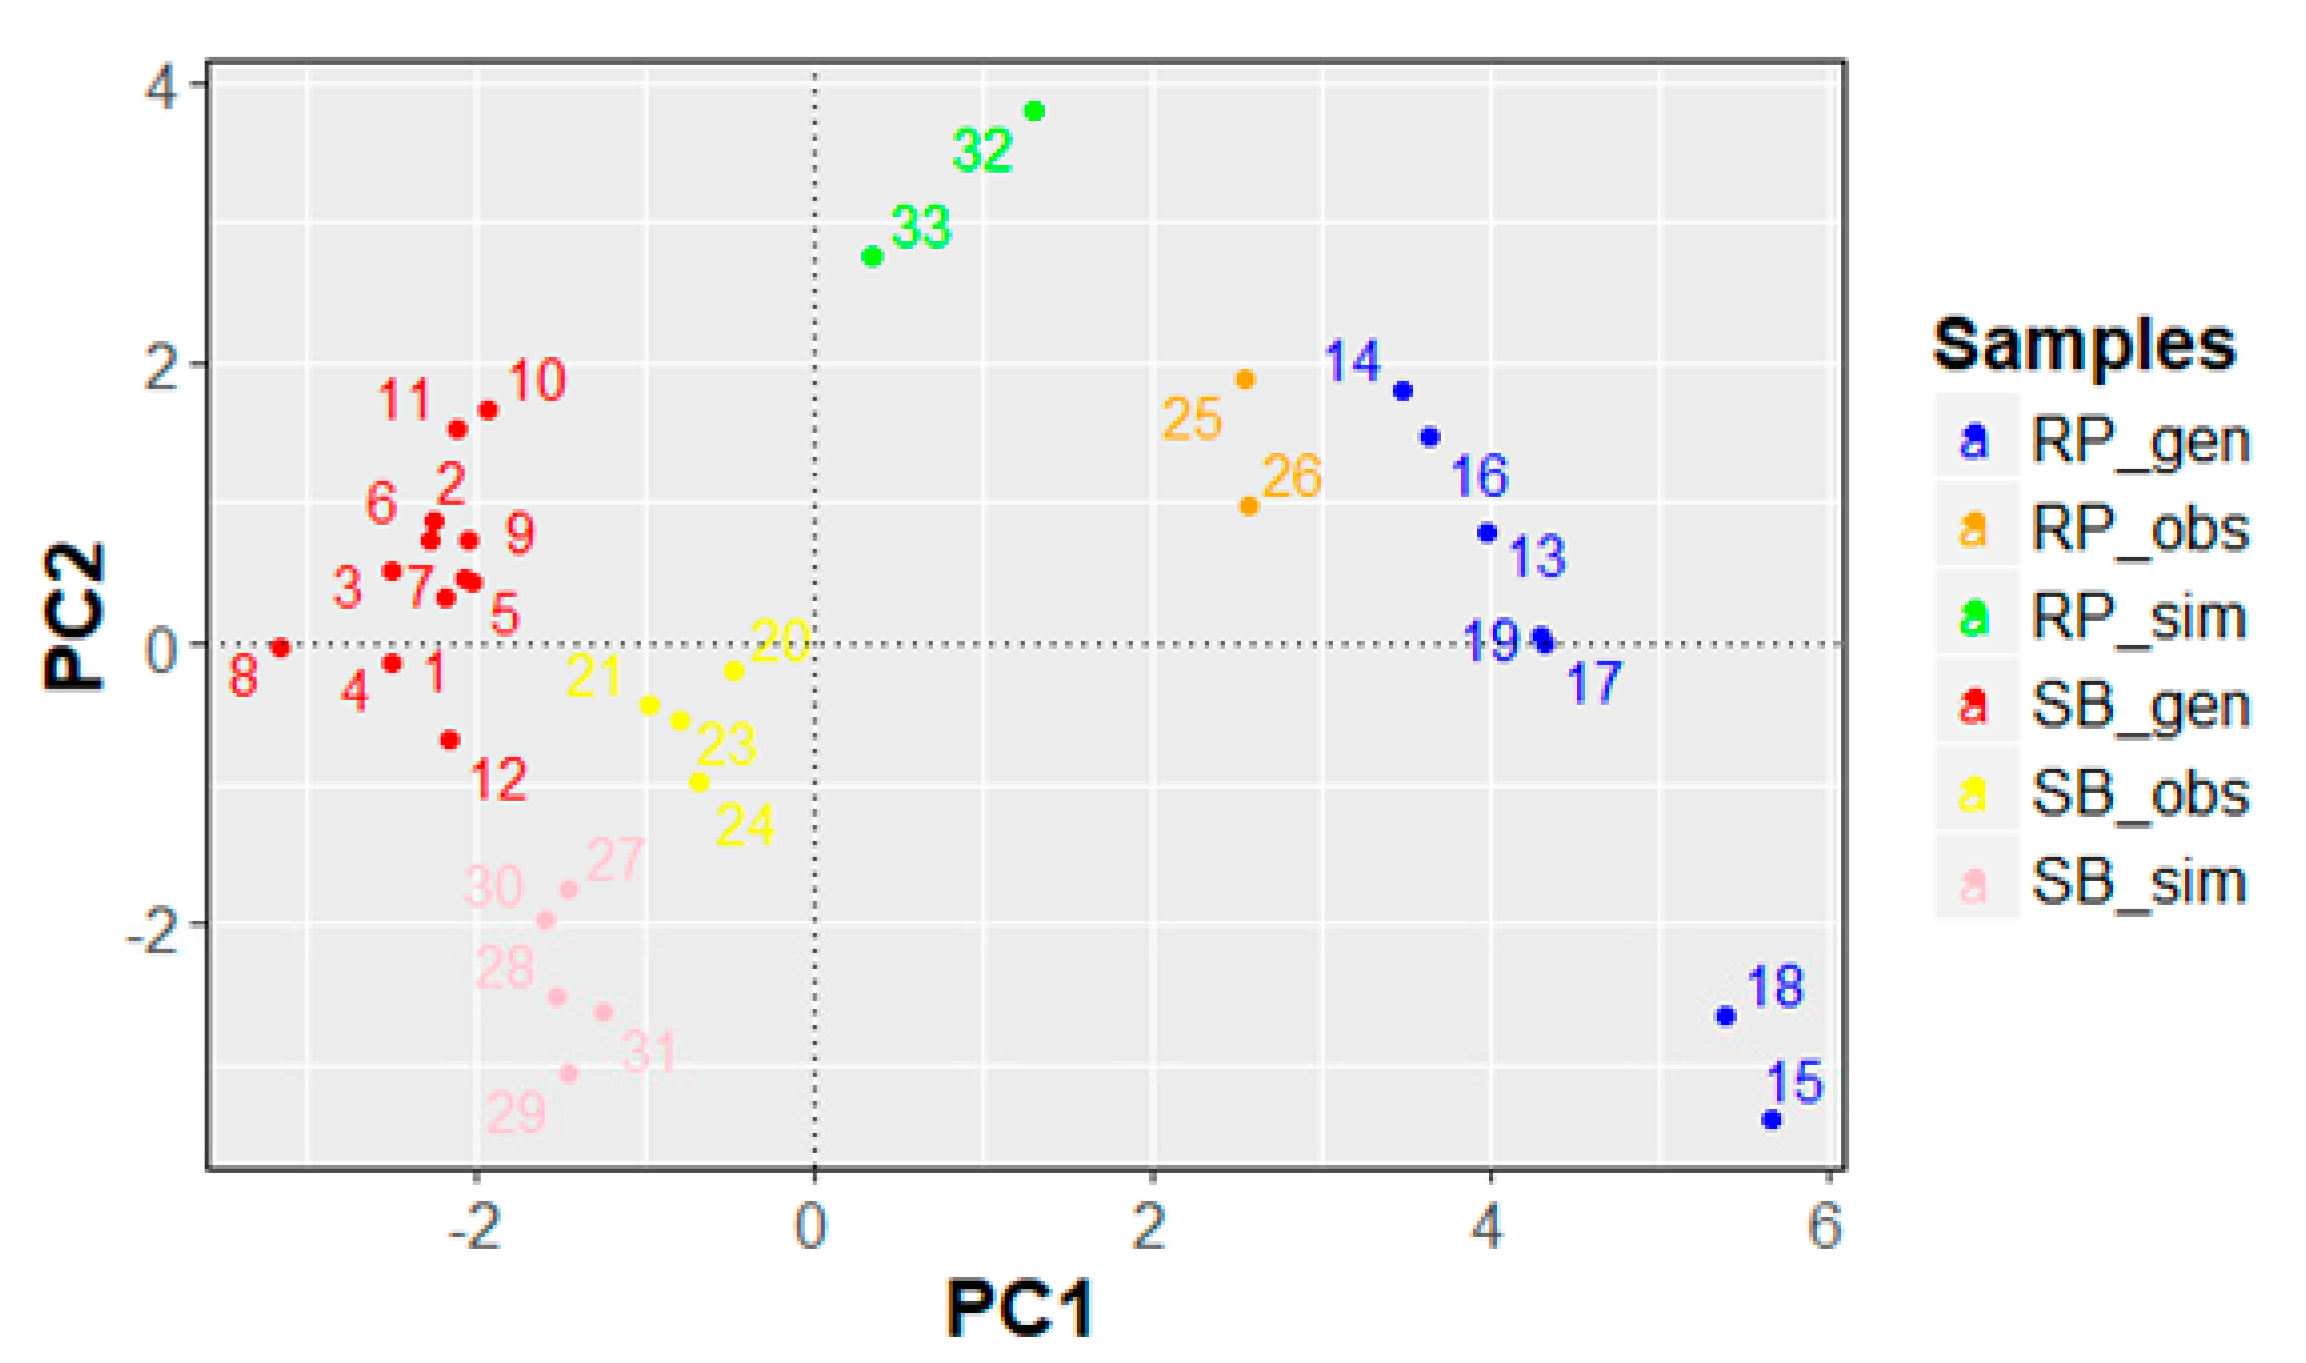
With the aim of thoroughly investigating the similarity among all the data points and confirm or add more information to the outcomes of the PCA-scores plot (Figure 4), a complementary analytical tool was used. Consequently, the same data set was analyzed using HCA. The resulting dendrogram using Ward linkage and Euclidean distance is shown in Figure 5. The main six clusters are highlighted in this representation. To understand the data-point enumeration of the dendrogram, in Figure 6 the scores plot reported in Figure 4a (PC1 vs. PC2) with the explicit data-point enumeration is shown with the same colors used in Figure 5.

Figure 5.
Dendrogram of the clusters of observations, generations, and simulations for SB and RP (ki, i ∈ [1,6] represent the six clusters identified).
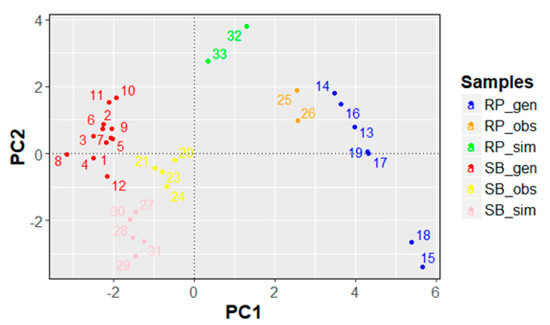
Figure 6.
Scores plot PC1 vs. PC2 with explicit data-point enumeration.
In Figure 5, the two main clusters (Cluster 1 and Cluster 2) that we were expecting to identify, one for each study area, are not well defined. In fact, Cluster 2 features not only all the data points related to SB (observations, simulations, and generations) but also the simulated events of RP. This result adds important information to the outcomes obtained with the PCA: the geographical proximity of the two study areas. In facts, they belong to the same subarea of the IRP model and, therefore, they are characterized by similar model parameters (mτdry, k, mτwet, mI, htot). Furthermore, taking into account the six main clusters (observations, generations, and simulations for SB and RP) (k = 6), HCA shows that, for SB, simulated events are similar to the generated and monitored ones since they do not create an isolated cluster but they are featured in the same clusters with the other data points (e.g., k1 and k4). Differently, for RP, the simulations (k6) are dissimilar to the generations and observation (k1 and k2). These results complement the previous ones about the model performance; in fact, as expected, the performance of the hydrologic/hydraulic and water-quality models of RP are not as good as at SB.
It is worth remarking the capability of this model-assessment approach in evaluating the accuracy of rainfall-runoff and water-quality model outcomes. This methodology may assist users in making appropriate model-performance conclusions and in guiding investments in model improvement and data acquisition campaigns.
4. Conclusions
In this study, we propose a methodological framework able to: (i) assess how rainfall, catchment, and drainage characteristics affect urban nutrient runoff in poor-gauged watersheds; (ii) evaluate hydrologic/hydraulic and water-quality model performance.
We exploited data from two real urban watersheds (SB and RP) located in the Puglia region (Southern Italy). The water-quality model was implemented in both sites, but it was calibrated and validated only at SB, with the aim of evaluating the diagnostic capacity of the proposed approach in assessing water-quality model performance. Good performances in predicting the quantity response of both sites were obtained by using the hydrologic/hydraulic module of SWMM with different sets of input parameters.
PCA and HCA were used to identify linkages between pollutant parameters and rainfall, catchment, and drainage-network characteristics. Three different sets of data were analyzed: (i) observations (data obtained from the monitoring campaign), (ii) simulations (data obtained from SWMM and measured rainfall), and (iii) generations (data obtained from SWMM and rainfall generated with IRP).
Based on PCA and HCA outcomes, the main conclusions can be summarized in the following points:
- The three rainfall-related variables (ADP, total rainfall, and runoff volume) presented a strong relationship-driven by ADP vector. In fact, the longer the ADP, the higher the water loss in the system, the greater the distance between total-rainfall and runoff-volume vectors.
- The solid relationships between EML_TSS and nutrient EMLs, and between EMC_TSS and nutrient EMCs, suggest that sediments transport plays a significant role in the mobilization of nutrients from urban impervious surfaces. This confirms that TSS can be considered as a synthetic index of the general level of pollution in urban areas.
- The robust correlation between runoff-volume vector and EMCs suggests that the greater is the volume of runoff, the smaller is the pollutant concentrations due to the dilution effect.
- The ADP behaves in different ways in the two study areas: at RP, it is clear that the longer the dry period, the higher is the number of pollutants (EMLs) accumulated on impervious surfaces. At SB, this relationship is less clear. It is worth mentioning that for SB, the ADP values are higher (up to one order of magnitude) than the ones measured/generated for RP; therefore, it is more probable that in longer dry periods, degradation processes (not considered in this study) play a critical role in the urban pollutant build-up.
- Considering that % impervious-area, % slope, basin-area, and conduit-roughness almost overlap, it is clear that these parameters have exactly the same effect on water quality: if they increase, sediment and nutrient load increases. While width has a diametrically opposite behavior. Since width represents the distance over which overland flow leaves the sub-catchment surface and enters into the main drainage conduit, the bigger width, the higher is the number of pollutants that enter the drainage network.
- The diagnostic capacity of this approach to evaluate model performance was successfully tested with HCA. At SB, simulated events were featured in the same clusters with the observed and generated. While, at RP, the simulations were included in the least similar clusters.
Further development can be pursued within the proposed framework in particular for evaluating possible model improvements aimed at reducing model structural uncertainty without increasing the consequent parameter uncertainty. Nevertheless, for the purpose of this paper, particular importance has the proposed methodological framework, whose diagnostic ability becomes crucial in real design cases where classical calibration/validation exercises are not possible due to the absence of sufficient direct observations. The outcomes presented in this study are expected to aid researchers and technicians in assessing and quantifying their confidence in the water-quality predictions, which facilitates informed analysis, communication, and decision-making.
Supplementary Materials
The following are available online at https://www.mdpi.com/2071-1050/11/18/4933/s1, SM-1: Generated rainfall time series obtained with IRP for SB and RP.
Author Contributions
Conceptualization—A.Go.; methodology—A.Go.; validation—A.Go.; formal analysis—A.Go.; investigation—A.Go.; data curation—A.Go.; writing—original draft preparation—A.Go.; writing—review and editing—A.Gi. and V.I.; supervision—A.Gi. and V.I.
Funding
This research received no external funding.
Conflicts of Interest
The authors declare no conflict of interest.
References
- Brezonik, P.L.; Stadelmann, T.H. Analysis and Predictive Models of Stormwater Runoff Volumes, Loads, and Pollutant Concentrations from Watersheds in the Twin Cities Metropolitan Area, Minnesota, USA. Water Res. 2002, 36, 1743–1757. [Google Scholar] [CrossRef]
- Todeschini, S. Hydrologic and Environmental Impacts of Imperviousness in an Industrial Catchment of Northern Italy. J. Hydrol. Eng. 2016, 21, 05016013. [Google Scholar] [CrossRef]
- Gorgoglione, A.; Bombardelli, F.A.; Pitton, B.J.L.; Oki, L.R.; Haver, D.L.; Young, T.M. Uncertainty in the parameterization of sediment build-up and wash-off processes in the simulation of sediment transport in urban areas. Environ. Model. Softw. 2019, 111, 170–181. [Google Scholar] [CrossRef]
- NRC (National Research Council). Assessing the TMDL Approach to Water Quality Management; Committee to Assess the Scientific Basis of the Total Maximum Daily Load Approach to Water Pollution Reduction National Academy Press: Washington, DC, USA, 2001. [Google Scholar]
- Brett, M.T.; Arhonditsis, G.B.; Mueller, S.E.; Mueller, S.E.; Hartley, D.M.; Frodge, J.D.; Funke, D.E. Non-Point-Source Impacts on Stream Nutrient Concentrations Along a Forest to Urban Gradient. Environ. Manag. 2005, 35, 330–342. [Google Scholar] [CrossRef] [PubMed]
- Liu, A.; Egodawatta, P.; Guan, Y.; Goonetilleke, A. Influence of rainfall and catchment characteristics on urban stormwater quality. Sci. Total Environ. 2013, 444, 255–262. [Google Scholar] [CrossRef] [PubMed]
- Yuan, Q.; Guerra, H.B.; Kim, Y. An Investigation of the Relationships between Rainfall Conditions and Pollutant Wash-Off from the Paved Road. Water 2017, 9, 232. [Google Scholar] [CrossRef]
- Liu, A.; Carroll, S.; Dawes, L.; Goonetilleke, A. Monitoring of a mixed land use catchment for pollutant source characterisation. Environ. Monit. Assess. 2017, 189, 336. [Google Scholar] [CrossRef] [PubMed]
- Veneziano, D.; Iacobellis, V. Multiscaling pulse representation of temporal rainfall. Water Resour. Res. 2002, 38, 131–1313. [Google Scholar] [CrossRef]
- Di Modugno, M.; Gioia, A.; Gorgoglione, A.; Iacobellis, V.; la Forgia, G.; Piccinni, A.F.; Ranieri, E. Build-up/wash-off monitoring and assessment for sustainable management of first flush in an urban area. Sustainability 2015, 7, 5050–5070. [Google Scholar] [CrossRef]
- Veneziano, D.; Furcolo, P.; Iacobellis, V. Multifractality of iterated pulse processes with pulse amplitudes generated by a random cascade. Fractals 2002, 10, 209–222. [Google Scholar] [CrossRef]
- Gorgoglione, A.; Gioia, A.; Iacobellis, V.; Piccinni, A.F.; Ranieri, E. A rationale for pollutograph evaluation in ungauged areas, using daily rainfall patterns: Case studies of the Apulian region in Southern Italy. Appl. Environ. Soil Sci. 2016, 2016. [Google Scholar] [CrossRef]
- Regional Regulation, 9 December 2013, nº 26, “Stormwater runoff and first flush regulations” (implementation of article 13 of Legislative Decree nº 152/06 and subsequent amendments). Available online: https://www.indicenormativa.it/sites/default/files/R_26_09_12_2013.pdf (accessed on 9 September 2019).
- Rossman, L.A. Storm Water Management Model User’s Manual Version 5.0; EPA/600/R-05/040; National Risk Management Research Laboratory-Office of Research and Development, U.S. Environmental Protection Agency: Cincinnati, OH, USA, 2010.
- Horton, R.E. An approach toward a physical interpretation of infiltration capacity. Soil Sci. Soc. Am. 1940, 5, 399–417. [Google Scholar] [CrossRef]
- Gorgoglione, A. Control and Modeling Non-Point Source Pollution in Mediterranean Urban Basins. Ph.D. Thesis, Doctoral Program in Environmental and Territorial Safety and Control. Scuola Interpolitecnica di Dottorato—Politecnico di Bari, Bari, Italy, 2016. [Google Scholar] [CrossRef]
- EPA. Storm Water Management Model Reference Manual Volume III—Water Quality; National Risk Management Laboratory Office of Research and Development, U.S. Environmental Protection Agency: Cincinnati, OH, USA, 2016.
- Team, R.C. R: A Language and Environment for Statistical Computing; R Foundation for Statistical Computing: Vienna, Austria, 2017; Available online: https://www.R-project.org/ (accessed on 21 February 2019).
- Duan, W.; He, B.; Nover, D.; Yang, G.; Chen, W.; Meng, H.; Zou, S.; Liu, C. Water quality assessment and pollution source identification of the eastern Poyang Lake basin using multivariate statistical methods. Sustainability 2016, 8, 133. [Google Scholar] [CrossRef]
- Gorgoglione, A.; Bombardelli, F.A.; Pitton, B.J.L.; Oki, L.R.; Haver, D.L.; Young, T.M. Role of sediments in insecticide runoff from urban surfaces: Analysis and modeling. Int. J. Environ. Res. Public Health 2018, 15, 1464. [Google Scholar] [CrossRef]
- Gorgoglione, A.; Crisci, M.; Kayser, R.H.; Chreties, C.; Collischonn, W. A New Scenario-Based Framework for Conflict Resolution in Water Allocation in Transboundary Watersheds. Water 2019, 11, 1174. [Google Scholar] [CrossRef]
- Kokot, S.; Grigg, M.; Panaiotou, H.; Phuong, T.D. Data interpretation by some common chemometric methods. Electroanalysis 1998, 10, 1081–1088. [Google Scholar] [CrossRef]
- Massart, D.L.; Vandeginste, B.G.M.; Deming, S.M.; Michotte, Y.; Kaufman, L. Chemometrics—A Text Book; Elsevier: Amsterdam, The Netherlands, 1988; Chapters 1–4; pp. 14–21. [Google Scholar]
- Jain, A.K.; Murty, M.N.; Flynn, P.J. Data Clustering: A Review. ACM Comput. Surv. 1999, 31, 264–323. [Google Scholar] [CrossRef]
- Gorgoglione, A.; Gioia, A.; Iacobellis, V.; Piccinni, A.F.; Ranieri, E. A Predictive Model for Pollutant Concentrations in Ungauged Urban Basins. In Proceedings of the XXXV Convegno Nazionale di Idraulica e Costruzioni Idrauliche, Bologna, Italy, 14–16 September 2016. [Google Scholar]

© 2019 by the authors. Licensee MDPI, Basel, Switzerland. This article is an open access article distributed under the terms and conditions of the Creative Commons Attribution (CC BY) license (http://creativecommons.org/licenses/by/4.0/).