Intra- and Inter-Annual Variability of Hydrometeorological Variables in the Jinsha River Basin, Southwest China
Abstract
:1. Introduction
2. Methods
2.1. Experimental Procedure and Analysis
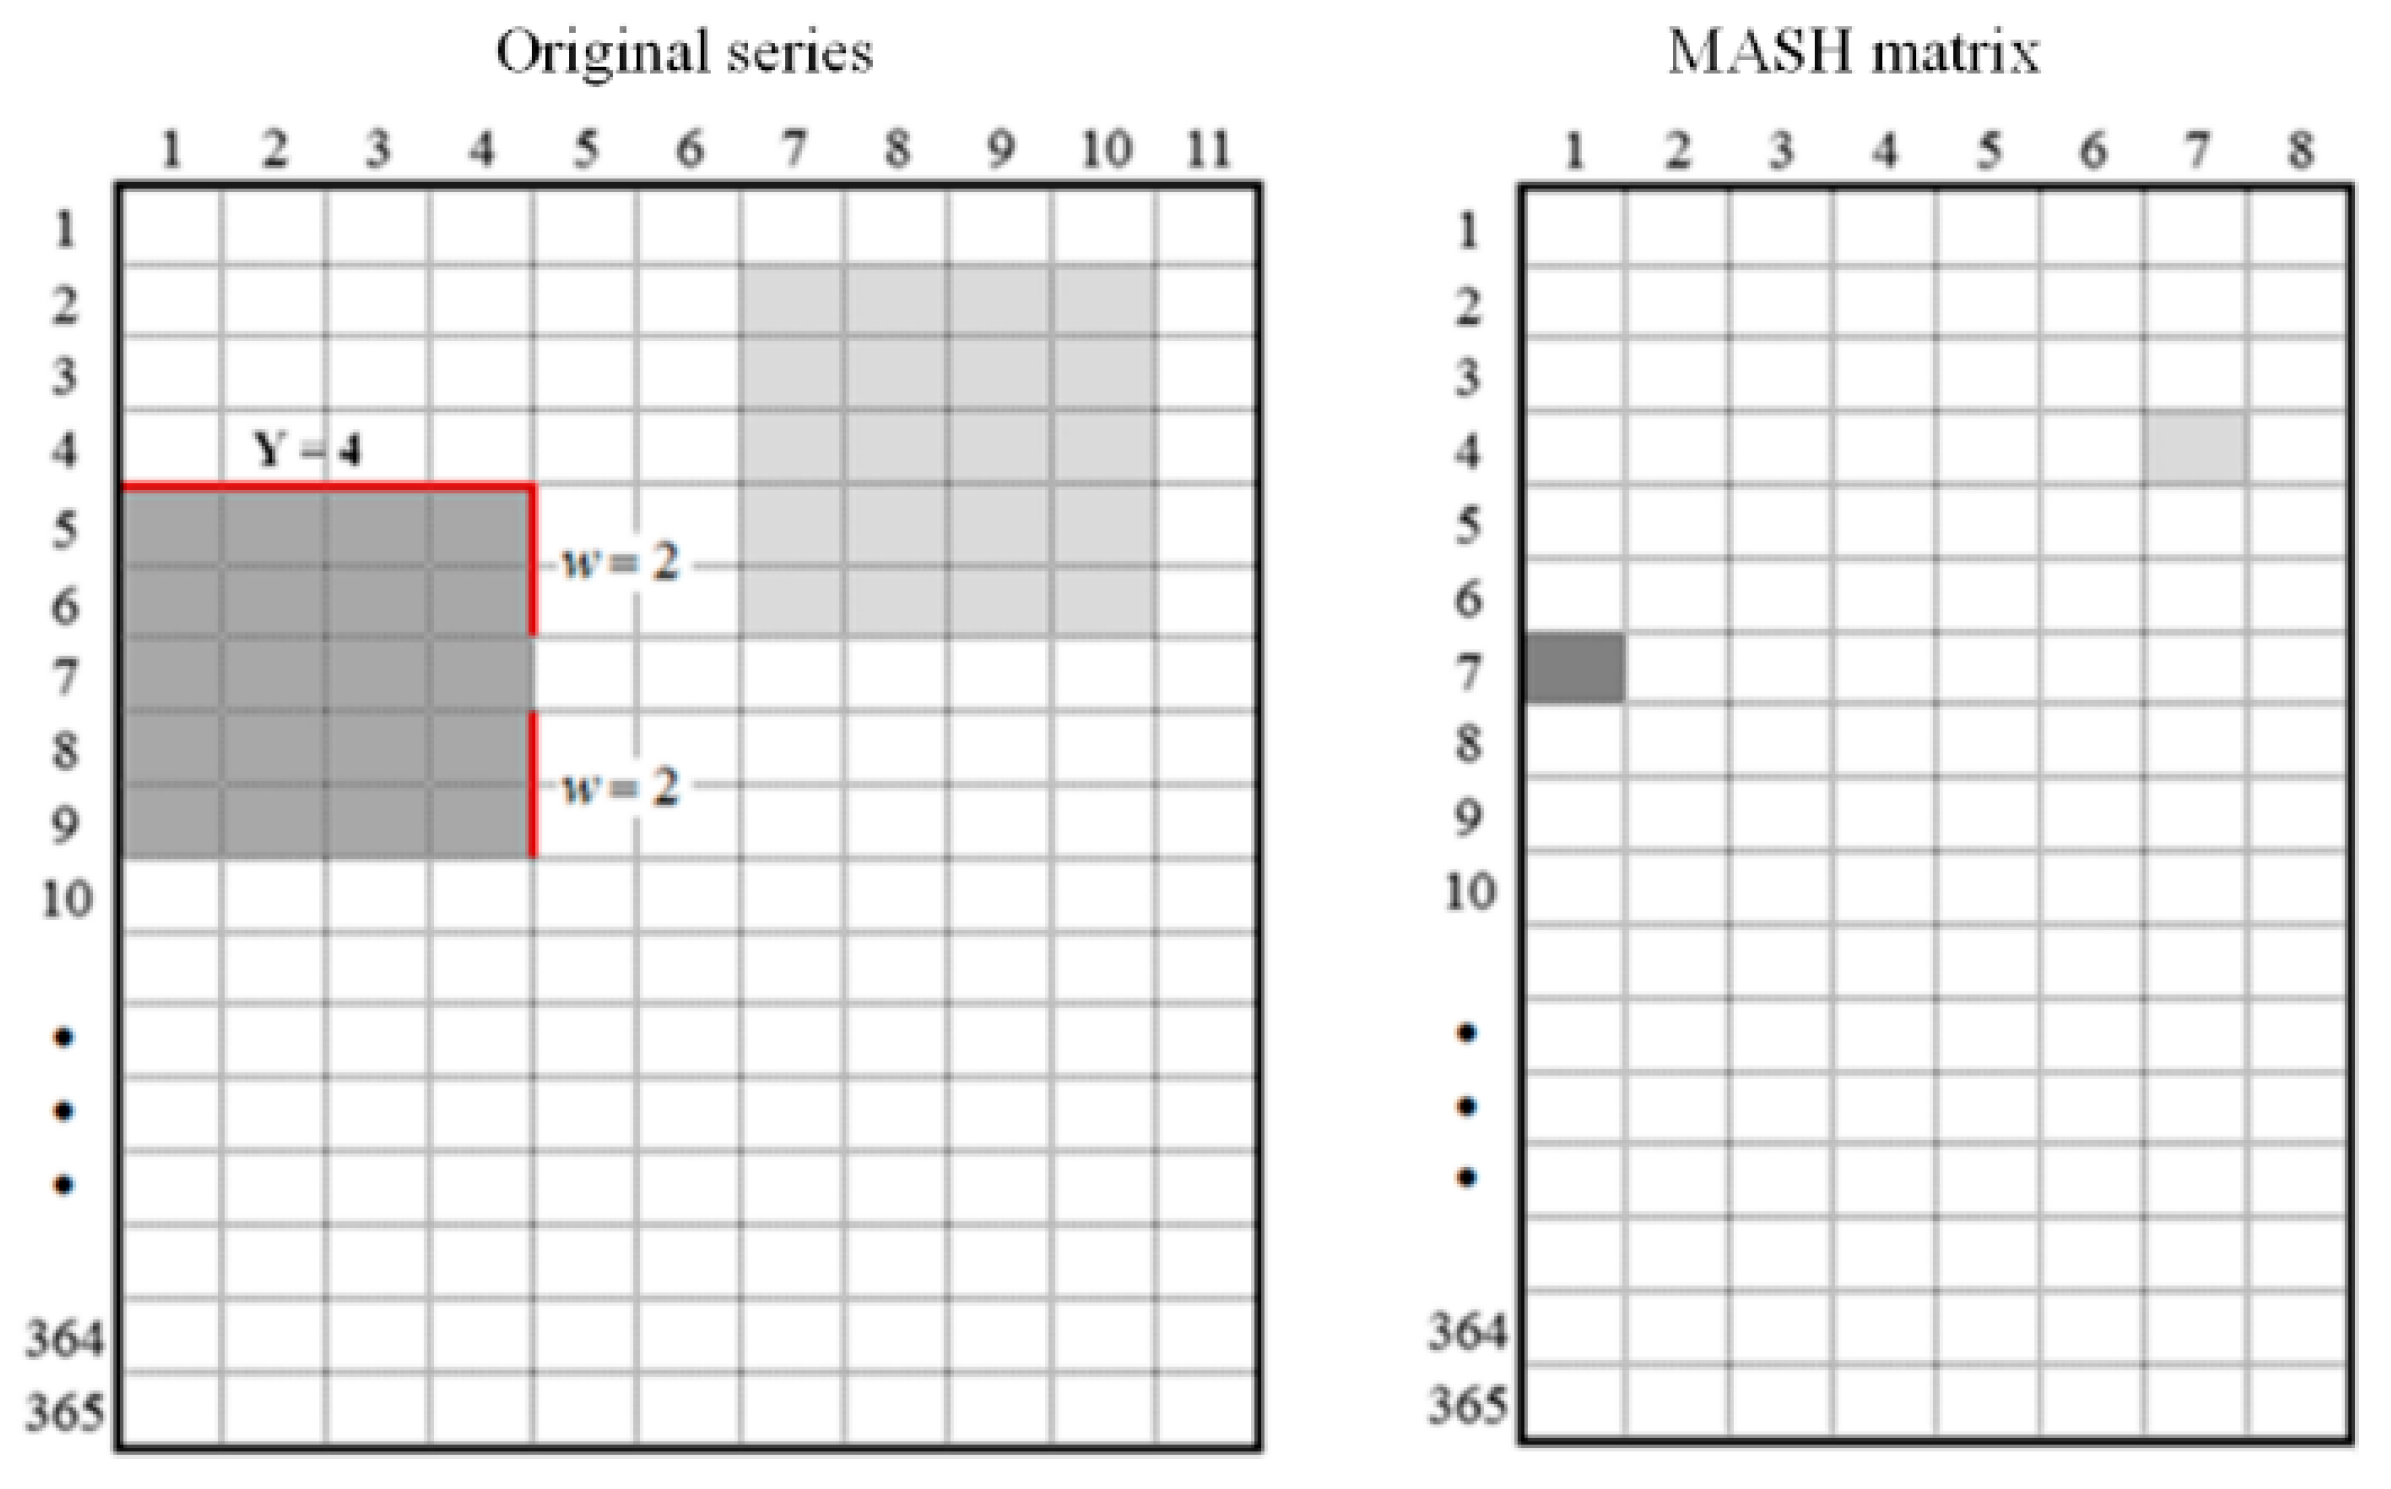
2.2. Moving Average over Shifting Horizon
2.3. Spearman Correlation Coefficient
2.4. Mann–Kendall Test
2.5. Sen’s Slope Estimation Method
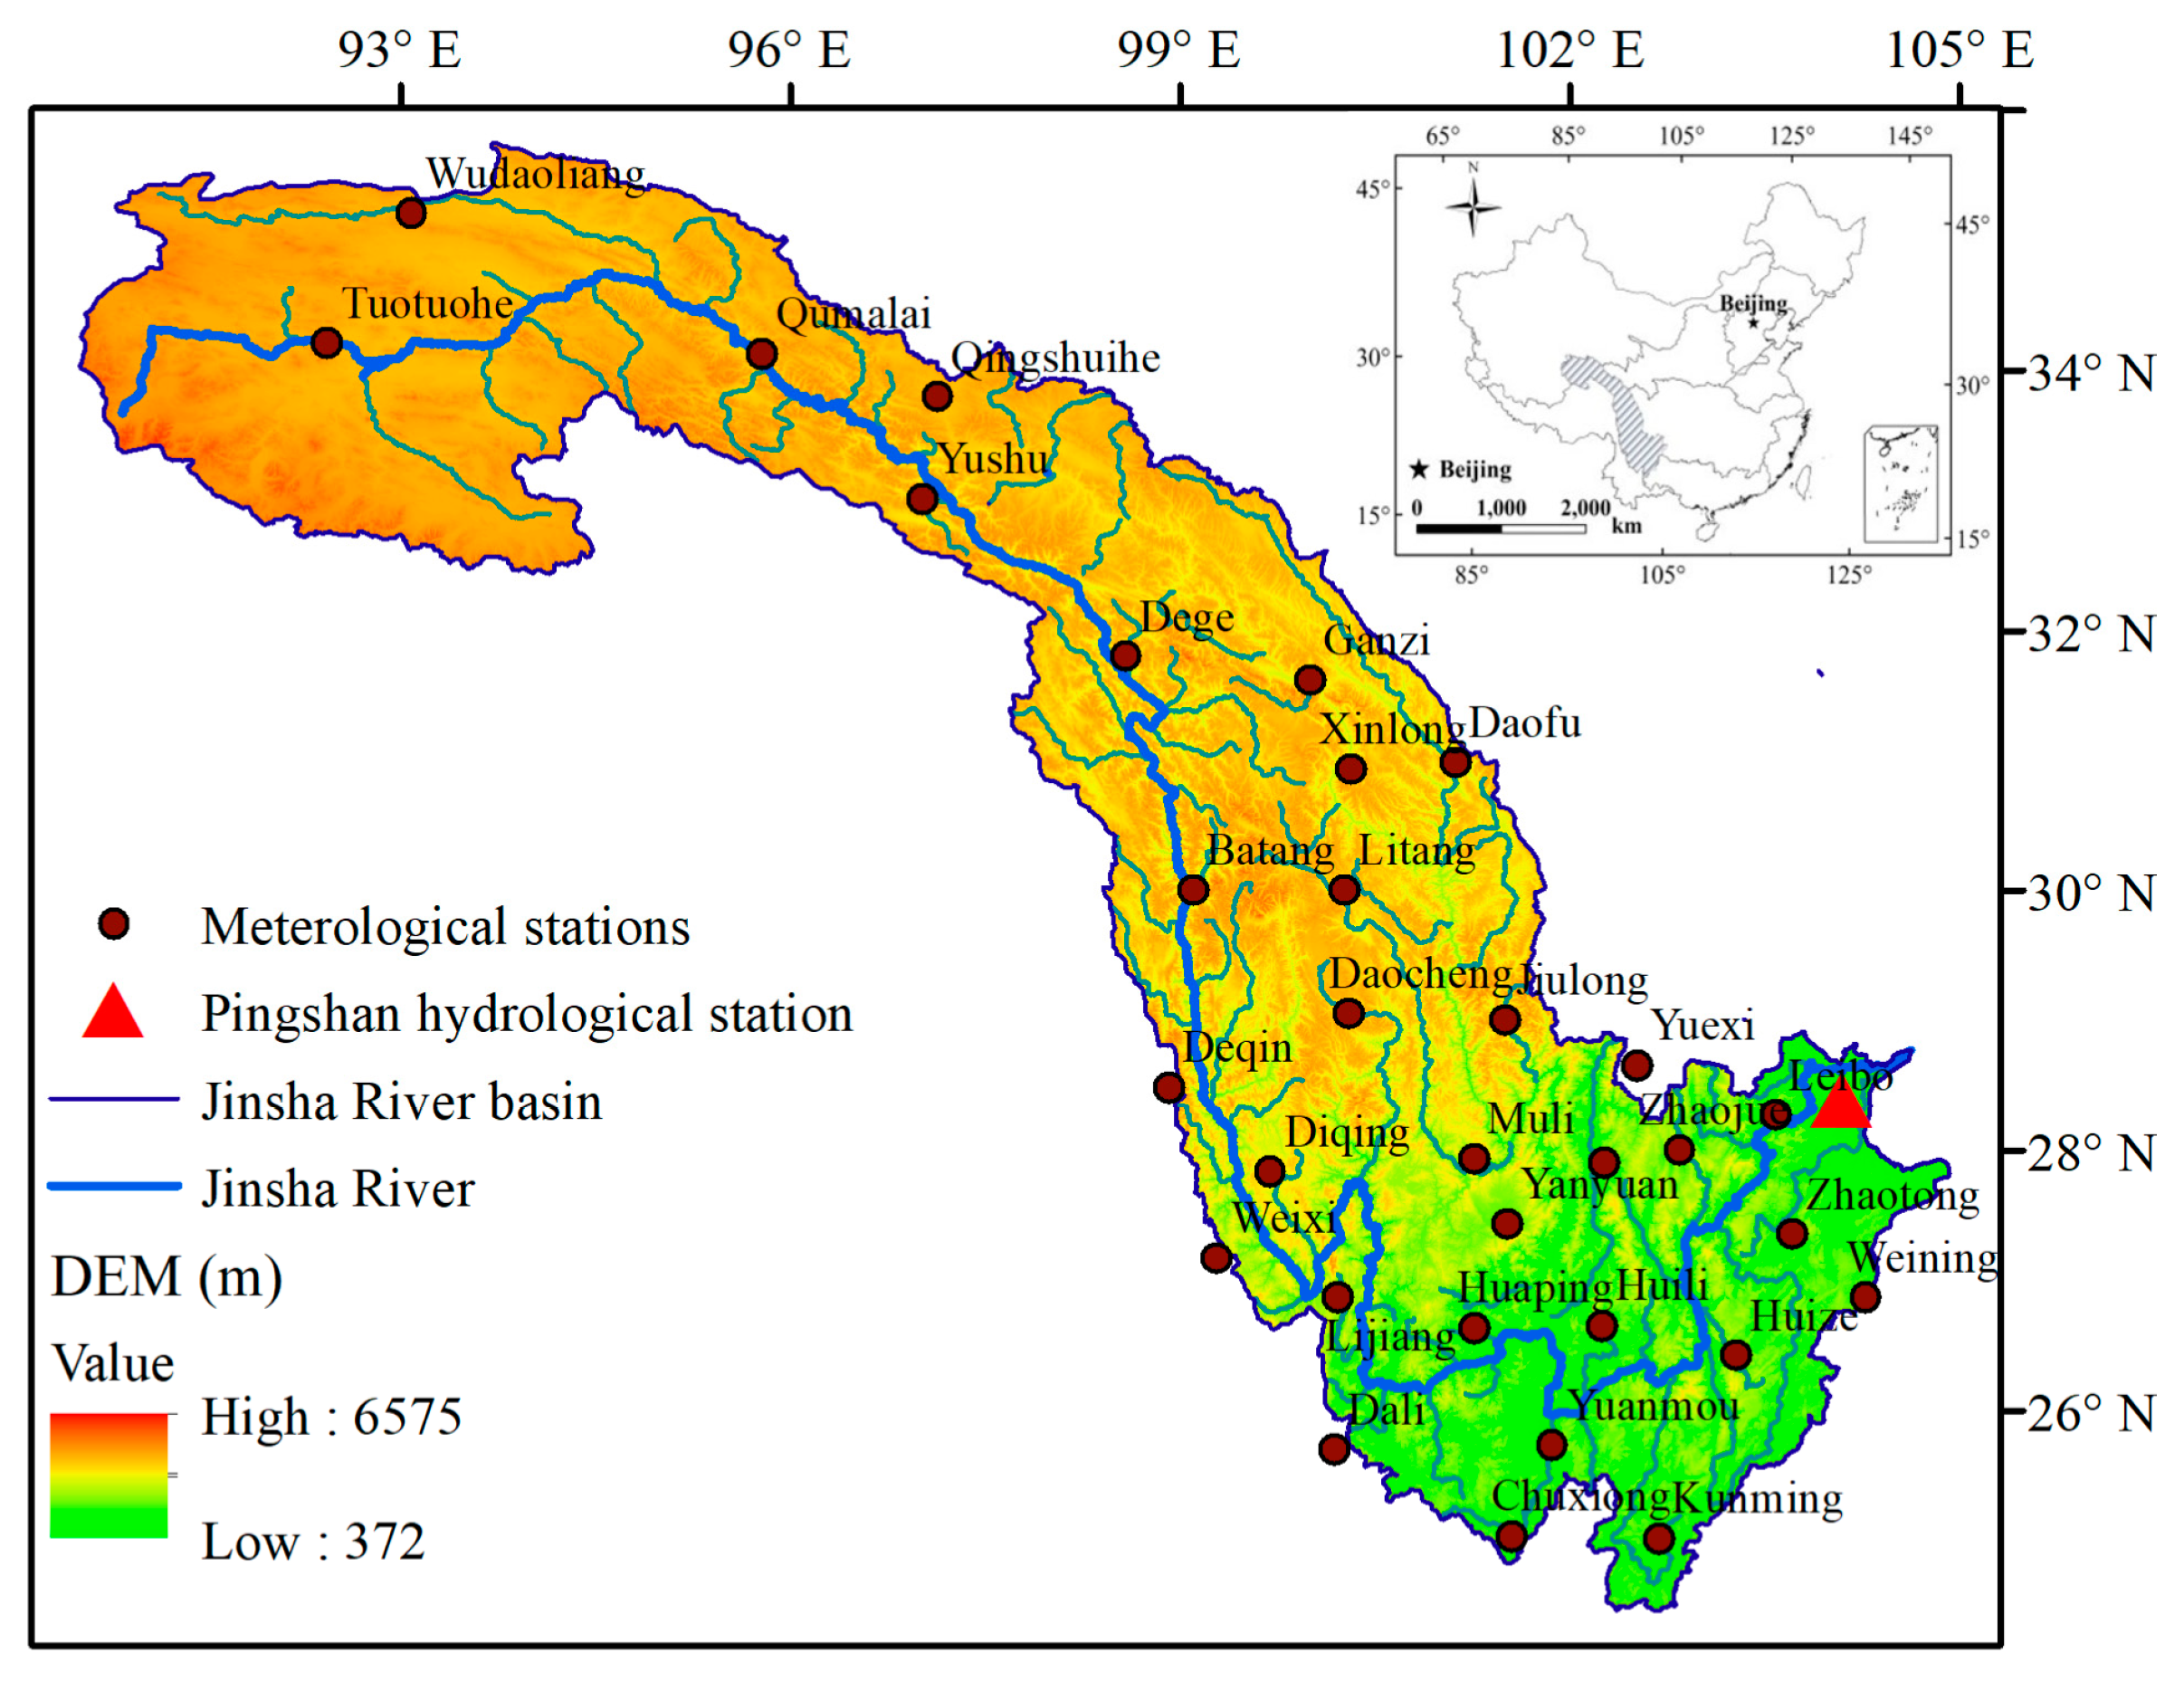
3. Study Area and Data Collection
3.1. Study Area
3.2. Data Collection
4. Results and Discussion
4.1. MK Trend Detection Results
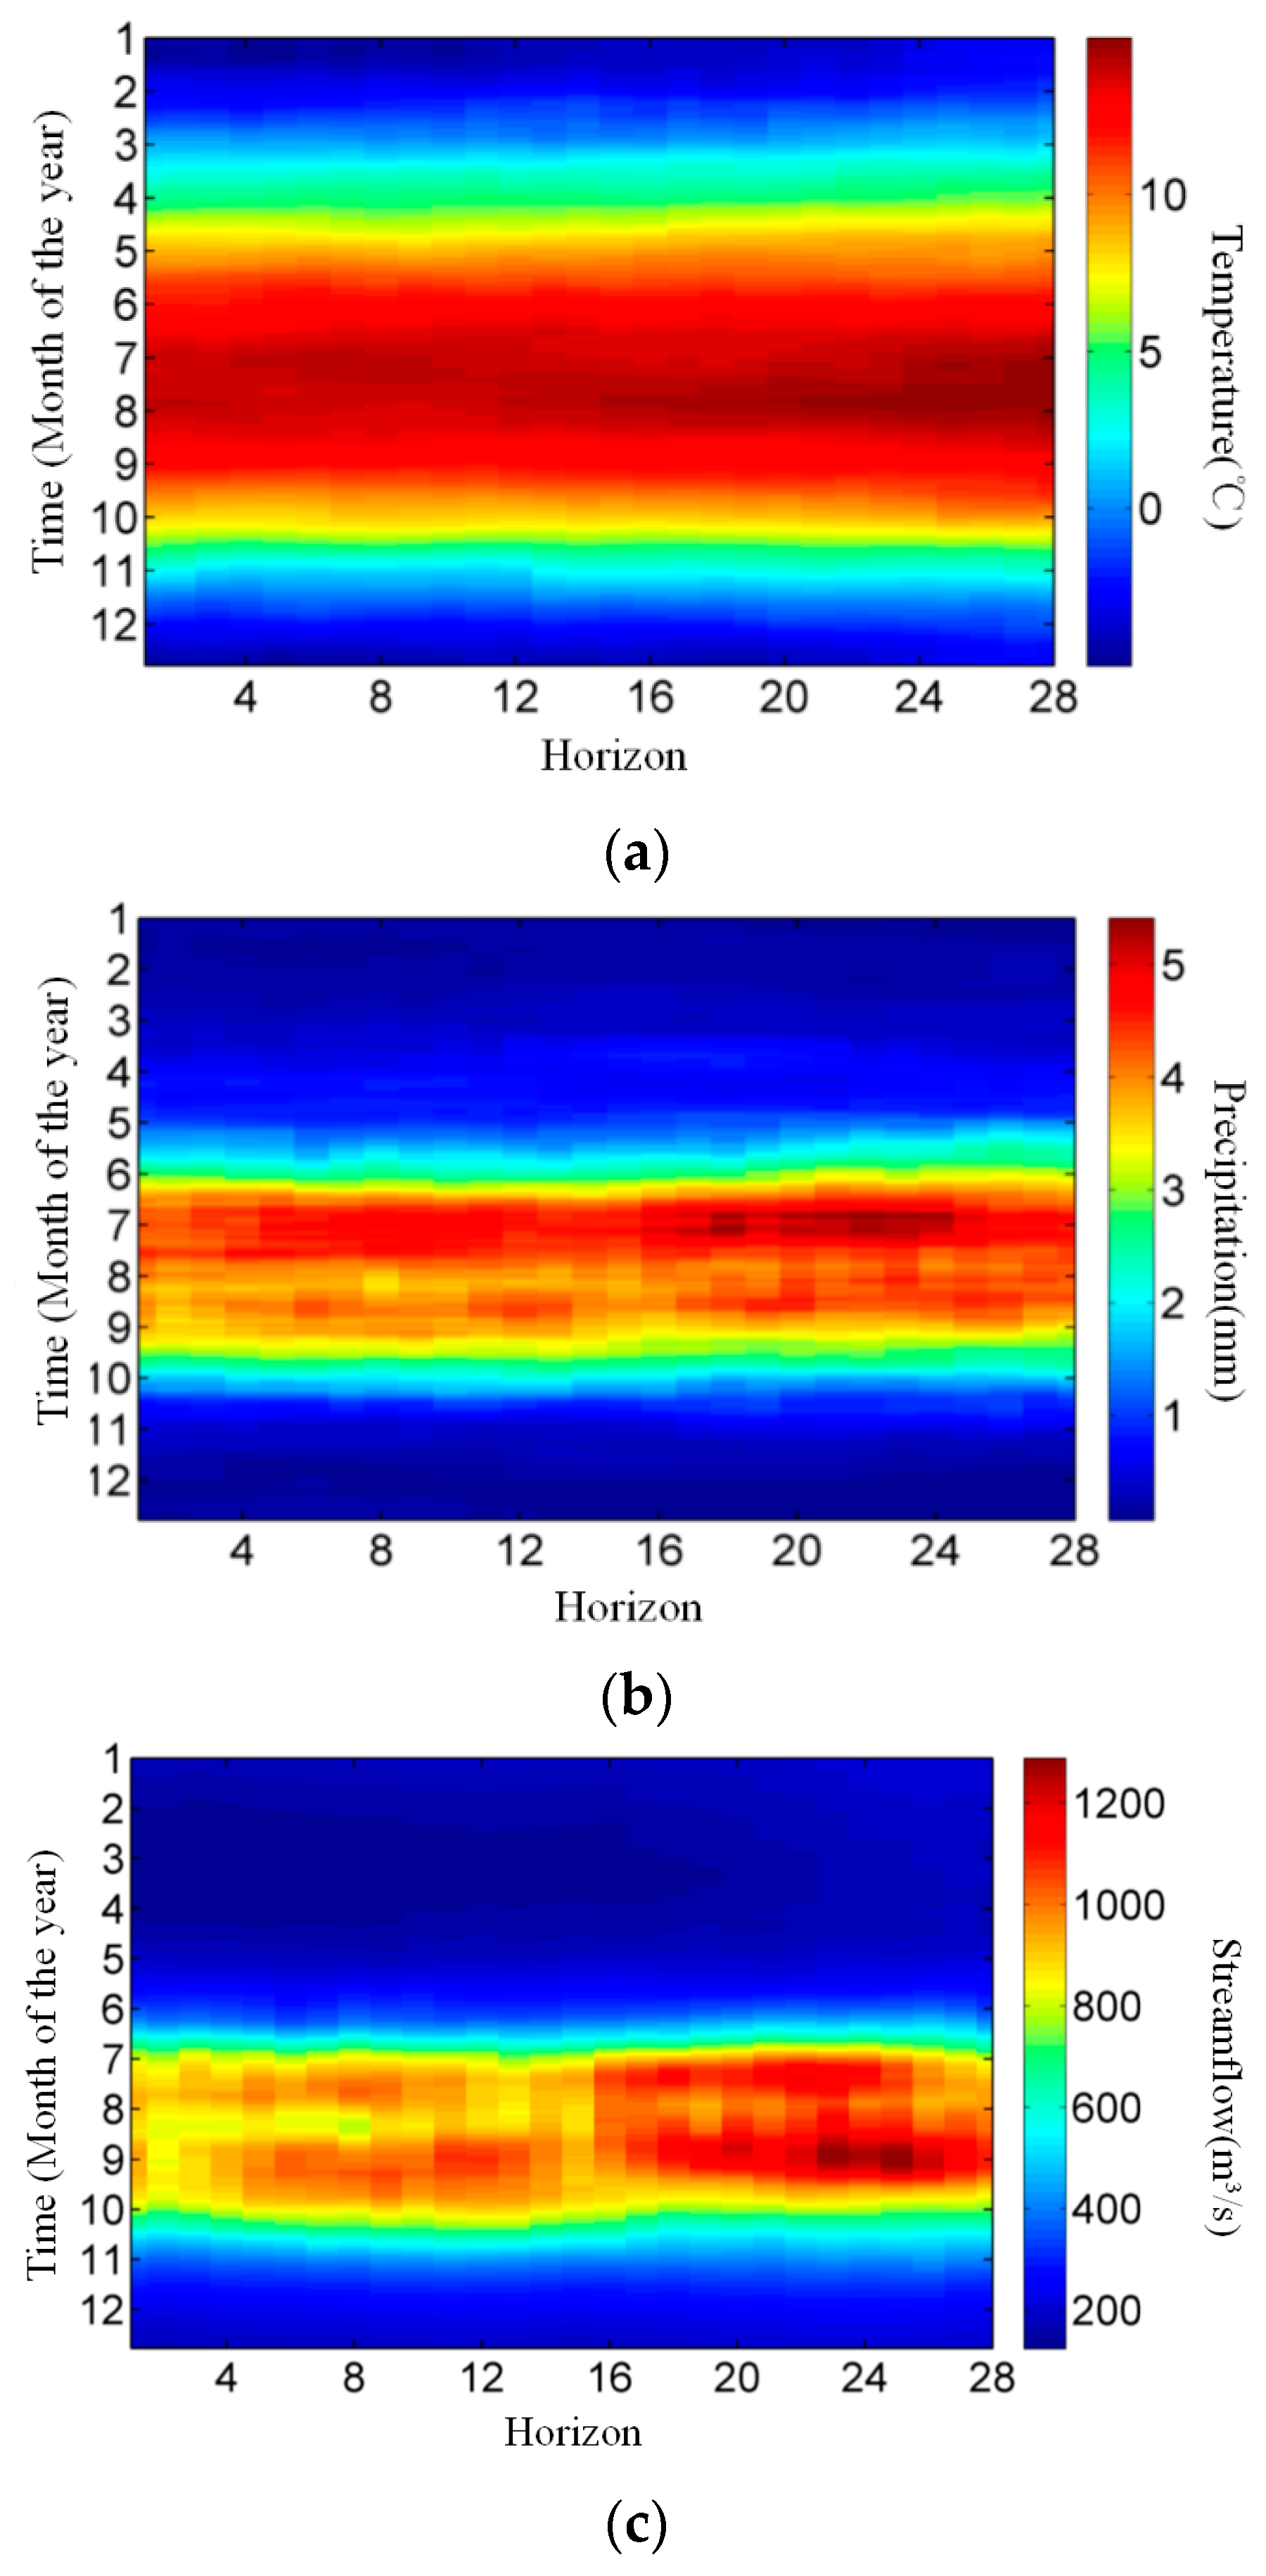
4.2. Results of the MASH Method
4.3. Combination of the MASH Method with Statistical Tests
4.4. Sensitivity Analysis of the Smoothing Parameters on Estimated Trends
5. Conclusions
- The annual temperature from 1974 to 2010 showed a significant increasing trend. Significant increasing trends were detected for almost all of the monthly temperatures, except February and October. Significant increasing trends were detected from January to April for streamflow. The increasing temperature was consistent with the global warming background. Temperature variations played an important role in the formation of streamflow and explained the increasing trends for streamflow.
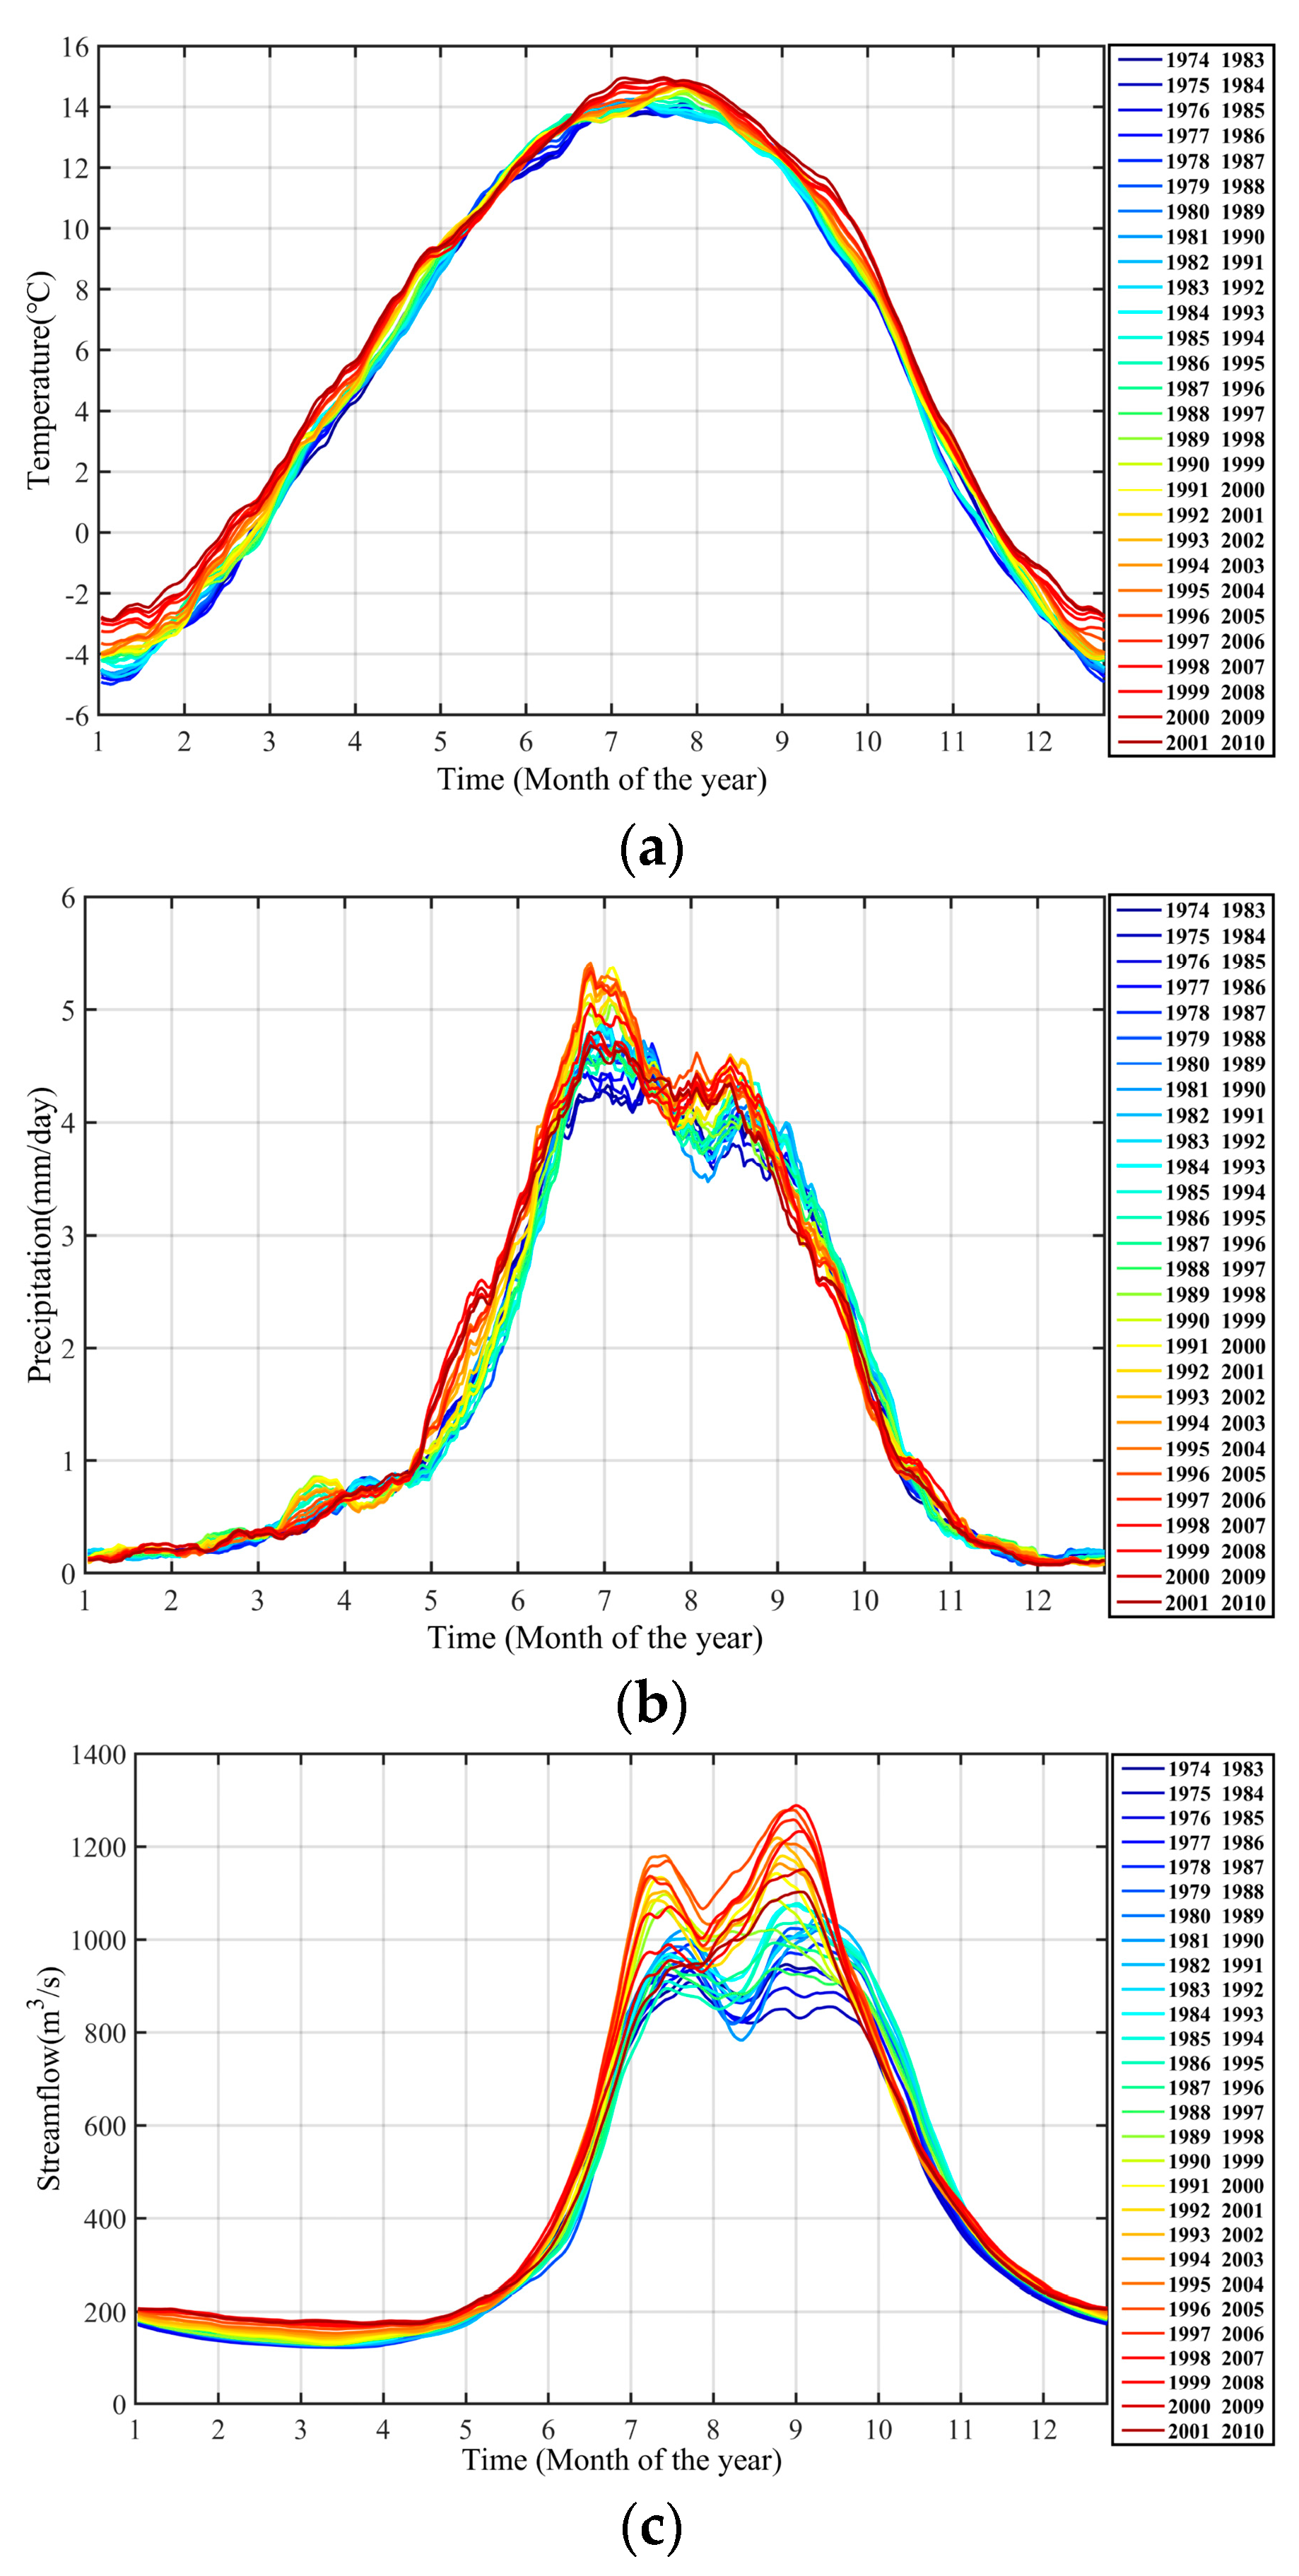
- The intra- and inter-annual variability of hydrometeorological time series and the duration of different hydrometeorological variables were obtained via analyses of the MASH results. The temperature, precipitation and streamflow from 1974 to 2010 showed increasing inter-annual variability most of the days over each year period. Compared with the 1970s and 1980s, the increase in streamflow from early July to early September of the 1990s was considerable. For precipitation, the increase in May, July and August of the 1990s was notable. The correlation coefficients between smoother hydrometeorological variables were generally larger than those between the original hydrometeorological variables, which indicated that the MASH method smoothed the data and eliminated the effects of periodic changes and random fluctuations in hydrometeorological time series. The regularity and trends of the hydrometeorological data could then be detected.
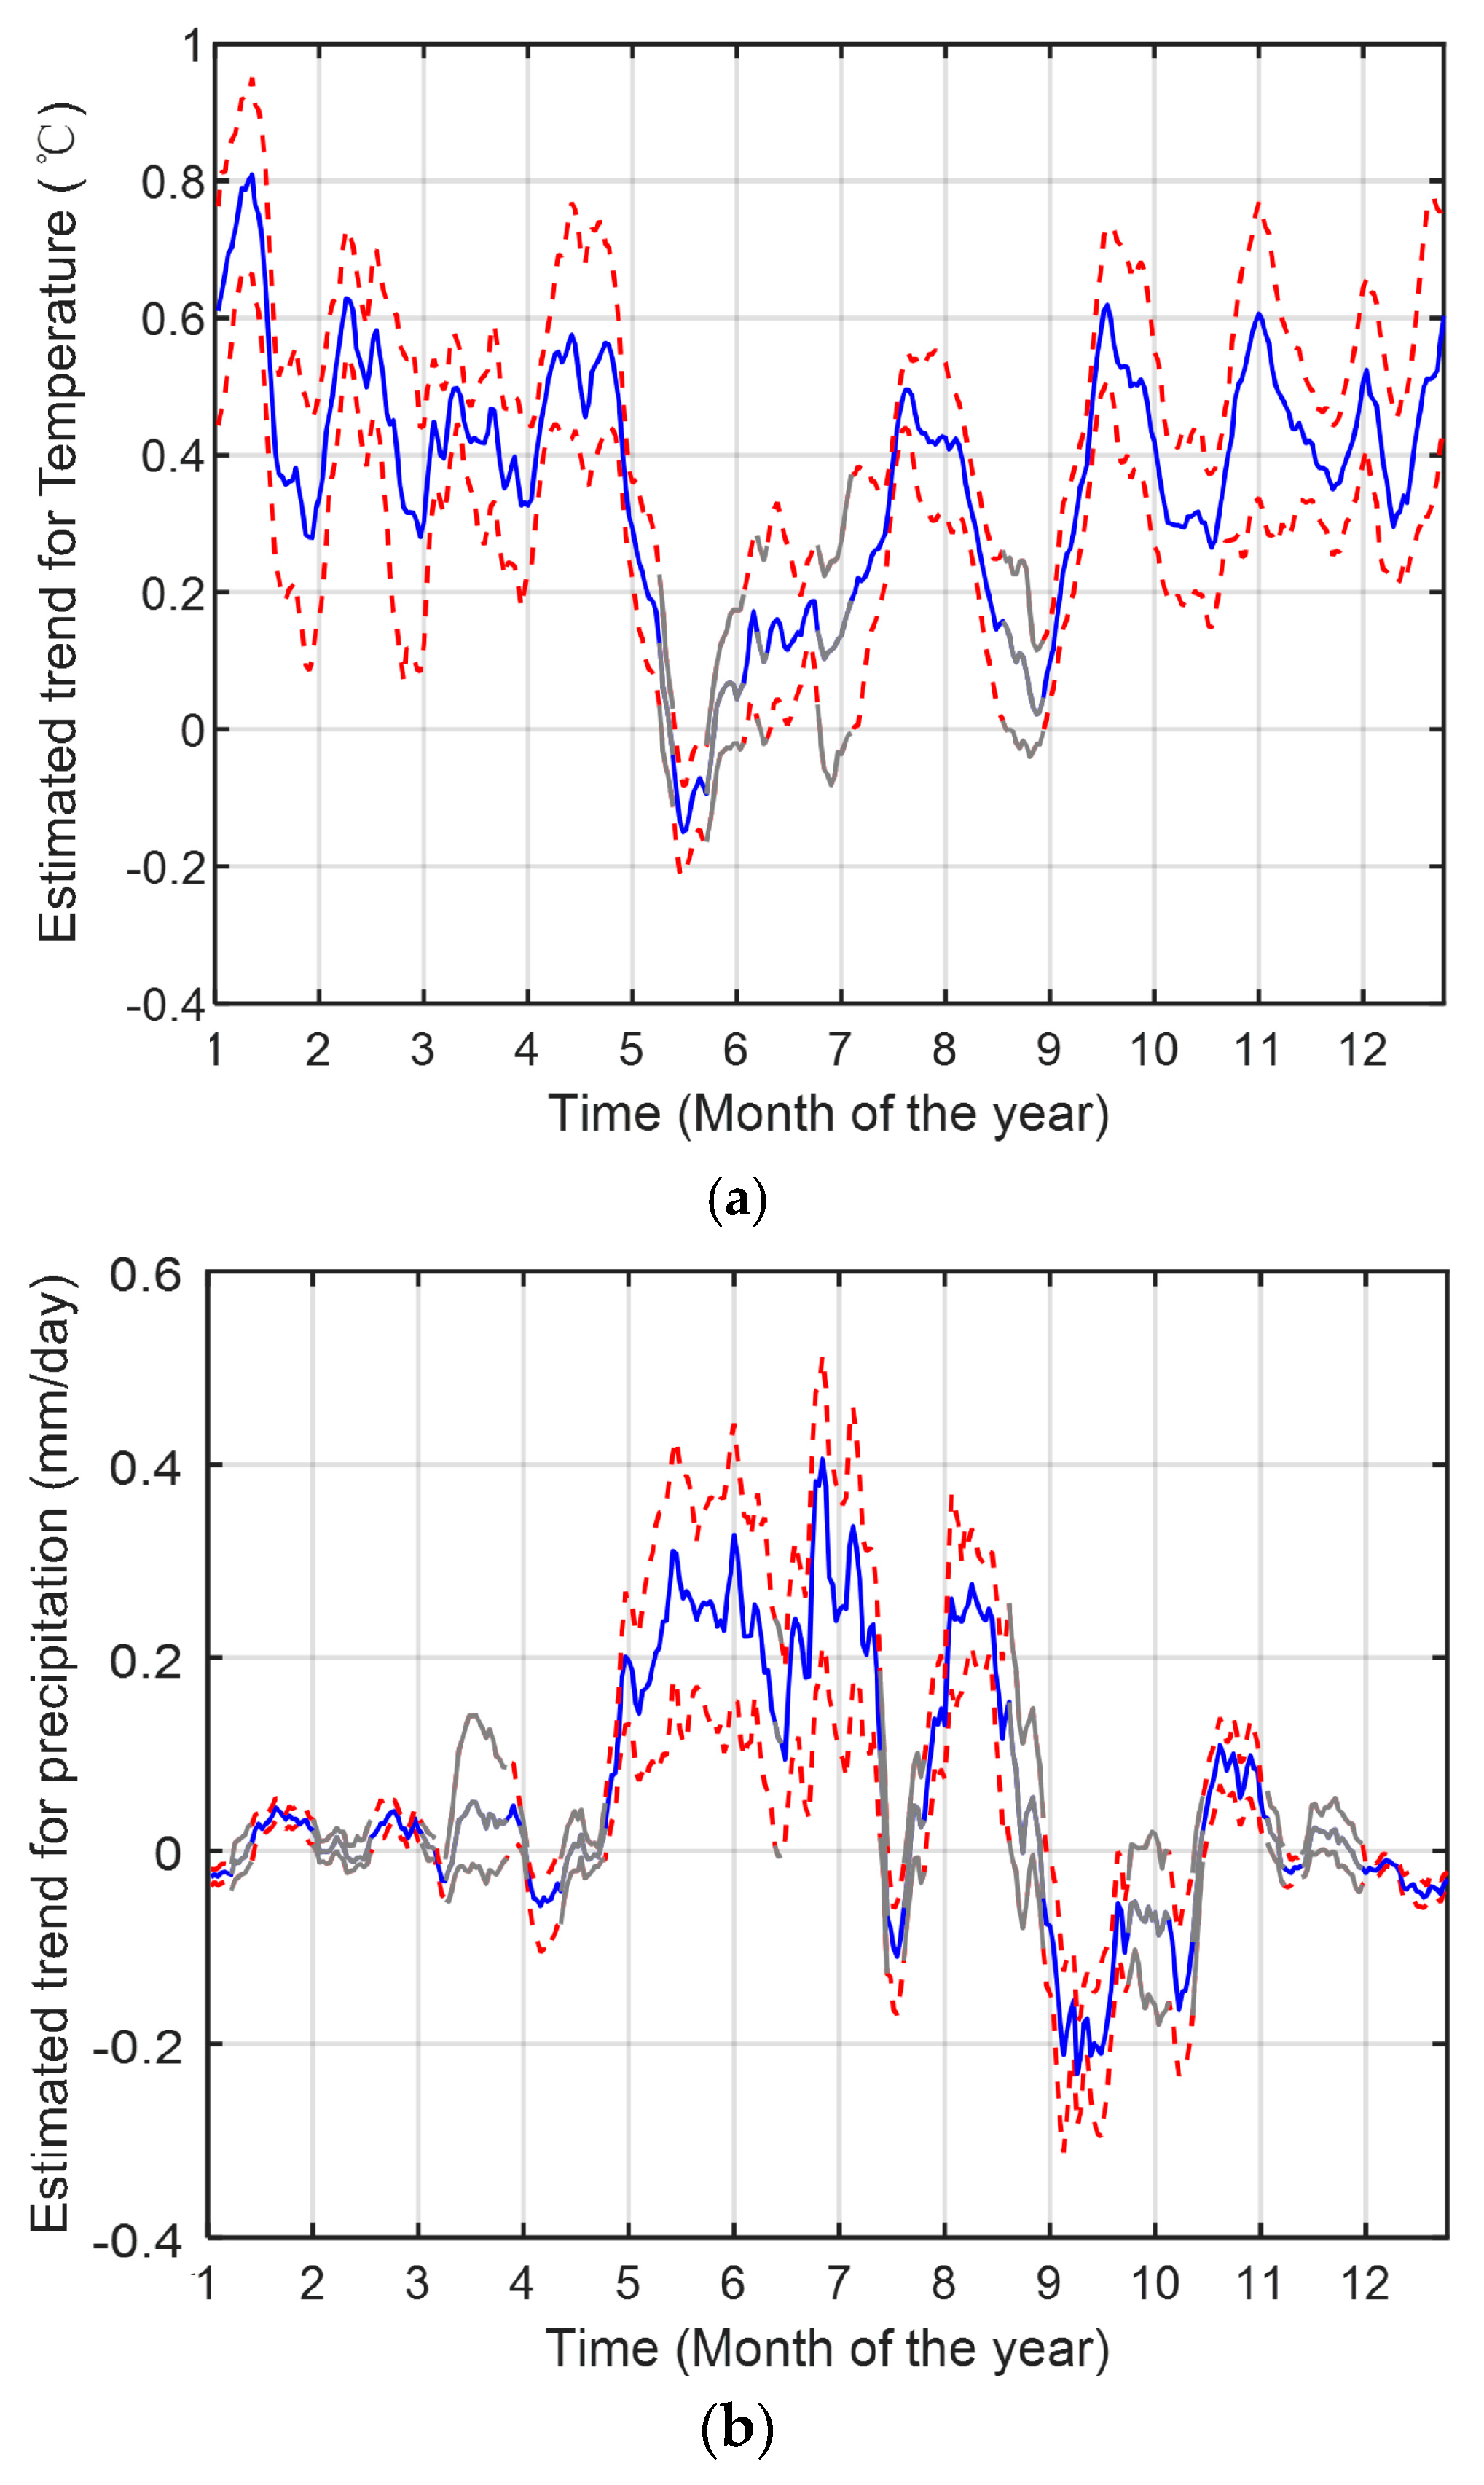
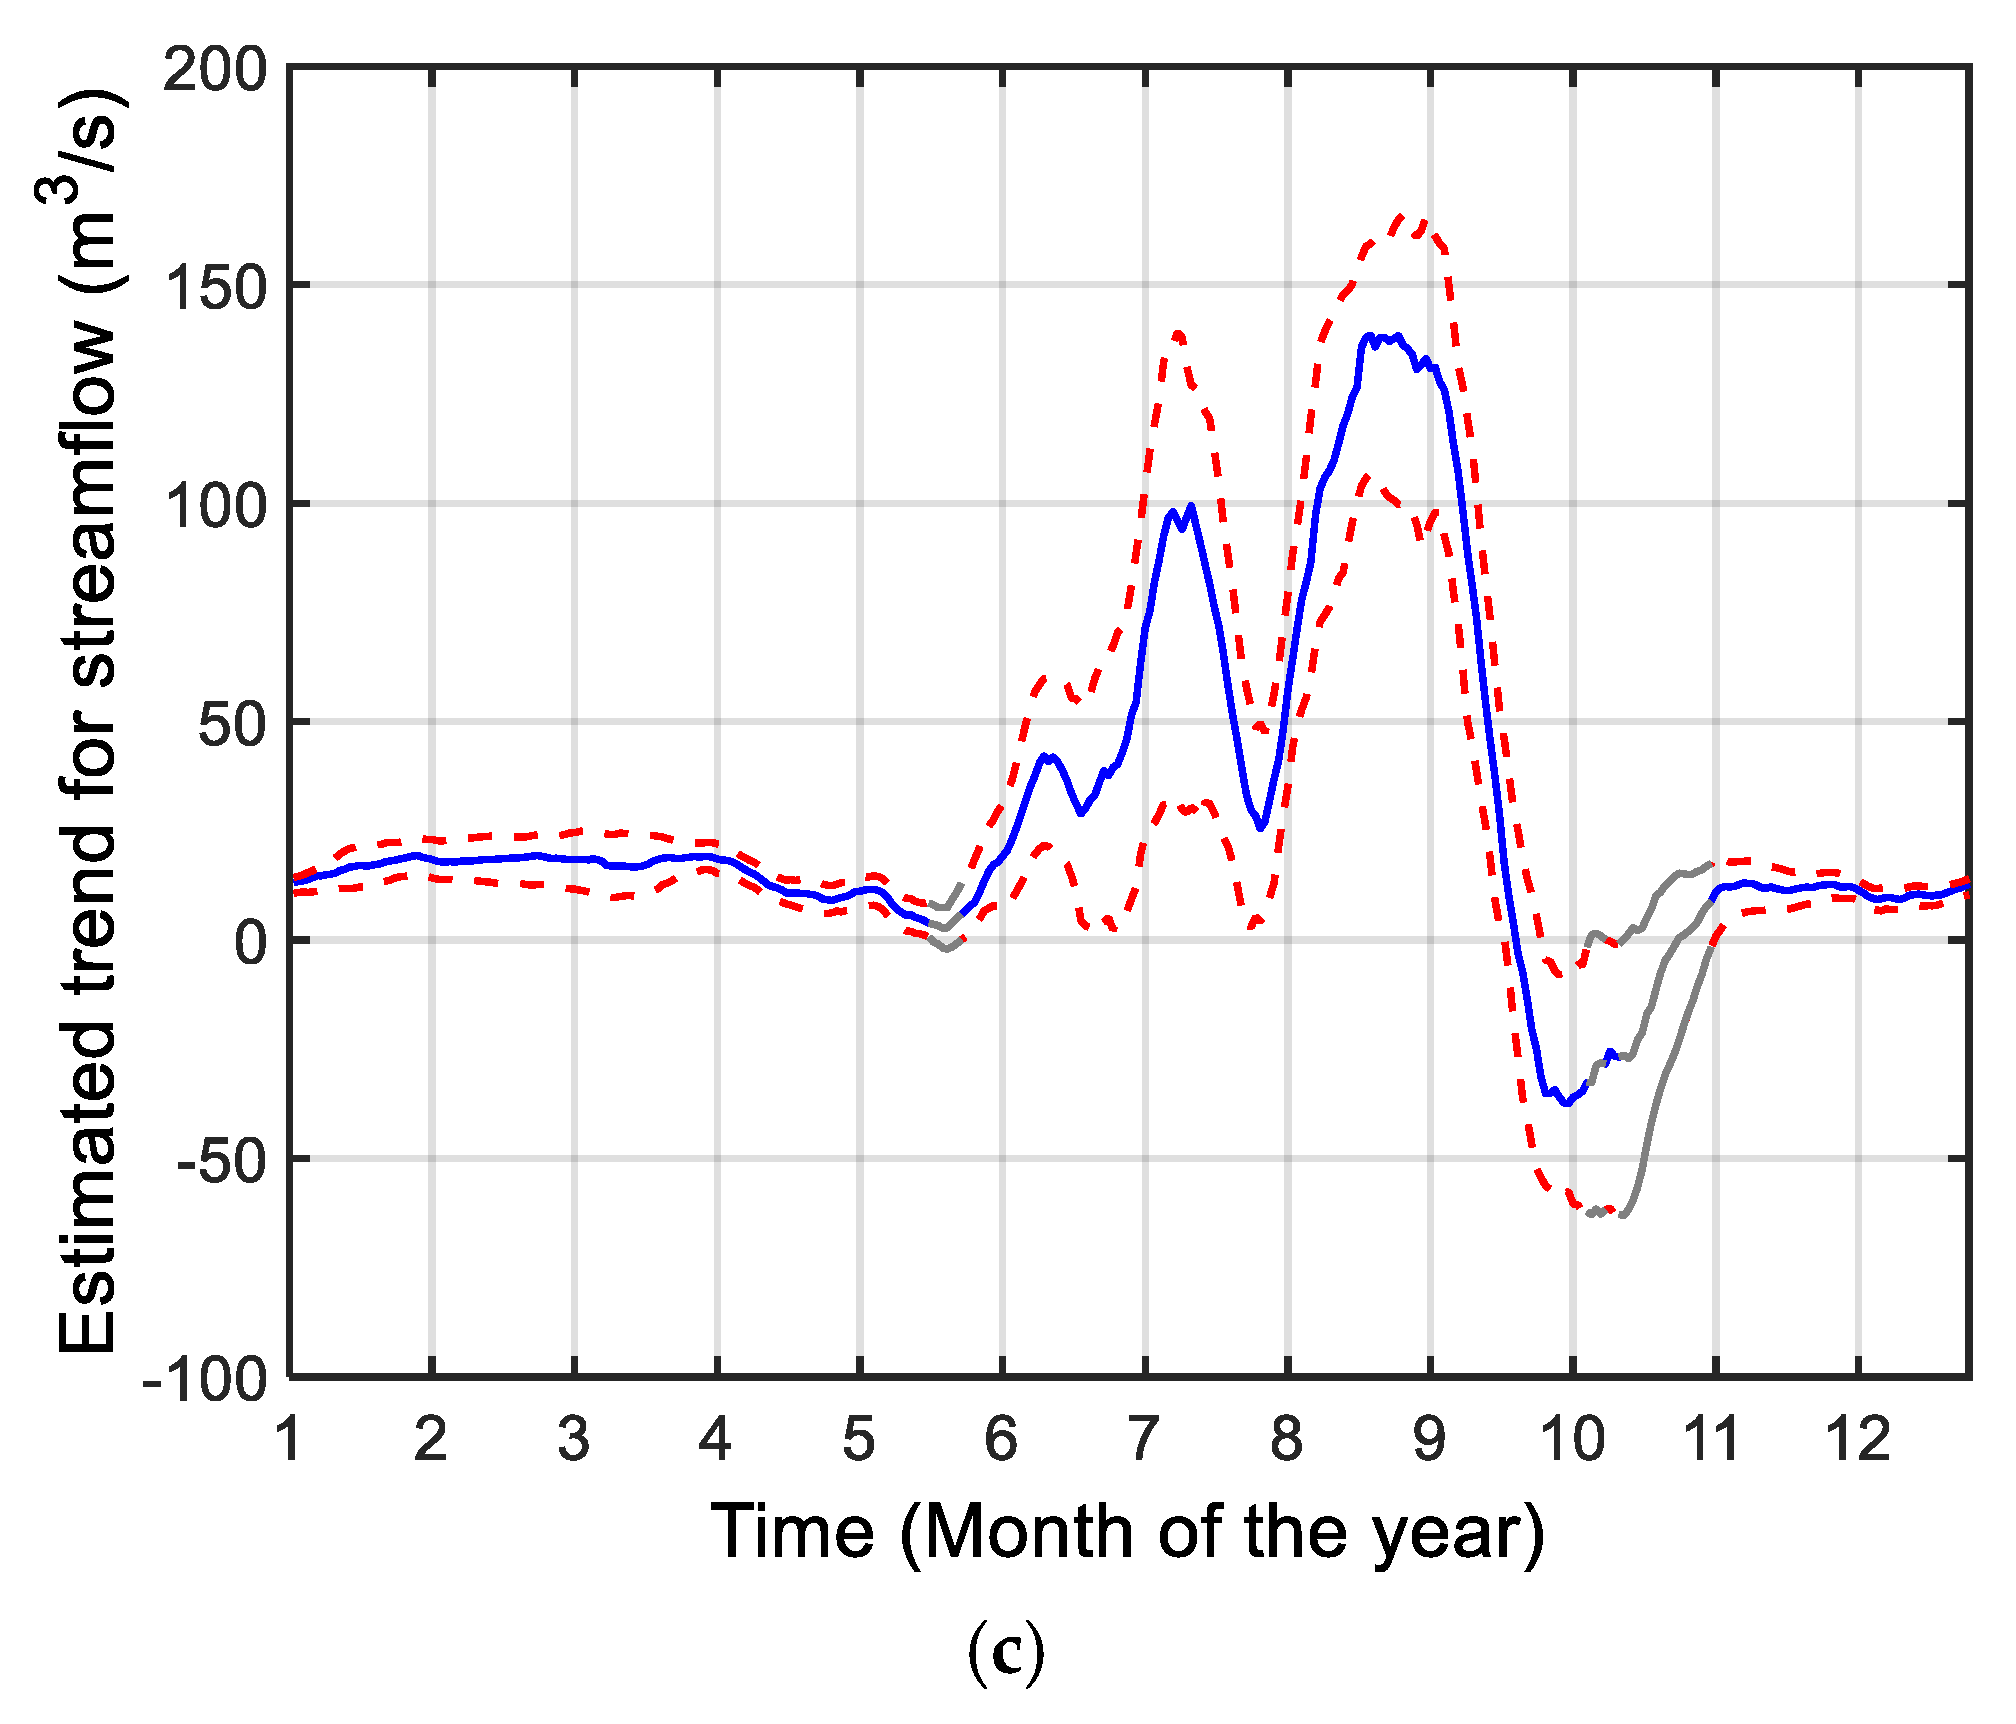
- The combination of the MASH with the MK test showed the largest estimated changes in temperature in early January, with a peak of 0.8 ℃. The highest estimated changes in precipitation were in late June, with a peak of 0.4 mm/day. The highest estimated changes in streamflow were in mid-August, with a peak of 138 m3/s.
- Sensitivity analysis of the smoothing parameters on was performed to increase the robustness of the estimated trends. For different Y values, the estimated trends were nearly the same throughout the year except when Y was set as 1 or 2. For different w values, the estimated trends were nearly the same throughout the year, except when w was set as 1. Due to the day-to-day variability of the smoothed time series, small w (1 to 6) values resulted in fluctuating trend results.
Author Contributions
Funding
Acknowledgments
Conflicts of Interest
References
- Adarsh, S.; Janga Reddy, M. Trend analysis of rainfall in four meteorological subdivisions of southern India using nonparametric methods and discrete wavelet transforms. Int. J. Climatol. 2015, 35, 1107–1124. [Google Scholar] [CrossRef]
- Senent-Aparicio, J.; Liu, S.; Pérez-Sánchez, J.; López-Ballesteros, A.; Jimeno-Sáez, P. Assessing Impacts of Climate Variability and Reforestation Activities on Water Resources in the Headwaters of the Segura River Basin (SE Spain). Sustainability 2018, 10, 3277. [Google Scholar] [CrossRef]
- Tian, P.; Zhou, J.; Chu, Z.; Na, S. Modeling and Combined Application of Orthogonal Chaotic NSGA-II and Improved TOPSIS to Optimize a Conceptual Hydrological Model. Water Resour. Manag. 2018, 32, 3781–3799. [Google Scholar]
- Li, F.; Zhang, G.; Xu, Y.J. Spatiotemporal variability of climate and streamflow in the Songhua River Basin, northeast China. J. Hydrol. 2014, 514, 53–64. [Google Scholar] [CrossRef]
- Zhang, Y.; You, Q.; Lin, H.; Chen, C. Analysis of dry/wet conditions in the Gan River Basin, China, and their association with large-scale atmospheric circulation. Glob. Planet. Chang. 2015, 133, 309–317. [Google Scholar] [CrossRef]
- Zhang, C.; Peng, T.; Li, C.; Fu, W.; Xia, X.; Xue, X. Multiobjective Optimization of a Fractional-Order PID Controller for Pumped Turbine Governing System Using an Improved NSGA-III Algorithm under Multiworking Conditions. Complexity 2019, 2019, 1–18. [Google Scholar] [CrossRef]
- Zhang, C.; Li, C.; Peng, T.; Xia, X.; Xue, X.; Fu, W.; Zhou, J. Modeling and Synchronous Optimization of Pump Turbine Governing System Using Sparse Robust Least Squares Support Vector Machine and Hybrid Backtracking Search Algorithm. Energies 2018, 11, 3108. [Google Scholar] [CrossRef]
- Stocker, T.F.; Qin, D.; Plattner, G.-K.; Tignor, M.M.; Allen, S.K.; Boschung, J.; Nauels, A.; Xia, Y.; Bex, V.; Midgley, P.M. IPCC, 2013: Climate Change 2013: The physical science basis. contribution of working group I to the fifth assessment report of IPCC the intergovernmental panel on climate change; Cambridge University Press: Cambridge, UK, 2014. [Google Scholar]
- Xu, L.; Shi, Z.; Wang, Y.; Zhang, S.; Chu, X.; Yu, P.; Xiong, W.; Zuo, H.; Wang, Y. Spatiotemporal variation and driving forces of reference evapotranspiration in Jing River Basin, northwest China. Hydrol. Process. 2015, 29, 4846–4862. [Google Scholar] [CrossRef]
- Feng, X.; Cheng, W.; Fu, B.; Lü, Y. The role of climatic and anthropogenic stresses on long-term runoff reduction from the Loess Plateau, China. Sci. Total Environ. 2016, 571, 688–698. [Google Scholar] [CrossRef]
- Nilsson, C.; Reidy, C.A.; Dynesius, M.; Revenga, C. Fragmentation and flow regulation of the world’s large river systems. Science 2005, 308, 405. [Google Scholar] [CrossRef]
- Tukey, J.W. EDA: Exploratory data analysis; Addison-Wesley: Reading, MA, USA, 1977. [Google Scholar]
- Anghileri, D.; Pianosi, F.; Soncini-Sessa, R. Trend detection in seasonal data: from hydrology to water resources. J. Hydrol. 2014, 511, 171–179. [Google Scholar] [CrossRef]
- Pandey, B.K.; Khare, D. Identification of trend in long term precipitation and reference evapotranspiration over Narmada river basin (India). Glob. Planet. Chang. 2018, 161, 172–182. [Google Scholar] [CrossRef]
- Pavlić, K.; Parlov, J. Cross-Correlation and Cross-Spectral Analysis of the Hydrographs in the Northern Part of the Dinaric Karst of Croatia. Geosciences 2019, 9, 86. [Google Scholar] [CrossRef]
- Mengistu, D.; Bewket, W.; Lal, R. Recent spatiotemporal temperature and rainfall variability and trends over the Upper Blue Nile River Basin, Ethiopia. Int. J. Climatol. 2014, 34, 2278–2292. [Google Scholar] [CrossRef]
- Feidas, H. Trend analysis of air temperature time series in Greece and their relationship with circulation using surface and satellite data: Recent trends and an update to 2013. Theor. Appl. Climatol. 2017, 129, 1383–1406. [Google Scholar] [CrossRef]
- Pavlić, K.; Kovač, Z.; Jurlina, T. Trend analysis of mean and high flows in response to climate warming-Evidence from karstic catchments in Croatia. Geofizika 2017, 34, 157–174. [Google Scholar] [CrossRef]
- Mahmood, R.; Jia, S. Assessment of hydro-climatic trends and causes of dramatically declining stream flow to Lake Chad, Africa, using a hydrological approach. Sci. Total Environ. 2019, 675, 122–140. [Google Scholar] [CrossRef]
- Gocic, M.; Trajkovic, S. Analysis of changes in meteorological variables using Mann-Kendall and Sen’s slope estimator statistical tests in Serbia. Glob. Planet. Chang. 2013, 100, 172–182. [Google Scholar] [CrossRef]
- Li, F.; Zhang, G.; Xu, Y.J. Separating the Impacts of Climate Variation and Human Activities on Runoff in the Songhua River Basin, Northeast China. Water 2014, 6, 3320–3338. [Google Scholar] [CrossRef] [Green Version]
- Pandey, B.K.; Tiwari, H.; Khare, D. Trend analysis using discrete wavelet transform (DWT) for long-term precipitation (1851–2006) over India. Hydrol. Sci. J. 2017, 62, 2187–2208. [Google Scholar] [CrossRef]
- Sang, Y.-F.; Wang, Z.; Liu, C. Comparison of the MK test and EMD method for trend identification in hydrological time series. J. Hydrol. 2014, 510, 293–298. [Google Scholar] [CrossRef]
- Jukić, D.; Denić-Jukić, V. Partial spectral analysis of hydrological time series. J. Hydrol. 2011, 400, 223–233. [Google Scholar] [CrossRef]
- Jukić, D.; Denić-Jukić, V. Investigating relationships between rainfall and karst-spring discharge by higher-order partial correlation functions. J. Hydrol. 2015, 530, 24–36. [Google Scholar] [CrossRef]
- Fu, W.; Wang, K.; Zhou, J.; Xu, Y.; Tan, J.; Chen, T. A Hybrid Approach for Multi-Step Wind Speed Forecasting Based on Multi-Scale Dominant Ingredient Chaotic Analysis, KELM and Synchronous Optimization Strategy. Sustainability 2019, 11, 1804. [Google Scholar] [CrossRef]
- Fu, W.; Wang, K.; Li, C.; Tan, J. Multi-step short-term wind speed forecasting approach based on multi-scale dominant ingredient chaotic analysis, improved hybrid GWO-SCA optimization and ELM. Energy Convers. Manag. 2019, 187, 356–377. [Google Scholar] [CrossRef]
- Araghi, A.; Baygi, M.M.; Adamowski, J.; Malard, J.; Nalley, D.; Hasheminia, S.M. Using wavelet transforms to estimate surface temperature trends and dominant periodicities in Iran based on gridded reanalysis data. Atmos. Res. 2015, 155, 52–72. [Google Scholar] [CrossRef]
- Huang, N.E.; Shen, Z.; Long, S.R.; Wu, M.C.; Shih, H.H.; Zheng, Q.; Yen, N.-C.; Tung, C.C.; Liu, H.H. The empirical mode decomposition and the Hilbert spectrum for nonlinear and non-stationary time series analysis. Proc. R. Soc. Lond. Ser. A Math. Phys. Eng. Sci. 1998, 454, 903–995. [Google Scholar] [CrossRef]
- Zhang, C.; Zhou, J.; Li, C.; Fu, W.; Peng, T. A compound structure of ELM based on feature selection and parameter optimization using hybrid backtracking search algorithm for wind speed forecasting. Energy Convers. Manag. 2017, 143, 360–376. [Google Scholar] [CrossRef]
- Zhang, Q.; Singh, V.P.; Li, K.; Li, J. Trend, periodicity and abrupt change in streamflow of the East River, the Pearl River basin. Hydrol. Process. 2014, 28, 305–314. [Google Scholar] [CrossRef]
- Peng, T.; Zhou, J.; Zhang, C.; Zheng, Y. Multi-step ahead wind speed forecasting using a hybrid model based on two-stage decomposition technique and AdaBoost-extreme learning machine. Energy Convers. Manag. 2017, 153, 589–602. [Google Scholar] [CrossRef]
- Wang, W.C.; Chau, K.W.; Qiu, L.; Chen, Y.B. Improving forecasting accuracy of medium and long-term runoff using artificial neural network based on EEMD decomposition. Environ. Res. 2015, 139, 46. [Google Scholar] [CrossRef] [PubMed]
- Smith, R.L. Extreme value analysis of environmental time series: an application to trend detection in ground-level ozone. Stat. Sci. 1989, 4, 367–377. [Google Scholar] [CrossRef]
- Kousari, M.R.; Ahani, H.; Hendi-zadeh, R. Temporal and spatial trend detection of maximum air temperature in Iran during 1960–2005. Glob. Planet. Chang. 2013, 111, 97–110. [Google Scholar] [CrossRef]
- Osuch, M.; Wawrzyniak, T. Inter- and intra-annual changes in air temperature and precipitation in western Spitsbergen. Int. J. Climatol. 2016, 37, 3082–3097. [Google Scholar] [CrossRef]
- Osuch, M.; Wawrzyniak, T. Variations and changes in snow depth at meteorological stations Barentsburg and Hornsund (Spitsbergen). Ann. Glaciol. 2017, 58, 11–20. [Google Scholar] [CrossRef] [Green Version]
- Horn, P. Introduction to Robust Estimation and Hypothesis Testing. Technometrics 2012, 40, 77–78. [Google Scholar] [CrossRef]
- Mann, H.B. Nonparametric Tests Against Trend. Econometrica 1945, 13, 245–259. [Google Scholar] [CrossRef]
- Kendall, M. Rank Correlation Methods; Charles Griffin & Company Ltd.: London/High Wycombe, UK, 1975. [Google Scholar]
- Tan, M.L.; Chua, V.P.; Li, C.; Brindha, K. Spatiotemporal analysis of hydro-meteorological drought in the Johor River Basin, Malaysia. Theor. Appl. Climatol. 2019, 135, 825–837. [Google Scholar] [CrossRef]
- Sen, P.K. Estimates of the regression coefficient based on Kendall’s tau. J. Am. Stat. Assoc. 1968, 63, 1379–1389. [Google Scholar] [CrossRef]
- Tayyab, M.; Zhou, J.; Zeng, X.; Adnan, R. Discharge forecasting by applying artificial neural networks at the Jinsha river basin, China. Eur. Sci. J. ESJ 2016, 12, 108–127. [Google Scholar] [CrossRef]
- Peng, T.; Zhou, J.; Zhang, C.; Fu, W. Streamflow Forecasting Using Empirical Wavelet Transform and Artificial Neural Networks. Water 2017, 9, 406. [Google Scholar] [CrossRef]
- Zhou, J.; Peng, T.; Zhang, C.; Sun, N. Data Pre-Analysis and Ensemble of Various Artificial Neural Networks for Monthly Streamflow Forecasting. Water 2018, 10, 628. [Google Scholar] [CrossRef]
- Hairong, Z.; Jianzhong, Z.; Xiaofan, Z.; Yi, L.; Jun, G. Application of One-way coupled Hydro-meteorological Model in the Jinshajiang River Basin, China. In Proceedings of the 2nd International Conference on Architectural, Civil and Hydraulics Engineering (ICACHE 2016), Kunming, China, 29–30 September 2016. [Google Scholar]
- Zhou, J.; Zhang, H.; Zhang, J.; Zeng, X.; Ye, L.; Liu, Y.; Tayyab, M.; Chen, Y. WRF model for precipitation simulation and its application in real-time flood forecasting in the Jinshajiang River Basin, China. Meteorol. Atmos. Phys. 2018, 130, 635–647. [Google Scholar] [CrossRef]
- Zhang, Q.; Xu, C.-Y.; Zhang, Z.; Chen, Y.D.; Liu, C.-l.; Lin, H. Spatial and temporal variability of precipitation maxima during 1960–2005 in the Yangtze River basin and possible association with large-scale circulation. J. Hydrol. 2008, 353, 215–227. [Google Scholar] [CrossRef]
- Tayyab, M.; Zhou, J.; Dong, X.; Ahmad, I.; Sun, N. Rainfall-runoff modeling at Jinsha River basin by integrated neural network with discrete wavelet transform. Meteorol. Atmos. Phys. 2019, 131, 115–125. [Google Scholar] [CrossRef]
- Yin, H.; Changan, L.I. Human impact on floods and flood disasters on the Yangtze River. Geomorphology 2001, 41, 105–109. [Google Scholar] [CrossRef]
- Fluixá-Sanmartín, J.; Deng, P.; Fischer, L.; Orlowsky, B.; García-Hernández, J.; Jordan, F.; Haemmig, C.; Zhang, F.; Xu, J. Searching for the optimal drought index and timescale combination to detect drought: A case study from the lower Jinsha River basin, China. Hydrol. Earth Syst. Sci. Discuss. 2018, 22, 1–30. [Google Scholar] [CrossRef]


| Time Scale | Temperature | Precipitation | Streamflow | ||||||
|---|---|---|---|---|---|---|---|---|---|
| S | Z | b | S | Z | b | S | Z | b | |
| Year | 338 | 4.408 | 0.035 * | 124 | 1.609 | 0.004 | 114 | 1.478 | 1.500 |
| January | 246 | 3.204 | 0.063 * | 78 | 1.007 | 0.001 | 298 | 3.884 | 1.640 * |
| February | 134 | 1.739 | 0.044 | 36 | 0.458 | 0.001 | 288 | 3.754 | 1.526 * |
| March | 218 | 2.838 | 0.040 * | 12 | 0.144 | 0.001 | 328 | 4.277 | 1.522 * |
| April | 248 | 3.230 | 0.033 * | −24 | −0.301 | −0.001 | 151 | 1.962 | 0.749 * |
| May | 174 | 2.263 | 0.024 * | 104 | 1.347 | 0.012 | 56 | 0.719 | 0.494 |
| June | 160 | 2.080 | 0.022 * | 22 | 0.275 | 0.004 | −8 | −0.092 | −0.124 |
| July | 282 | 3.675 | 0.039 * | 88 | 1.138 | 0.012 | 12 | 0.144 | 0.716 |
| August | 228 | 2.969 | 0.030 * | 80 | 1.033 | 0.012 | 74 | 0.955 | 4.232 |
| September | 236 | 3.074 | 0.043 * | −128 | −1.661 | −0.014 | 60 | 0.772 | 3.778 |
| October | 134 | 1.739 | 0.027 | 64 | 0.824 | 0.007 | −44 | −0.562 | −1.808 |
| November | 166 | 2.158 | 0.026 * | 2 | 0.013 | 0.000 | 48 | 0.615 | 0.625 |
| December | 218 | 2.838 | 0.041* | −64 | −0.824 | −0.001 | 62 | 0.798 | 0.448 |
| Time Scale | Year | Jan. | Feb. | Mar. | Apr. | May. | Jun. | Jul. | Aug. | Sep. | Oct. | Nov. | Dec. |
|---|---|---|---|---|---|---|---|---|---|---|---|---|---|
| Smoothed series | streamflow vs. precipitation | ||||||||||||
| 0.98 | 0.65 | 0.42 | 0.16 | −0.15 | 0.89 | 0.93 | 0.92 | 0.90 | −0.30 | 0.79 | 0.19 | −0.82 | |
| streamflow vs. temperature | |||||||||||||
| 0.85 | 0.90 | 0.95 | 0.93 | 0.92 | −0.08 | −0.08 | 0.55 | 0.69 | 0.51 | −0.52 | 0.34 | 0.86 | |
| Original series | streamflow vs. precipitation | ||||||||||||
| 0.87 | 0.11 | −0.03 | 0.15 | 0.21 | 0.47 | 0.72 | 0.56 | 0.72 | 0.38 | 0.33 | −0.03 | 0.07 | |
| streamflow vs. temperature | |||||||||||||
| 0.14 | 0.49 | 0.41 | 0.14 | 0.30 | −0.21 | −0.29 | −0.19 | −0.25 | −0.14 | −0.28 | 0.09 | 0.04 | |
© 2019 by the authors. Licensee MDPI, Basel, Switzerland. This article is an open access article distributed under the terms and conditions of the Creative Commons Attribution (CC BY) license (http://creativecommons.org/licenses/by/4.0/).
Share and Cite
Peng, T.; Zhang, C.; Zhou, J. Intra- and Inter-Annual Variability of Hydrometeorological Variables in the Jinsha River Basin, Southwest China. Sustainability 2019, 11, 5142. https://doi.org/10.3390/su11195142
Peng T, Zhang C, Zhou J. Intra- and Inter-Annual Variability of Hydrometeorological Variables in the Jinsha River Basin, Southwest China. Sustainability. 2019; 11(19):5142. https://doi.org/10.3390/su11195142
Chicago/Turabian StylePeng, Tian, Chu Zhang, and Jianzhong Zhou. 2019. "Intra- and Inter-Annual Variability of Hydrometeorological Variables in the Jinsha River Basin, Southwest China" Sustainability 11, no. 19: 5142. https://doi.org/10.3390/su11195142
APA StylePeng, T., Zhang, C., & Zhou, J. (2019). Intra- and Inter-Annual Variability of Hydrometeorological Variables in the Jinsha River Basin, Southwest China. Sustainability, 11(19), 5142. https://doi.org/10.3390/su11195142


