Abstract
Long-term water balance (WB) of four selected crops (winter wheat, oilseed rape, silage maize, semi-early potatoes) was determined at the field block scale in the Czech Republic for all agricultural growing areas (AGAs): maize-, beet-, potato- and mountain-AGAs for the 1981–2010 period. A novel approach for the calculation of WB was employed, which combined the FAO-56 method for crop water requirements (CWRs) with sources of available water from precipitation, soil, and groundwater. The computed WB was divided into four categories of soil water availability based on soil hydrolimits and crop features: Categories 1 and 2 with zero or mild occurrence of crop water stress; categories 3 and 4 with intermediate and severe occurrence of crop water stress. The winter crops were affected by water stress to a lesser extent (the area of categories 3 and 4: wheat 20.1%, oilseed rape 14.5%) as compared with spring crops (the area of categories 3 and 4: maize 39.6%, potatoes 41%). The highest water deficit was recorded for all crops in the maize-AGA due to low precipitation and high CWRs. Most available water was revealed to occur in the mountain-AGA. A strong need for the adoption of measures towards the optimization of water regimes on agricultural land was indicated. The present study shows a promising approach for evaluating and proposing changes of area of cultivated crops with the appropriate tillage and agricultural water management in terms of satisfactory crop water requirements.
1. Introduction
Crop production is affected not only by agronomic practices, and soil and terrain conditions, but further by climate change which has taken place in Europe since the 1970s [1,2,3] accompanied by an increased crop water deficit [4,5]. In temperate humid regions of Central Europe, climate change is generally manifested by the increasing intensity of solar radiation, air temperature and evapotranspiration. Likewise, a shift of precipitation pattern towards torrential rains as well as the occurrence of more distinct drought periods in the spring and summer has been documented [6,7,8,9], even though the overall annual amount of precipitation does not practically change. Thus, the water runoff from the landscape, as well as land aridity, are anticipated to increase, which may diminish the water availability for crops during the growing period. In addition, earlier sowing dates and the shortening of crop phenological phases connected with climate change provide less time for carbon fixation and biomass accumulation [10].
On the other hand, the climate change also brings the potential for increasing plant production by the enhanced concentration of carbon dioxide (CO2) and by an increased intensity of solar radiation with a positive impact on the intensity of photosynthesis and the crop water use efficiency (WUE) [11,12,13]. As a consequence of the increased air temperature as well as the CO2 concentration and a shorter growing period, some climate simulation studies forecast, on the contrary, by mid or by the end of 21st century, an unaltered or even a decreased crop water requirement (CWR) when maintaining the yields or, a parallel increase in CWR and yields [5,14,15].
Climate changes were also noticed in the Czech Republic (CZ) by comparing two climatological standard normals (1961–1990 and 1981–2010). The mean annual air temperature in CZ for 1981–2010 was found to be by 0.4 °C higher compared to 1961–1990. The highest increase in the mean air temperature was recorded in July and August when the value increased by 0.9 °C. The mean annual sum of precipitation for 1981–2010 increased only by 2% compared to 1961–1990. However, monthly mean precipitation values in 1981–2010 increased significantly in the months of March, July and September by 20, 11, and 12%, respectively, but decreased in April and June by 11%, compared to 1961–1990 [16,17].
When the soil water availability for crops is insufficient, a deficit of the water balance (WB) is manifested and the WB becomes negative. Even if the WB is equalled (zero) during the growing period, the CWR does not have to be necessarily well met due to an unequal temporal distribution of water sources [18]. The decrease of water availability for crop cultivation increases the need for efficient management of agricultural land towards the optimization of the soil water balance by a proper tillage, drought-resistant crop rotation or effective irrigation management [19,20].
A globally applied approach for determining CWR is the crop evapotranspiration (ETc) calculated by the FAO-56 Penman-Monteith method [21], which multiplies the reference evapotranspiration (ET0) by the crop coefficient (Kc), when the Kc is tabulated according to the phenological development of the particular crop. The Kc values are related to non-stressed crops cultivated under excellent agronomic and water management conditions achieving maximum crop yield. Nowadays, it is possible to use earth observation (EO) approaches for the estimation of soil moisture and crop water demands [22]. Briefly, the EO methods enable one to deduce Kc based on the normalized difference vegetation index (NDVI) determined by remote sensing (satellite, manned or unmanned aerial photography), which allows for the quick and real-time estimation of the actual crop spatio-temporal heterogeneity as well as the anticipated yield [23].
However, in CZ, the FAO-56 approach has been rarely applied to date [24]. The first attempt was made by a software IRRIPROG [25] in Czech only, which combined the measured or estimated soil water content (soil moisture and soil water potential), ET0, the Kc, site information (area, altitude, slope) and soil hydrological characteristics, derived from pedotransfer functions [26]. Apart from this, in CZ, there exists a Czech technical standard No. 75 0434 (CTS Prague; ČSN in Czech) for crop supplemental irrigation requirements, which has an updated module of pedotransfer functions and an enhanced integration of meteorological data, and still uses fixed CWR values obtained from field trials conducted from the 1950s to 1970s [27].
The aim of this work was to assess a long-term water balance at a field block scale for selected field crops (winter wheat, semi-early potatoes, silage maize, oilseed rape) for the current climatological standard normal (1981–2010), which was further categorized according to soil water availability in specific agricultural growing areas. To do so, a novel coupled approach was employed, which combined the FAO-56 method with the soil water balance. Further objectives were to compare the newly derived ETc values with the CTS values and to discuss the possible options for the optimisation of soil water regimes on agricultural land.
2. Data and Methods
2.1. Description of Agricultural Growing Areas
In CZ, the soil-climate conditions for crop production are classified area-wise using agricultural growing areas (AGAs). From 2003, four AGAs in CZ have been defined: maize-AGA (MGA), beet-AGA (BGA), potato-AGA (PGA) and mountain-AGA (MoGA) and 11 sub-areas [28]. The AGAs are delineated based on natural characteristics (i.e., altitude, average climate parameters, and soil characteristics), as shown in Table 1.

Table 1.
Air temperature normal, mean annual sum of precipitation and reference evapotranspiration (ET0) for the 1981–2010 period, the available water capacity (AWC), the mean altitude and slope of individual agricultural growing areas (AGAs): maize-GA (MGA), beet-GA (BGA), potato-GA (PGA) and mountain-GA (MoGA).
2.2. Components of Water Balance Equation
To calculate the WB for the four selected crops in this study, available water sources (precipitation, soil water supply, capillary rise from the groundwater) were compared to CWR on all field blocks with an area >0.5 ha and with the information on soil texture class. It meant that a total of 479,645 field blocks were taken into account from the Land-Parcel Identification System (LPIS), a regularly updated whole-CZ database. The average area of a field block was 7.4 hectares.
The WB was computed for the overall growing period, i.e., the intraseasonal dynamics of the individual components of the WB was not evaluated. The meteorological data needed to establish the WB (ET0, air temperature, sum of precipitation) were based on the daily means of the current climate normal from the 1981–2010 period, taken from 90 weather stations run by the Czech Hydrometeorological Institute (Figure 1). The daily mean meteorological values for individual years were not available. Thus, it was not possible to compute the WB for the individual years, neither to evaluate the changes between the beginning and the end of the evaluated period.
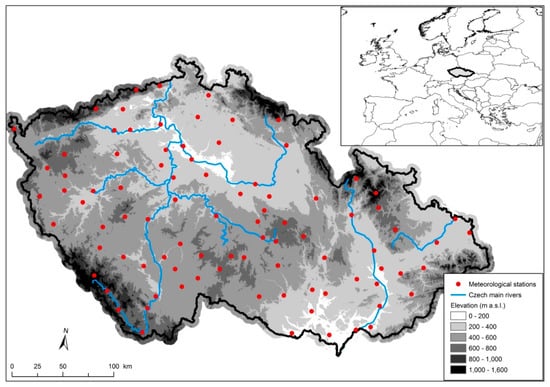
Figure 1.
Meteorological stations used for calculations of water balance for the 1981–2010 period.
To compute the WB, the following Equation (1) was used. The equation is based on a method for a crop supplemental irrigation requirement according to ČSN 75 0434 [27] with a modification for the r1 and α coeffcients and AARG (details given below). The equation was as follows:
where:
WB = r1·α·PN + r2·ASWS + AARG − CWR
| WB | water balance of the growing period [mm], |
| r1 | reduction coefficient for adjusting α for the terrain slope > 10%, |
| α | coefficient of precipitation exploitability depending on the soil type, |
| PN | precipitation normal of the growing period [mm], |
| r2 | reduction coefficient for adjusting ASWS depending on the soil type and terrain slope, |
| ASWS | available soil water supply at the beginning of the growing period (after winter period) [mm], |
| AARG | available amount of rising groundwater for the growing period [mm], |
| CWR | crop water requirement [mm]. |
Precipitation normal (PN) for the growing period was multiplied by the coefficient of precipitation exploitability α, which expresses the process of water infiltration as related to soil types (sandy = 0.60, loamy sands = 0.65, sandy loams = 0.70, loamy = 0.75, clay loams = 0.70, clayey = 0.60, very heavy, i.e., clay = 0.50) and the slope. The soil types (texture classes) were determined from the complex soil survey (CSS), which took place in the former Czechoslovakia from 1960 to 1972 on the whole agricultural land, when more than 380,000 soil probes had been processed during that survey. Despite of a considerable time lag (~50 years), the data from CSS (now available in digital form) are still used as the most precise source of soil texture classes. The later Czech whole country soil evaluation survey following CSS, which derived five-digit codes of the so-called valuated soil ecological units, does not allow such precise soil type determination.
The coefficient α on parcels with the slope >10% reduced using the coefficient r1 = 0.80 [25], which was considered suitable in relation to the low mean daily precipitation ranging from 0 to 4.9 mm. There was no reduction of the coefficient α on parcels with the slope <10%, i.e., r1 = 1. It is assumed that this amendment better reflects the process of water infiltration and water exploitability for crops as compared to ČSN 75 0434 [27], where the reduction of the coefficient α depends just on the altitude.
The available soil water supply (ASWS) at the beginning of the growing period is dependent on the soil type and on the maximum efficient rooting depth of a given crop. In order to compute the WB, the tabulated mean values of the ASWS were used from ČSN 75 0434 [27] equalling one half of the maximum content of readily available water derived from soil hydrolimits, i.e., field capacity (FC), point of decreased availability (PDA), permanent wilting point (PWP) and available water capacity (AWC), see Equation (2):
where:
where:
ASWS = 0.5·(FC − PDA)·MERD
| ASWS | available soil water supply [mm], |
| FC | field capacity [vol.%], |
| PDA | point of decreased availability [vol.%], |
| MERD | maximum efficient rooting depth [dm]. |
| PDA | was calculated according to Equation (3): |
PDA = PWP + % AWC
| PWP | permanent wilting point [vol.%], |
| AWC | available water capacity derived as FC − PWP [vol.%], |
| % | percentage of the AWC, which is easily available for crops, i.e., 40–60% of the AWC according to a particular crop and its phenological phase. |
The amount of the ASWS was furthermore reduced by a coefficient r2 depending on the increasing terrain slope and the content of clay particles [27].
The available amount of rising groundwater (AARG) was derived from ČSN 75 0434 [27], for individual crops and months of the growing period and soil types based on the spatial pattern of the shallow groundwater level (GWL). However, the AARG values reported in the above-mentioned CTS are considerably high; i.e., unreal. Therefore, based on the CTS authors´ recommendation relating to the ability of the soil types to the rise water, these values were reduced in this study by 50% (for sandy loams, loamy, clay loams, clayey and clay soils), or by 75% (for loamy sands) and even by 100% (for sandy soils). The shallow GWL was derived using kriging of the data taken from the CSS, obtaining a grid layer of shallow GWL (in the vast majority of cases these GWLs were not the real aquifers) for the entire territory of the former Czechoslovakia at a spatial resolution 100 m × 100 m. When no GWL in soil probes was measured, a fixed value of 180 cm was used, being the most likely a mean value for such conditions across the Czech Republic, based on the CTS authors´ experience.
The crop water requirement for the overall growing period represents the sum of evapotranspiration in conditions which are optimal for crop development. The differences between crop varieties were not taken into account. The CWR values were established as ETc according to the FAO-56 Penman-Monteith method [21] from sowing/planting to harvest, when multiplying the ET0 and Kc in daily steps and summarised for the overall growing period. The calculation of ET0 was derived from the original Penman-Monteith equation [29]. The crop coefficient is changing throughout the growing period based on crop development (e.g., albedo, aerodynamic resistance, cover resistance). The tabulated Kc for the initial crop stage (Kcini, planting/sowing until covering approx. 10% of surface), medium stage (Kcmid, full covering up to the beginning of maturing) and final stage (Kcend, beginning of maturing up to harvest) were taken from Allen et al. [21]. The values between Kcini and Kcmid were interpolated in a linear way. The division of Kc into the four crop stages was related only to the year of harvest. For the year of sowing winter wheat and oilseed rape, the CWR was computed using Kcini from sowing up to the air temperature threshold value, which stops crop physiological activities including transpiration. In the year of harvest, the CWR began to be calculated using Kcini when the minimum growth temperature was reached. If sowing/planting was carried out before reaching the minimum growing temperature, then the CWR was zero until the date of the minimum growing temperature. The terms for using Kcmid were taken from the database of crops, in particular the AGAs. Compared to this study, the CWR values in ČSN 75 0434 [27] are reported as standard values only for two CZ lowland areas (Polabí, Jižní Morava, Czech), where supplemental irrigation is required, and CWR for other areas are reduced via an altitude-related coefficient.
2.3. Categories of Soil Water Availability
The computed values of the WB were classified into four categories (1–4) with different availability of water resources using soil hydrolimits (FC and PWP in vol.%) derived from pedotransfer functions based on Brežný [27], where the typical mass percentage of soil particles <0.01 mm for a particular soil type was used. To compute the categories of soil water availability, the WB values were converted from mm to vol.% (i.e., /10). The area composition of all categories was crop dependent, based on the percentage of the AWC easily available for crops (Equation (3)). The winter wheat was less susceptible to water stress (% of AWC 45%) followed by oilseed rape (50%) and water stress sensitive silage maize and potatoes (55%). Category 1 represented a positive WB, i.e., the amount of available water for evapotranspiration is higher than CWR. All other categories, as shown later, had a negative WB (i.e., a lower amount of available water sources compared to CWR) and therefore these areas demonstrated various crop-dependent rates of water stress. Category 2 included the WB with an absolute value smaller than the difference between FC and PDA. The water deficit in soil shall thus not decrease the yields. Category 3 contained the WB with an absolute value higher than the difference between FC and PDA, but smaller than the AWC. Category 4 represented conditions with the worst water supply, where the WB absolute value was higher than the AWC value. Categories 3 and 4 are further discussed as suitable for supplemental irrigation.
The calculation of individual categories of the WB was carried out using the database system, PostgreSQL 9.6 with an extension of spatial information PostGIS 2.2., with the PHP programming language. The result of the WB for individual land blocks and selected agricultural crops was created using software ArcGIS version 10.4 (Figure 2, Figure 3, Figure 4 and Figure 5).
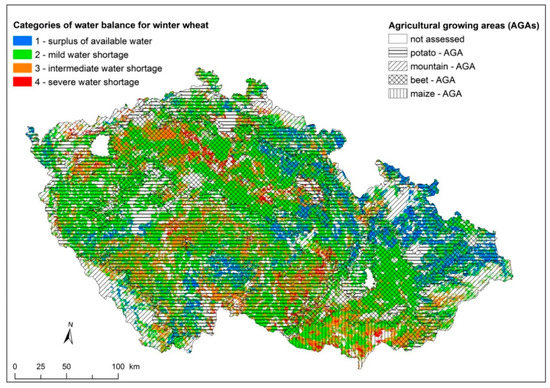
Figure 2.
Delineation of four categories of long-term water balance for winter wheat in the 1981–2010 period.
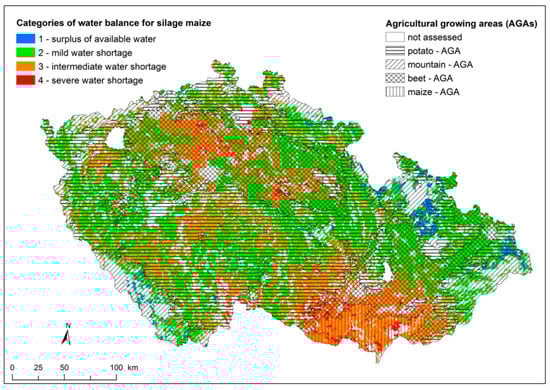
Figure 3.
Delineation of four categories of long-term water balance for silage maize in the 1981–2010 period.
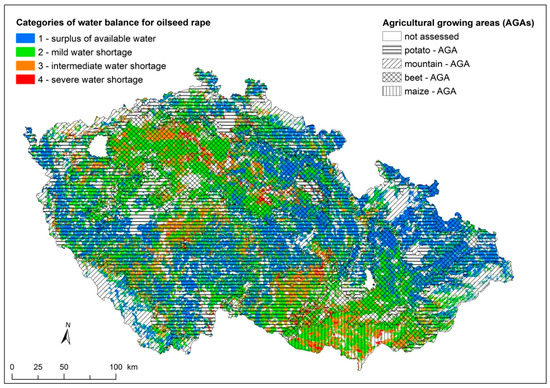
Figure 4.
Delineation of four categories of long-term water balance for oilseed rape in the 1981–2010 period.
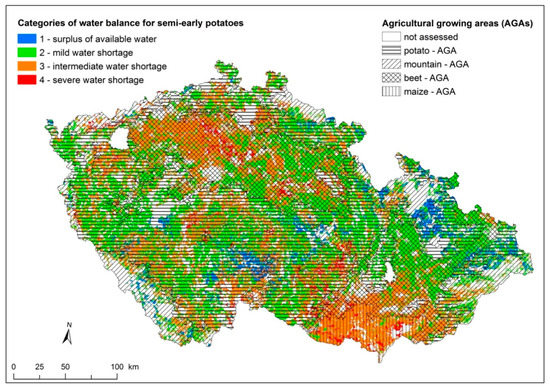
Figure 5.
Delineation of four categories of long-term water balance for semi-early potatoes in the 1981–2010 period.
2.4. Other Data Sources
WB Equation (1) was interlinked with other data sources (digital terrain model, soil types from digitalisation of CSS, meteorological data sources, field blocks—Parcels, boundaries of AGAs). If the parcel was soil-heterogeneous, the WB was established for the prevalent soil type. Crop sowing and harvest dates were taken from the database of particular crops in the particular AGAs. The influence of tile drainage systems, built on approximately 25% of agricultural land in CZ, was not considered in the calculations, however, the role of land drainage is discussed in the relevant part of this study.
3. Results
The calculated WB and its spatial distribution into four categories of soil water availability for individual crops and AGAs are expressed in Figure 2, Figure 3, Figure 4 and Figure 5 and Table 2, Table 3, Table 4 and Table 5, which, in addition, show the selected components of the WB (CWR, precipitation, AARG) and the length of the growing period. In total, the WB was assessed on the area of 24,592 km2. From this area, the biggest share was occupied by the PGA (11,607 km2) and BGA (11,088 km2). A substantially smaller area was covered with the MGA (1579 km2) and MoGA (318 km2). The long-term WB of selected crops was predominantly negative (categories 2–4), which means that within the overall growing period, the CWR was not sufficiently met and the assessed crops were exposed to mild to severe water stress.
Table 2.
Water balance of winter wheat divided into categories of soil water availability within individual agricultural growing areas (AGAs).
Table 3.
Water balance of silage maize divided into categories of soil water availability within individual agricultural growing areas (AGAs).
Table 4.
Water balance of oilseed rape divided into categories of soil water availability within individual agricultural growing areas (AGAs).
Table 5.
Water balance of semi-early potatoes divided into categories of soil water availability within individual agricultural growing areas (AGAs).
Even though in MGA and BGA, the AWC was generally higher (Table 1), yet the deficit of the WB was significantly higher (especially in MGA) compared to MoGA and PGA. In MGA, category 1 did not occur at all and category 2 for spring crops occurred only to a small extent. The reason was the generally low precipitation and high CWR. In BGA, category 1 was represented for spring crops on a substantial smaller scale (<1%) compared to winter crops. The water deficit in this case was caused by rather low precipitation. Most available water for the crops was found in MoGA, where there were the highest sums of precipitation, even though precipitation availability and water supply in the soil after the winter period were reduced to a great extent due to a greater slope of parcels (Table 1). The differences among the categories of soil water availability in BGA, PGA and MoGA were caused by multiple WB components (i.e., decreasing in precipitation totals and AARG, increasing in CWRs). However, in MGA, the categories of soil water availability differed only via AARG, i.e., the precipitation totals and CWRs were quite similar in all categories.
3.1. Winter Wheat
Winter wheat growing was without water stress (categories 1 and 2) in BGA, PGA and MoGA on 81% (9022 km2), 81% (9427 km2), and 76% (241 km2) of parcels (Table 2, Figure 2). The average WB deficit (weighted average from all categories) reached in BGA, PGA and MoGA 61, 44, and 43 mm. In MGA, there were only 61% (959 km2) of parcels, where the growth and development of winter wheat was not influenced by water stress (category 2) and the average deficit of the WB was 109 mm. In the entire CZ, there were in total 80% of the parcels on agricultural land (19,648 km2), where winter wheat was not influenced by water stress (category 1 and 2) and the average deficit of the WB was 56 mm.
The highest representation of the category 4 was found in MGA (11%, 172 km2) in comparison to BGA, PGA and MoGA (3.6, 2.5, and 4.5%, i.e., 399, 289, and 14 km2). The need for supplemental irrigation, indicated by categories 3 and 4, was manifested in the entire CZ on 20.1% of the parcels (4942 km2).
3.2. Silage Maize
The water availability for silage maize was the highest in MoGA with the average deficit of WB 42 mm and 81% of the parcels (257 km2) in categories 1 and 2 (Table 3). In PGA, the average deficit of the WB was 64 mm and 73% of the parcels (8470.5 km2) were without water stress (category 1 and 2). In BGA, the representation of categories 1 and 2 was only on 55% of the parcels (6119 km2) and the average deficit of the WB was 93 mm. Silage maize grown in MGA was stressed through a substantial water deficit of the WB (145 mm) and a shortage of precipitation (266 mm). The average deficit of the WB for all selected AGAs was 82 mm. In the entire CZ, there were a total of 60% of the parcels (14,847 km2), where silage maize was not influenced by water stress (Figure 3).
For category 4, a total of 11% (179 km2) was classified in MGA, which was substantially more than in other AGAs (BGA 2% = 243 km2, PGA 1% = 107 km2 and MoGA 0.2% = 0.7 km2). Growing silage maize with supplemental irrigation (category 3 and 4) would be presumed on a total of 39.6% of the parcels (9745.5 km2).
3.3. Oilseed Rape
Except MGA, in other AGAs, there were relatively better conditions for growing oilseed rape from the WB point of view as indicated by the totals of 85.1% (9438 km2), 88.5% (10,274 km2) and 85.4% (272 km2) of parcels in BGA, PGA and MoGA, respectively, which were classified into categories 1 and 2. The average deficit of the WB in BGA, PGA and MoGA reached 35, 10 and 1 mm, respectively (Table 4). Less favourable conditions for growing oilseed was again in MGA with an average deficit of 89.5 mm and with the category 2 being on 65.5% (1035 km2) of the parcels. The average deficit of the WB for all AGAs was 26 mm. In the entire CZ, there were totally 85.5% of the parcels (21,018 km2), where growing oilseed rape was not influenced by water stress.
At category 4, a total of 7% (111 km2) of the parcels were classified in MGA, which was pronouncedly higher compared to other AGAs (BGA 2.5% = 275 km2, PGA 1.1% = 123 km2, MoGA 1.2% = 4 km2). Growing oilseed rape would require supplemental irrigation (category 3 and 4) totally on 14.5% of the parcels (3574.6 km2).
3.4. Semi-Early Potatoes
The most suitable conditions for semi-early potatoes appeared to be in PGA, where a total of 72% (8328.5 km2) was classified into categories 1 and 2. The average deficit of the WB here was 56.5 mm (Table 5). In MoGA, a total of 70% of the parcels (221.5 km2) was classified as no-water stress and the average deficit of the WB was 46 mm. In BGA, there were 53% of the parcels (5860.4 km2) in category 1 and 2 and the average deficit of the WB reached 91.5 mm. The worst conditions for growing potatoes were in MGA, where only 6.6% of the parcels (105 km2) were not affected by water stress and the average deficit of the WB was 138.4 mm. The average deficit of the WB for all AGAs was 77.4 mm. In the entire CZ, there was a total of 59% of the parcels (14,515 km2), where growing semi-early potatoes was not influenced by water stress.
At category 4, there were a total of 11.4% of the parcels (179.4 km2) which were classified in MGA. In BGA, PGA and MoGA, it was 3.3% (362 km2), 2.3% (268 km2) and 3.2% (10.3 km2), respectively. Growing semi-early potatoes would require supplemental irrigation (categories 3 and 4) on 41% of the parcels (10,077.3 km2).
4. Discussion
4.1. Crop Sensitivity to Water Deficit
The proposed WB categories differentiated the soil water availability for the individual assessed crops. The classification into categories 3 and 4 means that the crops were exposed from an intermediate to a strong degree of the water deficit, which is connected to the available soil moisture lower than PDA (depleted 50–60% of AWC), respectively lower than PWP (depleted 80–90% of AWC = soil drought). These conditions would lead to a decrease of crop yields, whose extent is dependent on the period, intensity and length of the water stress [30]. The winter crops were less affected by the water stress and subsequent yield loss compared to spring crops (representation in categories 3 and 4: wheat 20%, oilseed rape 14.5%, potatoes 41%, and maize 39.6%). Similarly, Kowalczyk et al. [31] identified larger water deficits for spring crops on the Małopolska Upland (sugar beet, grain maize and late-grown potatoes) compared to winter crops (winter wheat). They found no water stress or only a small water deficit of the WB of winter wheat (max. 70 mm) in years with an average rainfall in the period 1971–2010, which is comparable to our results taking into account the different latitude of both regions. Daryanto et al. [32] stated that wheat is less susceptible to drought due to effective soil water use owing to the dryland region origin. According to Hess et al. [33], oilseed rape is more sensitive to a restricted water supply than wheat, which is stated to be associated with a lower WUE and a greater reduction in the yields following soil drying, even if the root system of oilseed rape is at least equally efficient as wheat in extracting water from soil. The lowest water stress of oilseed rape in our study could be explained by the lowest daily CWR (1.9–2.0 mm compared to 2.2–2.4 mm for winter wheat, 2.6–3.0 mm for maize and 2.8–3.1 mm for potatoes). Wheat is most vulnerable to a soil water deficit in stages of heading and grain set [11,34]. Similarly, the critical growth stage for oilseed rape is flowering and for maize pollination and kernel development [30,35]. Potatoes, a cool season crop, are less resistant to water stress compared to winter crops, as they have a lower ability to absorb soil water and there is a decrease in the yield already when depleting 45–50% of AWC [36,37,38]. Kowalczyk et al. [31] reported water deficits of the WB for late-grown potatoes ranging from 6 to 115 mm on different soils. Similarly, maize comes originally from wetter regions, and it is thus also more sensitive to drought. A higher extent of water stress in potatoes and maize is also caused by their higher CWR.
4.2. The Possibility of Supplemental Irrigation
Based on the crop sensitivity to the water deficit, the area of categories 3 and 4, which indicated suitability for supplemental irrigation, was different for selected crops (wheat = 20.1%, 4944.2 km2, silage maize = 39.6%, 9745.5 km2, semi-early potatoes = 41.0%, 10,077.3 km2, oilseed rape = 14.5%, 3574.6 km2). However, the current deployment of the irrigation systems, which were built on the area of 160,000 ha across the whole CZ [39], is nowadays unsatisfactory. However, in 1989, the farmers used 75–80% of the irrigation systems, in 1994 they used only by 35–40% and in 1998 this use dropped to only 12–15%. Nowadays, the use of irrigation is at 25–30% of the whole former extent [39,40]. The areas affected the most by extremely high temperatures are Central Bohemia and Southern Moravia. Since 1990s, the occurrence of the heat wave phenomenon has widely spread to other areas of CZ with a significant increase in Western Bohemia. Due to the anticipated lowered water resources for irrigation, the so-called deficit irrigation is to be considered, which forces plants to adapt to a lower amount of water during the concurrent WUE increase [41]. Djaman et al. [42] stated that a limited irrigation (60–75% of full irrigation) is a viable practice for increasing crop water productivity of maize in South-central Nebraska. Likewise, Daryanto et al. [32] found that a small amount of supplemental irrigation (35–75 mm) generated approximately 28–88% of an increase in the yield of wheat and maize, respectively. The shortcomings of deficit irrigation are lower yields and the risk of drip irrigation-induced soil salinization. However, it is always essential to avoid deficit irrigation in crucial stages of crop growth.
4.3. Comparison to Previous Crop Water Requirements and Crop Yields
The crop water requirements computed in this study as ETc, according to the FAO-56 method, were substantially higher for the 1981–2010 period as compared to the CWRs stated in CTS [27], which are based on the results from the irrigation field experiments at the former Czechoslovakia, conducted from the 1950s to 1970s. This CTS states e.g., for the region of Southern Moravia (hottest and driest part of CZ located in MGA) the following the CWR: winter wheat 240 mm, silage maize 310 mm, oilseed rape 240 mm and semi-early potatoes 200 mm. Although the FAO-56 method overvalues the CWR on average by 9% [41], the differences of the CWR found in our study, for wheat, potatoes and oilseed rape, were higher than 100 mm compared to ČSN 75 0434 [27] leading to substantial WB deficits. This increase of the CWR can be explained both by climate change, i.e., an increase in ET0, and by an increase in yields due to increased fertilizer use for the cultivation of high-yielding varieties, i.e., an increase of Kc. To confirm this, for instance, Žalud et al. [43] stated for Southern Moravia, an increase of the WB deficit for the last two decades of the 1961–2010 period, caused by an increase in the air temperature for 10 months per year by 0.5–1.7 °C, a decrease in precipitation in spring months by 3–12 mm and on the contrary, by an increase in precipitation in the summer months by 7–16 mm. Although the climate normal for the 1981–2010 period is still valid in the current period, it is likely that a further increase in the CWRs and the WB deficit in the last 10 years occurred as a consequence of the recent drought waves [9] accompanied by the increasing intensity of solar radiation, air temperature and evapotranspiration [5]. However, it is still too early to evaluate these changes in the long term.
An average wheat grain yield worldwide was 1 t/ha in 1961, which tripled in 2010 [44]. Nowadays, wheat grain yields range from 4 to 10 t/ha in rainfed temperate climates of Western and Northern Europe. The total cumulative evapotranspiration of winter wheat typically ranges from 200 to 500 mm, although it can be less in non-irrigated semi-arid areas and reaches 600–800 mm under heavy irrigation. The higher yields are accompanied by better WUE. For instance, Thaler et al. [11] found that 8 kg of wheat grains were produced by 1 mm of water per ha at a yield 3.8 t/ha compared with 12 kg of wheat grains at a yield 6 t/ha. The higher WUE and wheat grain yields were found with the introduction of semi-dwarf varieties in the 1970s by a better response to increased fertilizer input [45,46]. Based on the results of fifty-years of field experiments in Czechoslovakia and CZ, the yields of semi-dwarf varieties on different soils (degraded Chernozem, sandy-loam Cambisol, illimerized Luvisol, greyic Phaeozem) fertilized with 75–190 kg N+PK/ha were, on average, 5–7 t/ha within the periods 1997–2006, while the grain yields of old wheat tall varieties did not exceed 4 t/ha in 1950s and 1960s, even on fertilized fertile soils [45,46,47,48]. Replacing tall varieties by semi-dwarf varieties, which improved the WUE and yields dramatically, is the reason for the higher CWR of winter wheat, which was confirmed in this study.
To improve the WB of arable land and stabilize crop yields, it is necessary to increase soil water retention and availability. Sustainable crop yields in a changing climate are more likely to result from site-specific management that considers both soil and meteorological conditions (soil conservation practices, proper tillage, mulching, crop rotation etc.) and cultivar selection that is adjusted to the local climate [32,49]. The viable strategy for sustainable crop production is the adoption of drought-tolerant maize varieties or hybrids, which, according to Hao et al. [50] have great advantages in maize yield and the WUE when plants were grown under a severe water deficit and a high plant density compared to conventional hybrids.
4.4. Potential of Land Drainage Management for Water Balance Improvement
In the Czech Republic as well as worldwide, the agricultural land drainage systems present a great potential for increasing water retention in soils. In CZ, the drainage systems, prevailingly as tile drainage, built until 1990 (i.e., in the former Czechoslovakia) occur totally on covers of approximately one quarter of agricultural land (1.1 mil. ha) [51]. The effect of tile drainage on the water regime of agricultural fields depends on the topography, soil type, the depth of shallow groundwater, precipitation characteristics, land use, the type of drainage systems and the cause of waterlogging, which are the parameters according to which the drainage systems were designed [52,53]. Generally, it can be stated that one-function drainage systems (free drainage), besides having the potential to reduce surface runoff and associated soil erosion, also decrease shallow GWL and drain subsurface water from the landscape, even when it is not necessary. The presence of drainage systems generally also deteriorates the quality of related waters, as they carry away dissolved nutrients and other pollutants from the soil by subsurface runoff [54,55].
In this study, the presence of artificial land drainage systems was not taken into account when computing AARG and this was for various reasons (i-iv). The GWL derived from CSS did not cover 57.7% of the currently known acreage of drained areas, because the drainage systems were installed on this area after finishing CSS (after 1972). (i) There is no relevant data on GWL along with information on the functionality of the drainage systems in the monitored period across the whole CZ. (ii) The average shallow GWL obtained from CSS on parcels with drainage was 139 cm, which was considered as the acceptable value entering into the calculation of AARG. (iii) Likewise, the coefficient r1 was not changed on drained areas either. (iv) The drainage systems on agricultural land partially overlap with the occurrence of intermediate and severe water stress. For the categories 3 and 4, it concerns 25.2–27.3%, and 26.4–37.6% respectively, of the area overlapping with land drainage, being different for particular crops (data not shown). Moreover, there are sites superfluously equipped with both irrigation systems and tile drainage built on the same field. This overlap in total concerns approximately 19% of the former irrigated area in the CZ, i.e., around 30,000 hectares. From today´s point of view, this information suggests a redundant tile drainage on parts of the agricultural parcels requiring supplemental irrigation and the need for adoption of remedial measures, e.g., by the reduction of drainage intensity or the application of controlled drainage, especially for the fields with intermediate and severe water stress [56,57].
5. Conclusions
The procedure described in this paper enables the categorization of soil water availability for four field crops at a field block scale based on a long-term water balance. The crop water requirements computed in this study based on the FAO-56 method were substantially higher for the assessed period compared to the CWRs calculated in 1970´s. Based on this, the areas where crops suffered from severe water stress, were delineated compared to the areas with quite sufficient soil water supply. In BGA, PGA and MoGA, the water stressed areas were characterized by lower precipitation, AARG and higher CWR compared to non-water stressed areas. However, in MGA, the differences between water stressed and non-water stressed areas were proven only by soil properties (i.e., AARG). Moreover, the approach stands for a suitable tool for evaluating and proposing changes of area composition of cultivated crops with appropriate tillage and agricultural water management in terms of adequate crop water requirements. Based on categorizing soil water availability, it is possible to propose the effective placement of irrigation systems in areas affected by a water deficit in the long-term, or to propose the regulation of drainage runoff or to consider controlled drainage. The availability of the real-time meteorological data would further allow for the identification and delineation of areas most severely affected by recent droughts for the purposes of compensating seasonal yield losses to farmers.
Author Contributions
Conceptualization R.D. and P.F.; methodology R.D. and J.H.; validation, R.D. and J.H.; data preparation J.H., P.F., J.R. and I.N., formal analysis, R.D. and J.H.; investigation, R.D. and P.F.; resources, J.R. and J.H.; data curation, I.N.; writing—original draft preparation, R.D. and P.F.; writing—review & editing, R.D. and P.F.; visualization, P.F. and J.H.; supervision, R.D. and P.F.; project administration, P.F. and I.N.; funding acquisition, P.F. and I.N.
Funding
This research received no external funding.
Acknowledgments
This paper was supported by the Ministry of Agriculture of the Czech Republic, the project QK1720285 “New methods for adjustment of altered crop water requirements in irrigation systems across Czechia as affected by soil and climate changes“, the contract No. 859-2016-10052 “Development of the calculator concerning water requirement of crop rotation as an individual module within anti-erosion calculator“, and by the support of Research Institute for Soil and Water Conservation No. RO0218. The authors thank the anonymous reviewers for their very valuable comments. The authors thank to Zbyněk Kulhavý and František Kulhavý for consultations on the adjustment of precipitation availability coefficient, and to Daniel Žížala for the help with GIS analyses.
Conflicts of Interest
The authors declare no conflicts of interest.
Abbreviations
| AGAs | agricultural growing areas |
| WB | water balance |
| AARG | available amount of rising groundwater for growing period |
| ASWS | available soil water supply at the beginning of growing period |
| BGA | beet-AGA |
| CSS | Complex soil survey |
| CTS = ČSN | Czech technical standard |
| CWR | crop water requirement |
| GWL | groundwater level |
| MGA | maize-AGA |
| MoGA | mountain-AGA |
| PGA | potato-AGA |
| PN | precipitation normal |
References
- Makowski, K.; Wild, M.; Ohmura, A. Diurnal temperature range over Europe between 1950 and 2005. Atmos. Chem. Phys. 2008, 8, 6483–6498. [Google Scholar]
- Supit, I.; van Diepen, C.A.; Boogaard, H.L.; Ludwig, F.; Baruth, B. Trend analysis of the water requirements, consumption and deficit of field crops in Europe. Agric. For. Meteorol. 2010, 150, 77–88. [Google Scholar] [CrossRef]
- Olesen, J.E.; Trnka, M.; Kersebaum, K.C.; Skjelvåg, A.O.; Seguin, B.; Peltonen-Sainio, P.; Rossi, F.; Kozyra, J.; Micale, F. Impacts and adaptation of European crop production systems to climate change. Eur. J. Agron. 2011, 34, 96–112. [Google Scholar] [CrossRef]
- Wang, K.; Dickinson, R.E.; Wild, M.; Liang, S. Evidence for decadal variation in global terrestrial evapotranspiration between 1982 and 2002: 2. Results. J. Geophys. Res. 2010, 115, D20113. [Google Scholar] [CrossRef]
- Yuan, Z.; Yan, D.; Yang, Z.; Yin, J.; Breach, P.; Wang, D. Impacts of climate change on winter wheat water requirement in Haihe River Basin. Mitig. Adapt. Strateg. Glob. Chang. 2016, 21, 677–697. [Google Scholar]
- Svoboda, V.; Hanel, M.; Máca, P.; Kyselý, J. Projected changes of rainfall event characteristics for the Czech Republic. J. Hydrol. Hydromech. 2016, 64, 415–425. [Google Scholar] [CrossRef]
- Lobanova, A.; Liersch, S.; Nunes, J.P.; Didovets, I.; Stagl, J.; Huang, S.; Koch, H.; Rivas López, M.D.R.; Maule, C.F.; Hattermann, F.; et al. Hydrological impacts of moderate and high-end climate change across European river basins. J. Hydrol. Reg. Stud. 2018, 18, 15–30. [Google Scholar] [CrossRef]
- Štěpánek, P.; Trnka, M.; Chuchma, F.; Zahradníček, P.; Skalák, P.; Farda, A.; Fiala, R.; Hlavinka, P.; Balek, J.; Semerádová, D.; et al. Drought Prediction System for Central Europe and its Validation. Geosciences 2018, 8, 104. [Google Scholar] [CrossRef]
- Hänsel, S.; Ustrnul, Z.; Łupikasza, E.; Skalak, P. Assessing seasonal drought variations and trends over Central Europe. Adv. Water Resour. 2019, 127, 53–75. [Google Scholar] [CrossRef]
- Morison, J.I.L.; Lawlor, D.W. Interactions between increasing CO2 concentration and temperature on plant growth. Plant Cell Environ. 1999, 22, 659–682. [Google Scholar] [CrossRef]
- Thaler, S.; Eitzinger, J.; Trnka, M.; Dubrovsky, M. Impacts of climate change and alternative adaptation options on winter wheat yield and water productivity in a dry climate in Central Europe. J. Agric. Sci. 2012, 150, 537–555. [Google Scholar] [CrossRef]
- Kaur, H.; Jalota, S.K.; Kanwar, R.; Vashisht, B.B. Climate change impacts on yield, evapotranspiration and nitrogen uptake in irrigated maize (Zea mays)-wheat (Triticum aestivum) cropping system: A simulation analysis. Indian J. Agric. Sci. 2012, 82, 213–219. [Google Scholar]
- Wang, J.; Liu, X.; Cheng, K.; Zhang, X.; Li, L.; Pan, G. Winter wheat water requirement and utilization efficiency under simulated climate change conditions: A Penman-Monteith model evaluation. Agric. Water Manag. 2018, 197, 100–109. [Google Scholar] [CrossRef]
- Stricevic, R.J.; Stojakovic, N.; Vujadinovic-Mandic, M.; Todorovic, M. Impact of climate change on yield, irrigation requirements and water productivity of maize cultivated under the moderate continental climate of Bosnia and Herzegovina. J. Agric. Sci. 2018, 156, 618–627. [Google Scholar] [CrossRef]
- Karandish, F.; Kalanaki, M.; Saberali, S.F. Projected impacts of global warming on cropping calendar and water requirement of maize in a humid climate. Arch. Agron. Soil Sci. 2017, 63, 1–13. [Google Scholar] [CrossRef]
- Trnka, M.; Rötter, R.P.; Ruiz-Ramos, M.; Kersebaum, K.C.; Olesen, J.E.; Žalud, Z.; Semenov, M.A. Adverse weather conditions for European wheat production will become more frequent with climate change. Nat. Clim. Chang. 2014, 4, 637–643. [Google Scholar] [CrossRef]
- Středová, H.; Rožnovský, J.; Středa, T. Predisposition of drought occurrence in selected arid areas of the Czech Republic. Contrib. Geophys. Geodesy 2013, 43, 237–252. [Google Scholar] [CrossRef]
- Riediger, J.; Breckling, B.; Nuske, R.S.; Schröder, W. Will climate change increase irrigation requirements in agriculture of Central Europe? A simulation study for Northern Germany. Environ. Sci. Eur. 2014, 26, 18. [Google Scholar] [CrossRef]
- Reidsma, P.; Ewert, F.; Lansink, A.O.; Leemans, R. Adaptation to climate change and climate variability in European agriculture: The importance of farm level responses. Eur. J. Agron. 2010, 32, 91–102. [Google Scholar] [CrossRef]
- Seidel, S.; Werisch, S.; Barfus, K.; Wagner, M.; Schutze, N.; Laber, H. Field evaluation of irrigation scheduling strategies using a mechanistic crop growth model. Irrig. Drain. 2016, 65, 214–223. [Google Scholar] [CrossRef]
- Allen, R.G.; Pereira, L.S.; Raes, D.; Smith, M. Crop Evapotranspiration - Guidelines for Computing Crop Water Requirements, 1st ed.; FAO Irrigation and Drainage Paper 56; Food and Agriculture Organization: Rome, Italy, 1998. [Google Scholar]
- Petropoulos, G.P.; Srivastava, P.K.; Piles, M.; Pearson, S. Earth Observation-Based Operational Estimation of Soil Moisture and Evapotranspiration for Agricultural Crops in Support of Sustainable Water Management. Sustainability 2018, 10, 181. [Google Scholar] [CrossRef]
- Garrido-Rubio, J.; Calera Belmonte, A.; Fraile Enguita, L.; Arellano Alcázar, I.; Belmonte Mancebo, M.; Campos Rodríguez, I.; Bravo Rubio, R. Remote sensing-based soil water balance for irrigation water accounting at the Spanish Iberian Peninsula. In Proceedings of the IAHS 380 Earth Observation for Integrated Water and Basin Management: New Possibilities and Challenges for Adaptation to a Changing Environment, Cordoba, Spain, 8–10 May 2018; González-Dugo, M.P., Neale, C., Andreu, A., Pimentel, R., Polo, M.J., Eds.; Copernicus Publications: Gottingen, Germany. [Google Scholar]
- Pozníková, G.; Fischer, M.; Pohanková, E.; Trnka, M. Analyses of spring barley evapotranspiration rates based on gradient measurements and dual crop coefficient model. Acta Univ. Agric. Silvic. Mendel. Brun. 2014, 62, 1079–1086. [Google Scholar] [CrossRef]
- Spitz, P.; Zavadil, J.; Duffková, R.; Korsuň, S.; Nechvátal, M.; Hemerka, I. Guidelines for Managing Crops Irrigation Regime through IT Program IRRIPROG, 1st ed.; Research Institute for Soil and Water Conservation: Prague, Czech Republic, 2011; p. 41. [Google Scholar]
- Miháliková, M.; Matula, S.; Doležal, F. HYPRESCZ-Database of soil hydrophysical properties in the Czech Republic. Soil Water Res. 2013, 8, 34–41. [Google Scholar] [CrossRef]
- Czech Office for Standards. ČSN 75 0434. Amelioration–Water Requirement for Supplemental Irrigation of Field Crops. Czech Technical Standards. ICS 13.060.10; 65.020.20; Czech Office for Standards, Metrology and Testing: Prague, Czech Republic, 2017. [Google Scholar]
- Budňáková, M. (Ed.) Report on Soils; The Ministry of Agriculture of the Czech Republic–Department of Plant Production: Prague, Czech Republic, 2009; p. 91.
- Monteith, J.L. Principles of environmental physics; Edward Arnold: London, UK, 1973. [Google Scholar]
- Plaut, Z. Sensitivity of crop plants to water stress at specific developmental stages: Re-evaluation of experimental findings. Isr. J. Plant Sci. 1995, 43, 99–111. [Google Scholar] [CrossRef]
- Kowalczyk, A.; Łabȩdzki, L.; Kuźniar, A.; Kostuch, M. An assessment of crop water deficits of the plants growing on the Małopolska Upland. J. Water Land Dev. 2016, 29, 11–22. [Google Scholar] [CrossRef][Green Version]
- Daryanto, S.; Wang, L.; Jacinthe, P.A. Global synthesis of drought effects on maize and wheat production. PLoS ONE 2016, 11, e0156362. [Google Scholar] [CrossRef]
- Hess, L.; Meir, P.; Bingham, I.J. Comparative assessment of the sensitivity of oilseed rape and wheat to limited water supply. Ann. Appl. Biol. 2015, 167, 102–115. [Google Scholar] [CrossRef]
- Haberle, J.; Trčková, M.; Růžek, P. Causes of Adverse Drought Effect and Other Abiotic Factors on Intake and Utilization of Nutrients by Cereals and the Potential for Its Reduction, 1st ed.; Crop Research Institute: Prague, Czech Republic, 2008; p. 32. [Google Scholar]
- Wei, Y.; Jin, J.; Jiang, S.; Ning, S.; Cui, Y.; Zhou, Y. Simulated assessment of summer maize drought loss sensitivity in Huaibei Plain, China. Agronomy 2019, 9, 78. [Google Scholar] [CrossRef]
- Harris, P.M. Water. In The Potato Crop, 1st ed.; Harris, P.M., Ed.; Chapman & Hall: London, UK, 1978; pp. 244–277. [Google Scholar]
- Haberle, J.; Vlček, V.; Kohut, M.; Středa, T.; Dostál, J.; Svoboda, P. Balance and Determining Available Water Supplies in Root Zone of Crops, 1st ed.; Crop Research Institute: Prague, Czech Republic, 2015; p. 36. [Google Scholar]
- Fleisher, D.H.; Barnaby, J.; Sicher, R.; Resop, J.P.; Timlin, D.J.; Reddy, V.R. Effects of elevated CO2 and cyclic drought on potato under varying radiation regimes. Agric. For. Meteorol. 2013, 171–172, 270–280. [Google Scholar] [CrossRef]
- Novák, P.; Kulhavý, Z.; Pelíšek, I.; Podhrázská, J.; Novotný, I.; Skokanová, E.; Batysta, M.; Marval, Š.; Podhrázský, A.; Berka, M.; et al. A survey of irrigation systems in Czechia: The state, use and perspectives. In A report for Czech Ministry of Agriculture, 1st ed.; Research Institute for Soil and Water Conservation: Prague, Czech Republic, 2016; p. 52. [Google Scholar]
- Trnka, M.; Drbal, K.; Dumbrovský, M.; Novotný, I.; Žalud, Z.; Vizina, A.; Chuchma, F.; Růžek, P.; Trantinová, M. Character of Landscape water Management in the Czech Republic, 1st ed.; The State Land Office: Prague, Czech Republic, 2017; p. 423. [Google Scholar]
- Cid, P.; Taghvaeian, S.; Hansen, N.C. Evaluation of the FAO-56 methodology for estimating maize water requirements under deficit and full irrigation regimes in semiarid North-eastern Colorado. Irrig. Drain. 2018, 67, 605–614. [Google Scholar] [CrossRef]
- Djaman, K.; Irmak, S.; Rathje, W.R.; Martin, D.L.; Eisenhauer, D.E. Maize evapotranspiration, yield production functions, biomass, grain yield, harvest index, and yield response factors under full and limited irrigation. Trans. Asabe 2013, 56, 373–393. [Google Scholar] [CrossRef]
- Žalud, Z.; Brotan, J.; Hlavinka, P.; Trnka, M. Trends in temperature and precipitation in the period of 1961–2010 in Žabčice locality. Acta Univ. Agric. Silvic. Mendel. Brun. 2013, 61, 1521–1531. [Google Scholar] [CrossRef]
- Steduto, P.; Hsiao, T.C.; Fereres, E.; Raes, D. Crop Yield Response to Water, 1st ed.; Food And Agriculture Organization Of The United Nations: Rome, Italy, 2012. [Google Scholar]
- Kunzová, E.; Hejcman, M. Yield development of winter wheat over 50 years of FYM, N, P and K fertilizer application on black earth soil in the Czech Republic. Field Crops Res. 2009, 111, 226–234. [Google Scholar] [CrossRef]
- Kunzová, E.; Hejcman, M. Yield development of winter wheat over 50 years of nitrogen, phosphorus and potassium application on greyic Phaeozem in the Czech Republic. Eur. J. Agron. 2010, 33, 166–174. [Google Scholar] [CrossRef]
- Hejcman, M.; Kunzová, E. Sustainability of winter wheat production on sandy-loamy Cambisol in the Czech Republic: Results from a long-term fertilizer and crop rotation experiment. Field Crops Res. 2010, 115, 191–199. [Google Scholar] [CrossRef]
- Hejcman, M.; Kunzová, E.; Šrek, P. Sustainability of winter wheat production over 50 years of crop rotation and N, P and K fertilizer application on illimerized luvisol in the Czech Republic. Field Crops Res. 2012, 139, 30–38. [Google Scholar] [CrossRef]
- Trnka, M.; Dubrovský, M.; Žalud, Z. Climate change impacts and adaptation strategies in spring barley production in the Czech Republic. Clim. Chang. 2004, 64, 227–255. [Google Scholar] [CrossRef]
- Hao, B.; Xue, Q.; Marek, T.H.; Jessup, K.E.; Becker, J.D.; Hou, X.; Xu, W.; Bynum, E.D.; Bean, B.W.; Colaizzi, P.S.; et al. Grain yield, evapotranspiration, and water-use efficiency of maize hybrids differing in drought tolerance. Irrig. Sci. 2019, 37, 25–34. [Google Scholar] [CrossRef]
- Fučík, P.; Zajíček, A.; Duffková, R. Water quality of agricultural drainage systems in the Czech Republic—Options for its improvement. In Research and Practices in Water Quality, 1st ed.; Lee, T.S., Ed.; IntechOpen Limited: London, UK, 2015; pp. 239–262. [Google Scholar]
- Gramlich, A.; Stoll, S.; Stamm, C.; Walter, T.; Prasuhn, V. Effects of artificial land drainage on hydrology, nutrient and pesticide fluxed from Agricultural fields-A review. Agric. Ecosyst. Environ. 2018, 266, 84–99. [Google Scholar] [CrossRef]
- Kulhavý, Z.; Kvítek, T.; Březina, K.B.; Zajíček, A.; Pelíšek, I.; Lexa, M. A phenomenon of land drainage in catchment areas. In Retention and Water Quality in Catchments of the Dam Švihov on the Želivka River, 1st ed.; Kvítek, T., Ed.; The River Vltava Catchment Area, State Company: Prague, Czech Republic, 2017; pp. 63–68. [Google Scholar]
- Fučík, P.; Zajíček, A.; Kaplická, M.; Duffková, R.; Peterková, J.; Maxová, J.; Takáčová, Š. Incorporating rainfall-runoff events into nitrate-nitrogen and phosphorus load assessments for small tile-drained catchments. Water-SUI 2017, 9, 712. [Google Scholar] [CrossRef]
- Zajíček, A.; Fučík, P.; Kaplická, M.; Liška, M.; Maxová, J.; Dobiáš, J. Pesticide leaching by agricultural drainage in sloping, mid-textured soil conditions–the role of runoff components. Water Sci. Technol. 2018, 77, 1879–1890. [Google Scholar] [CrossRef]
- Kulhavý, Z.; Čmelík, M.; Štibinger, J.; Macek, L.; Škripko, J. Reconstructing Land Drainage by Application of Methods for Drainage Runoff Regulation, 1st ed.; Research Institute for Soil and Water Conservation: Prague, Czech Republic, 2015; p. 58. [Google Scholar]
- Sojka, M.; Kozłowski, M.; Stasik, R.; Napierała, M.; Kesicka, B.; Wrózyński, R.; Jaskuła, J.; Liberacki, D.; Bykowski, J. Sustainable water management in agriculture-the impact of drainage water management on groundwater table dynamics and subsurface outflow. Sustainability 2019, 11, 4201. [Google Scholar] [CrossRef]


© 2019 by the authors. Licensee MDPI, Basel, Switzerland. This article is an open access article distributed under the terms and conditions of the Creative Commons Attribution (CC BY) license (http://creativecommons.org/licenses/by/4.0/).