Eco-Efficiency Assessment of Intensive Rice Production in Japan: Joint Application of Life Cycle Assessment and Data Envelopment Analysis

Abstract
:1. Introduction
2. Literature Review
3. Materials and Methods
3.1. Japanese Rice Production
3.2. Data Sources
3.3. Life Cycle Assessment
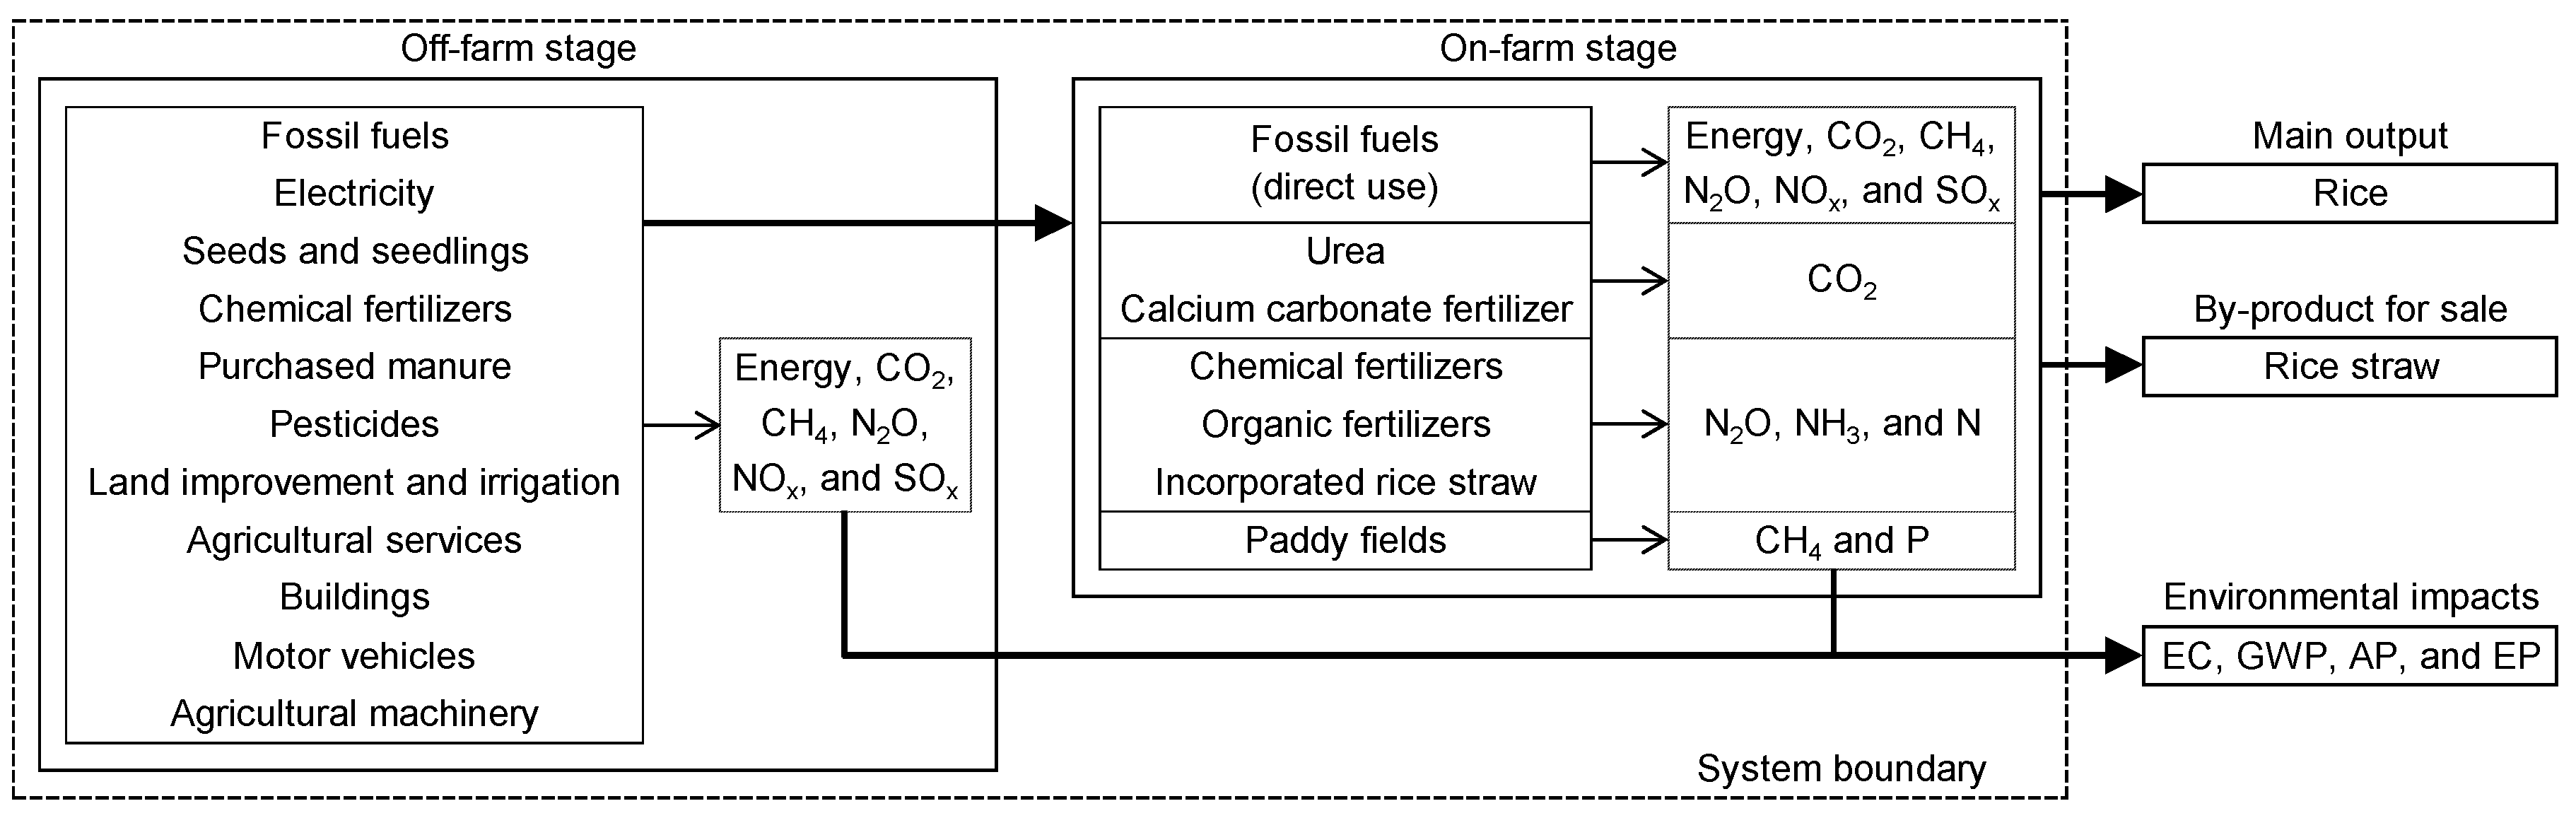
3.3.1. Goal and Scope Definition
3.3.2. Inventory Analysis
3.3.3. Impact Assessment
3.4. Data Envelopment Analysis
4. Results
4.1. Collected Data
4.2. Environmental Impacts
4.3. DEA Input and Output Data
4.4. Eco-Efficiency Scores and Operational Targets
5. Discussion
5.1. Factors That Improve Eco-Efficiency
5.2. Implications for Sustainable Intensification
5.3. Limitations
6. Conclusions
Funding
Conflicts of Interest
References
- Foley, J.A.; Ramankutty, N.; Brauman, K.A.; Cassidy, E.S.; Gerber, J.S.; Johnston, M.; Mueller, N.D.; O’Connell, C.; Ray, D.K.; West, P.C.; et al. Solutions for a cultivated planet. Nature 2011, 478, 337–342. [Google Scholar] [CrossRef] [PubMed] [Green Version]
- Tilman, D. Global environmental impacts of agricultural expansion: The need for sustainable and efficient practices. Proc. Natl. Acad. Sci. USA 1999, 96, 5995–6000. [Google Scholar] [CrossRef] [Green Version]
- Tilman, D.; Cassman, K.G.; Matson, P.A.; Naylor, R.; Polasky, S. Agricultural sustainability and intensive production practices. Nature 2002, 418, 671–677. [Google Scholar] [CrossRef] [PubMed]
- Verfaillie, H.A.; Bidwell, R. Measuring Eco-Efficiency: A Guide to Reporting Company Performance; World Business Council for Sustainable Development: Geneva, Switzerland, 2000. [Google Scholar]
- Guinée, J.B. Handbook on Life Cycle Assessment: Operational Guide to the ISO Standards; Kluwer Academic Publishers: Dordrecht, The Netherlands, 2002. [Google Scholar]
- Kuosmanen, T.; Kortelainen, M. Measuring eco-efficiency of production with data envelopment analysis. J. Ind. Ecol. 2005, 9, 59–72. [Google Scholar] [CrossRef]
- Cooper, W.W.; Seiford, L.M.; Tone, K. Data Envelopment Analysis: A Comprehensive Text with Models, Applications, References and DEA-Solver Software, 2nd ed.; Springer: New York, NY, USA, 2007. [Google Scholar]
- McKevith, B. Nutritional aspects of cereals. Nutr. Bull. 2004, 29, 111–142. [Google Scholar] [CrossRef]
- Organisation for Economic Co-operation and Development (OECD). Evaluation of Agricultural Policy Reforms in Japan; OECD Publishing: Paris, France, 2009. [Google Scholar]
- Barker, R.; Herdt, R.W. The Rice Economy of Asia; Resources for the Future: Washington, DC, USA, 1985. [Google Scholar]
- Hayashi, K.; Makino, N.; Shobatake, K.; Hokazono, S. Influence of scenario uncertainty in agricultural inputs on life cycle greenhouse gas emissions from agricultural production systems: The case of chemical fertilizers in Japan. J. Clean. Prod. 2014, 73, 109–115. [Google Scholar] [CrossRef]
- Masuda, K. Optimization model for mitigating global warming at the farm scale: An application to Japanese rice farms. Sustainability 2016, 8, 593. [Google Scholar] [CrossRef]
- Hokazono, S.; Hayashi, K. Variability in environmental impacts during conversion from conventional to organic farming: A comparison among three rice production systems in Japan. J. Clean. Prod. 2012, 28, 101–112. [Google Scholar] [CrossRef]
- Leon, A.; Kohyama, K. Estimating nitrogen and phosphorus losses from lowland paddy rice fields during cropping seasons and its application for life cycle assessment. J. Clean. Prod. 2017, 164, 963–979. [Google Scholar] [CrossRef]
- He, X.; Qiao, Y.; Liang, L.; Knudsen, M.T.; Martin, F. Environmental life cycle assessment of long-term organic rice production in subtropical China. J. Clean. Prod. 2018, 176, 880–888. [Google Scholar] [CrossRef]
- Khoshnevisan, B.; Rajaeifar, M.A.; Clark, S.; Shamahirband, S.; Anuar, N.B.; Shuib, N.L.M.; Gani, A. Evaluation of traditional and consolidated rice farms in Guilan Province, Iran, using life cycle assessment and fuzzy modeling. Sci. Total Environ. 2014, 481, 242–251. [Google Scholar] [CrossRef] [PubMed]
- Kim, S.; Kim, T.; Smith, T.M.; Suh, K. Environmental implications of eco-labeling for rice farming systems. Sustainability 2018, 10, 1050. [Google Scholar] [CrossRef]
- Tayefeh, M.; Sadeghi, S.M.; Noorhosseini, S.A.; Bacenetti, J.; Damalas, C.A. Environmental impact of rice production based on nitrogen fertilizer use. Environ. Sci. Pollut. Res. 2018, 25, 15885–15895. [Google Scholar] [CrossRef] [PubMed]
- Wang, M.; Xia, X.; Zhang, Q.; Liu, J. Life cycle assessment of a rice production system in Taihu region, China. Int. J. Sust. Dev. World 2010, 17, 157–161. [Google Scholar] [CrossRef]
- Chauhan, N.S.; Mohapatra, P.K.J.; Pandey, K.P. Improving energy productivity in paddy production through benchmarking: An application of data envelopment analysis. Energy Convers. Manag. 2006, 47, 1063–1085. [Google Scholar] [CrossRef]
- Houshyar, E.; Chen, B.; Chen, G.Q. Environmental impacts of rice production analyzed via social capital development: An Iranian case study with a life cycle assessment/data envelopment analysis approach. Ecol. Indic. 2019, 105, 675–687. [Google Scholar] [CrossRef]
- Masuda, K. Energy efficiency of intensive rice production in Japan: An application of data envelopment analysis. Sustainability 2018, 10, 120. [Google Scholar] [CrossRef]
- Nabavi-Pelesaraei, A.; Abdi, R.; Rafiee, S.; Taromi, K. Applying data envelopment analysis approach to improve energy efficiency and reduce greenhouse gas emission of rice production. Eng. Agric. Environ. Food 2014, 7, 155–162. [Google Scholar] [CrossRef]
- Nabavi-Pelesaraei, A.; Rafiee, S.; Mohtasebi, S.S.; Hosseinzadeh-Bandbafha, H.; Chau, K. Energy consumption enhancement and environmental life cycle assessment in paddy production using optimization techniques. J. Clean. Prod. 2017, 162, 571–586. [Google Scholar] [CrossRef]
- Nassiri, S.M.; Singh, S. Study on energy use efficiency for paddy crop using data envelopment analysis (DEA) technique. Appl. Energy 2009, 86, 1320–1325. [Google Scholar] [CrossRef]
- Mohammadi, A.; Rafiee, S.; Jafari, A.; Keyhani, A.; Dalgaard, T.; Knudsen, M.T.; Nguyen, T.L.; Borek, R.; Hermansen, J.E. Joint Life Cycle Assessment and Data Envelopment Analysis for the benchmarking of environmental impacts in rice paddy production. J. Clean. Prod. 2015, 106, 521–532. [Google Scholar] [CrossRef]
- Ministry of Agriculture, Forestry and Fisheries of Japan (MAFF). Pocketbook of Agriculture, Forestry and Fisheries Statistics in 2017; Association of Agriculture and Forestry Statistics: Tokyo, Japan, 2018. (In Japanese)
- Ministry of Agriculture, Forestry and Fisheries of Japan (MAFF). Production Cost of Rice, Wheat and Barley (2005–2011). Available online: http://www.maff.go.jp/j/tokei/kouhyou/noukei/seisanhi_nousan/ (accessed on 2 September 2015). (In Japanese)
- Ministry of Agriculture, Forestry and Fisheries of Japan (MAFF). Summary of Farming Income Stabilization Measures in 2018. Available online: http://www.maff.go.jp/j/kobetu_ninaite/keiei/attach/pdf/pamph-17.pdf (accessed on 6 November 2018). (In Japanese)
- Masuda, K. Measuring eco-efficiency of wheat production in Japan: A combined application of life cycle assessment and data envelopment analysis. J. Clean. Prod. 2016, 126, 373–381. [Google Scholar] [CrossRef]
- Nansai, K.; Kondo, Y.; Kagawa, S.; Suh, S.; Nakajima, K.; Inaba, R.; Tohno, S. Estimates of embodied global energy and air-emission intensities of Japanese products for building a Japanese input-output life cycle assessment database with a global system boundary. Environ. Sci. Technol. 2012, 46, 9146–9154. [Google Scholar] [CrossRef] [PubMed]
- Greenhouse Gas Inventory Office of Japan (GIO). National Greenhouse Gas. Inventory Report of Japan (2018); National Institute for Environmental Studies: Tsukuba, Japan, 2018.
- International Energy Agency (IEA). Energy Statistics Manual; IEA Publications: Paris, France, 2005. [Google Scholar]
- Kainou, K. Recommendation of Draft Revised Standard Calorific Value and Carbon Emission Factor for Fossil Fuel Energy Sources in Japan: 2013 FY Revised Standard Calorific Value and Carbon Emission Factor, Revised Edition (January 2016); RIETI Discussion Paper Series 14-J-047; Research Institute of Economy, Trade and Industry: Tokyo, Japan, 2016. (In Japanese)
- National Institute for Agro-Environmental Sciences (NIAES). Manual for Life Cycle Assessment of Agricultural Practices in Japan; NIAES: Tsukuba, Japan, 2003. (In Japanese)
- Association of Agriculture and Forestry Statistics (AAFS). Pocket Directory of Fertilizers 2011/2012; AAFS: Tokyo, Japan, 2013. (In Japanese) [Google Scholar]
- Ministry of Education, Culture, Sports, Science and Technology of Japan (MEXT). Food Composition Database. Available online: http://fooddb.mext.go.jp/ (accessed on 7 October 2015). (In Japanese)
- Owa, N. Nutrient balances of crops in Japan. Kanhonokenren News 1996, 33, 428–445. (In Japanese) [Google Scholar]
- Ministry of Agriculture, Forestry and Fisheries of Japan (MAFF). Statistics on Commodity Prices in Agriculture (2005–2011). Available online: http://www.maff.go.jp/j/tokei/kouhyou/noubukka/ (accessed on 5 October 2015). (In Japanese)
- National Agricultural Research Organization (NARO). Standard Tables of Feed Composition in Japan (2001); Japan Livestock Industry Association: Tokyo, Japan, 2002. (In Japanese)
- Asman, W.A.H. Ammonia Emission in Europe: Updated Emission and Emission Variations; Report No. 228471008; National Institute of Public Health and Environmental Protection: Bilthoven, The Netherlands, 1992. [Google Scholar]
- AMAFE Joint Research Team. User Manual of Decision Support System for Application of Manure and Fertilizer to Grassland and Forage Corn Field Based on Nutrient Recycling (AMAFE 2006); AMAFE Joint Research Team: Kitahiroshima, Japan, 2006. (In Japanese) [Google Scholar]
- Mannheim, T.; Braschkat, J.; Marschner, H. Ammonia emissions from senescing plants and during decomposition of crop residues. J. Plant. Nutr. Soil Sci. 1997, 160, 125–132, (In German with English abstract). [Google Scholar]
- Haruta, S.; Sudo, M.; Eguchi, S.; Okubo, T.; Kuroda, H.; Takeda, I.; Fujiwara, T.; Yamamoto, T.; Hitomi, T.; Shiratani, E.; et al. Effluent N, P and COD loads from paddy fields in Japan: A critical review. J. Jpn. Soc. Water Environ. 2015, 38, 81–91, (In Japanese with English abstract). [Google Scholar] [CrossRef]
- Greenhouse Gas Inventory Office of Japan (GIO). National Greenhouse Gas. Inventory Report of Japan (2013); National Institute for Environmental Studies: Tsukuba, Japan, 2013.
- Nansai, K. Estimation Methods of Sectoral Energy Consumption and Greenhouse Gas Emissions Based on 2005 Input-Output Tables, Revised Edition (August 2013). Available online: http://www.cger.nies.go.jp/publications/report/d031/jpn/pdf/6/3EID2005_Method_jp.pdf (accessed on 2 June 2016). (In Japanese)
- Stocker, T.F.; Qin, D.; Plattner, G.-K.; Tignor, M.; Allen, S.K.; Boschung, J.; Nauels, A.; Xia, Y.; Bex, V.; Midgley, P.M. Climate Change 2013: The Physical Science Basis; Cambridge University Press: New York, NY, USA, 2013. [Google Scholar]
- Jan, P.; Dux, D.; Lips, M.; Alig, M.; Dumondel, M. On the link between economic and environmental performance of Swiss dairy farms of the alpine area. Int. J. Life Cycl. Assess. 2012, 17, 706–719. [Google Scholar] [CrossRef] [Green Version]
- Tone, K. Slacks-based measure of efficiency. In Handbook on Data Envelopment Analysis, 2nd ed.; Cooper, W.W., Seiford, L.M., Zhu, J., Eds.; Springer: New York, NY, USA, 2011; pp. 195–209. [Google Scholar]
- Galanopoulos, K.; Aggelopoulos, S.; Kamenidou, I.; Mattas, K. Assessing the effects of managerial and production practices on the efficiency of commercial pig farming. Agr. Syst. 2006, 88, 125–141. [Google Scholar] [CrossRef]
- Lozano, S.; Iribarren, D.; Moreira, M.T.; Feijoo, G. The link between operational efficiency and environmental impacts: A joint application of Life Cycle Assessment and Data Envelopment Analysis. Sci. Total Environ. 2009, 407, 1744–1754. [Google Scholar] [CrossRef]
- Cooper, W.W.; Seiford, L.M.; Zhu, J. Data envelopment analysis: History, models, and interpretations. In Handbook on Data Envelopment Analysis, 2nd ed.; Cooper, W.W., Seiford, L.M., Zhu, J., Eds.; Springer: New York, NY, USA, 2011; pp. 1–39. [Google Scholar]
- SaiTech. User’s Guide to DEA-Solver-PRO (Professional Version 14.0); SaiTech: Holmdel, NJ, USA, 2017. [Google Scholar]
- Social Survey Research Information Co., Ltd. (SSRI). BellCurve for Excel. Available online: https://bellcurve.jp/ex/ (accessed on 3 December 2018). (In Japanese).
- Duffy, M. Economies of size in production agriculture. J. Hunger Environ. Nutr. 2009, 4, 375–392. [Google Scholar] [CrossRef]
- Ministry of Agriculture, Forestry and Fisheries of Japan (MAFF). Prefectural Recommendations of Fertilizers. Available online: http://www.maff.go.jp/j/seisan/kankyo/hozen_type/h_sehi_kizyun/ (accessed on 9 January 2019). (In Japanese)
- ZEN-NOH. Side-Dressing Technique of Fertilizer for Rice Production. Available online: https://www.zennoh.or.jp/eigi/research/pdf/technology_03.pdf (accessed on 8 January 2019). (In Japanese).
- Reinhard, S.; Lovell, C.A.K.; Thijssen, G. Econometric estimation of technical and environmental efficiency: An application to Dutch dairy farms. Amer. J. Agr. Econ. 1999, 81, 44–60. [Google Scholar] [CrossRef]
- Deng, X.; Gibson, J. Improving eco-efficiency for the sustainable agricultural production: A case study in Shandong, China. Technol. Forecast. Soc. 2019, 144, 394–400. [Google Scholar] [CrossRef]

| Rice Farm Size (ha Per Farm) | |||||||||
|---|---|---|---|---|---|---|---|---|---|
| <0.5 | 0.5 to <1 | 1 to <2 | 2 to <3 | 3 to <5 | 5 to <7 | 7 to <10 | 10 to <15 | ≥15 | |
| Production costs (thousand yen/ha) 2,3 | |||||||||
| Fossil fuels | 31.8 | 30.7 | 29.9 | 28.7 | 28.5 | 27.9 | 29.6 | 31.7 | 27.9 |
| (3.4) | (2.6) | (2.5) | (2.8) | (3.5) | (2.6) | (3.4) | (3.6) | (3.5) | |
| Electricity | 4.4 | 5.5 | 7.3 | 7.2 | 6.5 | 7.3 | 6.5 | 7.3 | 5.4 |
| (0.7) | (0.8) | (0.4) | (0.7) | (0.4) | (0.6) | (0.5) | (1.1) | (0.7) | |
| Seeds and seedlings | 66.8 | 46.3 | 32.8 | 23.9 | 23.4 | 20.5 | 18.1 | 16.6 | 16.1 |
| (5.3) | (5.4) | (3.3) | (0.9) | (2.6) | (1.4) | (1.9) | (1.1) | (0.5) | |
| Chemical fertilizers | 88.3 | 81.8 | 75.5 | 75.8 | 71.5 | 76.6 | 69.7 | 63.0 | 64.3 |
| (8.8) | (7.7) | (5.4) | (7.7) | (6.5) | (5.4) | (9.3) | (5.5) | (3.8) | |
| Purchased manure 4 | 4.1 | 4.1 | 4.6 | 2.4 | 1.9 | 3.4 | 1.3 | 2.4 | 3.3 |
| (1.0) | (1.0) | (0.4) | (1.1) | (1.0) | (0.8) | (1.4) | (0.8) | (1.9) | |
| Pesticides | 72.5 | 68.6 | 66.5 | 64.3 | 62.4 | 66.4 | 61.7 | 55.2 | 49.5 |
| (3.8) | (2.8) | (3.6) | (3.3) | (3.1) | (5.4) | (4.5) | (4.2) | (3.4) | |
| Land improvement and irrigation | 42.5 | 43.6 | 47.3 | 49.0 | 52.7 | 55.8 | 51.7 | 55.7 | 49.0 |
| (7.0) | (10.1) | (5.5) | (6.2) | (13.1) | (5.5) | (7.5) | (3.9) | (5.3) | |
| Agricultural services | 232.4 | 180.8 | 112.1 | 81.5 | 67.6 | 55.9 | 58.9 | 57.0 | 51.6 |
| (19.7) | (14.9) | (15.1) | (8.4) | (11.7) | (9.8) | (9.7) | (8.8) | (4.8) | |
| Buildings | 107.4 | 82.9 | 56.0 | 37.7 | 30.5 | 25.7 | 33.8 | 38.2 | 33.4 |
| (35.0) | (23.8) | (10.8) | (6.3) | (4.5) | (5.5) | (4.4) | (5.1) | (4.0) | |
| Motor vehicles | 66.2 | 50.5 | 32.8 | 26.1 | 21.0 | 16.8 | 15.9 | 16.3 | 13.2 |
| (14.5) | (5.5) | (3.6) | (5.5) | (1.0) | (2.5) | (2.7) | (3.5) | (1.9) | |
| Agricultural machinery | 309.5 | 303.1 | 246.4 | 197.1 | 194.1 | 159.3 | 158.0 | 147.9 | 151.4 |
| (61.6) | (37.9) | (12.7) | (13.8) | (13.9) | (14.3) | (25.6) | (11.9) | (7.2) | |
| Fossil fuels (L/ha) 2 | |||||||||
| Heavy oil | 0 | 0.1 | 0 | 0 | 0 | 0.1 | 0 | 0 | 0 |
| (0) | (0.4) | (0) | (0) | (0) | (0.4) | (0) | (0) | (0) | |
| Diesel oil | 111.4 | 116.4 | 116.7 | 119.4 | 120.1 | 121.2 | 136.0 | 153.9 | 152.8 |
| (11.6) | (7.9) | (1.6) | (8.7) | (7.8) | (2.4) | (6.2) | (11.4) | (9.2) | |
| Kerosene | 34.4 | 43.4 | 73.4 | 79.9 | 88.4 | 98.2 | 108.9 | 109.8 | 103.4 |
| (4.8) | (2.9) | (5.2) | (6.8) | (9.7) | (4.8) | (5.0) | (16.2) | (9.0) | |
| Gasoline | 94.2 | 88.2 | 75.6 | 72.2 | 67.0 | 59.4 | 60.1 | 64.7 | 44.5 |
| (5.0) | (4.0) | (4.5) | (7.2) | (2.9) | (7.6) | (3.2) | (5.5) | (10.2) | |
| Motor oil | 5.0 | 3.6 | 3.5 | 3.4 | 2.5 | 3.1 | 2.5 | 3.2 | 1.8 |
| (1.2) | (0.7) | (0.5) | (0.5) | (0.5) | (0.7) | (0.5) | (0.5) | (0.4) | |
| Premixed fuel | 19.4 | 15.1 | 8.9 | 4.6 | 4.3 | 2.9 | 2.9 | 2.5 | 0.8 |
| (1.6) | (1.4) | (1.3) | (1.1) | (0.8) | (0.6) | (1.1) | (1.1) | (0.7) | |
| Chemical fertilizers for CO2 emission sources (kg/ha) 2 | |||||||||
| Urea | 1.0 | 0.7 | 1.3 | 1.3 | 1.1 | 1.7 | 1.7 | 3.1 | 5.0 |
| (0.6) | (0.9) | (0.9) | (0.7) | (1.0) | (0.9) | (2.2) | (2.7) | (5.2) | |
| Calcium carbonate fertilizer | 1.0 | 18.7 | 1.7 | 8.8 | 5.0 | 8.6 | 7.7 | 1.9 | 1.2 |
| (1.1) | (5.0) | (1.4) | (10.5) | (5.5) | (15.5) | (9.8) | (2.4) | (2.2) | |
| Nitrogen inputs (kg N/ha) 2 | |||||||||
| Chemical fertilizers | 66.6 | 64.8 | 58.3 | 61.0 | 55.9 | 61.5 | 62.5 | 56.7 | 57.9 |
| (3.3) | (3.9) | (3.4) | (2.8) | (5.2) | (2.9) | (2.8) | (6.6) | (7.2) | |
| Organic fertilizers 4 | 4.0 | 6.1 | 5.2 | 3.1 | 3.1 | 5.2 | 2.6 | 2.9 | 4.4 |
| (0.9) | (2.1) | (1.1) | (1.5) | (0.9) | (1.1) | (2.8) | (1.7) | (1.6) | |
| Incorporated rice straw | 23.5 | 22.9 | 23.7 | 24.3 | 24.2 | 24.9 | 25.5 | 24.0 | 23.6 |
| (1.1) | (1.6) | (1.7) | (0.9) | (1.7) | (1.5) | (2.5) | (1.4) | (2.8) | |
| Total | 94.1 | 93.8 | 87.2 | 88.5 | 83.3 | 91.5 | 90.6 | 83.6 | 86.0 |
| (4.2) | (4.0) | (4.1) | (4.3) | (6.4) | (2.9) | (3.6) | (7.9) | (11.0) | |
| Rice yield (kg/ha) | 5084 | 5040 | 5113 | 5231 | 5277 | 5346 | 5419 | 5380 | 5207 |
| (131) | (80) | (72) | (128) | (93) | (139) | (189) | (194) | (131) | |
| Allocation ratio | 0.978 | 0.977 | 0.978 | 0.978 | 0.977 | 0.978 | 0.979 | 0.974 | 0.976 |
| (0.002) | (0.003) | (0.004) | (0.002) | (0.003) | (0.004) | (0.005) | (0.003) | (0.006) | |
| Rice Farm Size (ha Per Farm) | |||||||||
|---|---|---|---|---|---|---|---|---|---|
| <0.5 | 0.5 to <1 | 1 to <2 | 2 to <3 | 3 to <5 | 5 to <7 | 7 to <10 | 10 to <15 | ≥15 | |
| EC (GJ/ha) | 64.2 | 58.9 | 51.1 | 45.5 | 43.6 | 42.1 | 42.0 | 42.3 | 39.0 |
| (5.8) | (3.4) | (1.2) | (2.0) | (1.2) | (1.5) | (1.9) | (1.5) | (1.8) | |
| GWP (kg CO2 eq./ha) | 14902 | 14410 | 13727 | 13263 | 13086 | 12987 | 12961 | 12880 | 12682 |
| (1002) | (801) | (553) | (689) | (495) | (639) | (637) | (484) | (393) | |
| CO2 | 34.3% | 32.5% | 29.5% | 27.3% | 26.5% | 25.8% | 25.7% | 25.7% | 24.4% |
| CH4 | 63.8% | 65.7% | 68.7% | 70.9% | 71.8% | 72.3% | 72.5% | 72.6% | 73.8% |
| N2O | 1.9% | 1.8% | 1.8% | 1.8% | 1.7% | 1.8% | 1.8% | 1.7% | 1.8% |
| AP (kg SO2 eq./ha) | 23.0 | 21.5 | 18.9 | 17.9 | 16.8 | 17.1 | 17.2 | 16.9 | 16.7 |
| (1.5) | (0.8) | (0.4) | (0.6) | (0.8) | (0.4) | (0.6) | (0.7) | (0.8) | |
| NOx | 31.4% | 31.1% | 30.9% | 29.8% | 30.5% | 29.1% | 29.7% | 31.2% | 29.6% |
| SOx | 38.7% | 37.4% | 35.9% | 33.6% | 33.9% | 32.0% | 31.7% | 32.2% | 30.8% |
| NH3 | 29.9% | 31.5% | 33.2% | 36.6% | 35.6% | 38.9% | 38.7% | 36.6% | 39.6% |
| EP (kg PO4 eq./ha) | 31.5 | 31.4 | 30.3 | 30.4 | 29.6 | 30.7 | 30.7 | 29.6 | 30.0 |
| (0.5) | (0.6) | (0.6) | (0.6) | (1.0) | (0.4) | (0.6) | (1.1) | (1.6) | |
| NOx | 4.2% | 4.0% | 3.6% | 3.3% | 3.2% | 3.0% | 3.1% | 3.3% | 3.1% |
| NH3 | 4.1% | 4.0% | 3.9% | 4.0% | 3.8% | 4.0% | 4.0% | 3.9% | 4.1% |
| N | 37.6% | 37.7% | 36.2% | 36.7% | 35.4% | 37.5% | 37.2% | 35.5% | 36.1% |
| P | 54.1% | 54.3% | 56.3% | 56.1% | 57.6% | 55.5% | 55.7% | 57.3% | 56.7% |
| EC | GWP | AP | EP | |
|---|---|---|---|---|
| EC | 1 | |||
| GWP | 0.855 ** | 1 | ||
| AP | 0.978 ** | 0.815 ** | 1 | |
| EP | 0.489 ** | 0.188 | 0.604 ** | 1 |
| Rice Farm Size (ha Per Farm) | |||||||||
|---|---|---|---|---|---|---|---|---|---|
| <0.5 | 0.5 to <1 | 1 to <2 | 2 to <3 | 3 to <5 | 5 to <7 | 7 to <10 | 10 to <15 | ≥15 | |
| GWP (kg CO2 eq./ha) | |||||||||
| 2005 | 13855 | 13652 | 13144 | 12483 | 12659 | 12278 | 12402 | 12380 | 12369 |
| 2006 | 13789 | 13315 | 13151 | 12511 | 12369 | 12244 | 12148 | 12251 | 12224 |
| 2007 | 14136 | 13910 | 13315 | 12827 | 12766 | 12588 | 12507 | 12596 | 12513 |
| 2008 | 15031 | 14778 | 13920 | 13384 | 13346 | 13174 | 13038 | 12980 | 12879 |
| 2009 | 15333 | 14584 | 13748 | 13450 | 13202 | 13135 | 13151 | 13073 | 12447 |
| 2010 | 16303 | 15394 | 14535 | 14251 | 13636 | 13867 | 13770 | 13495 | 13254 |
| 2011 | 15870 | 15241 | 14275 | 13938 | 13620 | 13621 | 13709 | 13384 | 13091 |
| EP (kg PO4 eq./ha) | |||||||||
| 2005 | 32.2 | 32.1 | 31.4 | 30.7 | 31.5 | 30.9 | 31.6 | 31.0 | 31.4 |
| 2006 | 32.2 | 31.6 | 30.7 | 30.4 | 30.0 | 30.6 | 31.0 | 30.7 | 31.7 |
| 2007 | 31.2 | 31.5 | 30.0 | 30.4 | 29.4 | 30.3 | 30.6 | 30.2 | 31.7 |
| 2008 | 31.2 | 31.4 | 30.4 | 30.7 | 29.9 | 31.1 | 30.2 | 29.4 | 29.9 |
| 2009 | 31.0 | 30.2 | 30.1 | 29.7 | 29.0 | 30.3 | 30.2 | 29.1 | 28.1 |
| 2010 | 31.1 | 31.4 | 29.9 | 31.4 | 28.6 | 31.5 | 31.0 | 27.9 | 28.8 |
| 2011 | 31.9 | 31.4 | 29.5 | 29.6 | 28.9 | 30.6 | 30.1 | 29.1 | 28.6 |
| Rice yield (kg/ha) 1 | |||||||||
| 2005 | 5180 | 5110 | 5190 | 5240 | 5330 | 5410 | 5580 | 5640 | 5310 |
| 2006 | 4920 | 4980 | 5040 | 5070 | 5260 | 5350 | 5400 | 5420 | 5370 |
| 2007 | 4910 | 5090 | 5010 | 5080 | 5250 | 5360 | 5280 | 5300 | 5230 |
| 2008 | 5150 | 5160 | 5200 | 5400 | 5450 | 5570 | 5760 | 5580 | 5240 |
| 2009 | 5140 | 5000 | 5110 | 5180 | 5230 | 5210 | 5230 | 5240 | 5030 |
| 2010 | 5040 | 4940 | 5090 | 5300 | 5150 | 5140 | 5290 | 5080 | 5030 |
| 2011 | 5250 | 5000 | 5150 | 5350 | 5270 | 5380 | 5390 | 5400 | 5240 |
| Rice Farm Size (ha Per Farm) | |||||||||
|---|---|---|---|---|---|---|---|---|---|
| <0.5 | 0.5 to <1 | 1 to <2 | 2 to <3 | 3 to <5 | 5 to <7 | 7 to <10 | 10 to <15 | ≥15 | |
| 2005–2008 average | 0.909 | 0.919 | 0.951 | 0.976 | 0.985 | 0.988 | 0.993 | 0.997 | 0.978 |
| 2006–2009 average | 0.880 | 0.896 | 0.929 | 0.953 | 0.979 | 0.974 | 0.983 | 0.989 | 0.977 |
| 2007–2010 average | 0.866 | 0.880 | 0.921 | 0.938 | 0.970 | 0.955 | 0.970 | 0.991 | 0.974 |
| 2008–2011 average | 0.856 | 0.870 | 0.918 | 0.937 | 0.964 | 0.940 | 0.957 | 0.988 | 0.979 |
| Cumulative average | 0.878 | 0.891 | 0.930 | 0.951 | 0.975 | 0.964 | 0.976 | 0.991 | 0.977 |
| Rice Farm Size (ha Per Farm) | |||||||||
|---|---|---|---|---|---|---|---|---|---|
| <0.5 | 0.5 to <1 | 1 to <2 | 2 to <3 | 3 to <5 | 5 to <7 | 7 to <10 | 10 to <15 | ≥15 | |
| GWP | |||||||||
| Potential reduction (kg CO2 eq./ha) | 2419 | 1973 | 1241 | 670 | 463 | 381 | 300 | 131 | 205 |
| Potential reduction rate (%) | 16.2 | 13.7 | 9.0 | 5.1 | 3.5 | 2.9 | 2.3 | 1.0 | 1.6 |
| EP | |||||||||
| Potential reduction (kg PO4 eq./ha) | 2.7 | 2.6 | 1.5 | 1.5 | 0.5 | 1.3 | 0.8 | 0.2 | 0.9 |
| Potential reduction rate (%) | 8.5 | 8.3 | 5.1 | 4.9 | 1.6 | 4.3 | 2.7 | 0.8 | 3.1 |
| Rice yield | |||||||||
| Potential increase (kg/ha) | 76.9 | 65.6 | 40.0 | 24.4 | 0 | 0 | 0 | 0 | 3.0 |
| Potential increase rate (%) | 1.5 | 1.3 | 0.8 | 0.5 | 0 | 0 | 0 | 0 | 0.1 |
© 2019 by the author. Licensee MDPI, Basel, Switzerland. This article is an open access article distributed under the terms and conditions of the Creative Commons Attribution (CC BY) license (http://creativecommons.org/licenses/by/4.0/).
Share and Cite
Masuda, K. Eco-Efficiency Assessment of Intensive Rice Production in Japan: Joint Application of Life Cycle Assessment and Data Envelopment Analysis. Sustainability 2019, 11, 5368. https://doi.org/10.3390/su11195368
Masuda K. Eco-Efficiency Assessment of Intensive Rice Production in Japan: Joint Application of Life Cycle Assessment and Data Envelopment Analysis. Sustainability. 2019; 11(19):5368. https://doi.org/10.3390/su11195368
Chicago/Turabian StyleMasuda, Kiyotaka. 2019. "Eco-Efficiency Assessment of Intensive Rice Production in Japan: Joint Application of Life Cycle Assessment and Data Envelopment Analysis" Sustainability 11, no. 19: 5368. https://doi.org/10.3390/su11195368
APA StyleMasuda, K. (2019). Eco-Efficiency Assessment of Intensive Rice Production in Japan: Joint Application of Life Cycle Assessment and Data Envelopment Analysis. Sustainability, 11(19), 5368. https://doi.org/10.3390/su11195368