Article

Struvite Phosphorus Recovery from Aerobically Digested Municipal Wastewater

1
Talquin Electric Cooperative Inc., Quincy, FL 32351, USA
2
North Florida Research and Education Center, University of Florida-IFAS, Quincy, FL 32351 USA
3
Soil and Water Sciences Department, University of Florida-IFAS, Gainesville, FL 32611 USA
*
Author to whom correspondence should be addressed.
Sustainability 2019, 11(2), 376; https://doi.org/10.3390/su11020376
Submission received: 21 November 2018 / Revised: 29 December 2018 / Accepted: 30 December 2018 / Published: 13 January 2019
(This article belongs to the Section Environmental Sustainability and Applications)

Abstract

:
Small, municipal wastewater treatment plants (WWTPs) that use aerobic digestion treat approximately 40% of the discharged wastewater in the USA, and yet they are an overlooked source of recoverable P. There are no known reports of small, aerobic WWTPs recovering P through struvite (MgNH4PO4·6H2O) precipitation for repurposing as a mineral fertilizer, even though some large WWTPs with anaerobic digestion are. Four small WWTPs in north Florida, USA, with treatment capacities from 371 to 2650 m3 wastewater d−1 and incoming P loads from 2 to 14 kg d−1 were investigated for their potential to produce struvite from digester filtrates. A chemical equilibrium model was used to predict the feasibility of struvite production and the results compared with actual WWTP filtrate measurements. Filtrates from aerobic digesters were able to form struvite if solution pH was increased by ≤1 pH unit. Depending on the WWTP, P recovery in filtrates through struvite precipitation ranged from 27–57% by mass at pH 8.5, via NaOH additions or air sparging. Increasing filtrate Mg concentrations improved P recovery up to 97%. Based upon these results, small WWTPs using aerobic digestion will be able to lower their P waste output through recovery as struvite fertilizer.

1. Introduction

Global phosphorus (P) demand continues to increase but it is debatable how long P reserves will last. Cordell et al. [1] suggested that P reserves may be exhausted within decades. If true, then it will be critical for the agriculture industry to identify alternative sources of P-based fertilizer. In contrast, Scholz et al. [2] contended that reserves will likely remain viable for hundreds of years, with demand-side production controlling prices and availability. If this argument is true, then preventing excess P from entering aquatic systems will be increasingly necessary, as projected P demand and use increases. Regardless, both arguments support the need for P recycling and recovery.
In the USA, there are over 14,000 municipal wastewater treatment plants (WWTPs) processing over 1736 m3 s−1 (33,000 million gallons per day) of wastewater [3]. National-scale, influent P concentration statistics are difficult to obtain, but total P concentrations entering a WWTP often range from 3–11 mg P L−1 [4]. If one considers an average influent concentration of 7.5 mg P L−1, then approximately 0.34 Tg P annually is being processed through WWTPs in the USA [3]. Wastewater P originates primarily from human excreta, food wastes, food additives, and detergents [5]. In comparison, the USA consumed 1.8 Tg P fertilizer in 2014 [6] or about 5 times the P mass being passed through WWTPs. However, if recovery and re-use was fully implemented, P fertilizer demand from phosphate rock can potentially be reduced 20%.
Technologies exist to recover almost all the P load entering WWTPs [7]. Phosphorus removal is primarily through an accumulation of biological solids. The biological solids are further processed to reduce volatile suspended solids and pathogens, which then are reclassified as biosolids. Biosolids are often used as an organic-based, nitrogen (N) or P fertilizer. Land-applied biosolids as fertilizer may sometimes be problematic when the fertilizer application rates are based upon biosolids N rather than P content. Mismatching crop demand with wastes having lower N:P ratios often leads to excessive P applications, thereby increasing P loss to the surrounding environment. For example, the relative uptake of N:P by crops is approximately 4:1, whereas biosolids N:P ratios are typically 2:1. Rather than taking advantage of their fertilizer value, biosolids are often transported to landfills. In fact, approximately a third of Florida’s biosolids are placed in landfills [8]. Landfilling of biosolids relegates potentially renewable P and other fertilizer nutrients into a non-recoverable waste. Phosphorus can also leave the WWTP via the effluent. Effluents must meet water quality standards of the receiving waters. For example, Florida streams have 0.18 mg L−1 total P limit. Effluent may also be applied to spray fields, or further processed using other technologies.
Among all the WWTPs in the USA, over a third of wastewater treatment (based upon flow) occurs at small (≤38,000 m3 wastewater d−1) operations. The processed P is typically sequestered into biosolids [9] and a fraction of the P leaves the plant via the effluent. Although there are a variety of P recovery technologies available to large plants (>38,000 m3 d−1) [7], and more specifically anaerobically treated wastewater, the small WWTPs nearly universally rely on aerobic treatments [10]. They often lack the capital, economies of scale, operational staffing and the physical area to implement expensive technologies, such as anaerobic processing, which favors struvite formation.
Recovering P through struvite (MgNH4PO4·6H2O) precipitation is an attractive option for P recovery from municipal wastewater. A general equation for struvite is:
Mg2+ + NH4+ + PO43− + 6H2O → MgNH4PO4 + 6H2O
Struvite precipitation is controlled by a combination of physio-chemical factors affecting both nucleation and crystal growth. These include temperature, mixing energy, pH, the degree of Mg, NH4, and PO42− supersaturation, and the presence of competing ions. If conditions are favorable, struvite can be recovered from various liquid waste streams, including raw wastewater, landfill leachates, swine and dairy liquors, and anaerobic digester liquor supernatant/centrate/filtrates [11,12,13]. Spontaneous struvite precipitation in WWTPs was documented as early as 1939 [14] and was often associated with scaling in plumbing and clogged pumps. Using anaerobic-based WWTPs has resulted in 71–96% P recovery through struvite crystallization [15]. However, spontaneous struvite precipitation in small WWTPs is often not as thermodynamically favored. Also, converting smaller WWTPs to anaerobic treatment (more conducive to struvite formation) is typically cost prohibitive. Therefore, it is not surprising that large WWTPs have been targeted for developing struvite recovery strategies, leaving the smaller WWTPs behind [16,17,18].
Managing for struvite recovery at small WWTPs might be a valid P recovery option. The objectives of this study were to (1) model and measure struvite formation in unaltered and minimally modified filtrates recovered from four small, municipal WWTPs located in north Florida, USA, and (2) determine if struvite production at small WWTPs can be potentially economically feasible.

2. Materials and Methods

2.1. Wastewater Characterization

The four selected wastewater treatment plants (WWTPs) represent two commonly used variations of activated sludge wastewater treatment (Figure 1). Three of the WWTPs were sequencing batch reactors, where the activated sludge process was carried out in a single tank, and one WWTP was a complete-mix reactor, where the activated sludge was returned throughout the entire active sludge process [4,9]. The treatment capacities of the WWTPs ranged from 371 to 2650 m3 wastewater d−1 (Table 1). The incoming P load to the WWTPs ranged from 2.0–17.6 kg d−1 and the treated effluent P load ranged from 0.6–4.9 kg d−1. The resulting biosolids P content ranged from 1.4–5.8% on a dry mass basis.
Aerobically digested filtrate samples were collected according to the US Environmental Protection Agency (USEPA) sludge sampling and analysis guidance document [19]. The samples were collected from a discharge line or directly from the reactor (digester) via a submersible pump, into 1-L glass jars, cooled to 4 °C (ice chest), returned to the laboratory and stored at 4 °C, until being analyzed (up to 24 h holding time). Each location was sampled every other month, from August 2014 to September 2015.
The aerobically digested sludge filtrates were measured for struvite precursors NH4-N, PO4-P, and Mg2+ (Table 2). Additionally, Al3+, Ca2+, and Fe3+, known to interfere with struvite formation at concentrations typically found in aerobically digested filtrate, were measured. Filtrate NH4-N was measured using standard method SM-4500-NH3 [20]; PO4-P was measured using standard method SM-4500B-C; and alkalinity was measured by Hach Method 10239 on a Hach DR3900 spectrophotometer (Hach Co., Loveland, CO, USA). Additionally, Ca2+, Mg2+, Fe3+, and Al3+ were measured by inductively coupled plasma-atomic emission spectrometry (ICPAES, EPA Method 200.7) [21]. The filtrate pH and oxidative reduction potential (ORP) were measured with an Oakton pH 300 series meter and probe (Oakton, Vernon Hills, IL, USA).

2.2. Model Predictions

Filtrate chemical data were used in the Visual MINTEQ Version 3.0 speciation model [22], to predict struvite production from filtrates. The model incorporated pH values from 4 to 14, in increments of 0.1 units, the ionic strength was set to µ = 0.1, and precipitates were not allowed at 25 °C [22]. Typically, struvite production occurs when the ion activation potential (IAP) exceeds the log activity solubility product, which in this case was pKso = 13.26 [23]. The IAP was plotted against pH to determine an optimal pH that allowed for struvite formation and minimal co-precipitate formation.
To quantify potential co-precipitates during struvite formation, the model was executed a second time at 25 °C, but allowing for other solid phases, particularly in the presence of Ca2+ [24]. However, struvite kinetics is likely faster than amorphous calcium phosphate [ACP, Ca3(PO4)2], a precursor to hydroxyapatite [HAP, Ca5(PO4)3(OH)], magnesite (MgCO3) and newberyite (MgHPO4) [25,26], and therefore not expected in the product. Additionally, other slow-forming minerals were removed from model consideration [27]. The omitted species were bobierrite [Mg3(PO4)2·8H2O], dolomite [CaMg(CO3)2] [27], hydroxyapatite [HAP, Ca5(PO4)3(OH)], octacalcium phosphate [OCP, Ca8H2(PO4)6.5H2O], and tricalcium phosphate [TCP, Ca3(PO4)2] [25]. All other potential solids that might compete for PO43− and Mg2+ were allowed in the model.
Wastewater pH affects struvite precursor concentrations, especially NH4+, which can evolve as NH3 gas, along an increasing pH gradient. Struvite crystal size and formation can also be affected by system pH [12]. A constant pH of 8.5 was maintained by caustic addition for testing co-precipitate formation, since this was the value that modeled the greatest struvite yield, while minimizing unwanted co-precipitates. Typically, Mg2+ is the most limiting reagent in domestic wastewater struvite formation [16,17,18]. Therefore, Mg2+ concentrations from 1 to 10 mM, at 0.1 mM increments, were tested to determine its effect on struvite production, at a constant pH of 8.5.

2.3. Experimental Procedure

Filtrates from four different WWTPs were used to compare against the modeled results. For each test, a 2-L glass beaker with magnetic stirrer represented a continuous stirred-tank reactor (CSTR). For the first experiment, the pH in the CSTR was adjusted and maintained at pH 8.5 through additions of 5 N NaOH. For the second experiment, the pH in the CSTR was initially adjusted to pH 8.5 using air sparging and then monitored until termination. Sparging was through a Sweetwater Air Diffuser (bubble size 1–3 mm) (Pentair Aquatic Eco-Systems, Cary, NC, USA) placed on the bottom of the beaker. The diffuser delivered air at 8.5 L min−1 for 30 min, when the experiment was terminated. Stirring or air sparging wastewater can contribute to struvite nucleation induction without the use of a seedbed [13,16,23].
A third experiment tested filtrate dosing with Mg2+ from Location 1 WWTP, using an A&F Machine Four Station Portable Jar Mixer (Novatech, Berea, OH, USA) with 1-L glass beakers managed as CSTRs. A 1 M Mg2+ stock solution was prepared by dissolving MgSO4·7H2O in ultra-pure Type I deionized/distilled water. Treatments were 0, 24, 48, and 73 mg Mg additions.
The CSTR pH was controlled at 8.5 during each 30-min experiment that also included continual stirring. The beakers were then covered with Parafilm™ and allowed to settle for 24 h at 25 °C. Precipitate was passed through a Whatman 42 filter, triple-washed with ultra-pure Type I deionized/distilled water, air-dried for 24 h, transferred to a desiccator for 24 h, and then weighed. The supernatant was collected and analyzed for NH4-N, PO4-P, and Mg2+ to determine analyte loss from solution. The precipitate from Location 1 WWTP was characterized by X-ray diffraction (XRD) analysis on a computer-controlled diffractometer equipped with stepping motor and graphite crystal monochromator (Ultima IV X-Ray Diffractometer, Rigaku Corp., Tokyo, Japan). Identification of phase peaks was accomplished by comparing the observed XRD patterns to standards compiled by the Joint Committee on Powder Diffraction Standards [28]. Solids recovery from the other WWTP locations were not confirmed by XRD. Supernatant N, P, and Mg2+ concentrations initially (T0) and after 24 h (T24) were analyzed and used to quantify struvite formation, using Equation (2) [24].
[Struvite] = [C]Precipitated = [C]Initial − [C]Final
where,
[C]Initial is the concentration in solution of NH4-N, PO4-P, and Mg2+ at T0.
[C]Final is the concentration in solution of NH4-N, PO4-P, and Mg2+ at T24.
The percent recovery of N, P, and Mg2+ as struvite were calculated using Equation (3).
%   R e c o v e r y = [ C ] I n t i a l [ C ] F i n a l [ C ] I n t i a l   ×   100
Struvite yield was determined as the mass of precipitate formed expressed as a percentage of the calculated (using the model) mass of struvite.

2.4. Statistical Analyses

A mixed model (PROC MIXED) method was used (SAS, version 9.4, SAS Institute, Cary, NC, USA) for assessing struvite precipitation of filtrates treated by NaOH additions or air sparging from four locations. Data were subjected to two-way Analysis of Variance (ANOVA) for assessing pH management by location (two replicates). When significant differences were observed, multiple comparisons were conducted with the Tukey method (p < 0.05).

3. Results

3.1. Filtrate Characterization

Filtrate characterization from the four WWTPs is given in Table 2. Location 1 samples had NH4-N and PO4-P concentrations that were at least twice the concentrations found at the other WWTPs, and alkalinity was highest at this location, as well. In comparison, P-competing species Ca2+, Fe3+, and Al3+ concentrations were similar among all locations (Table 2). The model indicated that the measured concentrations of Al3+, Ca2+, and Fe3+ did not interfere with struvite formation and they were not addressed further. Location 4 WWTP was subjected to significant infiltration and inflow into the sewer collection systems during the study period, which caused washouts of the aerobic digester’s microbial biomass (sludge) into the effluent, thereby diluting the digester. The concomitantly lower PO4-P and Mg2+ concentrations resulted in lower struvite production compared to the other WWTPs in this study.

3.2. Effect of NaOH, Sparging and Mg on Struvite Precipitation

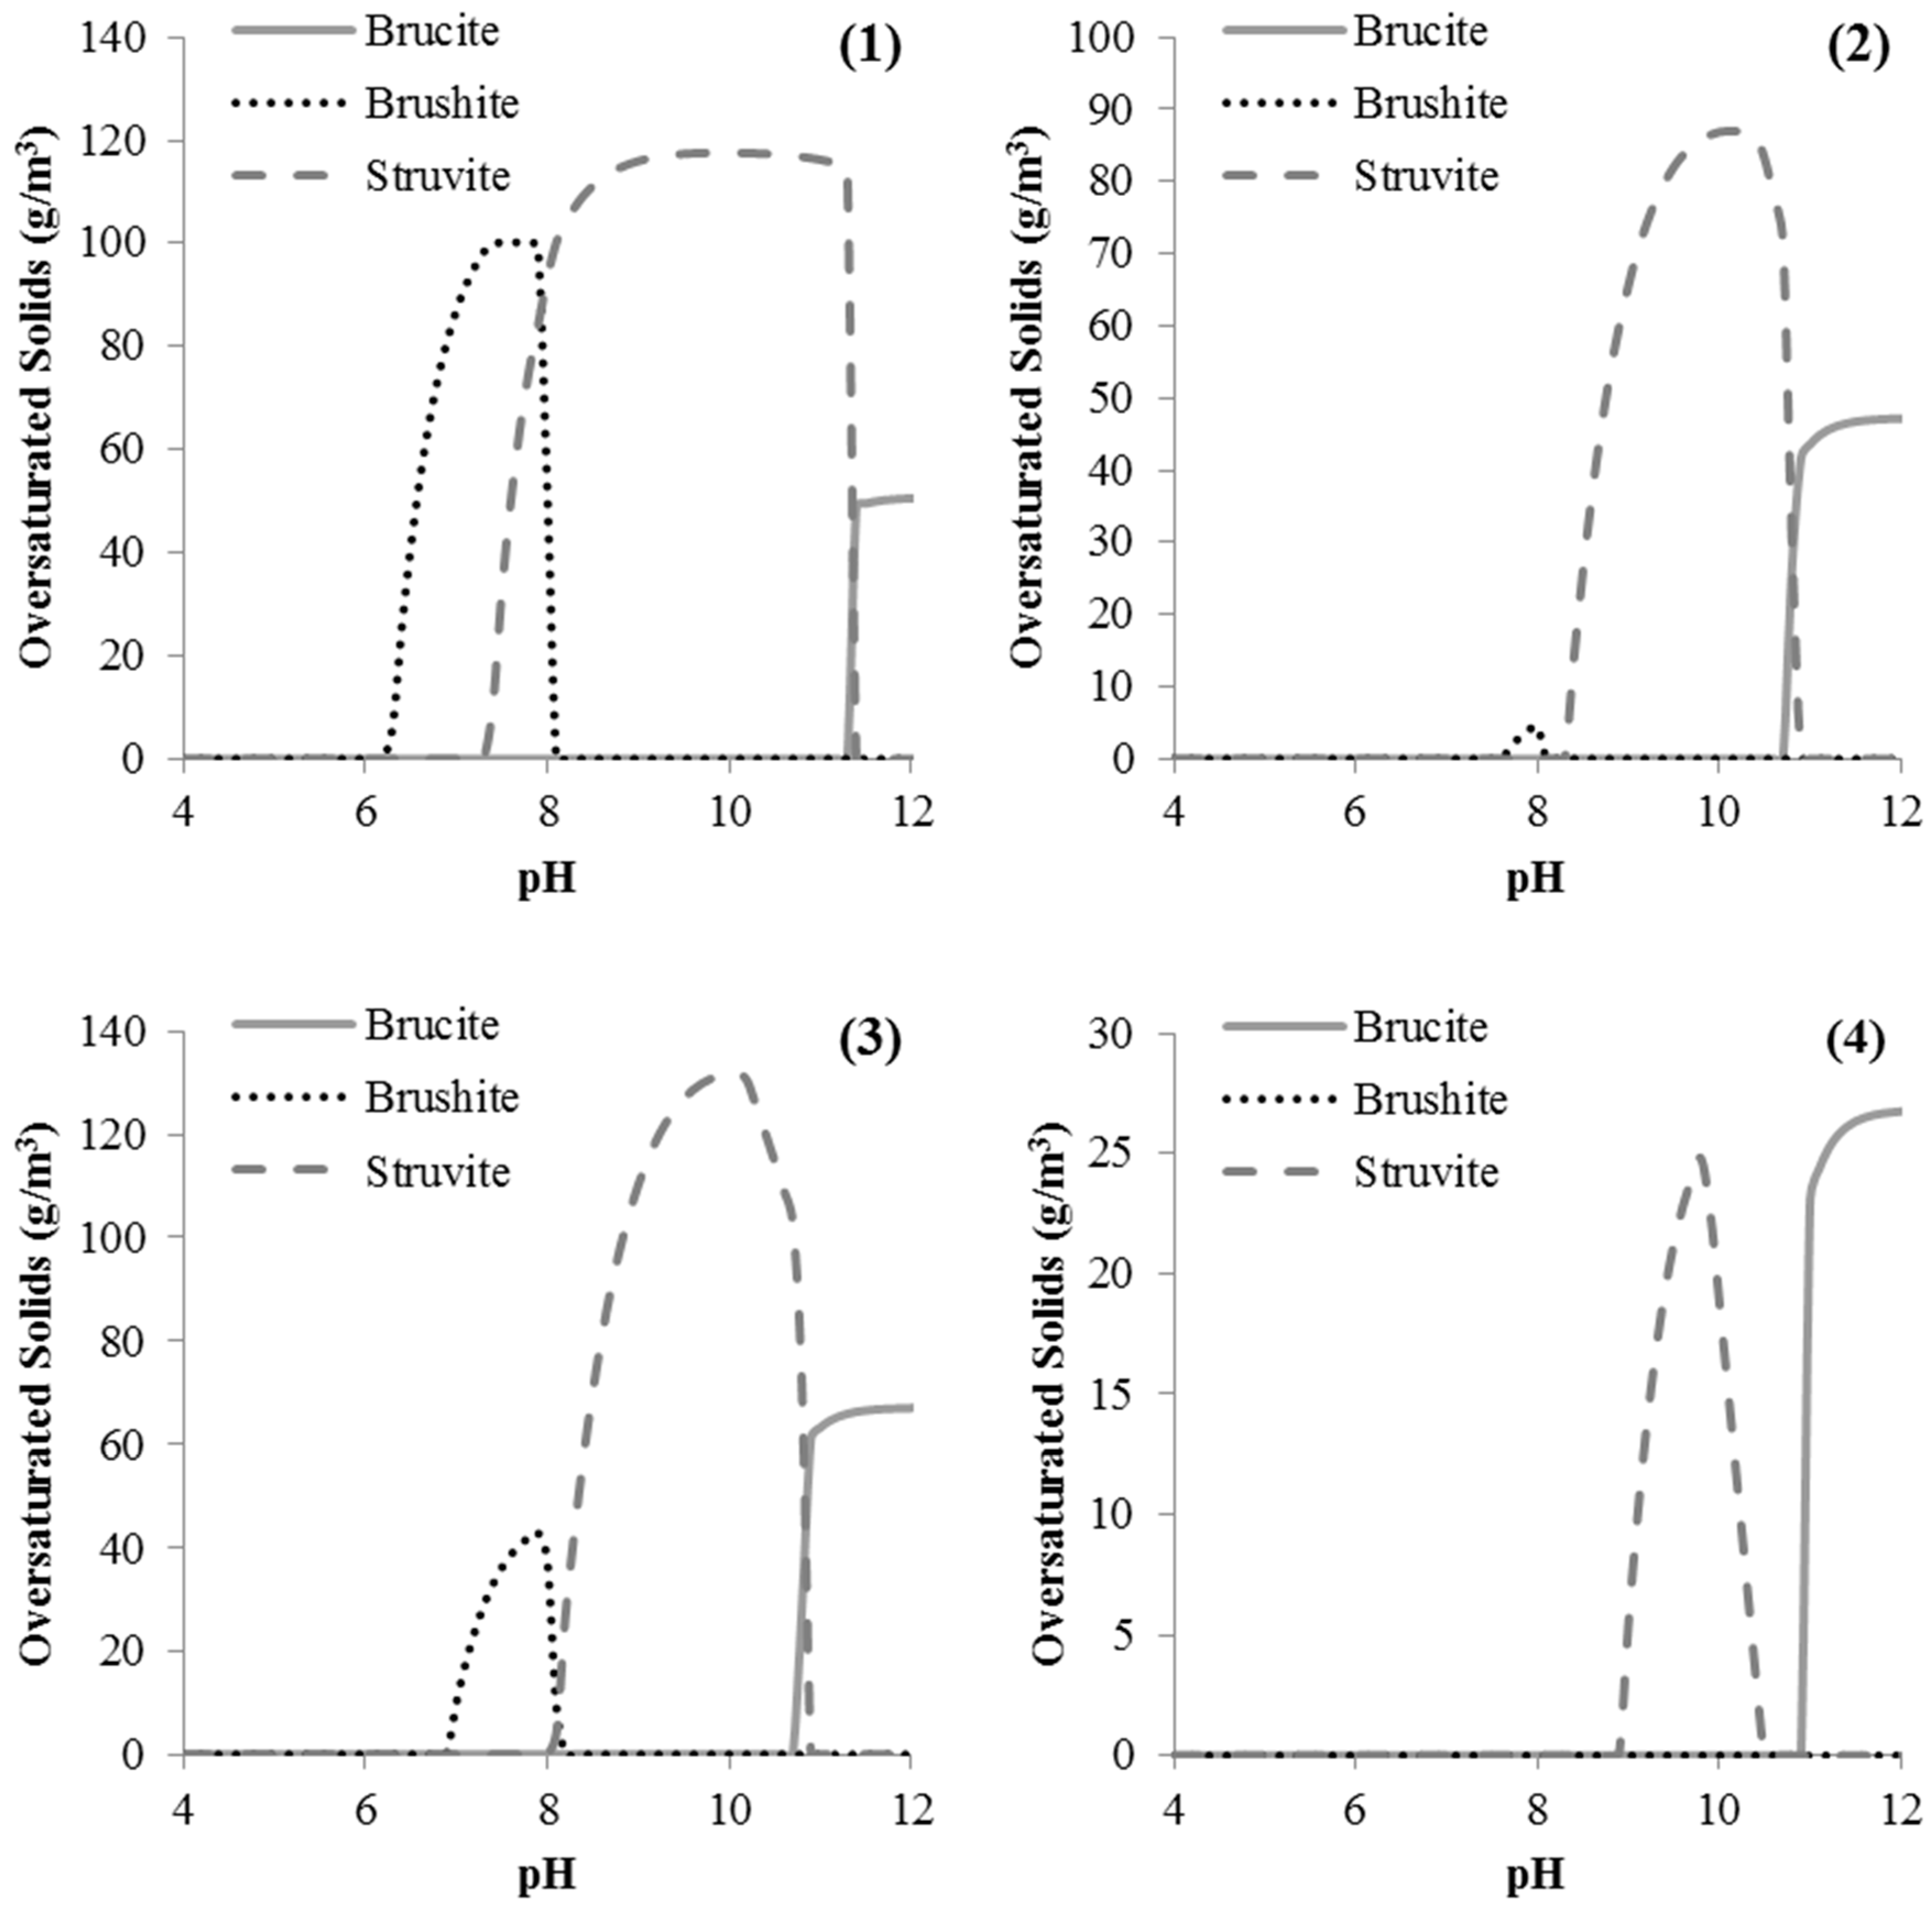
The model predicted that all four of the WWTP filtrates had NH4-N, PO4-P, and Mg2+ concentrations adequate for struvite precipitation, once the pH was increased (Table 3). The predicted maximum struvite oversaturation for all locations was below pH 10.3, using a product solubility constant (pKso) of 13.26 [23]. Struvite was the favored precipitate to form between pH 8 and 10 in all cases. In comparison, there was potential competition with brushite ( CaHPO4·2H2O) precipitation below pH 8, in filtrates from Locations 1 and 3, and brucite (Mg(OH)2) precipitation in filtrates above pH 10, from all locations. These competing minerals were due to predicted consumption of Mg2+ and PO43−, respectively (Figure 2).
Sparging was tested as a replacement for NaOH for pH adjustment to pH 8.5. Data demonstrated that observed struvite precipitation was comparable to predicted values (Table 4). Based upon the stoichiometry of supernatant N, P, and Mg2+ concentrations following treatment, struvite formation under air sparging led to a small yield increase (p = 0.03) over the use of NaOH for pH adjustment (Figure 3). Precipitate collected from treated Location 1 filtrate was confirmed by XRD analysis to be struvite (Figure 4). The XRD peak height variability among samples may have been due to different crystal orientations, especially with the air-sparged sample. In a separate investigation using Location 1 filtrate, struvite precipitation increased with increasing additions of MgSO4·7H2O and had model support (Figure 5).

4. Discussion

The WWTP filtrate characteristics were representative of filtrates likely to be found in many small WWTPs across the southern USA. Speciation modeling and analytic measurements support the potential ability of aerobic digester filtrate to form struvite when the pH is increased to at least 8.5 units, by using either base additions or air sparging. Although pH 8.5 does not maximize P recovery as struvite, Hao et al. [24] reported that struvite formation at pH ~8.5 lessened the prospect of Ca and Mg co-precipitates. Lew et al. [29] reported more Mg2+ and PO43− co-precipitates formed at higher pH (conditions that maximized struvite formation). Operating under conditions that promote mixed P precipitate formation may be allowable under some circumstances, but a business aimed at commercializing struvite fertilizer will likely desire a relatively pure product.
Sparging eliminates the cost of caustic solutions for pH adjustment, while activated sludge aeration infrastructure can likely support sparging with minimal economic investment [30]. For example, assuming 2017 NaOH costs of $0.45 kg−1, the annual cost of caustic addition can range from $1100 to $8000 per year or 1 to 2.5% of the test plants’ operation and maintenance budgets, based on treatment volume and initial alkalinity. This equates to approximately $1 to $3 m−3 of treated wastewater. In comparison, air sparging at a cost of 0.14 kilowatt-hour (kWh) per m3 [31] and an average 2017 (USD) energy cost of $0.1284 per kWh [32], can range from $49 to $350 per year or 0.1% or less of the test plants’ operation and maintenance budgets ($0.02 to $0.13 m−3). Wastewater pH and alkalinity may influence CO2 stripping effectiveness and pH responsiveness, thereby sparging costs. However, it is notable that the four WWTPs varied in alkalinity and initial pH but responded similarly to sparging and were representative of domestic wastewater in the USA [4].
Another potential benefit of using filtrate sparging is that stripping CO2 from solution may limit CaCO3 co-precipitates [31]. It is interesting to note that crystals collected from the air-sparged treatments tended to be larger (39 to 134 µm length) than crystals from the NaOH treated filtrate (27 to 64 µm length) (Figure 6). Also, crystals from the NaOH treatments were often irregular shaped, and had non-crystalline floc associated with them that was unidentifiable by x-ray diffraction, due to lack of crystal structure.
As expected, P recovery through struvite precipitation was limited by filtrate Mg2+. For example, the model suggested that increasing Location 1 filtrate concentration from 68 to 141 g Mg m−3 would approximately double struvite precipitation (Figure 5) and test results confirmed this (Table 5). An estimate of Mg+2 chemical costs (USD in 2017) required to maximize struvite production ranged from $1.17 kg−1 if Mg was supplied as MgCl2·6H2O to $2.78 kg−1 if Mg was supplied as MgSO4·7H2O [33], translating to WWTP added expenditures of several hundred to a few thousand US dollars per annum. It should be noted that the liberal use of Mg salts might degrade water quality by increasing overall salinity. Moreover, sulfates can be corrosive at high concentrations and, under anaerobic conditions, reduce to hydrogen sulfide. Chloride (Mg supplied as MgCl2·6H2O) will also contribute to filtrate salinity and possibly corrosion. Additional modeling and monitoring of these ions may be warranted when considering Mg salt additions in order to ensure compliance with local water quality regulations and to preserve WWTP structural integrity.
Struvite production rates from each WWTP location were estimated at both the digester-scale and WWTP-scale, based upon WWTP filtrate characteristics at the time of this study. Filtrate influx was calculated as 2% of each of the WWTP design treatment capacities [34]. At the WWTP-scale, it was estimated that individual locations may recover between 17 to 1514 kg P yr−1 (Table 5). At a fertilizer value of $1.76 kg−1 P and $1.10 kg−1 N (approximate USD in 2017), only Location 1 demonstrated adequate struvite production to offset input costs (sparging and perhaps MgCl2 applications). This provides supporting evidence that passive, low-cost struvite recovery can benefit small WWTPs that demonstrate adequate influent chemistries.
Capital costs for constructing filtrate collection systems for the four WWTPs were estimated. A regression analysis of capital cost to plant design discharge was conducted, using reported construction bids for similar systems [35] and then updating to 2018 USD [36]. Estimated construction costs for filtrate collection systems at the study locations ranged from $30,000 to $160,000, based upon filtrate processing volume. This needs to be verified with a full economic analysis, but initially it appears that cost of operation and return on investment are within the scope of one or more of the sampled WWTPs.
The extent of ecological benefits provided by diverting WWTP P into struvite rather than biosolids may be underappreciated. Struvite is a concentrated P source, having a typical fertilizer analysis of 5-28-0. Therefore, it may be used in place of conventional P mineral fertilizers, with the caveat that struvite-P is somewhat less soluble. In comparison, biosolids (6-3-0) is often land-applied as a fertilizer and therefore the soils might accumulate excess P, which can be detrimental to the environment over time. Increasing biosolids N:P ratio by diverting some of the P to struvite formation might translate into an environmentally friendlier biosolids fertilizer.

5. Conclusions

Phosphorus recovery as struvite from four small WWTPs was modeled and then confirmed experimentally, thereby demonstrating that struvite production may be a viable method for P recovery from small WWTPs that rely on aerobic digestion methods. Pure struvite was obtained through a modest increase in digester filtrate pH. The economics were improved by replacing the NaOH method for increasing alkalinity with air sparging. Phosphorus recovery in filtrate collected from four different commercially operated digesters ranged from 41% to 61%. Increasing the filtrate Mg concentration through Mg salt additions improved struvite recovery to more than 90%. By increasing struvite P, it is likely that less P is diverted to biosolids. This might translate into an environmental benefit by reducing P loading of lands receiving these modified biosolids.

Author Contributions

All authors (J.F.H., C.L.M., A.C.W., W.G.H.) contributed substantially to the research presented in this paper and to the preparation of the final manuscript.

Funding

This research received no external funding.

Acknowledgments

Talquin Electric Cooperative, Inc., Quincy, FL, US provided the sampling sites.

Conflicts of Interest

The authors declare no conflict of interest.

References

  1. Cordell, D.; Drangert, J.-O.; White, S. The story of phosphorus: Global food security and food for thought. Glob. Environ. Chang. 2009, 19, 292–305. [Google Scholar] [CrossRef]
  2. Scholz, R.W.; Ulrich, A.E.; Eilittä, M.; Roy, A. Sustainable use of phosphorus: A finite resource. Sci. Total Environ. 2013, 461–462, 799–803. [Google Scholar] [CrossRef] [PubMed]
  3. U.S. EPA. United States Environmental Protection Agency Clean Watersheds Needs Survey 2012 Report to Congress; U.S. EPA: Washington, DC, USA, 2016; p. 41.
  4. Tchobanoglous, G.; Stensel, H.D.; Tsuchihashi, R.; Burton, F.L.; Abu-Orf, M.; Bowden, G.; Pfrang, W. Wastewater Engineering: Treatment and Resource Recovery, 5th ed.; Metcalf & Eddy, Ed.; McGraw-Hill Education: New York, NY, USA, 2014; ISBN 978-0-07-340118-8. [Google Scholar]
  5. Vaccari, D.A. Sustainability and the Phosphorus Cycle: Inputs, Outputs, Material Flow, and Engineering. Environ. Eng. Appl. Res. Pract. 2011, 12, 1–11. [Google Scholar]
  6. U.S. Department of Agriculture Economic Research Service (USDA ERS). Fertilizer Use and Price. Available online: https://www.ers.usda.gov/data-products/fertilizer-use-and-price/ (accessed on 13 June 2018).
  7. Bunce, J.T.; Ndam, E.; Ofiteru, I.D.; Moore, A.; Graham, D.W. A Review of Phosphorus Removal Technologies and Their Applicability to Small-Scale Domestic Wastewater Treatment Systems. Front. Environ. Sci. 2018, 6, 8. [Google Scholar] [CrossRef]
  8. FDEP. Biosolids in Florida: 2013 Summary; Domestic Wastewater Program; Florida Department of Environmental Protection: Tallahassee, FL, USA, 2014; p. 26.
  9. Davis, M.L. Water and Wastewater Engineering Design Principles and Practice; McGraw-Hill: New York, NY, USA, 2013; ISBN 978-0-07-171384-9. [Google Scholar]
  10. Nowak, O. Optimizing the Use of Sludge Treatment Facilities at Municipal WWTPs. J. Environ. Sci. Health Part A 2006, 41, 1807–1817. [Google Scholar] [CrossRef] [PubMed]
  11. Doyle, J.D.; Parsons, S.A. Struvite formation, control and recovery. Water Res. 2002, 36, 3925–3940. [Google Scholar] [CrossRef]
  12. Le Corre, K.S.; Valsami-Jones, E.; Hobbs, P.; Jefferson, B.; Parsons, S.A. Agglomeration of struvite crystals. Water Res. 2007, 41, 419–425. [Google Scholar] [CrossRef]
  13. Rahman, M.M.; Salleh, M.A.M.; Rashid, U.; Ahsan, A.; Hossain, M.M.; Ra, C.S. Production of slow release crystal fertilizer from wastewaters through struvite crystallization—A review. Arab. J. Chem. 2014, 7, 139–155. [Google Scholar] [CrossRef]
  14. Rawn, A.M.; Banta, A.P.; Pomeroy, R. Multiple-stage sewage sludge digestion. Trans. Am. Soc. Civ. Eng. 1939, 104, 93–119. [Google Scholar]
  15. Venkatesan, A.K.; Hamdan, A.-H.M.; Chavez, V.M.; Brown, J.D.; Halden, R.U. Mass Balance Model for Sustainable Phosphorus Recovery in a US Wastewater Treatment Plant. J. Environ. Qual. 2014, 45, 84. [Google Scholar] [CrossRef]
  16. Battistoni, P.; Boccadoro, R.; Fatone, F.; Pavan, P. Auto-Nucleation and Crystal Growth of Struvite in a Demonstrative Fluidized Bed Reactor (FBR). Environ. Technol. 2005, 26, 975–982. [Google Scholar] [CrossRef] [PubMed]
  17. Fattah, K.P.; Mavinic, D.S.; Koch, F.A.; Jacob, C. Determining the feasibility of phosphorus recovery as struvite from filter press centrate in a secondary wastewater treatment plant. J. Environ. Sci. Health Part A 2008, 43, 756–764. [Google Scholar] [CrossRef] [PubMed]
  18. Latimer, R.; Nguyen, V.; Smeby, K.; Vadiveloo, E.; Pitt, P.; Sawyer, H.; Harris, R.; Porter, R.; Elmendorf, H.; Richards, T. Nutrient Recovery from Was Streams for Struvite Control and Recycle Load Reduction. Proc. Water Environ. Fed. 2012, 2012, 564–589. [Google Scholar] [CrossRef]
  19. U.S. EPA. POTW Sludge Sampling and Analysis Guidance Document; Office of Water Office of Wastewater Enforcement & Compliance: Washington DC, USA, 1989; ISBN Document No. PB93-227957.
  20. AWWA; American Public Health Association; Water Environment Federation. Standard Methods for the Examination of Water and Wastewater, 22nd ed.; Rice, E.W., Baird, R.B., Eaton, A.D., Clesceri, L.S., Eds.; American Water Works Assn: Washington, DC, USA, 2012; ISBN 978-0-87553-013-0. [Google Scholar]
  21. U.S. EPA. Methods for the Determination of Metals in Environmental Samples; U.S. Environmental Protection Agency: Washington, DC, USA, 1991.
  22. Gustafsson, J.P. Visual MINTEQ Ver 3.0; Department of Land and Water Resources Engineering, Royal Institute of Technology: Stockholm, Sweden, 2011. [Google Scholar]
  23. Ohlinger, K.N.; Young, T.M.; Schroeder, E.D. Predicting struvite formation in digestion. Water Res. 1998, 32, 3607–3614. [Google Scholar] [CrossRef]
  24. Hao, X.-D.; Wang, C.-C.; Lan, L.; van Loosdrecht, M.C.M. Struvite formation, analytical methods and effects of pH and Ca2+. Water Sci. Technol. 2008, 58, 1687–1692. [Google Scholar] [CrossRef] [PubMed]
  25. Musvoto, E.V.; Wentzel, M.C.; Ekama, G.A. Integrated chemical–physical processes modelling—II. simulating aeration treatment of anaerobic digester supernatants. Water Res. 2000, 34, 1868–1880. [Google Scholar] [CrossRef]
  26. Babić-Ivančić, V.; Kontrec, J.; Brečević, L.; Kralj, D. Kinetics of struvite to newberyite transformation in the precipitation system MgCl2–NH4H2PO4–NaOH–H2O. Water Res. 2006, 40, 3447–3455. [Google Scholar] [CrossRef] [PubMed]
  27. Çelen, I.; Buchanan, J.R.; Burns, R.T.; Bruce Robinson, R.; Raj Raman, D. Using a chemical equilibrium model to predict amendments required to precipitate phosphorus as struvite in liquid swine manure. Water Res. 2007, 41, 1689–1696. [Google Scholar] [CrossRef]
  28. Joint Committee on Powder Diffraction Standards; International Center for Diffraction Data: Swarthmore, PA, USA, 1980.
  29. Lew, B.; Phalah, S.; Sheindorf, C.; Kummel, M.; Rebhun, M.; Lahav, O. Favorable Operating Conditions for Obtaining High-Value Struvite Product from Sludge Dewatering Filtrate. Environ. Eng. Sci. 2010, 27, 733–741. [Google Scholar] [CrossRef]
  30. Korchef, A.; Saidou, H.; Amor, M.B. Phosphate recovery through struvite precipitation by CO2 removal: Effect of magnesium, phosphate and ammonium concentrations. J. Hazard. Mater. 2011, 186, 602–613. [Google Scholar] [CrossRef]
  31. Cohen, Y.; Kirchmann, H. Increasing the pH of Wastewater to High Levels with Different Gases—CO2 Stripping. Water Air Soil Pollut. 2004, 159, 265–275. [Google Scholar] [CrossRef]
  32. U.S. Energy Information Administration. Electric Power Monthly; U.S. Energy Information Administration: Washington, DC, USA, 2017. Available online: https://www.eia.gov/electricity/monthly/ (accessed on 28 January 2018).
  33. Lahav, O.; Telzhensky, M.; Zewuhn, A.; Gendel, Y.; Gerth, J.; Calmano, W.; Birnhack, L. Struvite recovery from municipal-wastewater sludge centrifuge supernatant using seawater NF concentrate as a cheap Mg(II) source. Sep. Purif. Technol. 2013, 108, 103–110. [Google Scholar] [CrossRef]
  34. GLUMRB. Recommended Standards for Wastewater Facilities; Great Lakes Upper Mississippi River Board of State and Provincial Public Health and Environmental Mangers: Albany, NY, USA, 2014; p. 175. [Google Scholar]
  35. U.S. ACE. Civil Works Construction Cost Index System Manual; United States Army Corps of Engineers: Washington, DC, USA, 2003; p. 57.
  36. U.S. EPA. Construction Costs for Municipal Wastewater Treatment Plants: 1973–1982; United States Environmental Protection Agency, Office of Water Program Operations: Washington, DC, USA, 1983; p. 259.
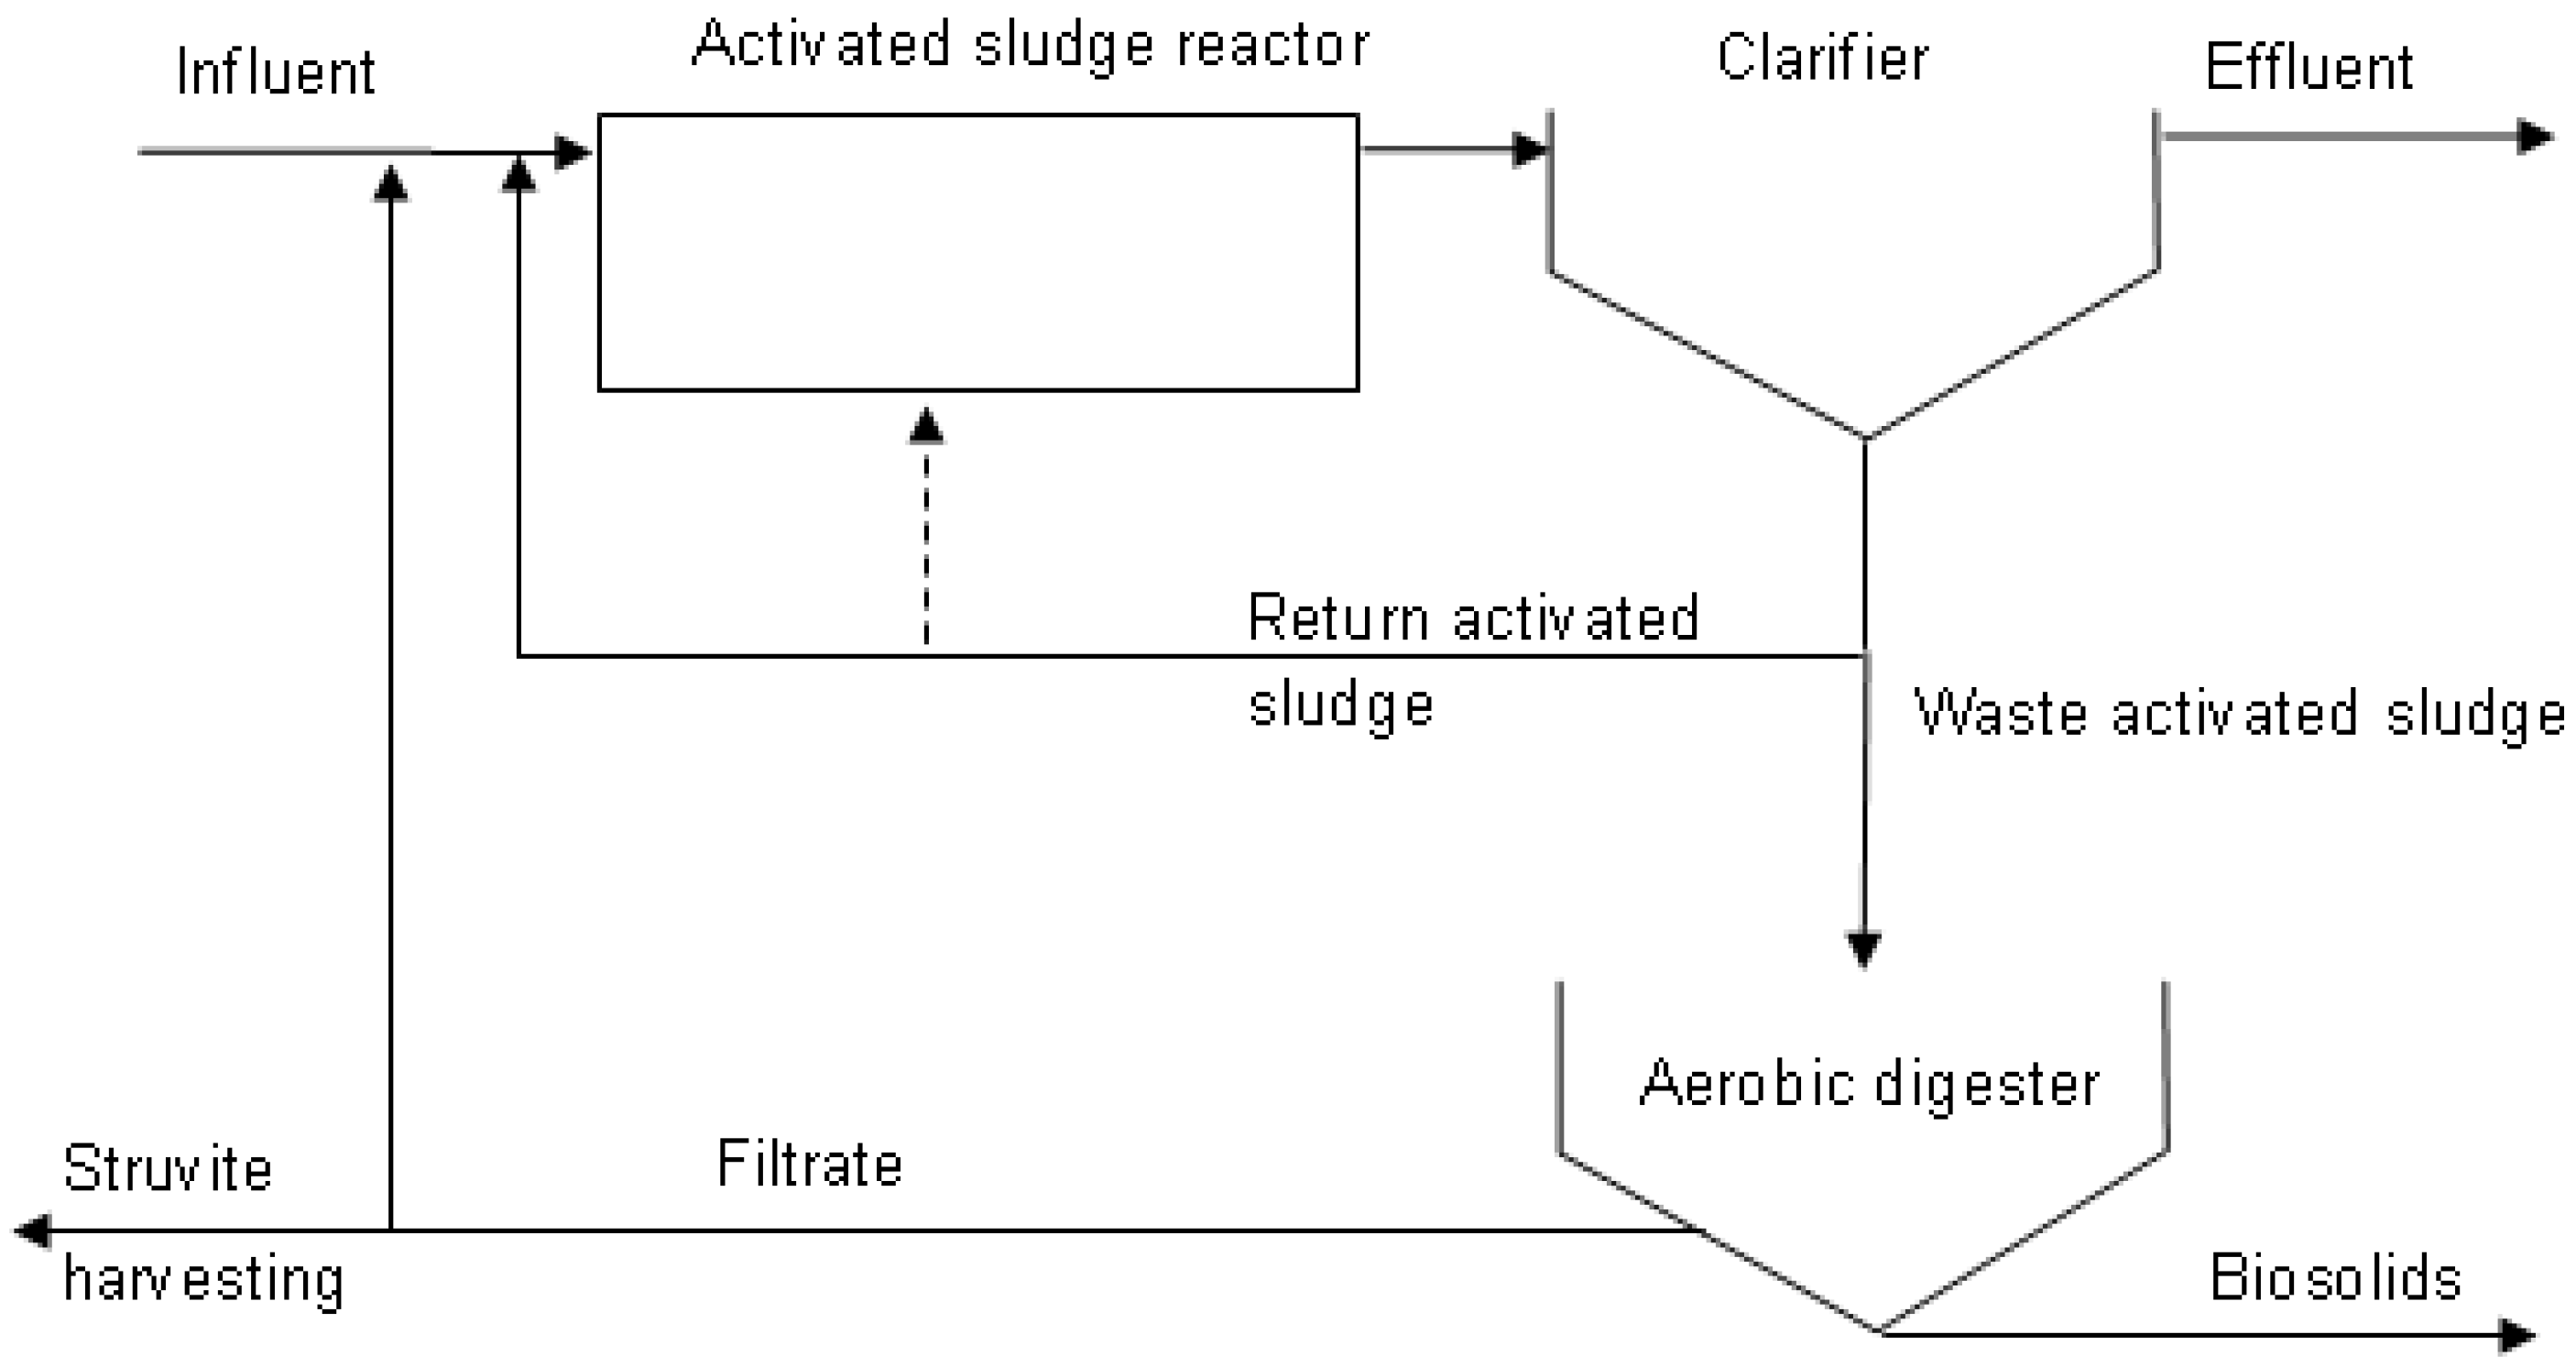
Figure 1. Schematic representing the essential components of a small WWTP with addition of struvite harvesting.
Sustainability 11 00376 g001
Figure 2. Potential formation products in filtrates from four small WWTPs: (1) Location 1, (2) Location 2 (3) Location 3, and (4) Location 4.
Sustainability 11 00376 g002
Figure 3. The percent of recovered precipitate identified as struvite when treated with either NaOH or air sparging. Each bar = mean ± standard error (n = 2). Locations with different letters represent differences in struvite production at p < 0.05.
Sustainability 11 00376 g003
Figure 4. Struvite confirmation via XRD analysis in Location 1 filtrate for the treatments specified.
Sustainability 11 00376 g004
Figure 5. Modeled effect of increasing Mg concentrations on potential struvite production using Location 1 filtrate.
Sustainability 11 00376 g005
Figure 6. Struvite mineral formation from Location 1 at 400× magnification, sampled from (a) NaOH-adjusted sample and (b) air-sparged sample.
Sustainability 11 00376 g006
Table 1. Wastewater treatment plant (WWTP) operating parameters (2014).
ParametersWastewater Treatment Plant
1 12 23 24 2
Population Served83133980109735
Design Treatment Capacity (m3 d−1)26501893946371
Average Treatment (m3 d−1)2445976518278
Influent P Load (kg d−1)17.67.03.72.0
Effluent P Load (kg d−1)4.92.01.00.6
1 Complete-mix activated sludge plant. 2 Activated sludge sequencing batch reactor.
Table 2. Aerobically digested sludge filtrate composition.
Parameters 1Wastewater Treatment Plant
1234
pH8.0 ± 0.47.8 ± 0.47.8 ± 0.48.1 ± 0.3
ORP (mV)225 ± 37271 ± 32269 ± 42227 ± 33
Alkalinity (as CaCO3) (g/m3)1197 ± 24359 ± 37424 ± 90515 ± 197
NH4+ (g/m3)404 ± 11289 ± 268.2 ± 2.19.6 ± 2.9
PO43− (g/m3)400 ± 141120 ± 33128 ± 5635 ± 5
Mg2+ (g/m3)32 ± 420 ± 330 ± 411 ± 3
Ca2+ (g/m3)41 ± 1343 ± 1.748 ± 1138 ± 12
Fe3+ (g/m3)0.9 ± 0.70.4 ± 0.21.0 ± 0.72.0 ± 0.3
Al3+ (g/m3)0.7 ± 0.50.7 ± 0.41.2 ± 0.71.2 ± 1.2
1 Values represent mean ± standard deviation of 6 samples collected from August 2014 to September 2015.
Table 3. Predicted struvite-P recovery as a percent of total available P from digestion filtrate, using the Visual MINTEQ model.
LocationFiltrate pHStruvite-P Recovery (%)
UntreatedOptimal pH 1Untreated 2Optimal pHAt pH 8.5
18.09.905957
27.810.104937
37.810.106032
48.19.504927
1 Filtrate pH that allows for maximum struvite-P formation. 2 No struvite formed under these conditions.
Table 4. Comparison of NaOH versus air sparging on struvite precipitation, based upon remaining NH4+, PO43−, and Mg2+ in solution.
LocationNaOH (g m−3)Air Sparging (g m−3)
PredictedActual 1PredictedActual 1
1342347 ± 7.1355353 ± 4.0
273.471.4 ± 0.374.174.4 ± 1.1
370.171.1 ± 0.492.993.8 ± 19.8
428.827.1 ± 0.230.930.7 ± 0.3
Values represent mean ± standard deviation (n = 2).
Table 5. Annual struvite production and wastewater treatment plant P load reduction estimates based upon treating filtrates from four wastewater treatment plants with air sparging (pH 8.5), and their potential fertilizer values.
LocationP Load ReductionStruviteP Value 2N+P Value 2
Filtrate-ScaleWWTP-Scale
------------------%------------------kg P yr−1USDUSD
159241514$2665$3346
1 + Mg 197431961$3451$4332
24310223$392$492
34110111$195$245
461317$30$36
1 Location 1 filtrate Mg2+ was elevated from 68 to 141 g Mg m−3, using MgSO4·7H2O. 2 Column 5 represents struvite value as a P fertilizer and column 6 represents struvite value as a N+P fertilizer, based upon approximate N and P fertilizer prices (2017 US dollar amount).