Article

Exploring the Drivers behind Self-Reported and Measured Food Wastage

1
Department of Natural Resource and Environmental Management, Faculty of Social Sciences, University of Haifa, Mt. Carmel, Haifa 3498838, Israel
2
The Natural Resource and Environmental Research Center (NRERC), University of Haifa, Mt. Carmel, Haifa 3498838, Israel
3
Department of Environmental Economics and Management, and The Center for Agricultural Economic Research, Robert H. Smith Faculty of Agriculture, Food and Environment, The Hebrew University of Jerusalem, Rehovot 76100, Israel
*
Author to whom correspondence should be addressed.
Sustainability 2019, 11(20), 5677; https://doi.org/10.3390/su11205677
Submission received: 11 September 2019 / Revised: 7 October 2019 / Accepted: 11 October 2019 / Published: 14 October 2019
(This article belongs to the Special Issue Meeting Sustainable Development Goals by Reducing Food Loss)

Abstract

:
Understanding households’ food waste drivers is crucial for forming a coherent policy to meet the sustainable development goals. However, current studies have documented mixed evidence regarding food waste determinants. Most studies have relied on self-reports, assuming they reflect actual behaviors. This study applies a structural equation model that evaluates both self-reported and measured food wastage, and how they are affected by different households’ attributes, attitudes, and behaviors. As such, it also provides a test for the underlying logic that self-reports are a proxy for actual food waste. Results show that measured food wastage is, at best, weakly correlated with self-reports. Moreover, drivers affecting self-reported and measured food wastage are not necessarily the same. Household size affects only measured food wastage. Source separation behavior negatively affects self-reported and measured food wastage, while environmental attitudes have a negative effect only on self-reports. Meal planning, unplanned shopping, and food purchased have no impact on self-reported and measured food wastage. The relation between self-reported and actual food waste and their drivers are even less understood than we thought. The distinction between self-reports and actual waste is crucial for follow-up research on this subject as well as assessing policy measures.

1. Introduction

Food waste reduction efforts are motivated by concerns over resource depletion, food security, economic costs, and greenhouse gas mitigation [1,2,3]. Therefore, one of the key elements of the sustainable development goals (SDG) is targeting the food waste challenge. According to SDG 12, by 2030, per capita global food waste among consumers and retailers should be cut in half, while efforts should be put into reducing upstream food losses [4]. Reducing food waste is also a prominent measure of emissions mitigation, as part of SDG 13, which calls to combat climate change [5]. Moreover, cutting food waste will contribute to reducing the adverse environmental impact of waste management within cities as part of SDG 11 [4]. However, achieving these ambitious goals requires improving our knowledge on reasons behind food waste, especially among households, which are the main contributors to food wastage [6]. Acquiring a good understanding of what drives food waste will help policy makers, scholars, and practitioners to design and share good prevention practices [6,7]. However, though essential for designing prevention measures [8], evidence on why food waste occurs is still very limited [9].
Current studies present mixed and rather contrasting evidence regarding food waste determinants [1,9,10]. They also rarely provide quantitative measures to indicate the effectiveness of different interventions and those that do, report only a 5% to 20% reduction in food waste generation [11,12]. These rather low performances also question our understanding of what drives households to waste food. Therefore, more evidence-based research is needed [13,14].
A major barrier toward a comprehensive understanding of food waste drivers is the fact that most studies rely on self-reports, which are difficult to verify [15,16]. More specifically, the relationship between different behaviors, attitudes, and food waste quantities has been almost exclusively explored by questionnaires [8], of which validity has been recently questioned [8,17,18,19,20]. The underlying assumptions of self-reporting is that respondents (1) are able to recall specific waste events; (2) provide a proper generalization about the total produced amount; and (3) are aware of all food waste generated by other household members [21,22,23,24]. However, some degree of divergence between the behaviors and attitudes of different household members exist, and therefore responses of one person may not fully reflect the household as a whole [25,26,27]. Another critique on the use of questionnaires is that they are strongly affected by the ‘social desirability bias’, i.e., participants are prone to report on what they believe is the socially desirable behavior/attitude [28], which leads to biased waste estimates [8,9,20]. Biased assessments might also be affected by a ‘self-serving bias’, the tendency to perceive oneself in a favorable manner, which leads individuals to deny responsibility for negative environmental behaviors [29,30,31].
Another limit of self-reports is that there is no common practice to assess food waste behaviors, hence, cross-study comparisons are practically unfeasible [24,32,33]. For example, participants in Stefan et al. [34] and Stancu et al. [35] were asked to assess the relative amount of food waste of the total food purchases, i.e., ‘food waste proportion’, while in other studies ‘discarding frequencies’ were recorded and respondents were asked to indicate how often food is disposed (e.g., daily, weekly, never, most mealtimes) [36,37]. Another common practice is reporting ‘food waste amounts’, expressed by different measures (e.g., weight, cooking units, Likert scale) [38,39,40]. Other researchers chose to focus on ‘food practices’ (e.g., to what extent prevention measures are taken) [41,42,43].
The concern about biased reports has led researchers to call for field work involving objective measurements [14,16,17,18,19,37,44]. However, to the best of our knowledge, so far, only two studies exploring the relation between food waste and its proposed drivers have used an alternative approach that does not rely merely on self-reports.
In the first study, Grainger et al. [15] analyzed the Waste and Resources Action Program database [45]. This database included statistics regarding objective amount of avoidable household food waste (the terms ‘avoidable food waste’, ‘food waste’, and ‘food wastage’ are being used alternately throughout the paper to describe edible, avoidable food discarded by households) (kg per household; measured through a physical waste survey), sociodemographic factors (gender, household age structure, household size, household composition, home ownership status, type of residence, local authority, presence of children, employment status, and socioeconomic status), and behavioral variables (meal preplanning, pre-shopping cupboard checking, preparing a shopping list, using leftovers, food storage practices, type and frequency of shopping trips, and presence of fussy eaters). Household size, the presence of fussy eaters, employment status, home ownership status, and the local authority were all identified as main drivers of food waste [15]. Grainger et al. [15] found no significant effect of any of the behavioral factors on measured amount of food waste.
The second study, conducted by Giordano et al. [8], tested the extent to which selected sociodemographic variables (household size, presence of children, geographical location, income type), as well as behavioral variables (preparation of a shopping list and how it was used, place and frequency of purchase, purchasing discounted products, and eating out) determine food waste (kg per capita; measured through a diary survey). According to their findings, household size, geographical location, and presence of children have the main role in predicting avoidable food waste amount. Groceries shopping behaviors (i.e., making a shopping list, assessing the pantry and fridge prior to shopping) were not found to significantly affect food waste quantities.
To conclude, current research of the drivers to waste food are still insufficient, fragmented, and hardly comparable [46,47]. They present conflicting evidence that may undermine efforts to design effective policy and targeted interventions to reduce food waste, and, thus, meet the ambitious goals set by the United Nations (UN). The complexity results from studying a multidimensional phenomenon, the discrepancies documented in the literature, along with the shortage of studies that are based on objective measurements, stress the need for more comprehensive evidence of the relationship between different drivers, self-reported, and measured food wastage [13,36,37,41,48].
This paper aimed at addressing those knowledge gaps and enhancing our understanding regarding drivers to waste food. To the best of our knowledge, this is the first study to measure and compare drivers of food waste using both self-reports and measurements of actual households’ food wastage. As suggested by Grainger et al. [15], the use of measured amounts of avoidable food waste as a dependent variable has the potential of reducing the ‘social desirability bias’. The comparison between the two measurements provides us a unique opportunity to explore the relations of factors that were suggested as food waste drivers with both self-reported and measured food wastage. It also provides an opportunity to test, for the first time, the underlying logic of methods that have used self-reports as proxy for food waste, namely that self-reported and measured food wastage are highly correlated. In addition, we introduced the amount of purchased food as possible determinate of food waste. To this end, this paper used structural equation modeling (SEM), which has been applied before to assess drivers on self-reported food waste, but not on measured household food wastage.

2. Material and Methods

2.1. Study Design

The study employed three measures—a physical waste survey coupled with a food purchases survey, which was followed by a questionnaire (via Qualtrics software). The questionnaire mostly consisted of questions designed to map behaviors and attitudes. Questions regarding behaviors and attitudes were inspired by the Waste and Resources Action Program’s and the OECD’s questionnaires [49,50]. The study was conducted in three neighborhoods within Neve Sha’anan district in Haifa Municipality, Israel. Fieldwork took place between March and August 2016.

2.2. The Sample

Participants were recruited through various channels, e.g., advertisements, leaflets, and Facebook pages. They were invited to take part in a study exploring general waste discarding patterns among Israeli households. That is, they were not informed about the real purpose of the survey (i.e., food waste behaviors).
Potential participants were asked to fill in a short contact form or to send their contacts details via e-mail. Then, a short telephone interview was conducted to ensure adequacy with the primary inclusion criterion, i.e., (a) geographical area, (b) household composition (single occupancy and roommates were excluded), and (c) religiosity level (orthodox households were excluded). Responsibility for at least one of three of the household’s food chores, i.e., buying food, making a shopping list, and preparing meals, was defined as a secondary inclusion criterion.
Our sample was assembled from one hundred and eighty-seven (187) households, however due to the fact that ten percent (10%) of participants refused to answer the income question, our final dataset comprised one hundred and sixty-nine (169) observations. All participants gave their informed consent for inclusion before they participated in the study. The study was approved for ethical compliance by the Ethics Committee of the University of Haifa (Approval no. 058/16).
Overall, our sample comprised more women than men, more young people than older people, more academic degree holders than other education levels, and more secular people than religiously observant. When compared to the general population, our sample comprised more young, educated, and secular people, with an average household size that is quite similar to the average Israeli household. Sixty-five percent (65%) of the participating households reported a monthly income that was lower than the average income in the general population (See Table 1). The large proportion of women in our sample (75%) is probably associated with the inclusion criterion, since the main responsibility for housework, and particularly cooking, remains with women [51]. A similar bias was also documented in other studies [40,44,52,53].

2.3. Measures

2.3.1. Food Planning and Shopping Behaviors

Food planning and shopping behaviors were measured through a set of four designated questions (Table 2): (1) Food inventories—participants were asked to indicate whether they check different food inventories (pantry, fridge, and freezer) before grocery shopping. This question was later converted into a dichotomous variable, when checking any kind of food inventory was coded as “1”, or “0” if otherwise. (2) Shopping list—participants were asked to select a statement that best described their shopping list structure. A dichotomous variable was defined as follows: making any kind of shopping list was coded as “1”, or “0” if otherwise. (3) Meal planning—participants were asked whether they plan ahead what they will cook during weekdays. Positive answers were coded as “1”, or “0” if otherwise. (4) Unplanned shopping—participants were asked to assess the amount of unplanned food items bought in their last grocery shop (from “1”— ‘I bought only what I had planned’ to “5”—‘I bought more than 15 products than planned’). These questions were inspired by WRAP [49].

2.3.2. Source Separation of Waste

Waste source separation behavior was measured via a single question, in which participants were asked to report whether they separate any kind of waste streams (coded as “1”) or not (coded as “0”).

2.3.3. Environmental Attitudes

Environmental attitudes were assessed by a set of seven statements. These statements covered a variety of topics, such as, the role of technological innovation in solving environmental problems, willingness to change lifestyle for the benefit of the environment, and skepticism regarding environmental issues. For each question, participants were asked to rate their level of agreement on a 5-point Likert scale, ranging from ‘strongly disagree’ to ‘strongly agree’. An aggregated environmental attitudes index was generated as follows: a score was produced for each of the agreement levels, with “+2” being the score associated with ‘strongly agree’, “+1” with ‘agree’, “0” with ‘neutral’, “−1” with ‘disagree’, and “−2” with ‘strongly disagree’. The environmental attitudes index was calculated as the mean score of these seven statements. Responses were normalized to give a scale from “−2” to “+2”, with higher values indicating more ‘proenvironmental’ attitudes. To assess the internal consistency of the environmental attitudes index, we calculated the reliability coefficient with Cronbach’s alpha (α). The generally agreed upon lower limit for Cronbach’s alpha is 0.70, while in exploratory research it may decrease to 0.60 [56]. The statements, as well as the index calculation method, were adopted from OECD [50].

2.3.4. Sociodemographic Variables

The model includes two sociodemographic variables—(1) household size, measured as the number of family members; (2) net monthly household income, measured by nine income brackets (for convenience reasons, Table 1 presents only grouped income categories; the analysis itself refers to the original income categories).

2.3.5. The Amount of Purchased Food

A food purchases survey was carried out during two weeks in which receipts of grocery shops were collected. These receipts were later analyzed to calculate the average amount of household food purchases during the course of the study (Kg per household per week) [this process is described in detail by Elimelech et al. [18] (pp. 263–264)].

2.3.6. Self-Reported Food Wastage

The questionnaire was distributed at the end of the physical waste survey and referred to food waste in the past week (i.e., the week in which the physical waste survey took place). Food waste amount was assessed by asking: “Over the last week, how much of the following foods (e.g., vegetables, fruit, meat, poultry, and fish) have you thrown away?”. Participants indicated whether they discarded small or large amounts (“0” = none, “1” = small amount, “5” = large amount) and could also report that they do not consume a certain food category. Self-reports of avoidable food waste were calculated as the average score of all eight food categories, where higher scores represented high levels of food wastage. Participants were instructed not to refer to inedible food parts, such as peels, apple cores, etc., which are characterized as nonavoidable food waste. To gain some control on possible side flows of waste materials, participants were asked to indicate whether they own a yard composter, a garbage shredder, or a pet (participants that reported to own a composter, were instructed not to use it during the study period).

2.3.7. Measured Food Wastage

We conducted a physical waste survey to measure the average amount of household avoidable food waste (kg per household per week). Participants were instructed to keep their waste routines and to deposit their waste bags on their apartment’s doorstep every morning. Since waste bags were not collected from waste bins, they had minimal exposure to weather conditions, which helped in preserving the sample’s physical and chemical properties and therefore minimized possible seasonal effects.
As no separate collection scheme for organic waste was in place, waste bags generally contained mixed household waste or source separated recyclables, e.g., paper, plastic bottles, and packages. Samples were collected through seven consecutive days and transported to a designated area for sorting. Each waste sample was weighed and documented on a household level. Classification was made according to ‘avoidability’ (avoidable and nonavoidable food waste), which was determined according to the theoretical prevention potential, as suggested by Lebersorger and Schneider [32]. Any preparation residues, e.g., vegetables pilling, bones, and other nonedible food parts were classified as nonavoidable food waste [for detailed sampling and classification procedures see Elimelech et al. [57] (pp. 74–75)].

2.4. Data Analysis

Food wastage is a multidimensional and complex behavior, influenced by interrelated factors [1,9,12,46,58,59]. Therefore, a proper analysis should consider this complexity and explore mediated relationships that might shed light on food waste drivers. SEM is a statistical technique that allows complete and simultaneous tests of all the direct and indirect relations between one (or more) independent variables, and one (or more) dependent variables. Moreover, it enables researchers to test theoretical propositions regarding how different variables are theoretically linked and the directionality of significant relationships, and hence, it is considered fit for exploring hypotheses of complex social sciences phenomena [60,61,62]. This technique was implemented in several food waste studies [34,35,36,37,38,39,40,41,42,43], all relied on self-reports.
We developed a conceptual model that combined seven exogenous variables—checking food inventory, making a shopping list, meal planning, environmental attitudes, source separation of waste, household size, and income—and four endogenous variables—unplanned shopping, the amount of purchased food, self-reported, and measured food wastage.
The model is described in Figure 1 and was tested using the CALIS procedure in SAS software version 9.4.
Estimating a successful model requires the appropriate handling of missing data [62]. We implemented a listwise deletion technique (complete case analysis) to remove all data for a case that had one or more missing values. Hence, our final dataset comprised 169 observations.

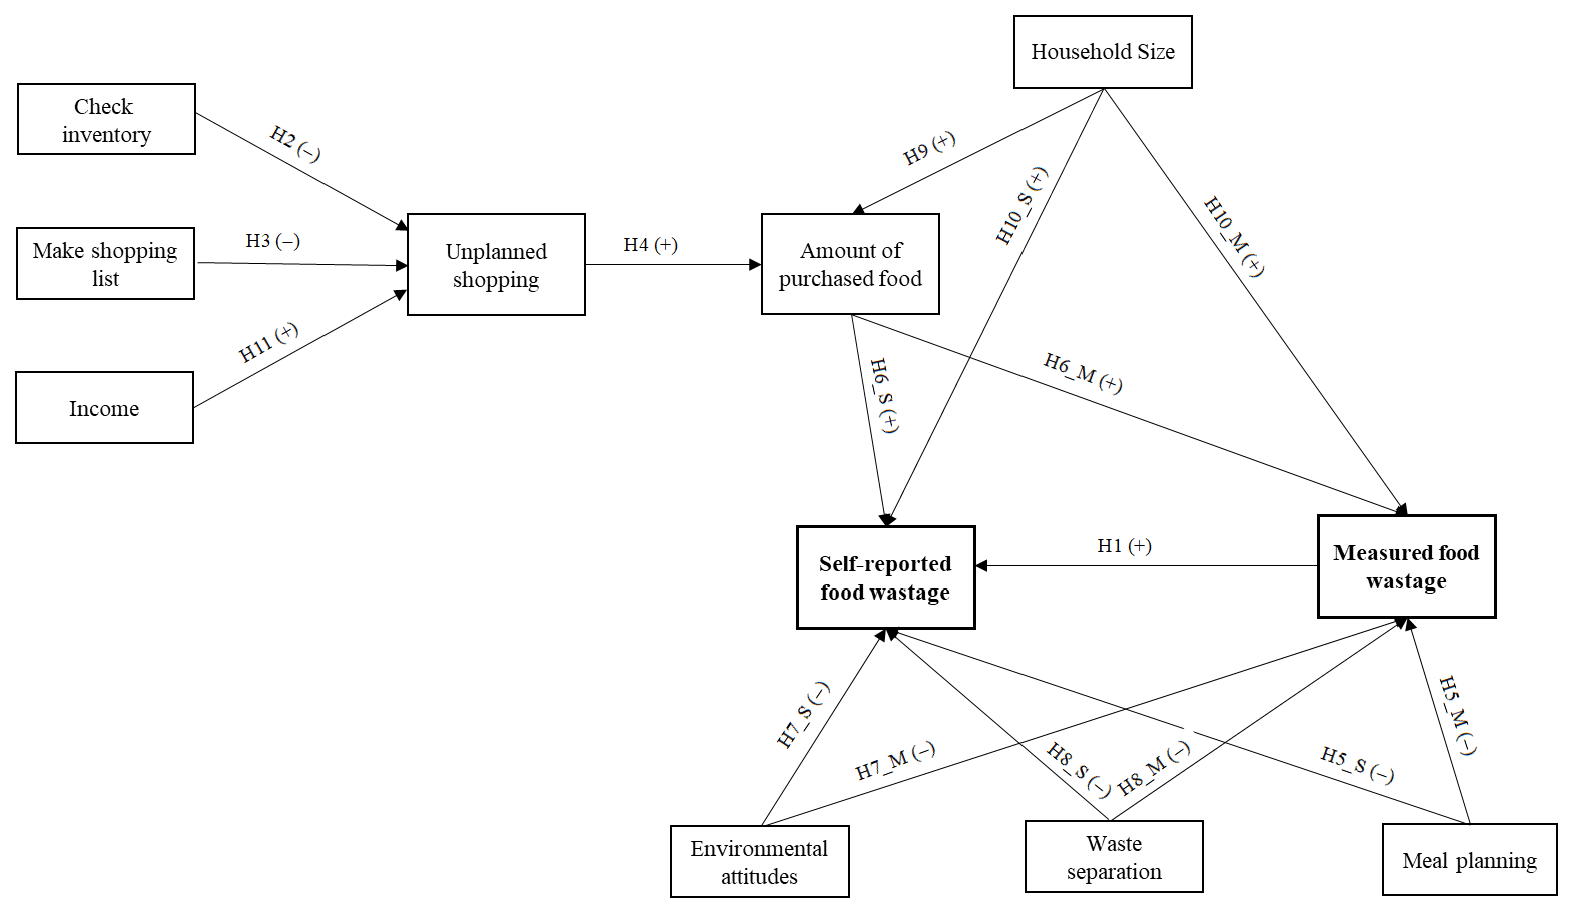
2.5. The Conceptual Model

An important contribution of our research is exploring the relationship between self-reported and measured food wastage. The implicit basis of self-report studies is that self-reported and measured food wastage are highly correlated, and if this is not the case, then there is no justification for treating self-reports as a proxy for actual measurements. Therefore, we hypothesized that when asked to report on food waste amount, the participant would form an educated guess based on actual amounts of household food waste. In other words, participants’ self-reports are affected by actual food wastage.
Hypothesis 1 (H1). 
Measured food wastage has a positive effect on self-reported food wastage.
Food planning and shopping routines have been discussed extensively in the food waste literature [3,12,24,58,59,63]. According to Stefan et al. [34], planning routines, expressed by the tendency to check inventory before food shopping, making a shopping list, and planning meals in advance, have a direct and negative effect on food waste. On the other hand, Aktas et al. [37] demonstrated that planning routines (expressed by similar measures as Stefan et al. [34]) helps reduce food surplus (measured as serving and buying too much food), and thus, only indirectly affects food wastage. Ponis et al. [39] did not find evidence for a direct effect of shopping habits (measured as the use of a shopping list and the tendency to purchase promotional offers) on food wastage and concluded that it was fully mediated by food management practices and food portioning. Stancu et al. [35] suggested that planning routines (planning of shopping trips and meals ahead) were only indirectly contributing to food waste through unplanned shopping, i.e., purchasing larger amounts of food than planned. Stefan et al. [34] demonstrated that unplanned shopping is directly associated with larger amounts of food waste. According to Visschers et al. [64], household planning habits (i.e., meal planning and unplanned shopping) only correlate with consumers’ intention to avoid food waste.
To sum, as demonstrated above, not only did each study use different definitions and measures of planning and shopping routines, but confusing findings were reported regarding the explicit associations between those factors and food wastage (e.g., whether a connection exists and if it is direct or indirect). In this study we offer a new perspective on the association between planning and shopping routines, and food wastage: (1) We distinguished pre-shopping routines—checking food inventories and making a shopping list from meal planning. This distinction represents “the course of events”, since the latter occurs after shopping has been done and is more related to food portioning. We hypothesized that pre-shopping routines are negatively correlated with unplanned shopping. (2) One of our contributions to the literature is exploring the association between the amount of purchased food and food wastage. We suggest that the effect of unplanned shopping on food wastage is mediated by the amount of purchased food. That is, the tendency to purchase larger amounts of unintended food items results in a larger food basket (i.e., increased overstocking), which leads to food spoilage and increased food wastage. Thus, we hypothesized that unplanned shopping leads to high amounts of purchased food, and the latter is expected to have a positive effect on both self-reported and measured food wastage. As explained above, it is assumed that food portioning is a post-shopping activity, and hence has no impact on the amount of purchased food.
Since unplanned cooking might result in large amounts of food leftovers, which have a limited shelf-life, we also hypothesized that meal planning has a direct and negative effect on food wastage.
Hypothesis 2 (H2). 
Checking food inventories before food shopping has a negative effect on unplanned shopping.
Hypothesis 3 (H3). 
Making a shopping list has a negative effect on unplanned shopping.
Hypothesis 4 (H4). 
Unplanned shopping has a positive effect on the amount of purchased food.
Hypothesis 5 (H5). 
Meal planning has a negative effect on both self-reported and measured food wastage.
Hypothesis 6 (H6). 
The amount of purchased food has a positive effect on both self-reported and measured food wastage.
The next set of hypotheses explore the extent to which food waste is affected by separation behavior and environmental attitudes. Studies have linked environmental awareness, in general, and waste prevention behavior, in particular, with food waste minimization [38,41,65,66]. On the other hand, Principato [67] concluded that in itself, awareness to the food wastage phenomenon is not sufficient for reducing food waste, confirming early findings of Quested et al. [58] that food waste behavior is not motivated by a concern for the environment. While waste recycling was found to have a strong contribution to food waste behaviors by both Abdelradi et al. [38] and Giordano et al. [8], no significant relation was found by Diaz-Ruiz et al. [41]. Both Abdelradi et al. [38] and Diaz-Ruiz et al. [41] found a nonsignificant effect of environmental concern on self-reported food waste, but the latter study demonstrated that environmental concern had a significant indirect effect towards food waste through prevention behaviors. Hebrok and Boks [12] suggested that food waste is practically invisible for most consumers and therefore perceived as inevitable. Following this line of research, we argued that participants expressing high environmental attitudes and engaged in source separation of waste will be generally more aware of the amount of waste they produce, and hence, produce smaller amounts of food waste.
Hypothesis 7 (H7). 
Environmental attitudes have a negative effect on both self-reported and measured food wastage.
Hypothesis 8 (H8). 
Source separation of waste has a negative effect on both self-reported and measured food wastage.
The relationship between “environmental attitudes” and “source separation of waste” (a binary variable) was not included in the SEM model for technical reasons. The conventional SEM assumes a linear measurement structure, where endogenous variables are assumed to have continuous distribution [68,69]. While new strategies have been suggested to handle binary variables in SEM, their performances are still in debate [61,70]. Nevertheless, we also tested a version of the model that includes the link between environmental attitudes and source separation of waste, and the correlation between the two was indeed significant, while all other results did not change. Yet, our results do suggest that the two are significantly correlated (see Table 3).
Finally, we assessed the role of sociodemographic factors in explaining food waste behaviors. Interestingly, in some studies, sociodemographic characteristics served only as background variables [36,38,39], while in others they were removed from the model due to relatively low coefficients of correlation [34,35]. Family size plays a fundamental role in self-reported food wastage [40,52,59,71], as well as in measured food wastage [8,15].
Since our measurement unit is the single household, we chose to focus only on sociodemographic variables that reflect the family as a whole. For this reason, we excluded individual traits like age and gender. Education and religious levels were also excluded since they do not necessarily equally represent all household members. Since household size is almost perfectly correlated with the number of children in household (rp = 0.92, p < 0.01), the latter was also omitted. Accordingly, we hypothesized that household size is positively correlated with food wastage, as well as with the amount of purchased food, since both food intake and waste production are relative to the number of family members.
Hypothesis 9 (H9). 
Household size has a positive effect on the amount of purchased food.
Hypothesis 10 (H10). 
Household size has a positive effect on both self-reported and measured food wastage.
The scientific literature presents a somewhat obscure picture regarding the exact relationship between income and household food waste. There is evidence that low-income households waste less food [44,72,73,74], which might be explained by resource scarcity [10]. However, Setti [75] demonstrated that mid-to-low-income consumers wasted more food compared to low- and high-income consumers. In contrast to previous studies, we hypothesized that income is only indirectly contributing to food waste through unplanned shopping. We assumed that low income households have a tight food budget, and hence, keep a more planned shopping routine (i.e., they are less likely to purchase unintended food items).
Hypothesis 11 (H11). 
Income has a positive effect on unplanned shopping.

3. Results

3.1. Descriptive Results

Table 2 presents the descriptive statistics of self-reported households’ behaviors and attitudes.

3.1.1. Food Planning and Shopping Behaviors

Results show that the vast majority of participants (93%) do check their food inventories before grocery shopping. They further demonstrate that 76% of the participants bought up to five more food items than planned, while only 9.5% report that they do not make a shopping list. We also found that about two-thirds do not plan what they will cook during weekdays. These findings describe relatively planned behaviors regarding food shopping, but rather unplanned meals routines.
The relatively planned nature of participants’ pre-shopping routines (i.e., checking food inventory, making a shopping list) is in line with Janssen et al.’s [76] report using Dutch households, Setti et al. [75] with Italian households, and Neff et al. [77] with American consumers.

3.1.2. Source Separation of Waste

About half of the households reported that they source separate one or more waste streams. This finding is in line with a recent national report indicating that 52% of Israeli households separate at least one waste stream [78].

3.1.3. Environmental Attitudes

Results show that Cronbach’s alpha of the environmental attitudes index was 0.59, which is close enough to the lower acceptable limit in exploratory studies (i.e., 0.6 [56]).
The mean value of the environmental attitudes index was 0.772 (SD = 0.490), indicating a moderate level of agreement with environmental statements. These results are in line with OECD’s [50] findings regarding the Israeli population (M = 0.699, SD = 0.581).

3.1.4. The Amount of Purchased Food

Analysis of grocery shopping receipts revealed that, on average, weekly food purchases amounted to 24.5 kg (SD = 14.6 kg) per household (Elimelech et al. [57], adjusted for N = 169).

3.1.5. Self-Reported Food Wastage

Self-assessed food wastage ranged from 0 (no wastage) to 4.5 (high wastage), with a mean value of 1.317 (SD = 0.776), suggesting that, on average, participants’ self-reports tended to be low. Only two participants reported owning a composter, seventy-one participants reported owning a pet, but the vast majority (82%) stated that the pet is fed with a designated animal food rather than food leftovers. No household reported using a garbage shredder.

3.1.6. Measured Food Wastage

According to the physical waste measurements, the average generation rate of avoidable food waste was 3.012 kg (SD = 2.392 kg) per household per week (Elimelech et al. [57], adjusted for N = 169). This figure might represent an underestimation of measured food wastage, since liquid waste that is disposed via the sewer was not measured [79].

3.2. Overview of Analyses

The correlations among the endogenous and exogenous variables are shown in Table 3. It demonstrates that self-reported food wastage is positively correlated (rp = 0.18, p < 0.05) with measured food wastage, though according to Colton [80], any coefficient values lower than 0.25 should be interpreted as no correlation. Results also show a positive association between household size and measured food wastage, negative associations between waste separation and both self-reported and measured wastage, and between environmental attitudes and self-reported food wastage. A relatively weak negative relation between making a shopping list and self-reported food wastage was also observed. Moreover, a weak and positive relationship exists between the amount of purchased food and measured food wastage. No other direct relations between food wastage and the other variables were found.
These correlations, however, do not disentangle the hypothesized direct and indirect effects of the different drivers of food waste and self-reported and measured wastage, nor do they take into account the interconnections between the different variables. To this end, we conducted the SEM analysis, as reported in Section 3.4.

3.3. Goodness of Fit Indicators

Evaluating whether a conceptual model ‘fits’ the data is one of the most important stages in SEM [81]. Goodness-of-fit indicators signify how well a model predicts or explains what it is designed to predict or explain or, in other words, the predictive accuracy of the model in accounting for the outcomes [82]. In assessing the model’s goodness of fit we relied on three highly regarded data sources—Schreiber [62], Hooper et al. [81], and Kline [83]. The estimation of the fit indices shows that the structural model has a good fit—χ2(18) = 21.68, p = 0.246; RMSEA = 0.035; SRMR = 0.042; CFI = 0.973; GFI = 0.977.

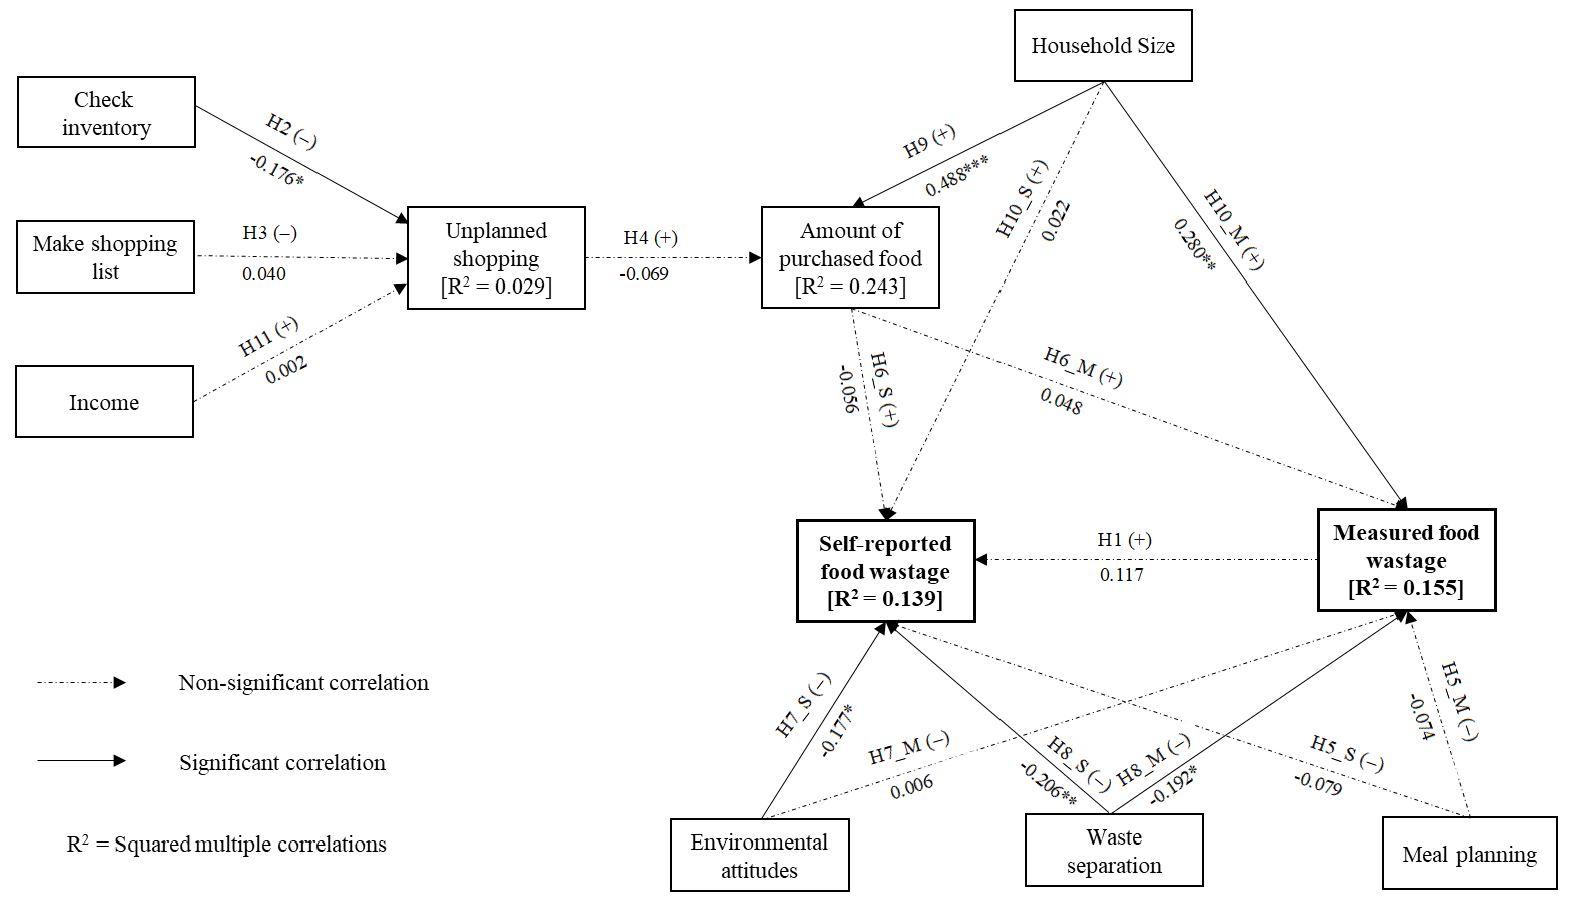
3.4. Structural Model of Households’ Food Wastage

Table 4 presents each of the hypothesized paths in SEM.
The results show no evidence for the assumed correlation between self-reported and measured food wastage (H1). The results support hypothesis 2, i.e., checking food inventories negatively affect unplanned shopping (β = −0.176, p = 0.022). However, hypotheses 3, 4, and 5, were rejected, as we found no evidence that making a shopping list affects unplanned shopping (H3), that unplanned shopping impacts the amount of food purchased (H4), or that meal planning affects food wastage (H5). The hypothesis that the amount of purchased food influences food wastage was also rejected (H6). Interestingly, only three variables were found to affect food wastage. Environmental attitudes were found to have a negative effect on self-reported food wastage (β = −0.177, p = 0.019) (H7_S), but were not correlated with measured food wastage (H7_M). Source separation behavior was found to decrease both self-reported (β = −0.206, p = 0.007) and measured food wastage (β = −0.192, p = 0.01) (H8). Household size was found to increase measured food wastage (β = 0.280, p = 0.001) (H10_M), but not self-reported food wastage (H10_S). Hypothesis 9 was affirmed, thus indicating a positive relationship between household size and the amount of purchased food (β = 0.488, p < 0.0001). Nonsignificant results were found for the positive association between income and unplanned shopping (H11). A summary of the measurements and the structural model are presented in Figure 2.
To sum up, results show that household size is the most important variable in determining measured food wastage, followed by source separation of waste. On the other hand, the most important variable in determining self-reported food wastage is source separation of waste, followed by environmental attitudes.
Finally, the overall explanatory power (R2) of self-reported and measured food wastage in the model equals to 14% and 15%, respectively. Interestingly, while the predicting power of unplanned shopping is weak and equals to 3%, the amount of purchased food has a relatively strong explanatory power (R2), i.e., 24%.

4. Discussion

In light of SDG challenges, understanding households’ food waste drivers is crucial for forming a coherent policy. Therefore, the question of what drives households to waste food is of theoretical and practical importance, but, so far, studies have suggested only partial answers. Our research offers a unique approach to explore this question. A triangulation of findings from three different valuation techniques—a physical waste survey, a food purchases survey, and a questionnaire, all conducted within the same households, allowed us to evaluate both self-reported and measured food wastage and their drivers.
Contrary to our predictions, and contrary to the implicit assumption embedded in studies that use self-reported food wastage as proxy for measured food wastage, measured food wastage was found to be only weakly correlated with self-reported food waste, and when other variables were taken into account in the structural model, this relation was no longer significant. This finding may be explained by the rather subjective nature of self-reports, which mostly rely on participants’ memory and might be driven by people’s tendency to underestimate behaviors that have a negative environmental impact [24,31]. Given the exploratory nature of the study, those findings, at the very least, suggest that the correlation between self-reported and measured food wastage should be further explored. In the case that these findings are found to be consistent over time, they might question the reliability of self-reports (as was suggested by e.g., [8,17,18,20,21]).
Results indicate that unplanned shopping had no effect on the amount of purchased food nor indirect effect on neither self-reported or measured food wastage. This finding suggests that unplanned shopping is not necessarily associated with discarding behavior. It might imply that unplanned shoppers may be actually more creative with their food products or manage their food inventories wisely. Another possible explanation is that the amount of purchased food might not reflect actual food consumption. Notably, this variable has also a very weak explanatory power (R2). These results contradict Stefan et al.’s [34] conclusions that shopping routines (measured as excess food shopping and buying unintended food items, i.e., similarly to the current study) are strongly and directly associated with self-reported food wastage. Results also show that checking food inventories has a negative effect on unplanned shopping, though no similar effect was detected for making a shopping list. Moreover, meal planning was not found to affect either self-reported or measured food wastage. Thus, Stancu et al.’s [35] findings that shopping routines (measured as excess food shopping) are explained, to some extent, by the variation in planning routines (measured as planning of shopping trips and planning meals ahead) were not supported. Thus, our findings question the contribution of food planning and shopping behaviors to food wastage, and contradict previous studies [34,35,37,41], which were all based on self-reports. However, our results are in line with Giordano et al. [8] and Grainger et al. [15], who demonstrated that food planning variables have, at most, only a limited association with measured food wastage.
Our findings emphasize the importance of source separation of waste in explaining both self-reported and measured food wastage. This finding may imply that an active engagement in proenvironmental behavior reduces food wastage as well. It is possible that the act of source separation itself makes individuals more aware to the amount of household waste produced in general, and food waste, in particular, which encourages food waste reduction at the source. This finding supports the results of Abdelradi et al. [38], Secondi et al. [48], and Giordano et al. [8], according to which individuals who separate waste tend to throw away smaller quantities of food. From a policy perspective, this finding is crucial, since it implies that educating citizens to source separation of waste produces is a win–win situation. On the one hand, reducing landfilling, and on the other hand, encouraging food waste prevention.
Unlike previous studies [38,41], our results show that possessing pro-environmental attitudes affects self-reported food wastage. This discrepancy might be a result of employing different measures to assess both environmental attitudes and self-reported food wastage. This relationship between environmental attitudes and self-reported wastage might reflect the ‘self-serving bias’, i.e., individuals that perceive themselves as pro-environmental also perceive themselves as low wasters. Another possible explanation is that individuals make poor estimations of food wastage [17,18,21,84,85]. Interestingly, there was no indication of an association between environmental attitudes and measured food wastage, confirming Giordano et al.’s [8] conclusion that being more environmentally sensitive does not equate to less food waste. A possible explanation is that food waste is perceived as an environmental issue, thus it affects self-reports, yet, it does not translate into reduced objective avoidable food waste. In other words, actual behavior is based on more factors than environmental awareness and knowledge, as was also suggested by Barr [65].
Another finding in our model is the positive contribution of household size to measured food wastage, confirming the results of Giordano et al. [8] and Grainger et al. [15]. The fact that household size appears to be a rather important variable in predicting actual food wastage had led Grainger et al. [15] to recommend that food waste campaigns should target large families. We also established a strong association between the number of family members and the amount of purchased food, which makes great sense.
Contrary to our preliminary assumptions, the model does not reveal any direct or indirect influence of the amount of purchased food on self-reported or measured food wastage. That is, the amount of purchased food is not a good proxy for food wastage. Possible explanations are that the amount of purchased food does not reflect actual food intake (which was not measured in the current study) or that it is not the amount that counts, but rather the types of food items that were bought (i.e., fresh and refrigerated food products with limited shelf-life vs. frozen and pantry food products with extended shelf-live).
Designing effective interventions to meet the SDG requires a good understanding of food waste drivers. The current study suggests that intervention programs would benefit from educating citizens to source separate waste. We also support Grainger et al.’s [15] recommendation to focus efforts on large families.
Finally, Langen et al. [10] argued that the choice of methodology to explore household food waste drivers dictates the quality of the findings. Our results support this claim by demonstrating how different measurement methods yield different results. Our finding that self-reported and measured food wastage are uncorrelated, reveals that the common assumption that self-reports reflect actual behavior is unwarranted. Therefore, we stress the need for a further investigation of food waste drivers, using direct measurement methods.

Limitations and Future Research

The fact that we found no evidence for a connection between self-reported and measured food wastage raises an important theoretical and empirical question concerning how self-reports are formed. This question is specifically important when considering the clear benefits of questionnaires (i.e., they are less invasive, expensive, and time consuming [57]) over direct measurements methods. Hence, studying what self-reports are based on and how to control or lessen the presence of psychological biases (e.g., ‘social desirability bias’, ‘self-serving bias’) is an important research topic. Moreover, to achieve a better control, future research might consider measuring the effects of the ‘social desirability bias’ and the ‘self-serving bias’ on self-reports, using a designated scale [86,87]. This might assist in establishing a better indicator of self-reported food wastage, which might result in a better compatibility with measured food wastage.
As demonstrated, our model shows only partial overlap between parameters that affect self-reported food wastage and parameters that affect measured food wastage. It will be interesting to test whether this overlap will grow when other methods are used to measure perceived food wastage (e.g., assessing discarding frequencies or using more concrete units to assess food waste amounts—weight, volume, etc.) or when providing participants with objective criteria to define small/large amounts.
One limitation of our study is that it based on a moderate and a rather homogeneous sample size. Indeed, the number of observations in our model (169) meets the general consensus of 10 participants per estimated parameter (16) in SEM [62], but our sample size is fairly moderate, when compared to other studies that implemented direct measurement methods [8,15]. The relatively homogenic sociodemographic profile of our participants might explain why income and household size did not contribute to unplanned shopping and self-reported food wastage, respectively. Hence, a future study might benefit from a larger and more heterogeneous sample. Furthermore, it will be interesting to test our conceptual model within different segments of the population.
The selected exogenous variables were able to explain only 15% of measured food wastage variance, which is somewhat low compared to 30% reported by Giordano et al. [8]. However, such comparison is not really viable since different methodologies for measuring actual food wastage were used (i.e., physical waste survey vs. diaries in Giordano et al. [8]), as well as different modelling approaches (i.e., SEM vs. conditional inference random forests algorithm in Giordano et al. [8]), and different set of variables. Nevertheless, the relatively low explanatory power of measured food wastage in the current study implies that other, yet to be explored, variables might better predict actual food wastage. A more coherent picture might be achieved by expanding research to new arenas. For example, while most of current research revolved around planning routines, attitudes toward food waste and the environment, and psychological factors, there is a scarcity of studies that explore culture and religion aspects, and how they are reflected in everyday decisions regarding food management and food discarding habits [1,47,88].

5. Conclusion

The scientific literature regarding the predictors of household food waste presents contradictory findings. Furthermore, current studies of food waste drivers rely mostly on self-reports, under the inherent assumption that they reflect actual behavior. An assumption that has never been put to an empirical test. Our findings question the underlying logic of methods that have been using self-reports as proxy for food waste, by showing that self-reported and measured food wastage are uncorrelated. Moreover, drivers affecting self-reported and measured food wastage are not necessarily the same.

Author Contributions

E.E. (Efrat Elimelech) was responsible for conceptualization, investigation, methodology’s design, and writing the initial draft. E.E. (Eyal Ert) was the supervisor of the project and responsible for the design of methodology and formal analysis, as well as providing commentary and revision. O.A. was the supervisor of the overall research project and contributed to the conception and design of the study, as well as funding acquisition.

Funding

This research was funded by the Chief Scientist of the Israeli Ministry of Agriculture and Rural Development, grant no. 20-14-0030. The funding source had no involvement in any of the research stages nor in the decision to submit this article for publication.

Conflicts of Interest

The authors declare no conflict of interest.

References

  1. Thyberg, K.L.; Tonjes, D.J. Drivers of food waste and their implications for sustainable policy development. Resour. Conserv. Recycl. 2016, 106, 110–123. [Google Scholar] [CrossRef]
  2. Garnett, T. Where are the best opportunities for reducing greenhouse gas emissions in the food system (including the food chain)? Food Policy 2011, 36, 23–32. [Google Scholar] [CrossRef]
  3. Pearson, D.; Minehan, M.; Wakefield-Rann, R. Food waste in Australian households: Why does it occur? Australas. J. Reg. Food Stud. Number 2013, 3, 2013–2119. [Google Scholar]
  4. United Nations. Transforming Our World: The 2030 Agenda for Sustainable Development; United Nations: New York, NY, USA, 2015. [Google Scholar]
  5. Bajželj, B.; Richards, K.S.; Allwood, J.M.; Smith, P.; Dennis, J.S.; Curmi, E.; Gilligan, C.A. Importance of food-demand management for climate mitigation. Nat. Clim. Chang. 2014, 4, 924–929. [Google Scholar] [CrossRef] [Green Version]
  6. Grosso, M.; Falasconi, L. Addressing food wastage in the framework of the UN Sustainable Development Goals. Waste Manag. Res. 2018, 36, 97–98. [Google Scholar] [CrossRef] [PubMed] [Green Version]
  7. Reynolds, C.; Goucher, L.; Quested, T.E.; Bromley, S.; Gillick, S.; Wells, V.K.; Evans, D.; Koh, L.; Carlsson Kanyama, A.; Katzeff, C.; et al. Review: Consumption-stage food waste reduction interventions—What works and how to design better interventions. Food Policy 2019, 83, 7–27. [Google Scholar] [CrossRef]
  8. Giordano, C.; Alboni, F.; Falasconi, L. Quantities, Determinants, and Awareness of Households ‘Food Waste in Italy: A Comparison between Diary and Questionnaires Quantities’. Sustainability 2019, 11, 3381. [Google Scholar] [CrossRef]
  9. Schanes, K.; Dobernig, K.; Gözet, B. Food waste matters—A systematic review of household food waste practices and their policy implications. J. Clean. Prod. 2018, 182, 978–991. [Google Scholar] [CrossRef]
  10. Langen, N.; Göbel, C.; Waskow, F. The effectiveness of advice and actions in reducing food waste. Proc. Inst. Civ. Eng. Waste Resour. Manag. 2015, 168, 72–86. [Google Scholar] [CrossRef]
  11. Reynolds, C.; Goucher, L.; Quested, T.E.; Bromley, S.; Gillick, S.; Wells, V.K.; Evans, D.; Koh, S.L.; Carlsson-Kanyama, A.; Katzeff, C.; et al. Review: Consumption-stage food waste reduction interventions—What works and how to do better. Food Policy 2019, 210, 1435–1448. [Google Scholar] [CrossRef]
  12. Hebrok, M.; Boks, C. Household food waste: Drivers and potential intervention points for design—An extensive review. J. Clean. Prod. 2017, 151, 380–392. [Google Scholar] [CrossRef]
  13. Qi, D.; Roe, B.E. Household food waste: Multivariate regression and principal components analyses of awareness and attitudes among u.s. consumers. PLoS ONE 2016, 11, e0159250. [Google Scholar] [CrossRef] [PubMed]
  14. Giordano, C.; Alboni, F.; Cicatiello, C.; Falasconi, L. Do discounted food products end up in the bin? An investigation into the link between deal-prone shopping behaviour and quantities of household food waste. Int. J. Consum. Stud. 2018, 43, 199–209. [Google Scholar] [CrossRef]
  15. Grainger, M.J.; Aramyan, L.; Piras, S.; Quested, T.E.; Righi, S.; Setti, M.; Vittuari, M.; Stewart, G.B. Model selection and averaging in the assessment of the drivers of household food waste to reduce the probability of false positives. PLoS ONE 2018, 13, e0192075. [Google Scholar] [CrossRef]
  16. Tucker, C.A.; Farrelly, T. Household food waste: The implications of consumer choice in food from purchase to disposal. Local Environ. 2016, 21, 682–706. [Google Scholar] [CrossRef]
  17. Giordano, C.; Piras, S.; Boschini, M.; Falasconi, L. Are questionnaires a reliable method to measure food waste? A pilot study on Italian households. Br. Food J. 2018, 120, 2818. [Google Scholar] [CrossRef]
  18. Elimelech, E.; Ert, E.; Ayalon, O. Bridging the gap between self-assesments and measured household food waste: A hybrid valuation approach. Waste Manag. 2019, 95, 259–270. [Google Scholar] [CrossRef]
  19. Xue, L.; Liu, G.; Parfitt, J.; Liu, X.; Van Herpen, E.; Stenmarck, Å.; O’Connor, C.; Östergren, K.; Cheng, S. Missing Food, Missing Data? A Critical Review of Global Food Losses and Food Waste Data. Environ. Sci. Technol. 2017, 51, 6618–6633. [Google Scholar] [CrossRef]
  20. Van Herpen, E.; van der Lans, I.A.; Holthuysen, N.; Nijenhuis-de Vries, M.; Quested, T.E. Comparing wasted apples and oranges: An assessment of methods to measure household food waste. Waste Manag. 2019, 88, 71–84. [Google Scholar] [CrossRef]
  21. Hoj, S.B. Metrics and Measurement Methods for the Monitoring and Evaluation of Household Food Waste Prevention Interventions. Ph.D. Thesis, University of South Australia, North Terrace, Adelaide, Australia, 2012. [Google Scholar]
  22. Kormos, C.; Gifford, R. The validity of self-report measures of proenvironmental behavior: Ameta-analytic review. J. Environ. Psychol. 2014, 40, 359–371. [Google Scholar] [CrossRef]
  23. Van der Werf, P.; Gilliland, J.A. A systematic review of food losses and food waste generation in developed countries. Proc. Inst. Civ. Eng. Waste Resour. Manag. 2017, 170, 66–77. [Google Scholar] [CrossRef]
  24. Jorissen, J.; Priefer, C.; Brautigam, K.-R. Food waste generation at household level: Results of a survey among employees of two European research centers in Italy and Germany. Sustainability 2015, 7, 2695–2715. [Google Scholar] [CrossRef]
  25. Graham-Rowe, E.; Jessop, D.C.; Sparks, P. Predicting household food waste reduction using an extended theory of planned behaviour. Resour. Conserv. Recycl. 2015, 101, 194–202. [Google Scholar] [CrossRef]
  26. Quested, T.; Luzecka, P. Household Food and Drink Waste: A People Focus; Waste Resources Action Program: Banbury, UK, 2014. [Google Scholar]
  27. Seebauer, S.; Fleiß, J.; Schweighart, M. A Household Is Not a Person: Consistency of Pro-Environmental Behavior in Adult Couples and the Accuracy of Proxy-Reports. Environ. Behav. 2017, 49, 603–637. [Google Scholar] [CrossRef] [PubMed]
  28. Williams, H.; Wikström, F.; Otterbring, T.; Löfgren, M.; Gustafsson, A. Reasons for household food waste with special attention to packaging. J. Clean. Prod. 2012, 24, 141–148. [Google Scholar] [CrossRef] [Green Version]
  29. Schultz, P.W.; Milfont, T.L.; Chance, R.C.; Tronu, G.; Luís, S.; Ando, K.; Rasool, F.; Roose, P.L.; Ogunbode, C.A.; Castro, J.; et al. Cross-Cultural Evidence for Spatial Bias in Beliefs About the Severity of Environmental Problems. Environ. Behav. 2014, 46, 267–302. [Google Scholar] [CrossRef]
  30. Mezulis, A.H.; Abramson, L.Y.; Hyde, J.S.; Hankin, B.L. Is there a universal positivity bias in attributions? A meta-analytic review of individual, developmental, and cultural differences in the self-serving attributional bias. Psychol. Bull. 2004, 130, 711–747. [Google Scholar] [CrossRef] [PubMed]
  31. Gifford, R.; Nilsson, A. Personal and social factors that influence pro-environmental concern and behaviour: A review. Int. J. Psychol. 2014, 49, 141–157. [Google Scholar] [CrossRef]
  32. Lebersorger, S.; Schneider, F. Discussion on the methodology for determining food waste in household waste composition studies. Waste Manag. 2011, 31, 1924–1933. [Google Scholar] [CrossRef]
  33. Van Der Werf, P.; Seabrook, J.A.; Gilliland, J.A. The quantity of food waste in the garbage stream of southern Ontario, Canada households. PLoS ONE 2018, 13, e0198470. [Google Scholar] [CrossRef]
  34. Stefan, V.; van Herpen, E.; Tudoran, A.A.; Lähteenmäki, L. Avoiding food waste by Romanian consumers: The importance of planning and shopping routines. Food Qual. Prefer. 2013, 28, 375–381. [Google Scholar] [CrossRef]
  35. Stancu, V.; Haugaard, P.; Lähteenmäki, L. Determinants of consumer food waste behaviour: Two routes to food waste. Appetite 2016, 96, 7–17. [Google Scholar] [CrossRef] [PubMed]
  36. Russell, S.V.; Young, C.W.; Unsworth, K.L.; Robinson, C. Bringing habits and emotions into food waste behaviour. Resour. Conserv. Recycl. 2017, 125, 107–114. [Google Scholar] [CrossRef]
  37. Aktas, E.; Sahin, H.; Topaloglu, Z.; Oledinma, A.; Huda, A.K.S.; Irani, Z.; Sharif, A.M.; van’t Wout, T.; Kamrava, M. A consumer behavioural approach to food waste. J. Enterp. Inf. Manag. 2018, 31, 658–673. [Google Scholar] [CrossRef] [Green Version]
  38. Abdelradi, F. Food waste behaviour at the household level: A conceptual framework. Waste Manag. 2018, 71, 485–493. [Google Scholar] [CrossRef] [PubMed]
  39. Ponis, S.T.; Papanikolaou, P.A.; Katimertzoglou, P.; Ntalla, A.C.; Xenos, K.I. Household food waste in Greece: A questionnaire survey. J. Clean. Prod. 2017, 149, 1268–1277. [Google Scholar] [CrossRef]
  40. Fami, H.S.; Aramyan, L.H.; Sijtsema, S.J.; Alambaigi, A. Determinants of household food waste behavior in Tehran city: A structural model. Resour. Conserv. Recycl. 2019, 143, 154–166. [Google Scholar] [CrossRef]
  41. Diaz-Ruiz, R.; Costa-Font, M.; Gil, J.M. Moving ahead from food-related behaviours: An alternative approach to understand household food waste generation. J. Clean. Prod. 2018, 172, 1140–1151. [Google Scholar] [CrossRef]
  42. Mondéjar-Jiménez, J.A.; Ferrari, G.; Secondi, L.; Principato, L. From the table to waste: An exploratory study on behaviour towards food waste of Spanish and Italian youths. J. Clean. Prod. 2016, 138, 8–18. [Google Scholar] [CrossRef]
  43. Soorani, F.; Ahmadvand, M. Determinants of consumers’ food management behavior: Applying and extending the theory of planned behavior. Waste Manag. 2019, 98, 151–159. [Google Scholar] [CrossRef]
  44. Soma, T. Space to waste: The influence of income and retail choice on household food consumption and food waste in Indonesia. Int. Plan. Stud. 2019, 1–21. [Google Scholar] [CrossRef]
  45. Quested, T.E.; Ingle, R.; Parry, A. Household Food and Drink Waste in the United Kingdom 2012; WRAP: Banbury, UK, 2013. [Google Scholar]
  46. Canali, M.; Amani, P.; Aramyan, L.; Gheoldus, M.; Moates, G.; Östergren, K.; Silvennoinen, K.; Waldron, K.; Vittuari, M. Food waste drivers in Europe, from identification to possible interventions. Sustainability 2017, 9, 37. [Google Scholar] [CrossRef]
  47. Roodhuyzen, D.M.A.; Luning, P.A.; Fogliano, V.; Steenbekkers, L.P.A. Putting together the puzzle of consumer food waste: Towards an integral perspective. Trends Food Sci. Technol. 2017, 68, 37–50. [Google Scholar] [CrossRef]
  48. Secondi, L.; Principato, L.; Laureti, T. Household food waste behaviour in EU-27 countries: A multilevel analysis. Food Policy 2015, 56, 25–40. [Google Scholar] [CrossRef]
  49. WRAP. Household Food and Drink Waste in the UK 2012—Questionnaires; WRAP: Banbury, UK, 2014. [Google Scholar]
  50. OECD. Greening Household Behaviour: Overview from the 2011 Survey—Revised Edition; OECD Studies on Environmental Policy and Household Behaviour; OECD Publishing: Paris, France, 2014; ISBN 978-92-64-21465-1. [Google Scholar]
  51. Harris-Olszek, R. Combining Work and Family: Division of Labor within the Household (in Hebrew); Ministry of Economy and Industry: Jerusalem, Israel, 2015.
  52. Di Talia, E.; Simeone, M.; Scarpato, D. Consumer behaviour types in household food waste. J. Clean. Prod. 2018, 214, 166–172. [Google Scholar] [CrossRef]
  53. Mallinson, L.J.; Russell, J.M.; Barker, M.E. Attitudes and behaviour towards convenience food and food waste in the United Kingdom. Appetite 2016, 103, 17–28. [Google Scholar] [CrossRef] [Green Version]
  54. CBS Statistical Abstract of Israel. 2018. Available online: https://www.cbs.gov.il/en/publications/Pages/2018/Statistical-Abstract-of-Israel-2018-No-69.aspx (accessed on 5 October 2019).
  55. CBS Income and Expenditure of Households 2017. Available online: https://www.cbs.gov.il/en/publications/Pages/2019/households17-e.aspx (accessed on 5 October 2019).
  56. Hair, J.F., Jr.; Black, W.C.; Babin, B.J.; Anderson, R.E. Multivariate Data Analysis, 7th ed.; Pearson Education Limited: Harlow, UK, 2014; ISBN 9781292021904. [Google Scholar]
  57. Elimelech, E.; Ayalon, O.; Ert, E. What gets measured gets managed: A new method of measuring household food waste. Waste Manag. 2018, 76, 68–81. [Google Scholar] [CrossRef]
  58. Quested, T.E.; Marsh, E.; Stunell, D.; Parry, A.D. Spaghetti soup: The complex world of food waste behaviours. Resour. Conserv. Recycl. 2013, 79, 43–51. [Google Scholar] [CrossRef]
  59. Aschemann-Witzel, J.; de Hooge, I.; Amani, P.; Bech-Larsen, T.; Oostindjer, M. Consumer-related food waste: Causes and potential for action. Sustainability 2015, 7, 6457–6477. [Google Scholar] [CrossRef]
  60. Ullman, J.B. Structural Equation Modeling: Reviewing the Basics and Moving Forward. J. Personal. Assess. 2006, 87, 35–50. [Google Scholar] [CrossRef]
  61. Ullman, J.B.; Bentler, P.M. Structural Equation Modeling. In Handbook of Psychology, Research Methods in Psychology; Irving, B., Weiner John, A., Schinka, W.F.V., Eds.; John Wiley & Sons: Hoboken, NJ, USA, 2012; p. 800. ISBN 1118282035. [Google Scholar]
  62. Schreiber, J.B.; Stage, F.K.; King, J.; Nora, A.; Barlow, E.A. Reporting structural equation modeling and confirmatory factor analysis results: A review. J. Educ. Res. 2006, 99, 323–337. [Google Scholar] [CrossRef]
  63. Priefer, C.; Jörissen, J.; Bräutigam, K.R. Food waste prevention in Europe—A cause-driven approach to identify the most relevant leverage points for action. Resour. Conserv. Recycl. 2016, 109, 155–165. [Google Scholar] [CrossRef]
  64. Visschers, V.H.M.; Wickli, N.; Siegrist, M. Sorting out food waste behaviour: A survey on the motivators and barriers of self-reported amounts of food waste in households. J. Environ. Psychol. 2016, 45, 66–78. [Google Scholar] [CrossRef]
  65. Barr, S. Factors Influencing Environmental Attitudes and Behaviors. Environ. Behav. 2007, 39, 435–473. [Google Scholar] [CrossRef]
  66. Parfitt, J.; Barthel, M.; MacNaughton, S. Food waste within food supply chains: Quantification and potential for change to 2050. Philos. Trans. R. Soc. B Biol. Sci. 2010, 365, 3065–3081. [Google Scholar] [CrossRef] [PubMed]
  67. Principato, L.; Secondi, L.; Pratesi, C.A. Reducing food waste: An investigation on the behavior of Italian youths. Br. Food J. 2015, 117, 731–748. [Google Scholar] [CrossRef]
  68. Muthén, B. A general structural equation model with dichotomous, ordered categorical, and continuous latent variable indicators. Psychometrika 1984, 49, 115–132. [Google Scholar] [CrossRef] [Green Version]
  69. Rhemtulla, M.; Brosseau-Liard, P.É.; Savalei, V. When can categorical variables be treated as continuous? A comparison of robust continuous and categorical SEM estimation methods under suboptimal conditions. Psychol. Methods 2012, 17, 354–373. [Google Scholar] [CrossRef]
  70. Kupek, E. Log-Linear Transformation of Binary Variables: A Suitable Input for SEM. Struct. Equ. Model. 2005, 12, 28–40. [Google Scholar] [CrossRef]
  71. Mattar, L.; Abiad, M.G.; Chalak, A.; Diab, M.; Hassan, H. Attitudes and behaviors shaping household food waste generation: Lessons from Lebanon. J. Clean. Prod. 2018, 198, 1219–1223. [Google Scholar] [CrossRef]
  72. Gaiani, S.; Caldeira, S.; Adorno, V.; Segrè, A.; Vittuari, M. Food wasters: Profiling consumers’ attitude to waste food in Italy. Waste Manag. 2018, 72, 17–24. [Google Scholar] [CrossRef] [PubMed]
  73. Filipová, A.; Mokrejšová, V.; Šulc, Z.; Zeman, J. Characteristics of food-wasting consumers in the Czech Republic. Int. J. Consum. Stud. 2017, 41, 714–722. [Google Scholar] [CrossRef]
  74. McCarthy, B.; Liu, H.B. Food waste and the ‘green’ consumer. Australas. Mark. J. 2017, 25, 126–132. [Google Scholar] [CrossRef]
  75. Setti, M.; Falasconi, L.; Segrè, A.; Cusano, I.; Vittuari, M. Italian consumers’ income and food waste behavior. Br. Food J. 2016, 118, 1731–1746. [Google Scholar] [CrossRef]
  76. Janssen, A.M.; Nijenhuis-de Vries, M.A.; Boer, E.P.J.; Kremer, S. Fresh, frozen, or ambient food equivalents and their impact on food waste generation in Dutch households. Waste Manag. 2017, 67, 298–307. [Google Scholar] [CrossRef]
  77. Neff, R.A.; Spiker, M.L.; Truant, P.L. Wasted food: U.S. consumers’ reported awareness, attitudes, and behaviors. PLoS ONE 2015, 10, e0127881. [Google Scholar] [CrossRef]
  78. Ministry of Agriculture and Rural Development. Food Losses and Food Waste Along the Israeli Fruit and Vegetables Value Chain—Final Report, Research No. 20-14-0030 (in Hebrew); Ministry of Agriculture and Rural Development: Bet Dagan, Israel, 2019.
  79. Gray, S. Down the Drain: Quantification and Exploration of Food and Drink Waste Disposed of to the Sewer by Households in the UK; Waste and Resources Action Program: Banbury, UK, 2009. [Google Scholar]
  80. Colton, T. Statistics in Medicine; Little Brown and Company: New York, BY, USA, 1974; ISBN 9780316152501. [Google Scholar]
  81. Hooper, D.; Coughlan, J.; Mullen, M.R. Structural equation modelling: Guidelines for determining model fit. Electron. J. Bus. Res. Methods 2008, 6, 53–60. [Google Scholar]
  82. Barrett, P. Structural equation modelling: Adjudging model fit. Personal. Individ. Differ. 2007, 42, 815–824. [Google Scholar] [CrossRef]
  83. Kline, R.B. Principles and Practice of Structural Equation Modeling, 3rd ed.; The Guilford Press: New York, NY, USA; London, UK, 2011; ISBN 9781606238776. [Google Scholar]
  84. Ventour, L. The Food We Waste; Waste & Resources Action Programme (WRAP): Banbury, UK, 2008. [Google Scholar]
  85. Delley, M.; Brunner, T.A. Household food waste quantification: Comparison of two methods. Br. Food J. 2018, 120, 1504–1515. [Google Scholar] [CrossRef]
  86. Fisher, R.J.; Katz, J.E. Social-desirability bias and the validity of self-reported values. Psychol. Mark. 2000, 17, 105–120. [Google Scholar] [CrossRef]
  87. Libby, R.; Rennekamp, K. Self-serving attribution bias, overconfidence, and the issuance of management forecasts. J. Account. Res. 2012, 50, 197–231. [Google Scholar] [CrossRef]
  88. Porpino, G. Household Food Waste Behavior: Avenues for Future Research. J. Assoc. Consum. Res. 2016. [Google Scholar] [CrossRef]
Figure 1. The conceptual model.
Sustainability 11 05677 g001
Figure 2. Structural model of households’ self-reported and measured food wastage.
Sustainability 11 05677 g002
Table 1. Sociodemographic data of the sample 1.
Sociodemographic CategoryStatistics 2General Population 4
Gender of participants, female (%)75%50.4%
Age range of participants (%):
     21–2934%13%
     30–3935%13%
     40–4915%12%
     50+16%27%
     Range21–83
     Mean [SD]36.5 [11.5]
Education level of participants (%):
     Elementary School0%12%
     Secondary school7%37%
     Vocational training12%16%
     Academic degree81%35%
Religiosity level of participants (%):
     Secular67%44%
     Traditional12%34%
     Religious21%12%
     Ultra-Orthodox0%10%
Households with children (0–18 years, %)60%41%
Household size
     2–3 family members60%54%
     4–5 family members34%36%
     6+ family members6%11%
     Range2–10
     Mean [SD]3.3 [1.3]3.1
Monthly household’s net income (NIS) 3 16,518
     ≤900033%
     9001–14,00032%
     >14,00035%
1 N = 169; 2 percentages are rounded and therefore do not always add up to 100%; 3 1 NIS = €3.8884/$3.5308 (September 2019); 4 source: [54,55]; all data, except income, refer to the Jewish population in Israel.
Table 2. Descriptive statistics of self-reported households’ behaviors and attitudes 1.
QuestionPossible AnswersFrequencyPercent
Checking inventory before food shopping 2No127.1%
I usually check the food inventory in the fridge and freezer3420.1%
I usually check the food inventory in the pantry21.2%
I usually check the food inventory in the pantry, fridge and freezer12171.6%
Unplanned shopping 2I bought only what I had planned2213.0%
I bought 1–5 more products than planned10763.3%
I bought 6–10 more products than planned3017.8%
I bought 11–15 more products than planned63.6%
I bought more than 15 products than planned42.4%
Making a shopping listThe list is structured according to food categories4828.4%
The list is structured according to the order of shelves and aisles in the supermarket1710.1%
There is no order, I just jot down everything I need to buy on paper8650.9%
Other21.2%
I do not make a shopping list169.5%
Planning of meals during weekdays 2Yes5733.7%
No11266.3%
Source separation of wasteYes8852.1%
No8147.9%
environmental attitudes index 3Environmental issues should be dealt with primarily by future generations 415591.7%
I am not willing to do anything about the environment if others don’t do the same 415189.3%
Environmental impacts are frequently overstated 412875.7%
I am willing to make compromises in my current lifestyle for the benefit of the environment12473.4%
Environmental issues will be resolved in any case through technological progress 411065.1%
Protecting the environment is a means of stimulating economic growth9254.4%
Policies introduced by the government to address environmental issues should not cost me extra money 43118.3%
1 The table presents the original wording of the questions. Most of the responses to the multiple choice questions were converted to dichotomous variables for statistical analysis purposes, as demonstrated in Section 2.3.1, Section 2.3.2 and Section 2.3.3; 2 inspired by WRAP [49]; 3 present the percent of participants agreeing with each statement (agree and strongly agree). 4 items that are worded negatively were reverse coded.
Table 3. Correlations between the variables in the model.
12345678910
1. Measured food wastage
2. Self-reported food wastage0.183 *
3. Amount of purchased food0.188 *−0.013
4. Household size0.334 **0.0720.479 **
5. Income0.053−0.0660.210 **0.380 **
6. Make shopping list0.010−0.187 *0.0060.054−0.002
7. Unplanned shopping0.0740.0710.0170.176 *0.0080.001
8. Check inventory0.029−0.053−0.021−0.028−0.0370.225 **−0.167 *
9. Meal planning−0.128−0.111−0.060−0.164 *−0.0260.017−0.0760.100
10. Waste separation −0.221 **−0.297 **−0.005−0.0990.070−0.0270.0500.0580.033
11. Environmental attitudes−0.070−0.259 **−0.023−0.0220.099−0.0260.1040.0530.0570.339 **
* p < 0.05; ** p < 0.01.
Table 4. Structural model evaluation and hypotheses tests.
Hypothesis 1PathPath Coefficient β SE t-Value—Pr > |t|
H1Measured food wastage → Self-reported food wastage0.1170.0781.5140.130
H2Check inventory → Unplanned shopping −0.1760.077−2.2840.022 *
H3Make shopping list → Unplanned shopping0.0400.0780.5180.605
H4Unplanned shopping → Amount of purchased food−0.0690.067−1.0220.307
H5_MMeal planning → Measured food wastage−0.0740.072−1.0250.305
H5_SMeal planning → Self-reported food wastage−0.0790.073−1.0880.277
H6_MAmount of purchased food → Measured food wastage0.0480.0810.5970.550
H6_SAmount of purchased food → Self-reported food wastage−0.0560.082−0.6830.495
H7_MEnvironmental attitudes → Measured food wastage0.0060.0750.0790.937
H7_SEnvironmental attitudes → Self-reported food wastage−0.1770.075−2.3460.019 *
H8_MWaste separation → Measured food wastage−0.1920.075−2.5760.01 *
H8_SWaste separation → Self-reported food wastage−0.2060.077−2.6960.007 **
H9Household size → Amount of purchased food 0.4880.0598.323<0.0001 ***
H10_MHousehold size → Measured food wastage 0.2800.0803.4970.001 **
H10_SHousehold size → Self-reported food wastage0.0220.0860.2600.795
H11Income → Unplanned shopping0.0020.0760.0260.979
1 M = measured food wastage, S = self-reported food wastage; * p < 0.05; ** p < 0.01; *** p < 0.001.

