Article

Estimating Housing Vacancy Rates in Rural China Using Power Consumption Data

1
Northeast Institute of Geography and Agricultural Ecology, Chinese Academy of Science, Changchun 130102, China
2
School of Geographical Sciences, Northeast Normal University, Changchun 130024, China
3
Department of Geography, Hong Kong Baptist University, Kowloon Tong, Hong Kong, China
*
Author to whom correspondence should be addressed.
Sustainability 2019, 11(20), 5722; https://doi.org/10.3390/su11205722
Submission received: 14 September 2019 / Revised: 12 October 2019 / Accepted: 14 October 2019 / Published: 16 October 2019

Abstract

:
Village hollowing is a growing policy problem globally, but accurately estimating housing vacancy rates is difficult and costly. In this study, we piloted the use of power consumption data to estimate the vacancy rate of rural housing. To illustrate the method used, we took power consumption data in 2014 and 2017 in an area of rural China to analyze the change in housing vacancies. Results indicated that the rural vacancy rates were 5.27% and 8.69%, respectively, while underutilization rates were around 10% in 2014 and 2017. Second, there was significant spatial clustering of vacant rural housing, and the hotspots were mainly distributed in western mountainous areas, whereas villages near urban areas had lower vacancy rates. Third, rural vacancies increased from 2014 to 2017. Compared with other methods, our method proved to be accurate, very cost-effective and scalable, and it can offer timely spatial and temporal information that can be used by policymakers to identify areas with significant village hollowing issues. However, there are challenges in setting the right thresholds that take into consideration regional differences. Therefore, there is also a need for more studies in different regions in order to scale up this method to the national level.

1. Introduction

The depopulation of rural areas (excluding suburban areas) is observed all over the world [1,2,3,4,5]. Since the reform and opening up in 1978, China has urbanized at an unprecedented speed and has perhaps experienced the world’s greatest rural-to-urban migration ever [6,7,8,9,10]. From the years 2000 to 2017, the urban population grew at 3.4% annually, while the rural population decreased at a rate of 2.0% annually [11]. The number of rural-to-urban migrant workers reached 286.52 million by the end of 2017. China’s rapid urbanization has led to the restructuring of physical and human landscapes in rural areas as well as to a variety of related problems, of which village hollowing is particularly significant [12,13].
Village hollowing refers to the decrease of rural populations, resulting in many unoccupied but not demolished dwellings [14]. In China, despite the large numbers migrating from rural to urban areas, rural housing areas showed an abnormal increase, with an average annual growth rate of 1.6% from 1990 to 2017. This is mainly due to the dual-track structure of China’s socioeconomic development, the lack of social security, ambiguous property rights with respect to collective land, and the highly restrictive rural land transfer system, making migrants reluctant to abandon their ownership of farmland and housing after they have moved to the cities [15,16]. In addition to the inefficient use of land, village hollowing leads to deteriorated rural residential environments and the degradation of rural settlements, as well as raising major concerns about future food security [8,17,18,19]. Accordingly, the Chinese government has made it a priority to integrate rural migrants in cities, both institutionally and socioeconomically, and encourage them to surrender their vacant rural housing land. The land would then be reclaimed and converted to cultivated land by land consolidation projects for sustainable rural development in China [20].
The issue of identifying housing vacancies has received a significant amount of attention from the international scientific community: Molloy [21] used data on the duration of vacancies by a census tract from the US Postal Service to identify neighborhoods with an excess supply of housing; Newman, et al. [22] used data on vacant addresses per city provided by the United States Postal Service to build an inventory of vacant urban land in America. Other studies have been conducted using statistics data, sampling surveys, and remote sensing data [23,24,25,26,27]. However, their instruments are often inaccurate or are too expensive and time-consuming to be conducted at a large scale. Therefore, studies using more direct data and more reliable measures to accurately identify vacant rural housing than were previously available are imperative.
In this study, we propose using power consumption data to identify vacant rural housing in Songshan District of Chifeng City. With the rapid development of the Chinese economy, energy demand has increased significantly, and electricity in particular plays an important role in the development of a modern economy and society [28,29,30]. As a global problem, energy poverty is also one of the major challenges in rural areas of China, especially in central China [31]. However, access to electricity is near universal in rural China, and the power supply quality and stability were significantly improved after several large-scale rural power grid construction and transformation projects [32]. According to the Inner Mongolia Statistical Yearbook 2017, per capita electricity consumption in the rural areas of Songshan District was about 727.61 kWh annually. Major home appliance products have been widely popularized and used (75 color television sets, 91 refrigerators, 88 washing machines and 68 mobile phones per 100 households in 2016). This makes power consumption per household a good indicator for evaluating the rural housing vacancy rate. We argue that the strength of this data method lies in its accuracy, cost-effectiveness, scalability—the method can be applied at the national level as well as at a local (village) level for different planning or policy purposes—and has the possibility to construct longitudinal time-series to study changes in rural hollowing over time. With more accurate and timely information, we can address questions such as the true status quo of vacant housing in rural China, the differences in spatial patterns between villages, and the key factors influencing the vacancy rate. These answers could be used to optimize rural land management and underpin the spatial restructuring of rural areas in China.

2. Background of China’s Rural Housing and Land Use Policy

The evolution in rural housing and land use policy in China is a critical factor affecting rural development [33]. From the establishment of the People’s Republic of China in 1949 to early 1952, rural housing was privately owned by farmers and permitted to be sold and purchased, rented, and inherited by law [34]. After 1953, rural China entered a period of socialist transformation: rural land remained private but was managed collectively. From 1962 to the late 1990s, rural housing and land belonged to rural collectives and was not allowed to be sold, purchased, or rented. However, the state recognized the rights of farmers to possess and use rural housing and land for the long term [35]. The central planning economy was changed into a market-based economy after Deng Xiaoping launched economic reforms in 1978. The Chinese government has continued to strengthen the management of rural housing and land, gradually forming a housing land management system based on the principle of “one-household-one-house” [36]. From 2000 to the present, Chinese rural housing has entered an exploratory era regarding the circulation of housing land use rights [34]. During this period, the rural housing land still belongs to rural collectives, can be used by members of the collective village, but cannot be traded outside [35,37].
In practice, the principle of “one-household-one-house” is often violated because of the undefined duration of the use of rural housing, weak supervision, and a lack of planning, resulting in widespread problems related to “one household with multiple homesteads” and the disorderly building of new houses [38,39]. Each rural household can apply for one parcel of housing land for free in their village collective [40]. Young couples could apply for a new homestead when they marry and live away from their parents [41]. In most regions of China, children can inherit the homestead if their parents die. These all contribute to the problem of “one household with multiple homesteads” and exacerbate the inefficiency of rural housing land use due to the lack of an effective exit mechanism. Moreover, the ambiguous property rights of rural collective land and limited rights of disposal by law result in inefficient land use and in a great deal of vacant rural housing [42]. As a consequence, it is suggested to accelerate the institutional reform of rural land use in China, especially the development of a rural housing land transfer mechanism and exit mechanism in order to promote the optimal reallocation and intensive use of land resources, help increase farmers’ income connected with property rights, and improve the quality of life for those living in immigrant areas [19,43,44].
In 2005, the Ministry of Land and Resources proposed an innovative land management policy, known as the “increasing vs. decreasing balance” land-use policy, to achieve equilibrium in the supply of construction land by balancing increases in urban construction (driven by urbanization) and decreases in rural construction land (facilitated by out-migration) [45]. Subsequently, rural housing land reform entered a pilot stage in 2015. The No.1 document of the Central Committee of the Communist Party of China released in 2015 posed that the government should steadily carry out pilot reform of the rural land system, including marketization of rural collective construction land, pilot reform of the housing land system, protecting farmers’ rights of use of rural housing land according to law, reforming the mode of acquisition of rural housing land, and exploring new guarantee mechanisms for rural housing. In 2017, it was proposed to explore the revitalization of the use of vacant rural housing and vacant rural land through leasing and cooperation by rural collectives. This proposal aimed to increase income from farmers’ property and allow the collectives to compensate for peasants who migrated to towns by voluntarily surrendering rural housing land and raising funds through multiple channels. Since 2018, rural housing and land have entered a formal reform stage with the proposition of three rights (proprietorial right, qualification right, and use right) as part of a separation policy for rural housing land. The current institutional arrangements and policies have gradually turned toward guaranteeing farmers’ property rights and providing social welfare improvements from their rural housing and land.
Although local governments in China have implemented pilot schemes in some regions, these transfer modes are fundamentally manipulated and interfered with by governments implementing top-down land policies with inefficient transfer processes and unfair profit sharing [46]. With the development of the reform of “three right separation of rural housing land,” internal and external transfers and a withdrawal mechanism for rural housing land could be improved and accelerate the urbanization process. As Wu and Sun [47] reported, there is an urgent need to promote gradual rural housing land reform and to pay more attention to the transfer of property rights. This should be enacted in the form of bottom-up policies to endow farmers with equal and free transfer rights to their land, especially regarding the connection between “leaving the village” and “settling down in the city,” by creating a social security system that equally provides a dignified basic life for peasants and realizes the surrender or release of unused rural housing and land.

3. Materials and Methods

3.1. Study Area

Songshan District is located south of Chifeng City, in eastern Inner Mongolia (42°01′–42°43′ N, 117°47′–119°39′ E) and has a total area of 5618 km2 [48]. The western part of Songshan District is mountainous; the eastern and middle parts form a plain (Figure 1). Songshan District contains 14 towns and 244 administrative villages, but we collected power consumption data from only 234 villages. The population was 591,900, with an agricultural population of 394,900 in 2017. It is an agricultural county, with a cultivated land area of 181,300 ha and 0.31 ha per capita. The district is located in key farming–pastoral areas in Northern China, and the per capita disposable income of these rural pastoral residents is generally low, reaching 12,400 yuan in 2017. With rapid urbanization, especially new urban district development, the number of resident populations in these 14 towns fell by nearly 58,000 from 2013 to 2016. Along with an increasing number of rural people migrating to urban areas, the phenomenon of hollowing villages characterized by vacant rural housing is becoming more and more serious in the Songshan District of Chifeng City.

3.2. Data

Power consumption data could reflect the degree of housing use. Annual power consumption data on each house in Songshan District in 2014 and 2017 were collected. We collected more than 100,000 pieces of data for each year, with over 179,500 data entries in total. Each entry is the annual power consumption of each house, containing not only the electrical consumption but also the location (village name) of the house. In our data, the exact location and the house owner name are not included to protect the privacy of the households. Based on the location information of each piece of power consumption data, we merged them into 234 villages.

3.3. Methods

3.3.1. Survey Approach

Higher power consumption indicates rural housing is fully in use, and lower values indicate vacant housing. To accurately correspond power consumption and the vacant condition of each house, we used threshold values of power consumption. However, it was a challenge to decide the threshold values of power consumption, which will have a direct effect on the research results. To determine suitable thresholds and gain a better understanding of rural vacancy rates, field surveys, questionnaire investigations, and in-depth interviews were conducted over two weeks during July and August 2018. We first interviewed village cadres in each village to understand the general situation of rural-urban migration, vacant rural housing and the implementation of the rural housing land policy in recent years. Thereafter, we visited 14 villages randomly selected from 14 towns for a house-to-house questionnaire survey. We visited every family in the chosen villages. Our questionnaires focused on the family composition, duration of residence, out-migrations, average monthly electricity consumption level and the household appliances they used. For those vacant housing, we consulted village cadres or their neighbors who helped to take care of houses and could provide information. We also interviewed the staff of the local electricity board that read the power meters to obtain information about monthly household electricity consumption of the vacant rural housing and to guide our choice of power consumption thresholds. A total of 1487 rural households were sampled, and 1263 valid questionnaires were gathered (84.9% response rate).
Through investigation and interviews, we found that rural house vacancy rates are a complex condition, and there are two types or degrees of vacancies. Vacant housing is typically defined as intact houses and yards uninhabited for at least a year. In our fieldwork, we also found houses in good condition but only scantily used; we call these underutilized housing. These houses typically belong to migrant workers who work in the city for many months, leaving old people and (or) children living alone there. In short, we defined the following thresholds:
  • Vacant houses are those that consumed 0–30 kWh per year;
  • Underutilized houses are those that consumed 31–200 kWh per year.

3.3.2. Spatial Clustering Analysis

Global Moran’s I statistics was employed to uncover spatial clustering of rural housing vacancy rates. In this paper, the spatial distribution of housing vacancy rates was measured using the Spatial Autocorrelation (Global Moran’s I) tool based on both feature locations and feature values, simultaneously. Global Moran’s I index can be shown as follows:
I = i = 1 n j i n w i j ( x i x ¯ ) ( x j x ¯ ) 1 n i = 1 n ( x i x ¯ ) 2 i = 1 n j i n w i j
where I represents the Global Moran’s I coefficient, xi and xj represent the housing vacancy rates of village i and j, respectively, x ¯ is the mean value of the variable x, and wij indicates the spatial weight matrix. The range of Global Moran’s I is from −1 to +1. If the Global Moran’s I index is near +1, this indicates a perfect clustering distribution of vacant housing; If the Global Moran’s I index is near −1, this indicates a perfect dispersion distribution of vacant housing; If the Global Moran’s I index is zero, this indicates a random spatial correlation of vacant housing [49,50].
The Getis–Ord G i tool was used to conduct hot spot analyses to better identify the inner spatial heterogeneity of vacant rural housing. In our study, hot spots refer to clusters of high housing vacancy rates with a high z-score and p-value < 0.05, whereas cold spots refer to clusters of low housing vacancy rates with a low z-score and p-value < 0.05. The Getis–Ord G i is expressed as [51,52,53,54]:
G i ( d ) = j = 1 n w i j ( d ) x j / j = 1 n x j
Z ( G i ) = G i E ( G i ) V a r ( G i )
where G i represents the Getis–Ord G i , xi and xj represents the housing vacancy rates of village i and j, respectively, wij indicates the spatial weight matrix, Z( G i ) is the standardization of G i , E( G i ) is the mathematical expectation value of G i , and Var( G i ) is the variance of G i .

4. Results

4.1. Spatial and Temporal Changes of Vacant Rural Housing

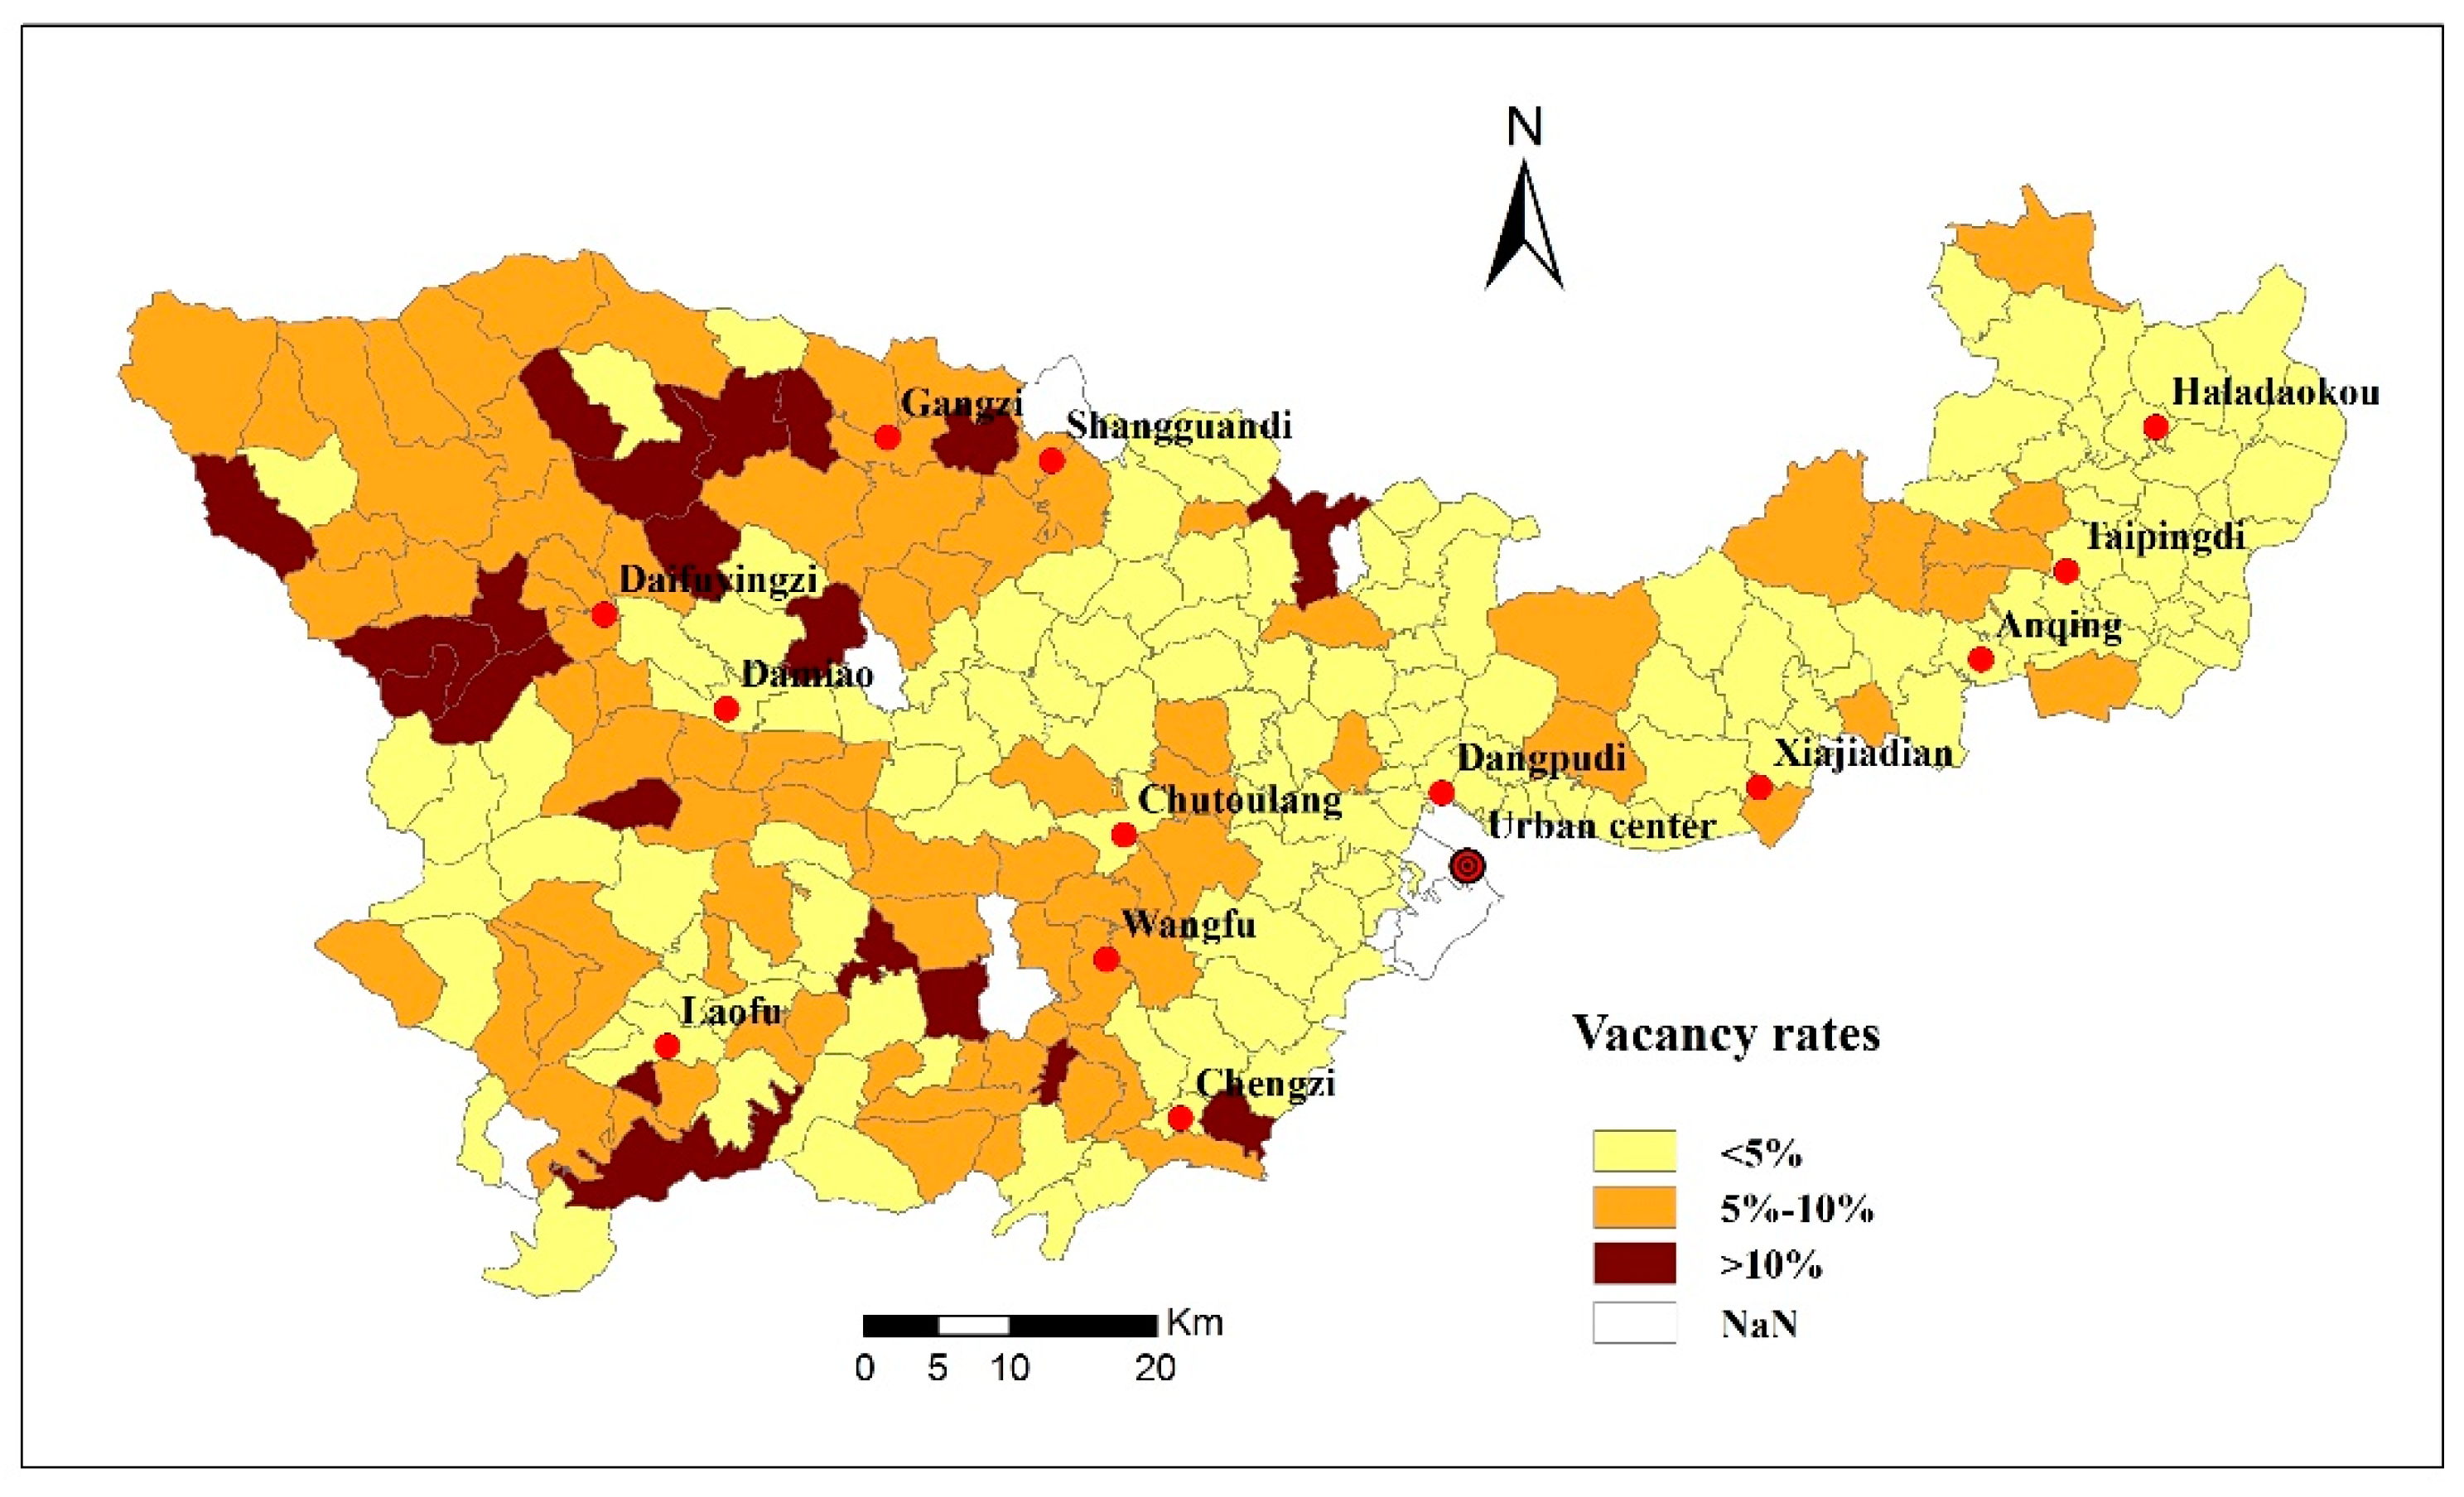
Using the annual power consumption data, we found that the average vacancy rate of rural housing of all villages in 2014 and 2017 was 5.27% and 8.69%, respectively. Figure 2 and Figure 3 shows the spatial pattern of vacancy levels in 2014 and 2017, and it indicates that the vacancy rate is much higher in the western area than the central and eastern regions. The data shows that there are significant differences between different villages. Of the 234 villages, those with high (>10%), medium (5–10%), and low (<5%) vacancy rates were 8.54%, 34.20%, and 57.26%, respectively, in 2014. For example, 10% refers to the high vacancy threshold of a village, and 8.54% of the 234 villages had vacancy rates higher than 10%. Compared with the year 2014, rural housing vacancy levels had risen significantly in 2017; those with high, medium, and low vacancy rates were 30.34%, 52.56%, and 17.09%, respectively. Specifically, there were nearly 90% villages with a vacancy rate that increased from 2014 to 2017.

4.2. Spatial and Temporal Changes of Underutilized Rural Housing

The average underutilization rate of rural housing of all villages was 9.81% and 8.94% in 2014 and 2017, respectively. As shown in Figure 4 and Figure 5, there are also significant spatial differences among the studied villages. The villages with high (>15%) and medium levels (10–15%) of underutilization rates are mostly located in the western mountain areas. Villages with low level (<10%) underutilization rates are widely distributed, accounting for 58.55% and 66.67%, respectively, in 2014 and 2017. We further found that in 83 villages, underutilized houses became vacant housing from 2014 to 2017, which was the main reason why the number of villages with high underutilization rates fell by 6 percent from 2014 to 2017.

4.3. Cluster Characteristics of Vacant Rural Housing

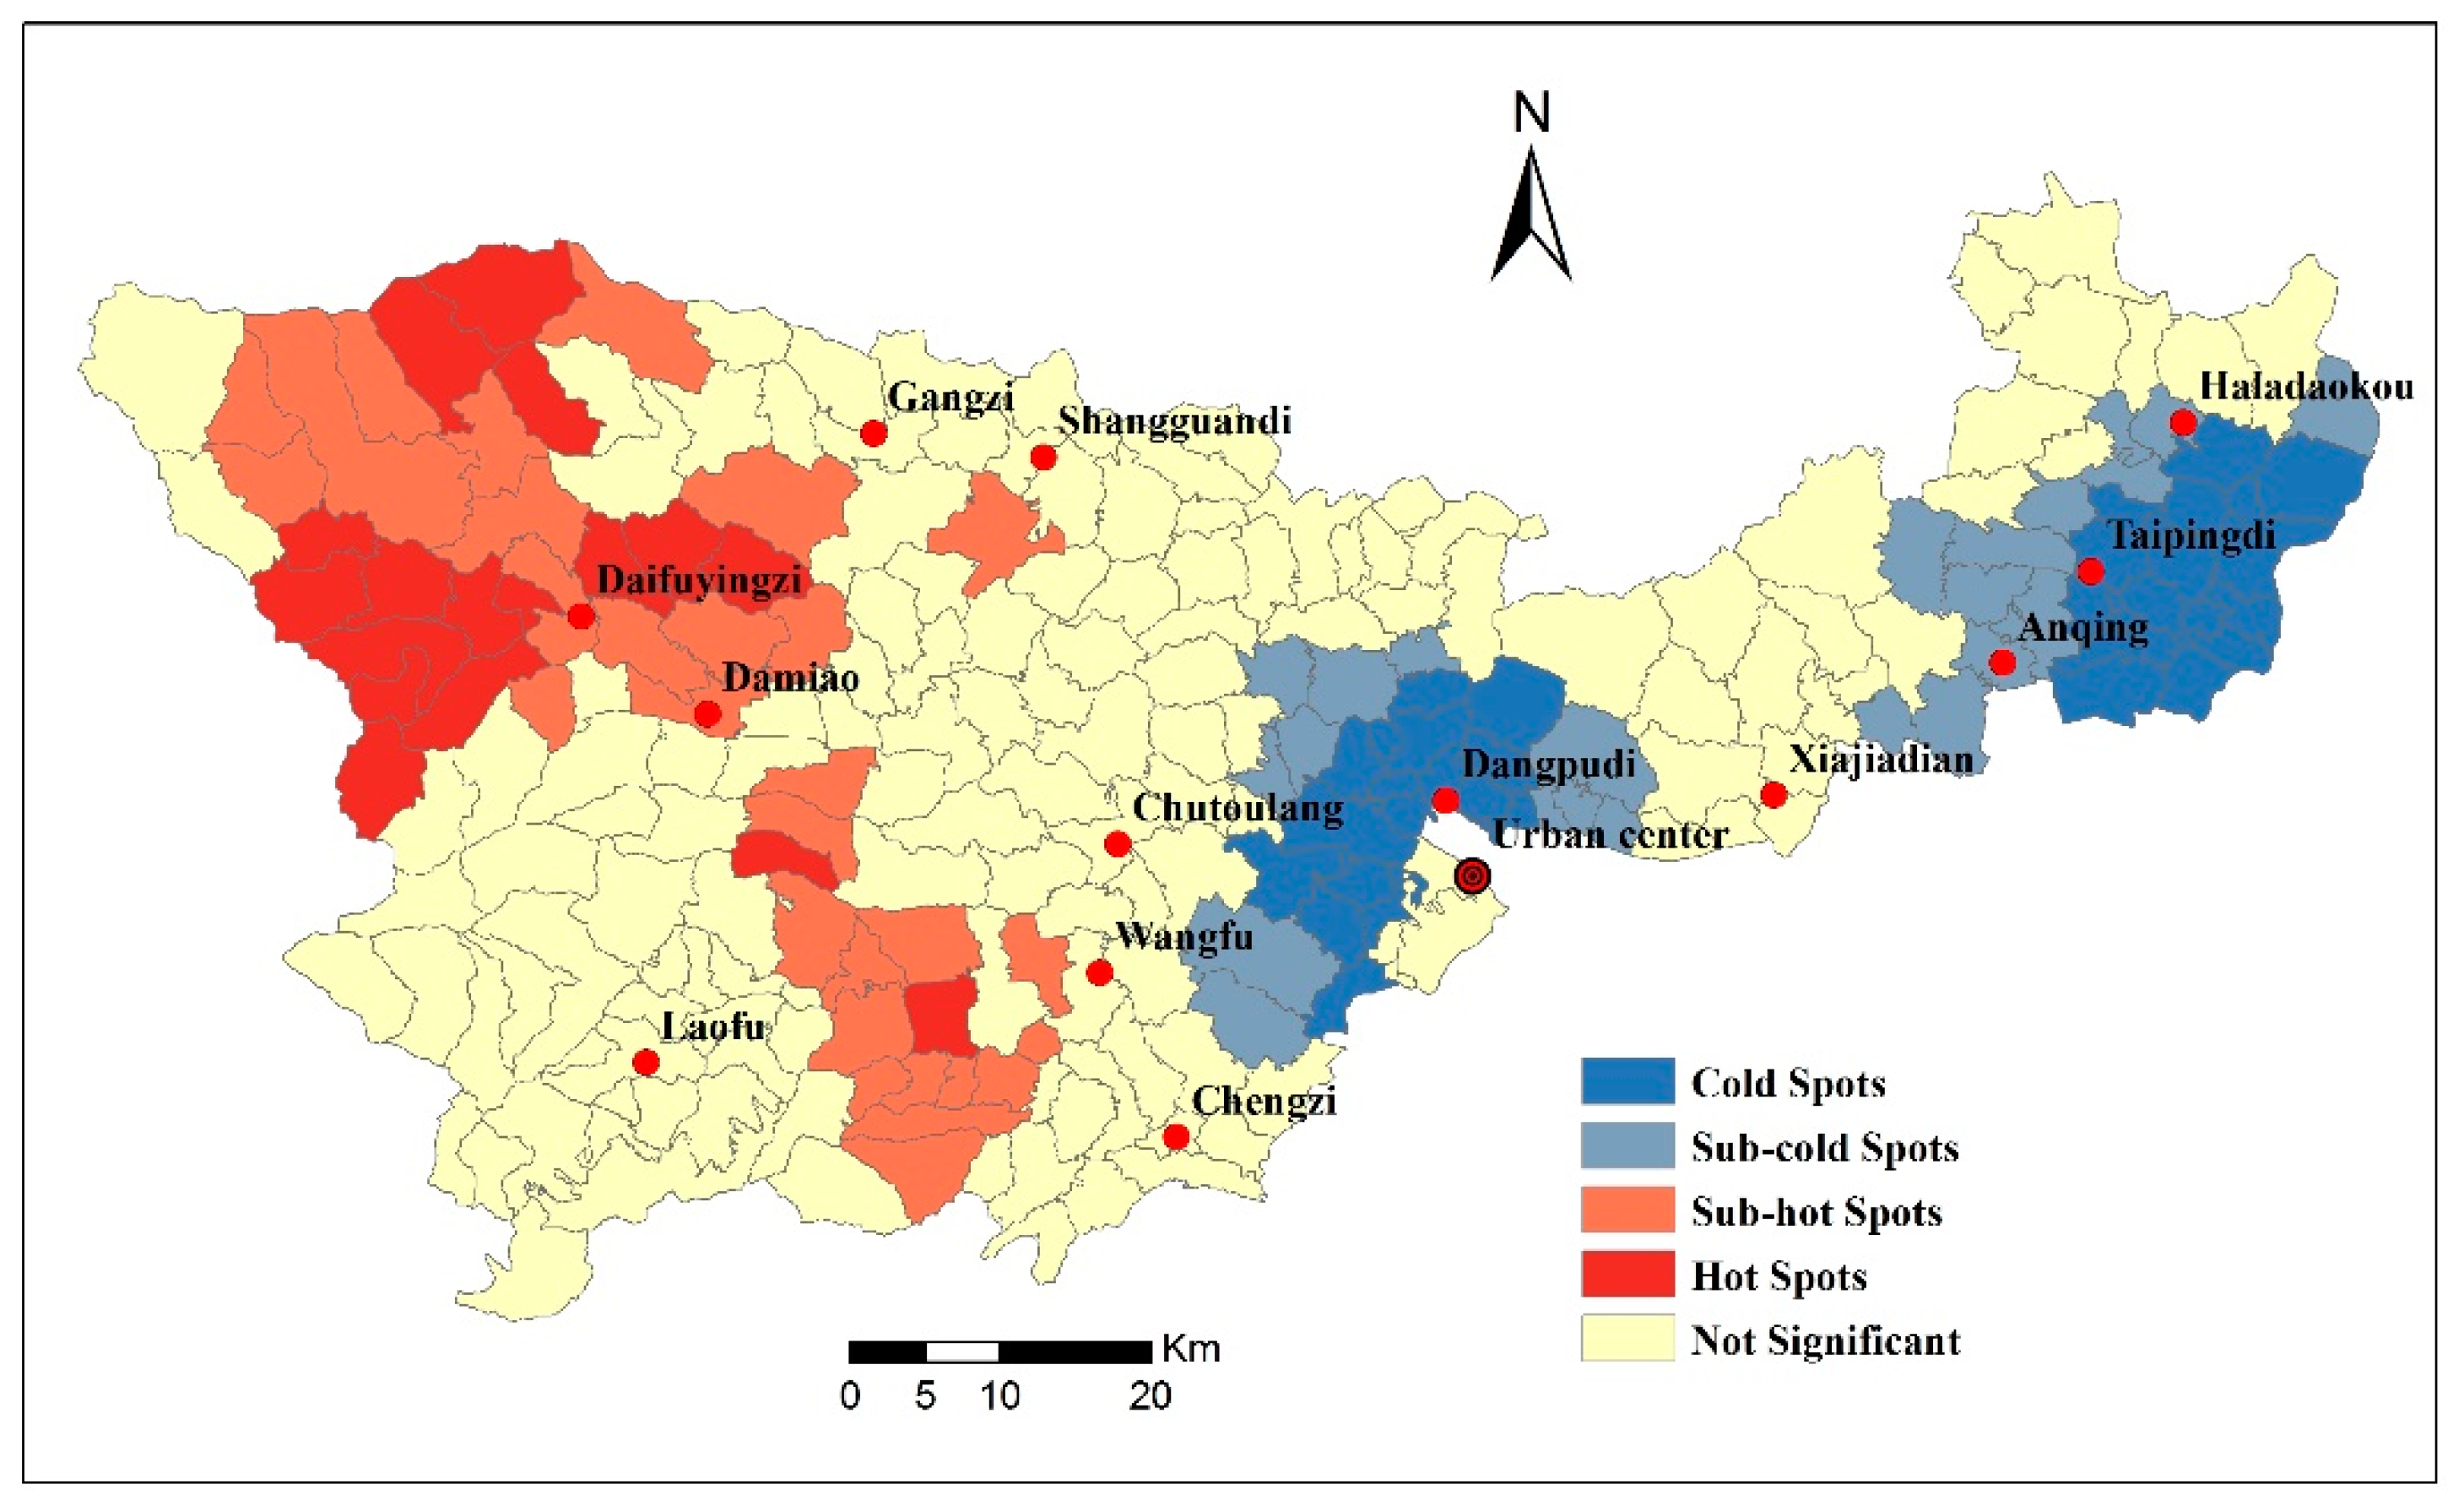
We further examined the detailed spatial distribution of vacant rural housing using the Global Moran’s I and Getis–Ord   G i tools. Global Moran’s I of vacant rural housing in 2014 and 2017 was calculated using Geographic Information Systems (ESRI ArcGIS 10.4 desktop). Global Moran’s I was 0.237 and 0.386 with a z-score of 7.581 and 11.919 in 2014 and 2017, respectively, which reveals there is significant (p < 0.001) spatial clustering of vacant rural housing. This is followed by further hot spot analysis with the Getis–Ord G i measure to explore detailed spatial clusterness within the study area. Figure 6 and Figure 7 shows the spatial difference of the hot and cold spots at the local level of vacant rural housing in 2014 and 2017. The hot spots of vacant rural housing were mainly distributed in western mountainous areas. The hot spot areas gradually increased from 33 villages in 2014 to 46 villages in 2017, and the average vacancy rate increased from 9.23% to 13%. Furthermore, the cold spots of vacant rural housing were located in the central and eastern areas. It is worth noting that the villages around major urban centers usually had lower vacancy rates.

5. Discussion

5.1. Relationship Between Terrain and Vacant Housing Rate

Rural development is multidimensional and physical conditions are quite important for the formation and evolution of a hollowed village [55,56]. Our findings suggested that vacancy and underutilization rates were much high in the western region than the central and eastern regions. This spatial characteristic can be explained by referencing the terrain features of the study area, as shown in the Digital Elevation Model (DEM) (Figure 1). Western Songshan District is mountainous, whereas the central and eastern regions are relatively flat with some undulating landscape. Inconvenient transportation and poor living conditions in mountain villages push rural outmigration and lead to higher vacancy and underutilization rates of rural housing land compared with communities on the plain. More specifically, villages at a higher elevation (>1000 m) had average vacant housing rates of 7.41% and 11.48% and underutilization rates of 13.33% and 11.11% in 2014 and 2017, whereas the vacancy rates were 3.45% and 5.88% and the underutilization rate was 6.81% at a lower elevation (<700 m) in 2014 and 2017 (Table 1). Consistent with our results, Liu, et al. [57] also found that the worse the terrain conditions were and the more isolated the local natural environment was, the higher the probability that rural migrant workers would out-migrate to engage in off-farm employment.

5.2. Relationship Between Reclamation and Vacant Housing Rate

Furthermore, the land reclamation rate (cultivated land area divided by total land area) had statistically significant and negative effects on rural housing vacancy and underutilization rates. As shown in Figure 8, with the increase of the proportion of cultivated land resources, the vacancy and underutilization rates of rural housing will be significantly reduced (Rvacancy rate2 = 0.31 and Runderutilization rate2 = 0.28, P < 0.001). As cultivated land is scarce and the income is limited, farmers are more inclined to move from these areas to cities for work. This result agrees well with that of Wang [58], who reported that rural hollowing generally appeared in areas with a low proportion of cultivated land resources, poor agricultural production conditions, and a low comparative benefit from agriculture. Moreover, our findings also have profound implications for the rural economic restructuring of these areas with an enhanced focus on suitable agriculture-related industries in accordance with the a region’s physical conditions, such as rural tourism, recreational agriculture, ecological agriculture, and agricultural processing to offer more employment opportunities for peasants, increase income for farmers, and enhance rural agglomeration capacity, thereby preventing further rural hollowing.

5.3. Relationship Between Urbanization Level and Vacant Housing Rate

Due to rapid industrialization and urbanization, rural areas undergo significant changes in demographic structures and some experience drastic depopulation [24,59]. Rural dwellers, especially young adults, have poured into cities in search of more employment opportunities, higher and stable income, and better living and education standards; leaving their rural dwellings unoccupied [60]. Chifeng City is experiencing accelerating urbanization (49.38% in 2017). From 2008 to 2016, the rural population of Chifeng decreased by 290,200. Especially with the municipal government relocating to Songshan District, the new urban district is developing rapidly, and the housing market is blooming. Such rapid urbanization has attracted a massive influx of rural migrant workers into the cities in search of employment opportunities and has led to higher rates of housing underutilization and vacancies. An interesting finding was that that the villages around the major urban centers usually had lower vacancy rates. According to our survey, with the advantages of being located close to a central city, most peasant workers chose to stay in their home villages at night. This result echoes earlier research, in which Song, Chen and Zhang [27] also showed that the rural housing vacancy rates of villages in exurbs of a central city were higher than that in the suburbs.

6. Conclusions

Village hollowing is a growing problem in rural China due to rapid industrialization and urbanization. However, measuring housing vacancies in rural China remains a challenge. Taking Songshan District in Chifeng City as an example, we piloted a new method of using power consumption data to estimate vacancy rates in rural China. First, the results showed that the levels of complete abandonment of rural housing were 5.27% and 8.69% in 2014 and 2017, respectively, an average annual increase of around 1.14%. Underutilized rural housing in the study area was quite serious, at around 10% in 2014 and 2017. Furthermore, the vacancy and underutilization rates were much higher in the western region than the central and eastern regions. Second, we found that there was significant spatial clustering of vacant rural housing. Hot spots of rural housing vacancy rates were mainly distributed in western mountainous areas and increased largely from 2014 to 2017. An interesting finding was that the villages around the urban center usually had lower vacancy rates. Finally, our analysis illustrated multiple factors including the location, terrain conditions, the proportion of cultivated land resources, and urbanization levels can lead to further rural hollowing.
This paper makes a significant contribution by showing that power consumption data can be used to accurately estimate vacancy and underutilization rates of rural housing. A number of researchers have explored the vacancy rates of rural houses. Song, Chen and Zhang [27] defined village hollowing based on the ratio of vacant and abandoned houses to all houses. Based on investigation data on China in 2010 and 2011, they drew the conclusion that the average vacancy rate was 10.15%. Yu, et al. [61] also investigated the inefficient use of rural houses, and using “thousand villages investigation” data, they obtained a vacancy rate of 10.2% in China and a rate of inefficient use equal to 14.9%. Our results show a slightly lower vacancy and underutilization rates, which might be due to the use of different parameters and regional scales.
Compared with other research studies, this research has shown how power consumption data can be used to estimate rural housing vacancy and underutilization rates and our method has several advantages. First, the method used in this research is more accurate. Studies based on remote sensing of night-time light is limited by the resolution of the satellite images [62], whereas power consumption data is accurate down to individual households; Second, it is very cost-effective, especially when compared to field inspections, because it uses readily available data; Third, it offers timely spatial information which can be used by policymakers to identify areas with significant village hollowing issues; Fourth, it allows temporal analysis of vacancies, which aids our understanding of short- and long-term trends in rural hollowing.
However, the main challenge of the method is setting the accurate thresholds to differentiate vacant houses and underutilized houses from occupied houses. The State Grid of China estimated that the vacancy rate was 14% for rural housing in 2017 using a threshold annual power consumption of < 20 kWh [63]. From our field survey, however, we found that a higher (30 kWh) threshold could more accurately reflect rural vacancies. This reflects regional differences in power consumption. Therefore, in order to scale up this method to the national level, it is necessary that more studies be conducted in different regions to identify locally appropriate thresholds.

Author Contributions

Conceptualization, J.L. and M.G.; methodology, M.G.; formal analysis, J.L. and K.L.; investigation, J.L. and M.G.; writing—original draft preparation, J.L.; writing—review and editing, K.L. and M.G.

Funding

This study was funded by the National Natural Science Foundation of China, grant number 41771179, 41871103 and 41571152; Strategic Planning Project from Institute of Northeast Geography and Agroecology (IGA), Chinese Academy of Sciences, grant number Y6H2091001 and the Key Research Program of the Chinese Academy of Sciences, grant number KSZD-EW-Z-021-03 and KFZD-SW-314.

Acknowledgments

Authors want to acknowledge all the people who contributed to the questionnaire survey.

Conflicts of Interest

The authors declare no conflict of interest.

References

  1. McGreevy, S. Lost in Translation: Incomer Organic Farmers, Local Knowledge, and the Revitalization of Upland Japanese Hamlets. Agric. Hum. Values 2012, 29, 393–412. [Google Scholar] [CrossRef]
  2. Lambin, E.F.; Meyfroidt, P. Land use transitions: Socio-ecological feedback versus socio-economic change. Land Use Policy 2010, 27, 108–118. [Google Scholar] [CrossRef]
  3. Carr, P.J.; Kefalas, M. Hollowing out the middle: The rural brain drain and what it means for America. J. Rural Soc. Sci. 2010, 291, 30–34. [Google Scholar]
  4. Jedwab, R.; Christiaensen, L.; Gindelsky, M. Demography, urbanization and development: Rural push, urban pull and…urban push? J. Urban Econ. 2017, 98, 6–16. [Google Scholar] [CrossRef]
  5. Itoh, R. Dynamic control of rural–urban migration. J. Urban Econ. 2009, 66, 196–202. [Google Scholar] [CrossRef]
  6. Kojima, R. Urbanization in China. Dev. Econ. 1995, 33, 121–154. [Google Scholar] [CrossRef]
  7. Friedmann, J. Four theses in study of China’s urbanization. China City Plan. Rev. 2006, 30, 440–451. [Google Scholar] [CrossRef]
  8. Li, Y.; Jia, L.; Wu, W.; Yan, J.; Liu, Y. Urbanization for rural sustainability—Rethinking China’s urbanization strategy. J. Clean. Prod. 2018, 178, 580–586. [Google Scholar] [CrossRef]
  9. Ao, X.; Jiang, D.; Zhao, Z. The impact of rural–urban migration on the health of the left-behind parents. China Econ. Rev. 2016, 37, 126–139. [Google Scholar] [CrossRef]
  10. Seto, K.C.; Michail, F.; Burak, G.; Reilly, M.K. A meta-analysis of global urban land expansion. PLoS ONE 2011, 6, e23777. [Google Scholar] [CrossRef]
  11. National Bureau of Statistics. China Statistical Yearbook 2017; China Statistics Press: Beijing, China, 2017.
  12. Tan, M.; Li, X. The changing settlements in rural areas under urban pressure in china: Patterns, driving forces and policy implications. Landsc. Urban Plan. 2013, 120, 170–177. [Google Scholar] [CrossRef]
  13. Long, H.; Liu, Y.; Li, X.; Chen, Y. Building new countryside in China: A geographical perspective. Land Use Policy 2010, 27, 457–470. [Google Scholar] [CrossRef]
  14. Liu, Y.; Liu, Y.; Chen, Y.; Long, H. The process and driving forces of rural hollowing in china under rapid urbanization. J. Geogr. Sci. 2010, 20, 876–888. [Google Scholar] [CrossRef]
  15. Qin, H.; Liao, T.F. Labor out-migration and agricultural change in rural china: A systematic review and meta-analysis. J. Rural Stud. 2016, 47, 533–541. [Google Scholar] [CrossRef]
  16. Wang, L. Research on the Response of Rural Residential Land Idle and Withdrawal based on Household Characteristics—Yining City as an Example. Master’s Thesis, Xinjiang Agricultural University, Xinjiang, China, 2016. [Google Scholar]
  17. Liu, Y.; Lu, S.; Chen, Y. Spatio-temporal change of urban–rural equalized development patterns in china and its driving factors. J. Rural Stud. 2013, 32, 320–330. [Google Scholar] [CrossRef]
  18. Li, Y.; Long, H.; Liu, Y. Spatio-temporal pattern of china’s rural development: A rurality index perspective. J. Rural Stud. 2015, 38, 12–26. [Google Scholar] [CrossRef]
  19. Tu, S.; Long, H.; Zhang, Y.; Ge, D.; Qu, Y. Rural restructuring at village level under rapid urbanization in metropolitan suburbs of china and its implications for innovations in land use policy. Habitat Int. 2018, 77, 143–152. [Google Scholar] [CrossRef]
  20. Li, Y.; Wu, W.; Liu, Y. Land consolidation for rural sustainability in china: Practical reflections and policy implications. Land Use Policy 2018, 74, 137–141. [Google Scholar] [CrossRef]
  21. Molloy, R. Long-term vacant housing in the United States. Reg. Sci. Urban Econ. 2016, 59, 118–129. [Google Scholar] [CrossRef] [Green Version]
  22. Newman, G.D.; Bowman, A.O.M.; Lee, R.J.; Kim, B. A current inventory of vacant urban land in America. J. Urban Des. 2016, 21, 302–319. [Google Scholar] [CrossRef]
  23. Song, H. “Hollow village” evolution and policy control from the perspective of rural urbanization: A case study of Jiangsu province. Asian Agric. Res. 2016, 08, 22–26. [Google Scholar]
  24. Li, T.; Long, H.; Liu, Y.; Tu, S. Multi-scale analysis of rural housing land transition under china’s rapid urbanization: The case of Bohai Rim. Habitat Int. 2015, 48, 227–238. [Google Scholar] [CrossRef]
  25. Long, H.; Heilig, G.K.; Li, X.; Zhang, M. Socio-economic development and land-use change: Analysis of rural housing land transition in the transect of the Yangtse River, China. Land Use Policy 2007, 24, 141–153. [Google Scholar] [CrossRef]
  26. Fang, Y.-G.; Shi, K.-J.; Niu, C.-C. A comparison of the means and ends of rural construction land consolidation: Case studies of villagers’ attitudes and behaviours in changchun city, Jilin province, China. J. Rural Stud. 2016, 47, 459–473. [Google Scholar] [CrossRef]
  27. Song, W.; Chen, B.; Zhang, Y. Typical survey and analysis on influencing factors of village-hollowing of rural housing land in China. Geogr. Res. 2013, 32, 20–28. [Google Scholar]
  28. Deng, C.; Li, K.; Peng, C.; Han, F. Analysis of technological progress and input prices on electricity consumption: Evidence from china. J. Clean. Prod. 2018, 196, 1390–1406. [Google Scholar] [CrossRef]
  29. Chen, W.; Zhou, K.; Yang, S.; Wu, C. Data quality of electricity consumption data in a smart grid environment. Renew. Sustain. Energy Rev. 2017, 75, 98–105. [Google Scholar] [CrossRef]
  30. Guo, Z.; Zhou, K.; Zhang, X.; Yang, S.; Shao, Z. Data mining based framework for exploring household electricity consumption patterns: A case study in China context. J. Clean. Prod. 2018, 195, 773–785. [Google Scholar] [CrossRef]
  31. Zhao, X.; Chen, H.; Ma, Y.; Gao, Z.; Xue, B. Spatio-temporal variation and its influencing factors of rural energy poverty in china from 2000 to 2015. Geogr. Res. 2018, 37, 1115–1126. [Google Scholar]
  32. Liao, H. Residential energy consumption in rural china: Situation, problems and solutions. J. Beijing Inst. Technol. 2019, 21, 1–5. [Google Scholar]
  33. Huang, X.; Li, H.; Zhang, X.; Zhang, X. Land use policy as an instrument of rural resilience—The case of land withdrawal mechanism for rural homesteads in China. Ecol. Indic. 2018, 87, 47–55. [Google Scholar] [CrossRef]
  34. Zhu, X.; Chen, L.; Fu, J. Tendency and implication of rural residential land system change. China Land Sci. 2012, 26, 39–43. [Google Scholar]
  35. Wu, Y.; Mo, Z.; Peng, Y.; Skitmore, M. Market-driven land nationalization in china: A new system for the capitalization of rural homesteads. Land Use Policy 2018, 70, 559–569. [Google Scholar] [CrossRef]
  36. Yu, Z.; Wu, C.; Tan, Y.; Zhang, X. The dilemma of land expansion and governance in rural china: A comparative study based on three townships in Zhejiang province. Land Use Policy 2018, 71, 602–611. [Google Scholar] [CrossRef]
  37. Zou, B.; Mishra, A.K.; Luo, B. Aging population, farm succession, and farmland usage: Evidence from rural China. Land Use Policy 2018, 77, 437–445. [Google Scholar] [CrossRef]
  38. Long, K.; Liu, C.; Chen, L. Analysis on peasants’ willingness-to-accept and its influencing factors of governance patterns about rural idle residential land. China Popul. Resour. Environ. 2012, 22, 83–89. [Google Scholar]
  39. Chen, H.; Zhao, L.; Zhao, Z. Influencing factors of farmers’ willingness to withdraw from rural homesteads: A survey in Zhejiang, China. Land Use Policy 2017, 68, 524–530. [Google Scholar] [CrossRef]
  40. Xue, P.; He, C.; Liu, S. Analysis on present situation and influencing factors of rural settlement hollowing in the hilly and mountainous area in Sichuan. Guangdong Agric. Sci. 2013, 40, 207–210. [Google Scholar]
  41. Meng, X.; Xin, B. Clear right of use: The way to solve the problem of rural homestead waste. Rural Econ. 2006, 13–15. [Google Scholar]
  42. Kong, X.; Liu, Y.; Jiang, P.; Tian, Y.; Zou, Y. A novel framework for rural homestead land transfer under collective ownership in China. Land Use Policy 2018, 78, 138–146. [Google Scholar] [CrossRef]
  43. Long, H.; Tu, S.; Ge, D.; Li, T.; Liu, Y. The allocation and management of critical resources in rural china under restructuring: Problems and prospects. J. Rural Stud. 2016, 47, 392–412. [Google Scholar] [CrossRef]
  44. Hu, Z.; Peng, J.; Du, Y.; Song, Z.; Liu, Y.; Wang, Y. Reconstructing hollow villages in the view of structural reform of the supply side. Acta Geogr. Sin. 2016, 71, 2119–2128. [Google Scholar]
  45. Long, H.; Li, Y.; Liu, Y.; Woods, M.; Zou, J. Accelerated restructuring in rural china fueled by ‘increasing vs. Decreasing balance’ land-use policy for dealing with hollowed villages. Land Use Policy 2012, 29, 11–22. [Google Scholar] [CrossRef]
  46. Sun, S.; Meng, Y. On background, influencing factors, model and future of rural land circulation—Review and explanation of the policy. Theory J. 2015, 37–45. [Google Scholar]
  47. Wu, Y.; Sun, X. The review and prospect of land use policy in china after the 40 years of reform and opening up: An urbanization perspective. China Land Sci. 2018, 32, 7–14. [Google Scholar]
  48. Sheng, Y.; Qin, F.; Wang, G.; Bao, S. Simulation of cultivated land evolution in songshan district of Chifeng city. Bull. Soil Water Conserv. 2017, 37, 206–211+202. [Google Scholar]
  49. Deng, X.; Xu, Y.; Han, L.; Yang, M.; Yang, L.; Song, S.; Li, G.; Wang, Y. Spatial–temporal evolution of the distribution pattern of river systems in the plain river network region of the Taihu Basin, China. Quat. Int. 2016, 392, 178–186. [Google Scholar] [CrossRef]
  50. Liu, Q.; Wang, S.; Zhang, W.; Li, J.; Kong, Y. Examining the effects of income inequality on co2 emissions: Evidence from non-spatial and spatial perspectives. Appl. Energ. 2019, 236, 163–171. [Google Scholar] [CrossRef]
  51. Chang, B.A.; Pearson, W.S.; Owusu-Edusei, K. Correlates of county-level nonviral sexually transmitted infection hot spots in the us: Application of hot spot analysis and spatial logistic regression. Ann. Epidemiol. 2017, 27, 231–237. [Google Scholar] [CrossRef]
  52. Getis, A.; Ord, J.K. The analysis of spatial association by use of distance statistics. Geogr. Anal. 1992, 24, 189–206. [Google Scholar] [CrossRef]
  53. Maina, I.; Kavadas, S.; Katsanevakis, S.; Somarakis, S.; Tserpes, G.; Georgakarakos, S. A methodological approach to identify fishing grounds: A case study on Greek Trawlers. Fish. Res. 2016, 183, 326–339. [Google Scholar] [CrossRef]
  54. Hsueh, Y.-H.; Lee, J.; Beltz, L. Spatio-temporal patterns of dengue fever cases in Kaoshiung city, Taiwan, 2003–2008. Appl. Geogr. 2012, 34, 587–594. [Google Scholar] [CrossRef]
  55. Liu, Y.; Liu, Y. Progress and prospect on the study of rural hollowing in china. Geogr. Res. 2010, 29, 35–42. [Google Scholar]
  56. Yılmaz, B.; Daşdemir, İ.; Atmiş, E.; Lise, W. Factors affecting rural development in Turkey: Bartın case study. Policy Econ 2010, 12, 239–249. [Google Scholar] [CrossRef]
  57. Liu, S.; Xie, F.; Zhang, H.; Guo, S. Influences on rural migrant workers’ selection of employment location in the mountainous and upland areas of Sichuan, China. J. Rural Stud. 2014, 33, 71–81. [Google Scholar] [CrossRef]
  58. Wang, G. Analysis on governance characteristics of rural hollowing in Japan. World Agric. 2015, 53–57. [Google Scholar]
  59. Li, Y.; Westlund, H.; Zheng, X.; Liu, Y. Bottom-up initiatives and revival in the face of rural decline: Case studies from China and Sweden. J. Rural Stud. 2016, 47, 506–513. [Google Scholar] [CrossRef]
  60. Zhao, Q.; Zhang, Z. Does china’s ‘increasing versus decreasing balance’ land-restructuring policy restructure rural life? Evidence from dongfan village, Shaanxi Province. Land Use Policy 2017, 68, 649–659. [Google Scholar] [CrossRef]
  61. Yu, L.; Sun, D.; Zhang, D.; Zheng, B.; Han, L.; Yu, Z. Rural household survey based analysis of hollowing of rural residential land in China. Sci. Geogr. Sin. 2016, 36, 1043–1049. [Google Scholar]
  62. Zheng, Q.; Zeng, Y.; Deng, J.; Wang, K.; Jiang, R.; Ye, Z. “Ghost cities” identification using multi-source remote sensing datasets: A case study in Yangtze River Delta. Appl. Geogr. 2017, 80, 112–121. [Google Scholar] [CrossRef]
  63. Chen, X. From rural reform 40 years to see the proposal of rural revitalization strategy. Rural Oper. Manag. 2018, 6–10. [Google Scholar]
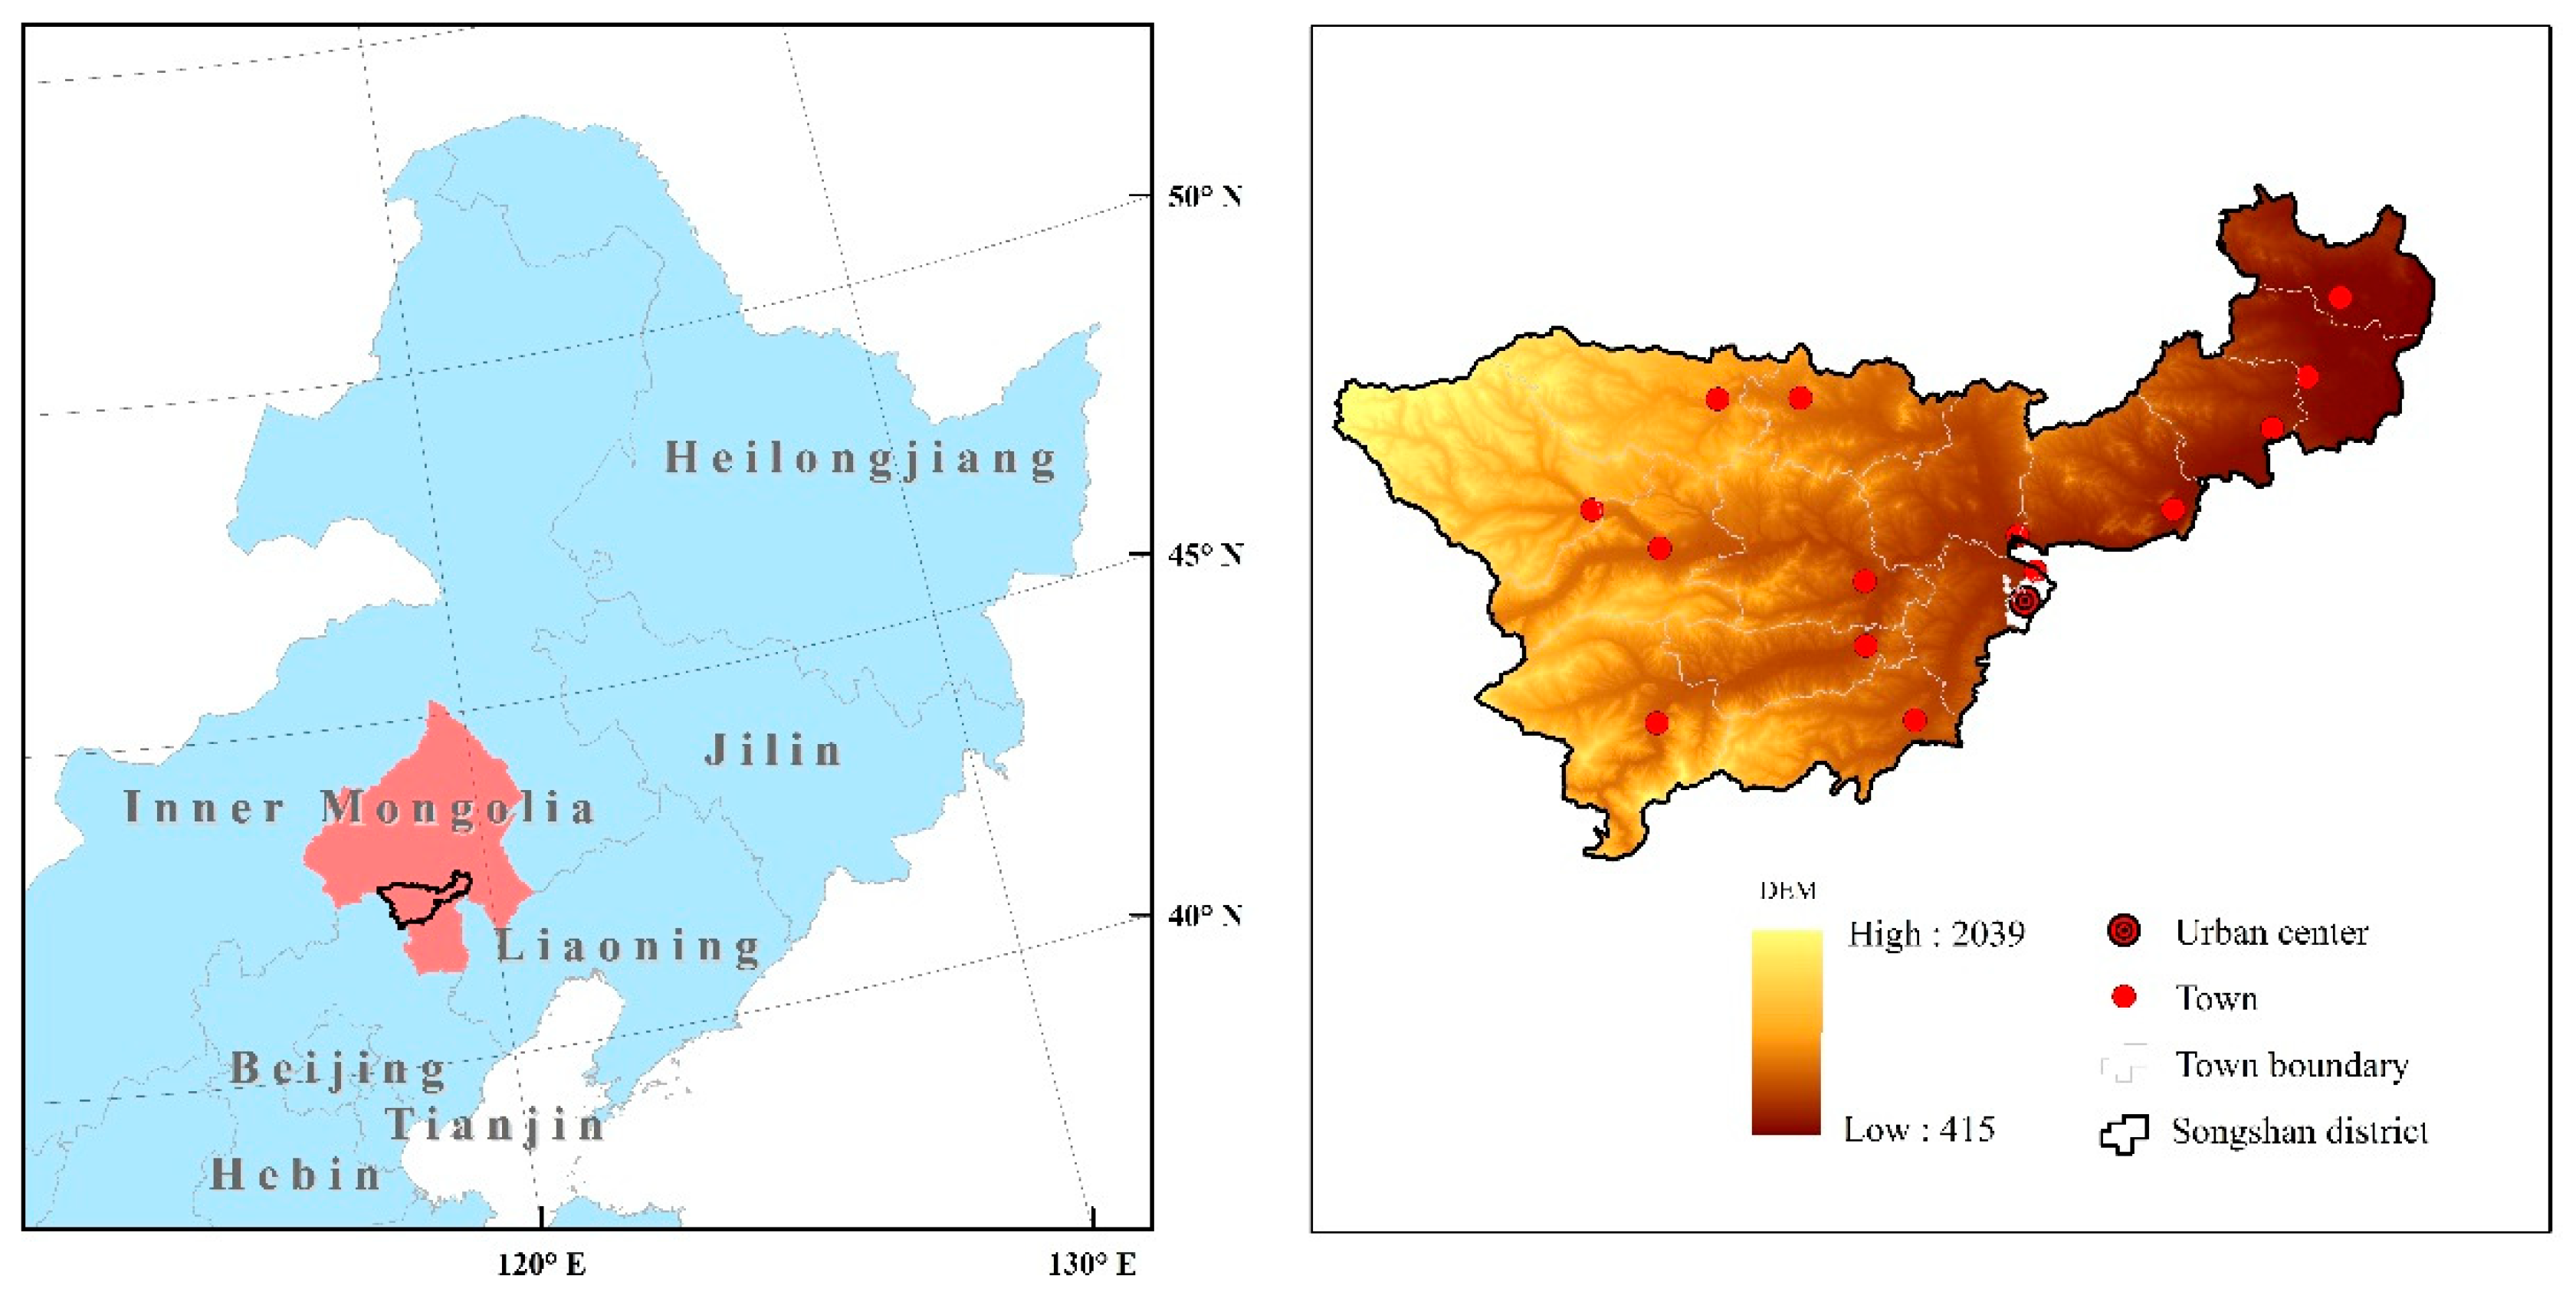
Figure 1. Location of the study area.
Sustainability 11 05722 g001
Figure 2. Spatial pattern of vacancy level in 2014.
Sustainability 11 05722 g002
Figure 3. Spatial pattern of vacancy level in 2017.
Sustainability 11 05722 g003
Figure 4. Spatial pattern of underutilization level in 2014.
Sustainability 11 05722 g004
Figure 5. Spatial pattern of underutilization level in 2017.
Sustainability 11 05722 g005
Figure 6. Hot and cold spots in vacancy level in 2014.
Sustainability 11 05722 g006
Figure 7. Hot and cold spots in vacancy level in 2017.
Sustainability 11 05722 g007
Figure 8. The correlation between land reclamation rate and rural housing vacancy rate (a) and underutilization rate (b) in 2017.
Sustainability 11 05722 g008
Table 1. Vacancy and underutilization rates at different altitudes in 2014 and 2017.
ElevationVacancy Rate (%)Underutilization Rate (%)
2014201720142017
>1000 m7.4111.4813.3311.11
700 < elevation ≤ 1000 m5.309.079.849.17
≤ 700 m3.455.886.816.81