Article

The Use of Sholl and Kolmogorov Complexity Analysis in Researching on the Sustainable Development of Creative Economies in the Development Region of Bucharest‒Ilfov, Romania

by
Karina Andreea Gruia
1,2,
Razvan-Cătălin Dobrea
3,
Cezar-Petre Simion
3,*,
Cristina Dima
3,
Alexandra Grecu
1,2,
Oana Simona Hudea
4,
Marian Marin
1,2,
Ion Andronache
1 and
Daniel Peptenatu
1,2
1
Research Center for Integrated Analysis and Territorial Management, University of Bucharest, 030018 Bucharest, Romania
2
Faculty of Geography, University of Bucharest, 010041 Bucharest, Romania
3
Faculty of Management, Bucharest University of Economic Studies, 010374 Bucharest, Romania
4
Faculty of Administration and Business, University of Bucharest, 030018 Bucharest, Romania
*
Author to whom correspondence should be addressed.
Sustainability 2019, 11(22), 6195; https://doi.org/10.3390/su11226195
Submission received: 1 October 2019 / Revised: 3 November 2019 / Accepted: 4 November 2019 / Published: 6 November 2019
(This article belongs to the Section Economic and Business Aspects of Sustainability)

Abstract

:
Nowadays, creative economies stand as a relevant indicator of the sustainable development of local and regional ones. The study aims to highlight the spatial behaviour of creative economies in the Bucharest‒Ilfov Development Region, the most dynamic and complex regional economy in Romania. In order to assess the spatial dynamics of creative economies in the region, an economic database was created, at the level of the territorial administrative unit, for the two economic indicators considered important for the study, number of employees and turnover, under the auspices of the Classification of National Economy Activities (NACE). The establishment of creative economies was made following the Government Decision no. 859 of 2014, with 66 codes for this sector. Annual cartographic models were developed for each indicator in QGIS (a free and open–source cross–platform desktop geographic information system application that supports viewing, editing, and analysis of geospatial data), for the period 2000–2016. For a relevant analysis of spatial behaviour, we used Sholl and Kolmogorov complexity, which highlighted specific patterns of spatial dynamics that help us to understand the role of creative economies in the sustainable development of regional economies. The results highlighted the role of accessibility corridors in the development of the regional economy.

1. Introduction

The creative economy generates jobs and wealth, and is also a remarkable tool for urban and regional revitalization. Its significance, role and importance are being studied more and more lately [1]. The basis of the creative economy is the capital of creative ideas and not necessarily physical capital [2], so it offers the potential for growth and the development of new, creative, intangible products, service experiences and markets. Howkins mentions that creativity becomes an economic activity only when an idea becomes a business [3].
Lately, more and more studies have analysed the growth of economic policies based on the development of cities’ creativity [4,5,6,7]. This interest accompanies a transition to a new economy [8] based on creativity, which includes creativity, the culture industry, the creative class and the urban environment as fundamental conditions [9]. Nowadays, these conditions are part of programs that underlie urban planning and are generally associated with urban entrepreneurship [10]. Creativity promotes urban economic growth, the competitiveness of cities and their vitality [11]. In this context, there is a need for regional and local policies that promote the creativity and culture of cities, with advantages for the urban economy if the regeneration of urban sites can be achieved. It should be noted, however, that these policies should include different axes, namely culture, art, industry and urban design, in order to create a comfortable city/urban environment that stimulates creativity [12].
Different spatial models of the creative economy have been analysed by geographical economists and regional researchers and their concentration has been noticed especially in metropolitan areas [13], giving the cities economic and social benefits [14,15,16]. The growth of the creative economy in today’s cities is largely a process of self-strengthening beyond the initial stage of cluster formation. This is because the high number of creative product companies offers different benefits that help them continuously grow. Benefits include both specialized funds and diversity of employability, as well as networks and knowledge exchanges, common providers and support services, institutional infrastructures and brand identity [17,18,19,20].
It has been found that the urban environment factors associated with the creative economy cover the demographic, social, economic and quality of life dimensions. The population represents the advantages of urbanization economies for professionals in the creative sector, in particular due to the high demand for creative activities and network effects, especially in large cities [21]. It is also considered that the density of the specialized employability in different activities of the creative sector is a positive factor explaining regional variations in creative economies. Another factor associated with the creative activities is related to the urban facilities or the quality of life associated with the place [13,17]. The causal relationship between facilities and the creative economy is complex. On the one hand, creative activities, favoured by many residents of the city, directly contribute to the facilities in the cities [15]. On the other hand, employees in the creative sector, in general, will have a greater demand for facilities, as they tend to remain in urban centres that have more facilities and a greater openness to diversity and new opportunities. Big cities are considered to have a higher concentration of creative economies [22]. In order to attract and maintain the creative class, in the cities, “the conversion of historic neighborhoods with mixed destination” took place, to promote “vibrant art scenes and outdoor activities”, “highlighting their cultural diversity” [23].
The complexity of the processes in emerging territorial systems structured around big cities, developed above, encouraged the scientific world to develop new methodologies that would help with understanding the patterns of their evolution. We opted for Sholl analysis and Kolmogorov complexity because they complement the familiar classical approaches. Sholl analysis provides information on the degree of branching, allowing the quantification of the dynamics on the development colour of some spatialized economic phenomena. The aim of our study was to identify these aspects in their dynamics. The benefit of Kolmogorov complexity lies in obtaining information about the complexity of the spatial distribution of creative economies, classified into five grey levels, at the level of the territorial administrative unit.
The proposed algorithms can contribute to a greater knowledge of the spatial behaviour of the regional economy, with the results obtained being consistent supports to aid decision-making.

2. Materials and Methods

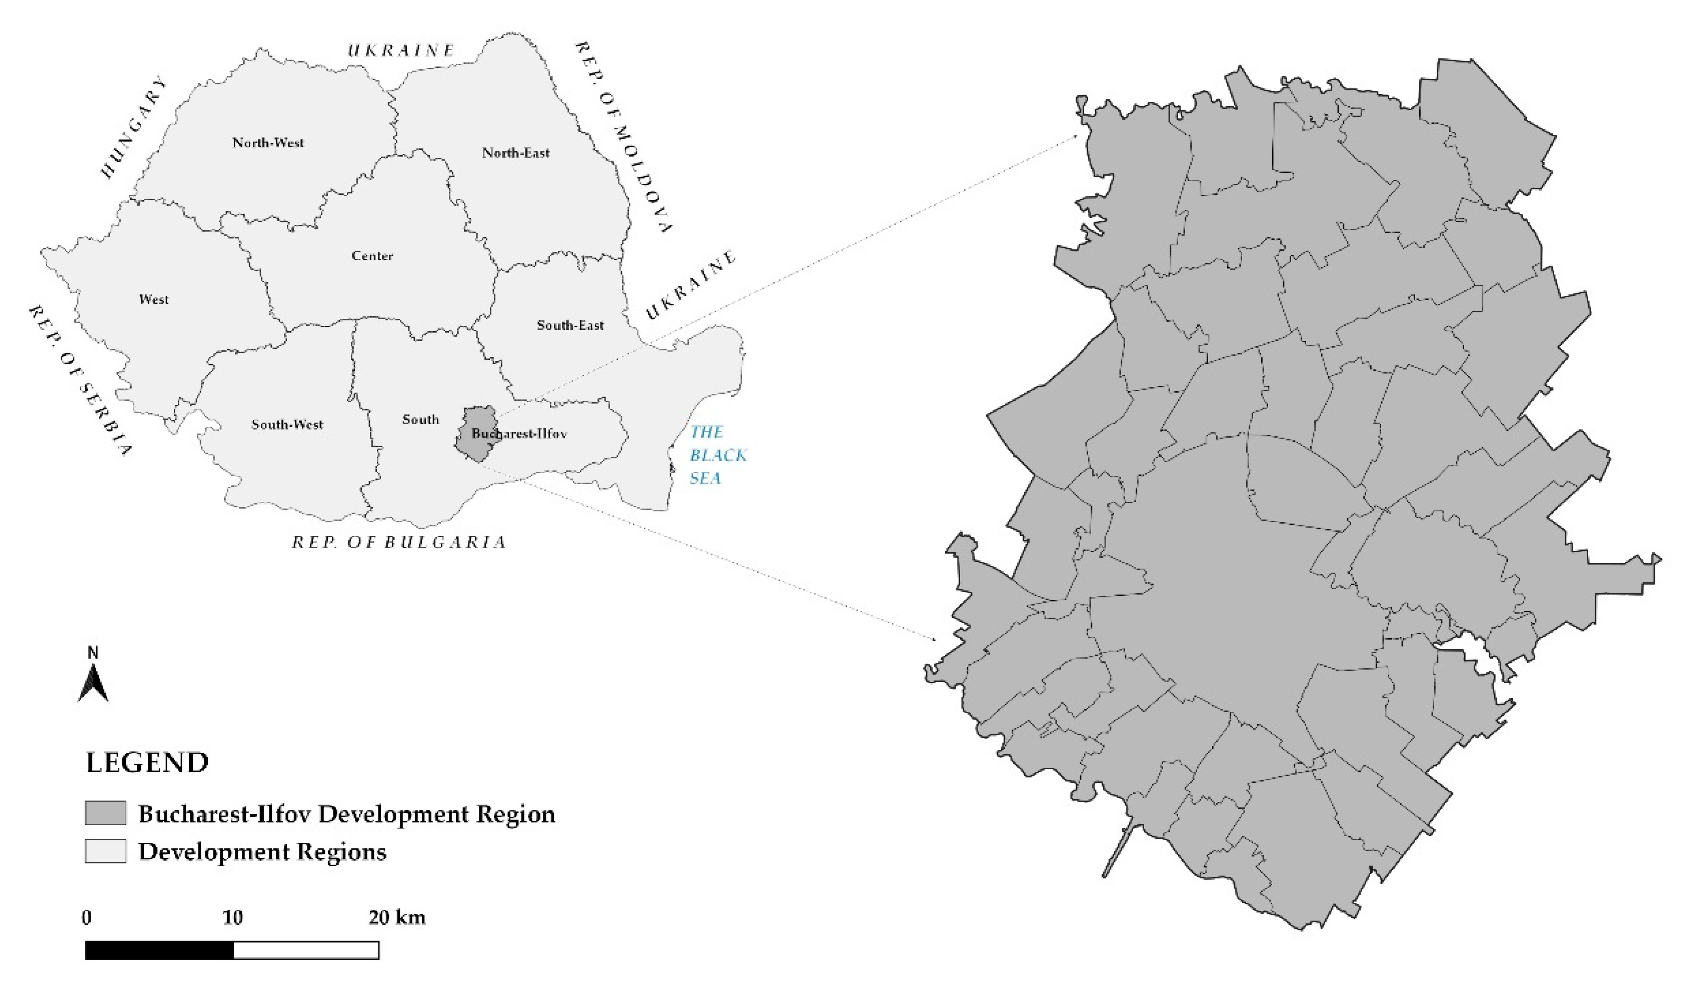
2.1. The Scope of the Research

The study aimed to analyse the distribution of the creative economy in the Bucharest‒Ilfov Development Region, on the basis of two economic indicators—turnover and number of employees. The Bucharest‒Ilfov Development Region is one of the eight development regions of Romania, made up of Bucharest and Ilfov county, nine cities, 32 communes and 91 villages in total, and is the most developed development region in Romania (Figure 1).
The region was chosen for this study because it is in first place in terms of the development of creative economies, making it a particularly attractive economic environment; in addition, the services sector is well developed and there is a high degree of accessibility. In 2016, the region accounted for 55% of the turnover in the creative sector in Romania, and 127,406 employees out of the 268,429 employees trained in this sector.

2.2. Data Analysis

The time span for the study of the dynamics and distribution of creative economies at the Bucharest‒Ilfov Development Region was 2000 to 2016. An economic database has been created at the level of the administrative‒territorial unit, highlighting two economic indicators relevant to the analysis of creative economies (number of employees and turnover), according to the Classification of National Economy Activities (NACE). The NACE codes belonging to the creative economies (Table 1) were chosen accordingly to the Government Decision no. 859 of 2014, regarding the approval of the “Government Strategy for the development of the sector of small and medium-sized enterprises and the improvement of the business environment in Romania Horizon 2020”. The values for turnover, for a better analysis, are expressed in the national currency (Ron); according to the National Bank of Romania, 1 euro equals 4.75 Ron.

2.3. GIS Analysis and Graphical Models

Using QGIS 3.4 (Grüt, Switzerland), open-source software, maps were created for each year, for the period 2000–2016, for both the number of employees and the turnover, in a sequential colour scheme, at the level of territorial administrative unit.
The graphical models show the evolution of the two indicators, with the highlights being the years 2000 (the beginning of the analysis time span), 2008 (when the maximum was reached in Romania for the two indicators), 2009 (the first year in which the economic crisis was registered) and 2016 (the last reference year). Combo-type charts analyse the evolution of the share of the creative sector in the Bucharest‒Ilfov Region in terms of the total economy of the Bucharest‒Ilfov Development Region (A) and the evolution of the share of the creative sector in the Bucharest‒Ilfov Region in the total creative economy of Romania (B), as well as the matrix trend with reference to 2016, for the two indicators—presenting the first 20 creative codes with the most significant value of the share of the creative economy in the region, in terms of the total creative economy at the country level.

2.4. Pre-Processing Images

In order to perform the Sholl and fractal analysis (Kolmogorov complexity), the colour gradient maps were turned into grey tones in five classes: for turnover—I (the white class has the highest values, over 60,000,000 Ron), II (a very light grey class with values between 10,000,000 and 60,000,000 Ron), III (the light grey class with values between 1,000,000 and 10,000,000 Ron), IV (the dark grey class, with values of 100,000–1,000,000 Ron) and V (the darkest colour, almost black, with values below 100,000 Ron) and for the number of employees—I (the white class has the highest value, with over 500 employees), II (the very light grey class with 250–500 employees), III (the light grey class with 100–250 employees), IV (the dark grey class with 50–100 employees) and V (the darkest colour, close to black, with under 50 employees). The built analysis was based on binary images, with the specific results due to segmenting the five classes of the image into grey tones and analysing the 8-bit greyscale images. The analysed images had a resolution of 2162 × 2552 pixels.

2.5. Sholl Analysis

Sholl is a quantitative analysis method that is usually the basis of neuronal studies to describe the morphological characteristics of an imaged neuron [24]. Mainly, Sholl analysis is used to measure the number of intersections per concentric shell at different distances from the centre. Sholl analysis is a binary analysis; the analysis is performed in ImageJ (Bethesda, MD, USA) through the Sholl analysis plugin [25,26,27]. In addition to the number of intersections per concentric shell, Sholl also calculated the average diameter of the dendrites or axons within each concentric shell. Mainly, Sholl analysis is used to measure the number of intersections per concentric shell at different distances from the centre. In our article, we propose using Sholl analysis to highlight the spatiotemporal dynamics of turnover and the number of employees in creative economies. The Sholl analysis plug-in is an improved algorithm for retrieving data from bitmap images with regression analysis, curve fitting and statistical inference, so an automatic estimation of the values of the arborization (branches) based on the Sholl analysis is possible. The plugin can perform Sholl analysis directly on 2D images of the objects to be analysed separately, isolated from the others. We should mention that this plugin can also perform 3D analysis using greyscale images; instead of circles, it uses spheres, and instead of pixels it uses voxels.
The study proposes using Sholl analysis to highlight the spatiotemporal dynamics of turnover (Figure 2) and the number of employees (Figure 3) for the creative economies of the Bucharest‒Ilfov region. The analysed binary images comprise the two classes with the highest values (white and very light grey for turnover: class I with values over 60,000,000 Ron and class II with values of 10,000,000–60,000,000 Ron, and again for employees: I with over 500 employees and class II with 250–500 employees. The sum of intersections (sampled), mean of intersections (sampled) and ramification index (fit) were analysed.
a. Sum of intersections represents the sum of all intersections.
b. Mean of intersections is given by Equation (1):
M e a n   o f   i n t e r s e c t i o n s = S u m   o f   i n t e r s e c t i o n s I n t e r s e c t i n g   r a d i i ,
where “intersecting radii” is the number of sampling radii that intersect the (arboreal) object at least once.
c. Ramification index allows the quantification of the degree of branching and is given by Equation (2) [28]:
R a m i f i c a t i o n   I n d e x = M a x   i n t e r s e c t i o n s N u m b e r   o f   p r i m a r y   b r a n c h e s .
The ramification index is calculated only when the primary branches are valid and not equal to zero.
The points of intersection were obtained when the “directions of development” intersect the concentric circles created with the help of Sholl analysis. The number of intersection points increases when new propagation directions appear or when the analysed phenomenon is spatially extended. The number decreases when it is compacted, disappearing from the propagation directions or when the analysed phenomenon goes into decline, shrinking.
In this study we start from pixel 0 (the centre of Bucharest) to pixel 1790 (the maximum outside); the intersecting radii numbered 179, and the radius step was 10 pixels. The mean intersections were obtained by dividing the number of intersections by 179 circles.

2.6. Fractal Analysis‒Kolmogorov Complexity

Fractal analysis has been used since the 1980s as a tool to understand the complexity of the system, and has been applied in spatial analysis to study the phenomenon of urban agglomeration [29], forest dynamics [30] or economic phenomena [31]. It can be compared to classical approaches to binary fractal analysis such as Ruler Dimension [32,33] BoxCounting [29,34,35,36], Dilation Dimension [29,37], Mass Dimension [38], Local Connected Fractal Dimension [39], Perimeter-Area Dimension [40,41], Information Dimension [42], Minkowski Dimension [43], Multifractal Dimension [44,45] or recently Fractal Fragmentation Index [46,47,48]. Kolmogorov complexity is the indicator by which the degree of complexity of the turnover and the number of employees for the Bucharest‒Ilfov Development Region was established. Starting from Shannon entropy [49], Kolmogorov proposes a new theory of complexity. According to this theory, the Kolmogorov complexity of an object represents the length of the shortest computer program that produces that object as output (being a measure of the computing resources needed to reproduce the analysed object). The KC full image analyses the degree of complexity for all five classes of values.
Kolmogorov complexity analysis was performed using open-source IQM 3.5 software (Graz, Austria) [50], and the complexity of the message is given by the size of the program needed to allow the receipt of such a message (Equation (3)).
If x (t) is the trajectory of a dynamic system in a sampled space of n-dimensional phase at discrete time intervals Δt (for t > 0), the generalized Kolmogorov entropy, Kq, can be defined in this space and divided into the n-dimensional hypercubes of the side r (at time intervals Δt) through the following equation [51]:
K q X = lim r 0 lim Δ t 0 lim N 1 N Δ t 1 q 1 ln i 1 , i 2 , , i N m ( r ) p i 1 , i 2 , , i N q ,
where {X = xi} is the discrete random variable and xi = x (t = iΔt); p i 1 , i 2 , , i N is the common probability that the trajectory x (t = Δt) to be found in the box i 1 , x (t = 2Δt) to be found in the box i 2 si x (t = NΔt) to be found in the box i N .
Complexity 0 means Kolmogorov complexity ≅ 0. As the image complexity increases, the Kolmogorov complexity grows.
This method has been implemented in various algorithms by using the routine length required for storing or reproducing images. Some algorithms were the basis of the JPEG or ZIP format for image compression [52]. In this study, the PNG format was used, with 10 iterations that required system bias corrections.

3. Results

3.1. The Spatial Dynamics of Creative Economies

3.1.1. The Economic Dynamics of Turnover

The analysis of the turnover of the creative sector at the level of the Bucharest‒Ilfov Development Region presents a positive trend, with an upward evolution during the 17 years analysed. In 2000, the first year of the analysis, we observe a concentration of the highest values of the turnover in the municipality of Bucharest (with a maximum value of 2,112,885,299 Ron), followed by neighbouring localities such as Măgurele (11,113,383 Ron), Buftea (4,763,041 lei), Volunteers (3,438,509 Ron) and Pantelimon (2,899,094 Ron) (Figure 4). Until 2008, a progressive trajectory and values of 13,649,703,013 Ron for the main growth pole, the municipality of Bucharest, followed by Voluntari, Măgurele, Buftea, Mogoșoaia and Corbeanca, are highlighted.
Significant increases are observed at the end of the analysis (2015 and 2016), with maximum values for the analysed period reached by Bucharest in 2016, with a turnover value of 27,598,264,903 Ron, being followed by the surrounding areas: Volunteers (1,149,679,236 Ron), Măgurele (300,4411,850 Ron), Mogoșoaia (166,098,459 Ron) and Otopeni (141,161,282 Ron) (Figure 5). The codes with the most significant values are those for advertising, architecture and the IT field, respectively: 7311 (advertising agencies, with a value of 449,419,320 Ron in 2000, reaching 2016 with 5,041,850,886 Ron), 7112 (engineering activities and related technical consultancy, with values of Ron 244,020,034 in 2000 and Ron 4,458,934,256 in 2016), and 6202 (computer consultancy activities totalling Ron 138,029,029 in 2000 and Ron 3,244,752,653 in 2016).
In Figure 6 are presented the evolution of the share of the turnover in the creative sector versus the total turnover in the region (A) and the share of the turnover in the creative sector in the same region versus the total turnover in Romania (B); the first indicator shows a constant evolution, with small fluctuations, falling between values of 4.49%, which represents the smallest share of the turnover in the creative sector registered in 2002, and 8.99%, the highest, in 2011.
The trend matrix for the NACE codes in the creative sector of the turnover shows an evolution of 20 creative activities (Table 2), where the top three positions are occupied by basic activities of the creative economies, advertising and architecture, and activities related to a field with a spectacular trajectory, IT (codes 7311—advertising agencies, with a value of 449,419,320 Ron in 2000 and reaching in 2016 a value of 5,041,850,886 Ron; code 7112—engineering activities and related technical consultancies, with a value of 244,020,034 Ron in 2000 and increasing to 4,458,934,256 Ron in 2016; IT is represented by the code 6202 (computer consultancy activities) and had values of RON 138,029,029 in 2000 and RON 3,244,752,653 in 2016).
Two time spans are highlighted: the pre-crisis period (2000–2008), when we observe increases in the various creative activities (for example, code 6202 moved from the sixth position to the first position) but also decreases (for example, code 7311 dropped from first place to 24th in 2008), due to the growth dynamics of the activities of this sector both in Romania and at the European level. In the post-crisis period (2009–2016), creative activities present different development trajectories, so we have codes such as 7311 and 7112 in the first two positions, showing a clear evolution, but other codes that show stagnation (e.g., 7320 and 5811) or decreases (e.g., 5814 and 7111). The year 2016 epitomizes the dynamics of the 20 codes in the creative sector, representing the pole of productivity growth and economic innovation.

3.1.2. The Economic Dynamics of the Number of Employees

The analysis of the spatial distribution of the number of employees from the creative economies of the Bucharest‒Ilfov region (Figure 7) shows the dominant position of the Bucharest municipality, which totalled, in 2000, 39,618 employees in the creative sector, followed by cities in which this sector is growing: Măgurele (1,751 employees), Volunteers (becoming a private sector hub) with 286 employees, Buftea (known for its film industry) with 219 employees, and Pantelimon (210 employees). The values show a positive evolution until 2008, when the municipality of Bucharest had a total of 125,814 employees, followed by the cities Volunteers (2,133 employees), Măgurele (1,951 employees), Buftea (1,239 employees) and Otopeni (591 employees). After the economic crisis, the number of employees in the creative sector did not undergo a significant change because this sector is dynamic and some fields, such as IT, did not have to resort to redundancies in the post-economic crisis period; however, there were decreases in the number of employees (especially in Bucharest, as it is the main area where most of the employees in this sector work).
The period 2015–2016 is characterized by a positive trend, with the number of employees in creative sector activities increasing—Bucharest reached 112,326 employees in 2015 and 115,945 in 2016, followed by Volunteers (4,464 employees in 2015 and 4,156 in 2016), Măgurele (1,986 employees in 2015 and 2,058 in 2016) and Otopeni (561 employees in 2015 and 943 in 2016); Buftea suffered a decrease in the number of employees, from 546 in 2015 to 321 in 2016.
The number of employees in the region showed an upward trend over the period analysed, starting from 42,366 employees in 2000 and reaching 127,406 in the final year of analysis (Figure 8). The NACE codes in which most of the employees were registered during this period were: 7112 (engineering activities and related technical consultancies), with 24,606 employees in 2008 and 20,546 employees in 2009; 7311 (advertising agencies), with 11,576 employees in 2008 and 11,518 in 2009; and 7219 (other research and experimental development in the natural sciences and engineering) with 9,494 employees in 2008 and 8,688 in 2009.
The share of employees in the creative sector in the region rose throughout the analysed period, so the global economic crisis did not significantly affect this economic indicator (except in 2010, when a decrease occurred, down to a value of 8.83%) (Figure 9). The maximum value of 9.89% was registered in 2016. As for the share of employees in the creative sector of this region versus the total number of creative employees in Romania (B), things were different: the evolution presented fluctuations, with significant decreases in 2007–2008 due to the increase in value of other economic activities, which also produced decreases in the number of employees in the creative sector.
The analysis of the trend matrix for the number of employees of the creative sector at the region level offers an image on the growth potential and development of activities specific to this economic sector. The first three codes present activities in the subdomain of architecture (7112—engineering activities and related technical consultancies), with 16,869 employees in 2016; advertising (7311—advertising agencies), with 12,600 employees in 2016; and health (8622—specialist medical practice activities), with 12,577 employees in 2016; followed by IT (present in this classification under four codes: 6202—computer consultancy activities, 6311—data processing, hosting and related activities, 6209—Other information technology and computer service activities, and 6399—other information service activities n.e.c.) and a total number, for the four codes, of 19,341 employees, representing 15% of the total employees in the creative sector in the region (Table 3).
With the help of the matrix, two periods were highlighted: one between 2000 and 2008 (pre-crisis), where you can see increases (for example 8622, 8621 and 9329), decreases (for 7490) and stagnation in the positions that the creative activities occupies, it being a period in which the creative sector is characterized by an economic dynamism, affirming the development based on the increase of productivity and the degree of economic innovation; and 2008 to 2016 (post-crisis), which presents a unique situation based on the competence of the specialists in the creative field, the contribution to increasing the absorption of European sources, the subdomains that are based on the internationalization of their work and developing products and services for clients abroad (IT), as well as numerous successful start-ups.

3.2. The Sholl and Kolmogorov Complexity Analysis of Creative Economies

Sholl analysis for turnover in the creative sector (Figure 10) reveals a positive trend in the evolution of creative economies. One sees a growth stage in which the propagation directions extend spatially, between 2000 and 2008, due to the increasingly significant development of the creative economies and the public policies that come to their aid. The economic crisis that took hold in 2009 is associated with the compacting of the phenomenon, causing a circular development towards the centre. After 2012, a downward trend represented by the circular economic development around the city is observed.
Figure 11 captures the periods of maximum extension in the development of the creative economies. It highlights the period of 2000–2008 as having a positive evolution and a maximum in 2008, followed by a decrease due to the economic crisis, felt especially keenly in 2009. The second growth period is located in 2010, with a maximum of 10.07, an increase that can be explained by the developing creative economies around accessibility lanes, as well as by the development possibilities offered by the northern area of Bucharest.
Figure 12 offers a complex picture of the distribution of job offers and the number of employees involved in creative activities in the region. The total number of intersections and their average follow the same positive trend determined by the appearance of the propagation directions—from 2005, a development towards the north; and from 2008, an increase towards the southeast, towards Popești-Leordeni.
The number of employees showed a negative evolution in 2012, in which the development phenomenon was declining and creative activities were restricted in the area near the city (Figure 13).
In the chart showing the evolution of Kolmogorov complexity for turnover (Figure 14), the development of the creative economies is emphasized, showing the complexity of the process. Thus, for 2000 to 2008, there is a positive trend in terms of the growth of creative economies, which leads to an area with uneven distributions around the main communication axes and to the high value of Kolmogorov complexity. In 2010 there was a maximum of complexity due to the increasingly evident growth in the northern part of Bucharest, which offers more and more development opportunities, especially along the DN1 and the Bucharest‒Ploiești Highway, and due to the existence and growth of a large number of projects in that area. The period 2012–2016 presents a compaction of the turnover and a downward evolution of the Kolmogorov complexity, with a minimum in 2014, as a result of the uniform polarization around Bucharest of the creative activities.
As to the evolution of Kolmogorov complexity in the number of employees in the creative sector (Figure 15), there is an upward trend, with an increase in complexity each year analysed based on an uneven development in the areas where employees are concentrated in the creative sector. This complexity is accentuated due to the spreading along accessibility corridors, especially in the north (Voluntari), southeast with the Popești‒Leordeni area and towards the east, which has the A2 motorway.

4. Discussion and Conclusions

In this paper, we introduced Sholl analysis and Kolmogorov complexity to calculate the dynamics of the spatial distribution of turnover and the number of employees in creative economies in the Bucharest‒Ilfov Development Region.
Sholl analysis is a key measure of dendritic complexity and has applications from assessing pathology-induced structure changes to estimating the expected number of synaptic anatomical contacts. Based on these considerations, we applied the Sholl analysis to the GIS-generated image set and found that Sholl intersection profiles can be reproduced using similar logic.
In previous studies of brain cell morphology [53,54], Sholl was used as a tool of discrimination of morphological features; in this paper we have followed the dynamics of the same phenomenon in 17 successive years. As far as we know, this is the first time that an analysis of the Kolmogorov complexity has been made for the dynamics of spatialization of some economic phenomena; fractal implementation was recently done by Helmut Ahammer from the Medical University of Graz, Austria through the IQM operator Logical Depth.
There are also a number of limitations to the analysis. The Sholl analysis, to be comparable, must be performed at the same resolution, and binarization must be done based on the same algorithm, and the centre from which the concentric circles will be drawn will be central to the mass of the object to be analysed. KC analysis also implies a limitation, as its result is dependent on the image size. Therefore, in order to be valid and comparable, the images analysed must have the same resolution.
The results obtained highlight the increase in knowledge brought about by Sholl and fractal analysis in terms of understanding the complex of factors that determine the sustainable development of the regional economy, as well as the role of the creative economies in the balanced development of the local economies. Instead of classical GIS, spatial analysis or fractal analyses, we opted for Sholl analysis due to the ability of this indicator to quantify the dynamics of the spatial distribution of turnover and the number of employees, depending on the increases and decreases of these parameters at the level of the territorial administrative unit. To identify the complexity of this dynamic at the level of the territorial administrative unit, we applied Kolmogorov complexity, which for this type of analysis is more versatile than Higuchi 1D, Higuchi 2D, or Pyramid Dimension. Detailed research into the creative economies has shown the important role of these economic activities in the evolution of each local economy, with the creative economies supporting the economic crisis very well and fostering an adaptive capacity to cope with structural crises. The applied methodology can help to model the adaptive capacity of the territorial systems, the limitations being highlighted in numerous specialized works [55,56,57].
Sholl analysis allowed the morphological characteristics of the spatial model of the distribution of creative economies to be identified, identifying the development directions and, indirectly, the determined factors. With the aid of the results obtained, the study contributes to the development of the established methodologies for qualitative and quantitative analysis of the spatial distribution of geographical processes and phenomena [38,40,49,51]. This algorithm is relevant for analysing the ways in which certain types of infrastructures determine groups of creative economies.
Using Kolmogorov complexity for the analysis of the distribution of creative economies at a regional level has demonstrated the usefulness of this method for exceeding the current methodological limits in knowing the dynamics of the territorial reality, limits recorded in numerous specialized studies [58,59,60].
The obtained results showed the relevance of Sholl and fractal analysis in the advanced modelling of the structural dynamics of the local economies, with the fractal algorithms, together with the statistical and GIS models, offering a significant increase in knowledge.

Author Contributions

Conceptualization, K.A.G., D.P. and C.-P.S.; methodology, K.A.G., A.G., R.-C.D. and C.D.; software, I.A. and O.S.H.; validation, K.A.G., A.G., and D.P.; formal analysis, I.C. and D.P.; investigation, M.M.; resources, M.M. and C.D.; data curation, C.-P.S.; writing—original draft preparation, K.A.G., D.P. and R.-C.D.; writing—review and editing, K.A.G., C.-P.S., C.D. and D.P.; visualization, K.A.G., M.M., O.S.H. and A.G.; supervision, D.P., C.-P.S. and R.-C.D.; project administration, A.G.; These authors contributed equally to this work.

Funding

This research was funded by the Romanian Ministry of Innovation and Research, grant PFE24/16.10.2018, “Increasing research capacity in the economic field through the development of transdisciplinary research infrastructures (CERTRAN)”.

Conflicts of Interest

The authors declare no conflict of interest.

References

  1. Jakob, D.; van Heur, B. Editorial: Taking Matters into Third Hands: Intermediaries and the Organization of the Creative Economy. Reg. Stud. 2014, 49, 357–361. [Google Scholar] [CrossRef]
  2. Chung, N.; Leeb, H.; Jae Lee, S.; Kooa, C. The influence of tourism website on tourists’ behavior to determine destination selection: A case study of creative economy in Korea. Technol. Forecast. Soc. 2015, 96, 130–143. [Google Scholar] [CrossRef]
  3. Howkins, J. Creative Economy: How People Make Money from Ideas, 3rd ed.; Penguin Books: London, UK, 2013; p. 17. [Google Scholar]
  4. Peck, J. Struggling with the creative class. Int. J. Urban Reg. Res. 2005, 29, 740–770. [Google Scholar] [CrossRef]
  5. Zimmerman, J. From brew town to cool town: Neoliberalism and the creative city development strategy in Milwaukee. Cities 2008, 25, 230–242. [Google Scholar] [CrossRef]
  6. Murphy, E.; Redmond, D. The role of ‘hard’ and ‘soft’ factors for accommodating creative knowledge: Insights from Dublin’s ‘creative class’. Ir. Geogr. 2009, 42, 69–84. [Google Scholar] [CrossRef]
  7. Ponzini, D.; Rossi, U. Becoming a creative city: The entrepreneurial mayor, network politics and the promise of an urban renaissance. Urban Stud. 2010, 47, 1037–1057. [Google Scholar] [CrossRef]
  8. Scott, A.J. Creative cities: Conceptual issues and policy questions. J. Urban Aff. 2006, 28, 1–17. [Google Scholar] [CrossRef]
  9. Lawton, P.; Murphy, E.; Redmond, D. Examining the role of ‘creative class’ ideas in urban and economic policy formation: The case of Dublin, Ireland. Int. J. Knowl.-Based Dev. 2010, 1, 267–286. [Google Scholar] [CrossRef]
  10. Hall, T.; Hubbard, P. The entrepreneurial city: New urban politics, new urban geographies? Prog. Hum. Geogr. 1996, 20, 153–171. [Google Scholar] [CrossRef]
  11. Kipfer, S.; Keil, R. Toronto Inc? Planning the Competitive City in the New Toronto. Antipode 2002, 34, 227–264. [Google Scholar] [CrossRef]
  12. Nohara, T.; Okamura, Y.; Kawahara, S. Research for a comprehensive and active planning method in an industrial-residential mixed area- focused on ota creative town vision in ota ward, Tokyo. Plan. Malays. J. 2016, 4, 369–382. [Google Scholar]
  13. Grodach, C.; Currid-Halkett, E.; Foster, N.; Murdoch, J. The location patterns of artistic clusters: A metro- and neighborhood-level analysis. Urban Stud. 2014, 51, 2822–2843. [Google Scholar] [CrossRef]
  14. Currid, E. The Warhol Economy: How Fashion, Art and Music Drive New York City; Princeton University Press: Princeton, NJ, USA, 2009. [Google Scholar]
  15. Currid, E. Bohemia as subculture “Bohemia” as industry: Art, culture and economic development. J. Plan Lit. 2009, 23, 368–382. [Google Scholar] [CrossRef]
  16. Markusen, A.; Gadwa, A. Arts and culture in urban or regional planning: A review and research agenda. J. Plan. Educ. Res. 2010, 29, 379–391. [Google Scholar] [CrossRef]
  17. Qian, H.; Liu, S. Cultural entrepreneurship in U.S. cities. J. Urban Aff. 2018, 40, 1043–1065. [Google Scholar] [CrossRef]
  18. Grodach, C.; O’Connor, J.; Gibson, C. Manufacturing and cultural production: Towards a progressive policy agenda for the cultural economy. City Cult. Soc. 2017, 10, 17–25. [Google Scholar] [CrossRef] [Green Version]
  19. Patterson, M.; Silver, D. The place of art: Local area characteristics and arts growth in Canada, 2001–2011. Poetics 2015, 51, 69–87. [Google Scholar] [CrossRef]
  20. Scott, A.J. The cultural economy of cities. Int. J. Urban Reg. Res. 1997, 2, 323–339. [Google Scholar] [CrossRef]
  21. Markusen, A.; Schrock, G. The artistic dividend: Urban specialization and economic development implications. Urban Stud. 2006, 43, 1661–1686. [Google Scholar] [CrossRef]
  22. Kolenda, R.; Liu, C.Y. Are central cities more creative? The intrametropolitan geography of creative industries. J. Urban Aff. 2012, 34, 487–511. [Google Scholar] [CrossRef]
  23. Grodach, C.; Seman, M. The cultural economy in recession: Examining the U.S. experience. Cities 2013, 33, 15–28. [Google Scholar] [CrossRef]
  24. Sholl, D.A. Dendritic organization in the neurons of the visual and motor cortices of the cat. J. Anat. 1953, 87, 387–406. [Google Scholar] [PubMed]
  25. Ferreira, T.; Blackman, A.; Oyrer, J.; Jayabal, A.; Chung, A.; Watt, A.; Sjöström, J.; van Meyel, D. Neuronal morphometry directly from bitmap images. Nat. Methods 2014, 11, 982–984. [Google Scholar] [CrossRef] [Green Version]
  26. Schneider, C.A.; Rasband, W.S.; Eliceiri, K.W. NIH Image to ImageJ: 25 years of image analysis. Nat. Methods 2012, 9, 671–675. [Google Scholar] [CrossRef]
  27. Sholl Analysis. Available online: https://imagej.net/Sholl_Analysis (accessed on 17 July 2019).
  28. Schoenen, J. The dendritic organization of the human spinal cord: The dorsal horn. Neuroscience 1982, 7, 2057–2087. [Google Scholar] [CrossRef]
  29. Frankhauser, P. Fractal Geometry for Measuring and Modelling Urban Patterns. In The Dynamics of Complex Urban Systems; Albeverio, S., Andrey, D., Giordano, P., Vancheri, A., Eds.; Physica-Verlag Heidelberg: Heidelberg, Germany, 2008. [Google Scholar]
  30. Andronache, I.; Marin, M.; Fischer, R.; Ahammer, H.; Radulovic, M.; Ciobotaru, A.M.; Jelinek, H.F.; Di Ieva, A.; Pintilii, R.D.; Drăghici, C.C.; et al. Dynamics of Forest Fragmentation and Connectivity Using Particle and Fractal Analysis. Sci. Rep. 2019, 9. [Google Scholar] [CrossRef]
  31. Toma, S.G.; Peptenatu, D.; Andronache, I.; Ahammer, H.; Pintilii, R.D.; Drăghici, C.C.; Simion, A.G. The Creative Economy in Romania, a Key Factor of Economic Integration in the European Union. In Doing Business in Europe. Contributions to Management Science; Dima, A., Ed.; Springer: Cham, Switzerland, 2018; pp. 329–350. [Google Scholar]
  32. Benoit, M. How Long Is the Coast of Britain? Statistical Self-Similarity and Fractional Dimension. Science 1967, 156, 636–638. [Google Scholar] [Green Version]
  33. Zaletel, I.; Ristanović, D.; Stefanović, B.D.; Puškaš, N. Modified Richardson’s method versus the box-counting method in neuroscience. J. Neurosci. Methods 2015, 242, 93–96. [Google Scholar] [CrossRef]
  34. Neil, G.; Curtis, K.M. Shape recognition using fractal geometry. Pattern Recognit. 1997, 30, 1957–1969. [Google Scholar] [CrossRef]
  35. Pintilii, R.D.; Andronache, C.I.; Simion, A.G.; Drăghici, C.C.; Peptenatu, D.; Ciobotaru, A.M.; Dobrea, R.C.; Papuc, R.M. Determining forest fund evolution by fractal analysis (Suceava–Romania). Urban Arhit. Constr. 2016, 7, 31–42. [Google Scholar]
  36. Diaconu, D.C.; Andronache, I.; Ahammer, H.; Ciobotaru, A.M.; Zelenakova, M.; Dinescu, R.; Pozdnyakov, A.V.; Chupikova, S.A. Fractal drainage model—A new approach to determinate the complexity of watershed. Acta Montan. Slovaca 2017, 22, 12–21. [Google Scholar]
  37. Andronache, I.; Fensholt, R.; Ahammer, H.; Ciobotaru, A.M.; Pintilii, R.D.; Peptenatu, D.; Drăghici, C.C.; Diaconu, D.C.; Radulović, M.; Pulighe, G.; et al. Assessment of Textural Differentiations in Forest Resources in Romania Using Fractal Analysis. Forests 2017, 8, 54. [Google Scholar] [CrossRef]
  38. Jelinek, H.F.; Cornforth, D.J.; Roberts, A.J.; Landini, G.; Bourke, P.; Iorio, A. Image Processing of Finite Size Rat Retinal Ganglion Cells Using Multifractal and Local Connected Fractal Analysis. In AI 2004: Advances in Artificial Intelligence; Webb, G.I., Yu, X., Eds.; Lecture Notes in Computer Science; Springer: Berlin, Germany, 2004. [Google Scholar]
  39. Landini, G.; Murray, P.I.; Misson, G.P. Local connected fractal dimensions and lacunarity analyses of 60 degrees fluorescein angiograms. Investig. Ophthalmol. Vis. Sci. 1995, 36, 2749–2755. [Google Scholar]
  40. Lung, C.W.; Mu, Z.Q. Fractal dimension measured with perimeter-area relation and toughness of materials. Phys. Rev. B Condens. Matter. 1995, 38. [Google Scholar] [CrossRef]
  41. Cheng, Q. The Perimeter-Area Fractal Model and Its Application to Geology. Math. Geosci. 1995, 27, 69–82. [Google Scholar] [CrossRef]
  42. Pitsianis, N.; Bleris, G.; Argyrakis, P.; Bianciardi, G.; Pontenani, F. Information dimension in fractal structures. Phys. Rev. B 1989, 39, 7097–7100. [Google Scholar] [CrossRef]
  43. Marana, A.N.; Da Fontoura Costa, L.; Lotufo, R.A.; Velastin, S.A. Estimating crowd density with Minkowski fractal dimension. In Proceedings of the IEEE International Conference on Acoustics, Speech, and Signal Processing, Phoenix, AZ, USA, 15–19 March 1999; pp. 3521–3524. [Google Scholar]
  44. Perrier, E.; Tarquis, A.; Dathe, A. A program for fractal and multifractal analysis of 2D binary images: Computer algorithms versus mathematical theory. Geoderma 2006, 134, 284–294. [Google Scholar] [CrossRef]
  45. Zhou, H.; Perfect, E.; Lu, Y.Z.; Li, B.G.; Peng, X.H. Multifractal analyses of grayscale and binary soil thin section images. Fractals 2011, 19, 299–309. [Google Scholar] [CrossRef]
  46. Andronache, I.; Ahammer, H.; Jelinek, H.F.; Peptenatu, D.; Ciobotaru, A.M.; Draghici, C.C.; Pintilii, R.D.; Simion, A.G.; Teodorescu, C. Fractal analysis for studying the evolution of forests. Chaos Solitons Fractals 2016, 91, 310–318. [Google Scholar] [CrossRef]
  47. Drăghici, C.C.; Andronache, I.; Ahammer, H.; Peptenatu, D.; Pintilii, R.D.; Ciobotaru, A.M.; Simion, A.G.; Dobrea, R.C.; Diaconu, D.C.; Vişan, M.C.; et al. Spatial evolution of Socio-economic geography forest areas in the northern Carpathian Mountains of Romania. Acta Montan. Slovaca 2017, 22, 95–106. [Google Scholar]
  48. Pintilii, R.D.; Andronache, I.; Diaconu, D.C.; Dobrea, R.C.; Zeleňáková, M.; Fensholt, R.; Peptenatu, D.; Drăghici, C.C.; Ciobotaru, A.M. Using fractal analysis in modelling the dynamics of forest areas and economic impact assessment, Maramures County Romania as a case study. Forests 2017, 8, 25. [Google Scholar] [CrossRef]
  49. Shannon, C.E. A mathematical theory of communication. Bell Labs Tech. J. 1948, 27, 379. [Google Scholar] [CrossRef]
  50. Kainz, P.; Mayrhofer-Reinhartshuber, M.; Ahammer, H. IQM: An Extensible and Portable Open Source Application for Image and Signal Analysis. PLoS ONE 2015, 10, e0116329. [Google Scholar] [CrossRef] [PubMed]
  51. Higashi, M.; Klir, G.J. Measures of uncertainty and information based on possibility distributions. Int. J. Gener. Syst. 1982, 9, 43–58. [Google Scholar] [CrossRef]
  52. Quispe Ayala, M.R.; Asalde Alvarez, K.; Gonzalez, A.R. Image Classification Using Data Compression Techniques. In Proceedings of the IEEE 26th Convention of Electrical and Electronics Engineersin Israel—IEEEI 2010, Eliat, Israel, 17–20 November 2010; pp. 349–353. [Google Scholar]
  53. Palombo, M.; Ligneul, C.; Najac, C.; Le Douce, J.; Flament, J.; Escartin, C.; Hantraye, P.; Brouillet, E.; Bonvento, G.; Valette, J. New paradigm to assess brain cell morphology by diffusion-weighted MR spectroscopy in vivo. Proc. Natl. Acad. Sci. USA 2016, 113, 6671–6676. [Google Scholar] [CrossRef] [PubMed] [Green Version]
  54. Heindl, S.; Gesierich, B.; Benakis, C.; Llovera, G.; Duering, M.; Liesz, A. Automated Morphological Analysis of Microglia After Stroke. Front. Cell. Neurosci. 2018, 12. [Google Scholar] [CrossRef]
  55. Pintilii, R.D.; Peptenatu, D.; Drăghici, C.; Saghin, I.; Stoian, D.R. Structural changes in the entrepreneurial profile of the creative industries in Romania. Prague Czech Republ. 2014, 23, 1147–1151. [Google Scholar]
  56. Stoian, D.; Peptenatu, D.; Pintilii, R.; Schvab, A. Territorial distribution of creative poles in Romania. Procedia Soc. Behav. Sci. 2013, 122, 184–188. [Google Scholar]
  57. Andronache, I.; Peptenatu, D.; Ciobotaru, A.M.; Gruia, A.K.; Gropoșilă, N.M. Using fractal analysis in modeling trends in the national economy. Procedia Environ. Sci. 2016, 32, 344–351. [Google Scholar] [CrossRef]
  58. Petrișor, A.I.; Andronache, I.; Petrișor, L.E.; Ciobotaru, A.M.; Peptenatu, D. Assessing the fragmentation of the green infrastructure in Romanian cities using fractal models and numerical taxonomy. Procedia Environ. Sci. 2016, 32, 110–123. [Google Scholar] [CrossRef]
  59. Braghină, C.; Merciu, C.; Peptenatu, D.; Dobrea, R.; Ianoș, I. Environment management in the mining areas functionally restructured. Case study—The Petrosani Depression, Romania. J. Environ. Prot. Ecol. 2012, 13, 2394–2403. [Google Scholar]
  60. Prăvălie, R.; Patriche, C.V.; Sîrodoev, I.; Bandoc, G.; Dumitrașcu, M.; Peptenatu, D. Water deficit and corn productivity during the post-socialist period. Case study: Southern Oltenia drylands, Romania. Arid Land Res. Manag. 2016, 30, 239–257. [Google Scholar] [CrossRef]
Figure 1. The geographical location of the Bucharest‒Ilfov Development Region within Romania.
Sustainability 11 06195 g001
Figure 2. Spatiotemporal dynamics of turnover, 2000–2016.
Sustainability 11 06195 g002
Figure 3. Spatiotemporal dynamics of the number of employees, 2000–2016.
Sustainability 11 06195 g003
Figure 4. Distribution of turnover in the creative sector in the Bucharest‒Ilfov Development Region.
Sustainability 11 06195 g004aSustainability 11 06195 g004b
Figure 5. The evolution of the turnover in the creative sector in the Bucharest‒Ilfov Development Region.
Sustainability 11 06195 g005
Figure 6. Evolution of the share turnover in the creative sector in terms of total economy (A) and total creative economy in Romania (B).
Sustainability 11 06195 g006
Figure 7. Distribution of the number of employees in the creative sector in the Bucharest‒Ilfov Development Region.
Sustainability 11 06195 g007aSustainability 11 06195 g007b
Figure 8. The evolution of employees in the creative sector in the Bucharest‒Ilfov Development Region.
Sustainability 11 06195 g008
Figure 9. Evolution of the share of employees in the creative sector in terms of the total economy (A) and the total creative economy in Romania (B).
Sustainability 11 06195 g009
Figure 10. Sholl analysis of the turnover of the creative sector in the Bucharest‒Ilfov Development Region.
Sustainability 11 06195 g010
Figure 11. Branching index for turnover in the creative sector in the Bucharest‒Ilfov Development Region.
Sustainability 11 06195 g011
Figure 12. Sholl analysis for the number of employees in the creative sector in the Bucharest‒Ilfov Development Region.
Sustainability 11 06195 g012
Figure 13. The branch indicator for the number of employees in the creative sector in the Bucharest‒Ilfov Development Region.
Sustainability 11 06195 g013
Figure 14. Kolmogorov complexity of the turnover of the creative sector in the Bucharest‒Ilfov Development Region.
Sustainability 11 06195 g014
Figure 15. Kolmogorov complexity of the number of employees in the creative sector in the Bucharest‒Ilfov Development Region.
Sustainability 11 06195 g015
Table 1. NACE codes for the creative activities established by H.G. 859/2014.
NACE CodesCreative ActivitiesField of Activity According to NACE
5811Book publishingInformation and Communication
5812Publishing of directories and mailing lists
5813Publishing of newspapers
5814Publishing of journals and periodicals
5819Other publishing activities
5821Publishing of computer games
5829Other software publishing
5911Motion picture, video and television programme production activities
5912Motion picture, video and television programme post-production activities
5913Motion picture, video and television programme distribution activities
5914Motion picture projection activities
5920Sound recording and music publishing activities
6202Computer consultancy activities
6203Computer facilities management activities
6209Other information technology and computer service activities
6311Data processing, hosting and related activities
6312Web portals
6391News agency activities
6399Other information service activities n.e.c.
7111Architectural activitiesProfessional Scientific and Technical Activities
7112Engineering activities and related technical consultancy
7120Technical testing and analysis
7211Research and experimental development on biotechnology
7219Other research and experimental development on natural sciences and engineering
7220Research and experimental development on social sciences and humanities
7311Advertising agencies
7312Media representation
7320Market research and public opinion polling
7410Specialised design activities
7420Photographic activities
7430Translation and interpretation activities
7490Other professional, scientific and technical activities n.e.c.
8510Pre-primary educationEducation
8520Primary education
8531General secondary education
8532Technical and vocational secondary education
8541Post-secondary non-tertiary education
8542Tertiary education
8551Sports and recreation education
8552Cultural education
8553Driving school activities
8559Other education n.e.c.
8560Educational support activities
8610Hospital activitiesHuman Health and Social Work Activities
8621General medical practice activities
8622Specialist medical practice activities
8623Dental practice activities
8690Other human health activities
8710Residential nursing care activities
8720Residential care activities for mental retardation, mental health and substance abuse
8730Residential care activities for the elderly and disabled
8790Other residential care activities
9001Performing artsArts Entertainment and Recreation
9002Support activities to performing arts
9003Artistic creation
9004Operation of arts facilities
9101Library and archives activities
9102Museums activities
9103Operation of historical sites and buildings and similar visitor attractions
9104Botanical and zoological gardens and nature reserves activities
9311Operation of sports facilities
9312Activities of sports clubs
9313Fitness facilities
9319Other sports activities
9321Activities of amusement parks and theme parks
9329Other amusement and recreation activities
Table 2. Trend matrix of the first 20 NACE codes for turnover in the creative sector for 2000–2016.
NACE Codes20002001200220032004200520062007200820092010201120122013201420152016
7311111112827242426242322222321
7112322221115141110998912
620266333221111150474433
86222018181717111212956211144
582916151515151413131174353255
721977777543445422466
631144444332697734687
620923666656323647378
712011131213141615141516121286799
732012141414131311111010986551010
73121411101111764232579101111
86901920191921211818171716151311111212
59115555547778810101081313
7111131213121212855611111112121414
74901516161616151616161817161415141515
58118889108149131414141514131616
86232325252727222020222223212020181817
63994446484947493733403034282832252218
59141719502423242531332321222121202019
581410911109109881313131213151920
Notes: The numbers in the last column, which represents the year 2016 show the position of the NACE codes of that year.
Table 3. Trend matrix of the first 20 NACE codes for the number of employees in the creative sector for 2000–2016.
NACE Codes20002001200220032004200520062007200820092010201120122013201420152016
711221111111121111111
731133333332332222222
86222317161210464554333333
6202109976556775555544
721912222223443444455
58291719151717161511111210987766
712055444881010108766677
869021231720192119181815131099988
7320141614141315181715161512111110109
63111314131615131192866788910
7490442099101414131414141313111211
86231615121314141613131312111210121112
71118666564566781012131313
6209121110101299891111151415141414
86212721192120202020192017161616161715
63994748544951525243523937332831221916
5911913857777899131514151517
85592018181921192121212221181717171618
581167588111212161716171818181819
93293130282627252525242523222322242120
Notes: The numbers in the last column, which represents the year 2016 show the position of the NACE codes of that year.

