Abstract
The rapid development of online car-hailing services (OCSs) has a huge impact on traditional taxi service (TTS) and is triggering a revolution in the taxi industry. Due to the differences in age, monthly income level, etc., travelers’ using frequencies of taxi service are different. It is necessary for online car-hailing platforms and traditional taxi companies to know the choice behavior of different types of passengers to enhance competitiveness. Based on the survey data of taxi passengers in Nanjing, China, the passengers are characterized by using frequency per week as infrequent passengers, moderately frequent passengers, and frequent passengers. The group characteristics and the differences among groups are analyzed. Further, three binary logit models are applied to analyze the taxi service choice behavior of different groups. The model results show the significant factors vary among three types of passengers. The result indicates that the impacts of safety level improvement, comfort level improvement and travel cost reduction for OCS on passengers’ choice behavior are higher than that of safety level decreasing, comfort level decreasing, and travel cost increasing. Moderately frequent passengers are more sensitive to comfort level than travel cost. The conclusions contribute to both the OCS and TTS business strategies. The results also provide insights into taxi industry management for governments.
1. Introduction
Compared with transit options with large vehicles, the taxi plays a small and personalized role, providing door-to-door transport services, and can function as a complement to existing public transit services [1,2]. The taxi industry used to be a monopoly before online car-hailing services (OCSs) arose. To protect taxi drivers’ benefit and the externalities (pollution and congestion) caused by the circulating taxis [3], the taxi market has been traditionally regulated in terms of fares and entry control. To help in making policies, one group of scholars developed aggregate supply and demand models to examine the effectiveness and consequences of policies mainly associated with entry and fare controls [4,5,6,7,8,9,10,11,12,13]. Another group of scholars focused on modeling the spatiotemporal equilibrium of taxi supply and demand [14,15,16,17,18,19,20]. However, these regulations may also raise the cost for consumers and drivers as they lead to a misallocation of resources and potentially insufficient supply to meet consumer demand [21].
With the idea of the shared economy, which means linking excess supply with demand through online platforms [22], online car-hailing platforms circumvent centralized institutions (i.e., the taxi industry) by using regular unlicensed drivers and provide a supplemental source of income to their supplier [23], which attracts the interests of private car groups. Online car-hailing platforms can bridge the drivers and passengers simultaneously, so drivers can receive orders quickly and passengers can track drivers’ locations via the app, which largely reduces the uncertainty and anxiety of waiting for a cab [24]. Moreover, OCSs are more reliable, with a lower rejection rate and shorter waiting time [25]. All these advantages attract travelers’ interests.
After attracting the interests of drivers and consumers, to take over the market, several subsidy wars took place among online car-hailing platforms in China (Didi vs. Kuaidi, Didi vs. Uber, etc.). Many scholars studied the impacts of subsidy wars on the taxi industry. Leng et al. [26] analyzed taxi drivers’ behaviors within a subsidy battle and found that the average number of trips increased and a boom in short-distance trips occurred, whereas the distribution of long-distance trips remained unchanged. Wen et al. [27] investigated whether the difficulty of getting a taxi was alleviated by giving subsidies (bonuses or promotions) to taxi drivers or passengers. Su et al. [28] studied how the pick-up and drop-off locations of taxicabs changed during the subsidy wars. Fang et al. [29] investigated the change of taxicab operation zones during an e-hailing app subsidy war in China and how the change affected trip distance and cruising time.
Because of the stimulation of the subsidy wars, the online car-hailing industry increased rapidly. However, unlike taxis, online car-hailing platforms often frame themselves as ridesharing services in order to avoid the safety and supply regulations that face the taxi industry [21]. The drivers run these businesses during their free time and are not required to have commercial vehicle licenses [30], which also causes safety concerns. Unfortunately, several crimes have already been committed in China. The OCS is a new business model, and government departments have been exploring the development direction, supervision, and so on for this new industry. On 28 July 2016, the Ministry of Transport and six other ministries issued the “Guidance on Deepening Reform to Advance the Healthy Development of the Taxi Industry” and “Interim Measures for Online Car-Hailing Business Service Management.” For the first time, the Interim Measures made the legal status of OSC clear at the national level, defining them as taxi companies and referring to both traditional taxis and online car-hailing services collectively as taxis. To make the OCS market more organized and safer, different cities have formulated differentiated access conditions and management strategies. The development of the online car-hailing industry has gradually stabilized.
Although the online car-hailing industry is relatively new, many scholars have studied it from different perspectives. Comparisons between OCSs and traditional taxi service (TTS) were made by Anderson [31] and Glöss et al. [32]. Further, Young and Farber [33] compared the socioeconomic and trip characteristics of OCS users to that of other mode users to verify whether OCS users are different. Some scholars investigated the positive impacts of the online car-hailing industry on urban development and society. Rayle et al. [30] and Rogers [25] argued that OCSs may offer a more efficient and high-performance service than TTS by reducing drunk driving and other accidents. Their research also indicated that OCSs may fill gaps in public transit networks and diminish incentives for purchasing private vehicles. Some other scholars studied the negative impact of OCSs. They argued that OCSs may be a substitute for other modes than just taxis, and that it may in fact be taking users away from more sustainable modes such as public transit. The results concluded that OCSs were responsible for a 6% reduction in transit usage for major American cities following the arrival of Uber [34,35]. The OCS may have monopolistic aspirations and may not be friendly to those who cannot use smartphones [25,36]. The temporary employee of OCS companies may be subjected to unequal wages and benefits compared with full-time taxi drivers [25,30].
There are also some scholars studied OCS from the perspective of industry participants. Li and Zhao [37] studied the effects of OCSs on taxi drivers, passengers, and managers. Dawes [23] studied passengers’ attitudes toward OCSs and how online car-hailing platforms should be improved.
Different from TTS pricing determined by the government or under the guidance of government, OCS pricing varies according to the market. Some scholars studied the pricing method from different perspectives [38,39,40]. It is known to us that the emergence of OCSs greatly changed passengers’ travel behavior. Rayle et al. [41] found that OCS customers are younger and more frequently travel with companions. Some research results show younger, better-educated, and more affluent individuals are more likely to be OCS users [30,42]. Alemi et al. [43] focused on revealing the roles of socio-demographics, characteristics of the built environment, technology adoption, individual lifestyles and personal attitudes on the use of OCSs. Tang et al. [44] established a mixed-Logit model to analyze travelers’ choice behavior and then investigated the marginal effect of cost on TTSs and OCSs. Cao et al. [45] analyzed passengers’ preference for TTSs and OCSs under fixed taxi demand using simulation method.
There is no doubt that the development of OCSs has triggered a revolution in the taxi industry. In view of the changes, Qian and Ukkusun [46] studied the market equilibrium under the competition between OCSs and TTSs. In China, OCSs also conducted a huge impact on TTSs. Taking Nanjing, the capital of Jiangsu Province, as an example, there were 12,432 traditional taxis before the emergence of OCSs, but 3645 traditional taxis withdrew from the traditional taxi market by December 2018 (provided by Nanjing Transportation Bureau).
Today, some traditional taxis can receive orders through online car-hailing platforms and the traditional way (Taxis cruise along the streets and look for clients who signal their needs for taxis.) at the same time. However, until August 2019, traditional pick-up travels still accounted for more than 80% of the total travels of TTSs (provided by Nanjing Transportation Bureau). In this paper, TTS refers to the traditional taxis that receive orders in the traditional way.
Compared with TTSs, the development and management of the OCSs are still being explored. Due to the differences in age, income level, car ownership, etc., passengers’ frequency of taxi service are also various. This study addresses the following research gaps in the present study. Passengers are categorized as infrequent passengers, moderately frequent passengers, and frequent passengers according to the using frequency of taxi service every week. This research is focused on answering the following questions: (1) What are the group characteristics and the differences among groups? (2) With the coexistence of OCSs and TTSs, what factors are significant for different group passengers’ taxi service choice? (3) For different passengers, how should online car-hailing platforms and traditional taxi companies improve their service, and what effect will it have? How should management departments respond to promote the development of the taxi industry?
The remainder of this paper is organized as follows. Section 2 introduces the study area, the survey, the sample descriptive statistics and the method. Section 3 shows the characteristics of different groups and the differences among the groups. Further, we establish three models for different groups and compare the similarities and differences of the results. Section 4 discusses the effects of significant factors on passengers’ choice behavior. Finally, Section 5 provides the conclusion as well as directions for further research.
2. Data and Methodology
2.1. Survey Design
The study area is Nanjing, the capital of Jiangsu Province in China. It is one of the two sub-centers of the largest megalopolis in the Yangtze River Delta of eastern China. Nanjing covers an area of 6587 km2 and has a population of about 8.43 million, of which about 26.11% are university-educated. Further, Nanjing is a leader in adopting innovative technologies and new polices, and as introduced in the part of introduction, OCSs also have a huge impact on the TTS in Nanjing.
Socio-demographic characteristics will affect passengers’ travel frequency [47]. There are two main methods to collect data to explore passengers’ or drivers’ behavior. One is by instrumented cars [48,49], and the other is by questionnaire. In this study, a questionnaire was adopted. Passengers’ personal information, travel information, evaluation of taxi service, and mode choice information were involved in the survey to depict the choice preferences of different passenger groups.
This questionnaire referenced the collected variables in previous studies that investigated the characteristics of TTS and OCS users [30,50], passengers’ personal information, including passengers’ living city (Nanjing and others), gender, age, education level, monthly income, and the use of private cars. Big geospatial data, which are collected from taxi trajectories, can provide abundant locations to model the movement of people around cities. Moreover, some studies show that there exist strong spatiotemporal regularities for taxi trajectories [51,52,53]. Thus, to better analyze passengers’ choice behavior between OCSs and TTS, taking suitable time-space variables into consideration is necessary. In our questionnaire, travel distance, travel time period, and starting place are recorded. In addition to these variables, other travel information, such as frequency of taxi service use, travel purpose, whether there are companions, and whether the travel time is ample are also recorded. Previous studies about passengers’ choice behavior between taxi and other traffic modes showed that the service quality has a significant effect on passengers’ decision-making [40,41]. Thus, service indicators of taxis must be taken into consideration. In this study, the selected evaluation and comparison indicators of OCS and TTS include comfort level, travel cost, safety level, service attitude, waiting time and convenience. It should be pointed out that one of the purposes of this paper is to investigate the affecting factors for users’ choice behavior between OCS and TTS, so the travel cost is set to the comparison of passengers’ perceptions of the two modes for the recent trip, rather than specific travel costs. The travel mode choice behavior information includes passengers’ preference and the recent choice of taxi service.
2.2. Survey Conduction and Descriptive Statistics
The data collection was conducted from 11–24 October 2018, through online questionnaires and face-to-face questionnaires. The online questionnaires were disseminated through social media apps, and the face-to-face questionnaires were mainly distributed at subway stations, large residential areas, and commercial districts.
The collected questionnaires were screened according to the time spent answering the questions and the consistency of questions. Finally, 2861 valid questionnaires were obtained. Based on the survey data, passengers were divided into three categories according to the using frequency of taxi service every week. They are infrequent passengers (using taxi service once a week or less), moderately frequent passengers (using taxi service 2–4 times a week), and frequent passengers (using taxi service five times a week or more). The numbers of different types of passengers are 1027, 1003, and 831, respectively. The survey results are shown in Table 1 (to analyze the three types of passengers’ characteristics and differences more concisely, we define short-distance travel as distance less than 3 km, medium-distance travel as distance 3–9 km, and long-distance travel as distance out of 9 km).

Table 1.
Demographic information of the survey data.
As illustrated in Table 1, the proportions of passengers’ preference between OCSs and TTS are similar. However, passengers are more likely to choose OCSs in reality. The residential district is shown to have the highest taxi demand, followed by the business district. The sum of demand in these two districts contributes over 70% of the total. TTS has a great advantage in safety level, while OCSs have obvious advantages in waiting time and convenience.
The passengers younger than 18 years old, 46–55 years old, or over 55 years old are associated with infrequent taxi usages. Passengers with an education level under junior high school make up a higher proportion in infrequent passengers. In terms of monthly income, passengers with monthly income less than 3000 yuan have a significantly higher proportion in infrequent group, while those with a monthly income 5000–6999 yuan and 7000–9000 yuan are relatively lower in proportion in the infrequent group than the other two groups.
The travel distances of the total observations are mainly within 3–9 km. However, the proportion of short-distance travelers among infrequent passengers is significantly higher than the other two groups, and the proportion of long-distance travelers among frequent passengers is significantly higher than that of other two types of passengers. For travel time, all kinds of passengers mainly travel in off-peak hours, but for frequent passengers, the difference between peak hours and off-peak hours is smaller. This indicates that frequent passengers are less affected by travel time period when using a taxi service. Finally, when travelling by taxis, passengers always have ample time and are accompanied by other people.
There is no doubt that taxi enterprises, online car-hailing platforms, and industry management departments will pay attention to the impact of some factors on passengers’ choice behavior, such as preference, travel distance, travel time period, travel cost, and safety level. Therefore, passengers’ choice behavior under these factors were analyzed, and the results are shown in Table 2.
Table 2.
Analysis results of passengers’ choice behavior.
From Table 2, we can draw the following conclusions. (1) If the passenger’s choice preference is OCS, there will be a high probability that the passenger will choose OCS, but if his or her preference is TTS, the probability that he or she will choose TTS is only about 60%, which indicates that those who are used to choosing TTS are more susceptible to other factors. (2) Whenever the travel time period takes place, passengers prefer to choose OCS; especially when the travel time period is during peak time, the probability of OCS being selected will be significantly higher. (3) Whatever the travel distance is, all passengers tend to choose OCS. Notably, with the increase of travel distance, the proportion of TTS being selected by infrequent passengers and moderately frequent passengers will increase, while that for frequent passengers will decrease. (4) The proportion of those that think OCS is cheaper for infrequent passengers and frequent passengers is higher, while it is lower for moderately frequent passengers. Although their opinions on travel cost are different, all passengers tend to choose OCS in reality. This indicates that travel cost can be a significant factor for moderately group. (5) Although more people think that TTS is safer, the passengers tend to choose OCS.
2.3. Mode Choice Model
One of the aims of this study is to explore the factors that affect the choice of passengers with different travel distances. Logistic regression model is adopted in this study. Logistic regression can be binomial, ordinal or multinomial. Binomial or binary logistic regression deals with situations in which the observed outcome for a dependent variable can have only two possible types, “0” and “1”. Lots of studies utilized this feature to model the choice behaviors. A Bayesian binary logistic model was built to evaluate how the various factors affected the registration of electric bikes [54]. Yang and Lam [55] established a binary logistic model to analyze drivers’ decision-making behavior of paying for intelligent parking information system. Sheykhfard and Haghighi [56] studied the performance of drivers during interaction (whether the driver yields or fails to yield) with pedestrians based on a binary logistic model. In this study, the binary logistic regression is applied to model the individual choice between OCS and TTS. The outcome variable is considered as two cases—(a) the choice is OCS, and (b) the choice is TTS. We use to represent the probability that the “OCS” outcome occurs in the population. The probability of a “TTS” outcome is then . The binary logistic regression model can be written as
where is the constant. are the explanatory variables and are the estimated coefficients. is the binary-dependent variable. In this study, indicates that the passenger’s choice is OCS, and indicates that the passenger’s choice is TTS. and represent the probability that the passenger’s choice is OCS and TTS, respectively.
It should be pointed out that the validity of the calibration results, including the validity of variable parameters and model’s accuracy, needs to be tested. For coefficient hypothesizes testing, 95% confident level is adopted (p < 0.05). The accuracy of the model is usually measured by Cox and Sell R2, Nagelkerke R2, and the hit rate of the model (HR). HR stands for the conformity between the prediction results and the survey results. Reference to other studies on the definition of similar variables in binary logit model [54,57], the definition of variables in this paper is shown in Table 3.
Table 3.
Explanatory variables in the model.
2.4. Marginal Effect
To know passengers’ choice behavior thoroughly, understanding the contributions of significant factors is very important. The marginal effects of each independent variable can be used to interpret the parameter estimates [58,59,60]. Thus, the marginal effects of each significant independent variable were calculated. The contribution of a certain significant continuous factor to the probability that OCS is selected is shown as
where represents the marginal effect of variable on the probability that OCS is selected. is estimated coefficient of variable .
For categorical variables, the following formula is adopted to calculate the marginal effects [58].
where represents the probability that the passenger’s choice is OCS with , while other significant factors are kept as the raw value of the respondent.
3. Results
3.1. Calibration Results of Three Types of Passengers
Based on the data of different users, three binary logit models with 95% confident level of variables (p value < 0.05) were calibrated. The results are shown in Table 4.
Table 4.
Calibration results of three types of passengers.
The calculation results of three models show that the Cox and Sell R2, Nagelkerke R2, and HR are reasonable, which indicates that the models are acceptable.
Some conclusions can be drawn from the calibration results of infrequent users: (1) The significant factors for infrequent passengers to choose taxi service include education level (high school), monthly income (5000–6999 yuan, 7000–9000 yuan), preference, safety level, travel distance (0–3 km, 15–18 km), travel time period, and whether there are companions. (2) The passenger with a high school education level in the infrequent group is less likely to choose OCS. (3) The coefficient of monthly income is positive, and with the increase of monthly income, the coefficient will increase, which indicates that, with the increase of monthly income, the probability of infrequent passengers choosing OCS will increase. (4) Remarkably, the effect of education level and monthly income on infrequent users are opposite. The Pearson correlation coefficient of education level and monthly income is only 0.524. This may be because Nanjing has a strong business atmosphere, many people are engaged in business, and their monthly income is high. However, the correlation between whether people are engaged in business and education level is not strong. (5) The positive coefficients of preference and safety level indicate that when passengers are used to choosing a certain taxi service, the probability of this mode being selected will increase, and when OCS is safer than TTS, infrequent passengers are more likely to choose OCS. (6) When the travel distance is shorter than 3 km, the coefficient is positive. Whereas when the travel distance is 15–18 km, the coefficient is negative. This shows that infrequent passengers are more possible to choose OCS for short trips. With long travel distance, the probability of OCS being selected will decrease. It is consistent with the survey results. This may be because several serious crimes related to OCSs occurred in China. With long travel distance, passengers’ sense of security will decrease. However, when the travel distance is short, passengers will be more concerned about the time, reliability and convenience, so passengers will tend to choose OCS. (7) The coefficients of travel time period and whether there are companions are positive, which shows that infrequent passengers are more possible to choose OCS when travelling in peak time or when they have companions. There is a large demand in peak hours. Compared with traditional taxi companies, online car-hailing platforms have a strong ability of data analysis and taxi allocation, which can significantly reduce waiting time. What is more, passengers can know the waiting time simultaneously, which can reduce the anxiety.
We can draw the following conclusions from the calibration results of moderately frequent users: (1) Monthly income (less than 3000 yuan, 3000–4999 yuan and 5000–6999 yuan), preference, comfort level, travel cost, travel distance (15–18 km), and whether there are companions significantly affect moderately frequent passengers’ taxi service choice. (2) The coefficients of all significant monthly income levels are negative, so moderately frequent users with monthly income less than 6999 yuan will probably not choose OCS. Furthermore, with the increase of monthly income, the absolute value of the coefficients will decrease, which indicates that the negative effect on users’ choice will decrease. (3) When OCS is cheaper and more comfortable than TTS, moderately frequent passengers will tend to choose OCS. The survey results show that more than half of moderately frequent passengers think TTS is cheaper and more comfortable than OCS, so if these two indicators improved, passengers may change their choice. (4) Similar to infrequent passengers, travel distance (15–18 km) has a negative effect on the decision-making of moderately frequent passengers, and having companions has a positive effect.
The calibration results of frequent users show that education level (under junior high school), monthly income (7000–9000 yuan), preference, travel time period, and whether there are companions significantly affect their decision-making. The coefficients of education level and monthly income are positive, which means that frequent users whose education level are under junior high school or monthly income with 7000–9000 yuan are more possible to choose OCS. Similar to infrequent passengers, the coefficients of preference, travel time period, and whether there are companions are positive.
3.2. Comparative Analysis of Different Models
Comparing the calibration results of the three models, the following conclusions can be obtained. (1) The frequent group has the least significant factors, while the infrequent group has the most. (2) Preference and whether there are companions are common significant factors for three types of passengers. Preference or habit has been perceived as an automatic link between a goal and a specific behavior or as a behavioral script stored in memory [61,62,63]. Studies related to mode switching also argued that preference or habit has important impact on passengers’ choice [64,65]. In terms of the effect of whether there are companions, Rayle et al. [41] also found that it significantly affects the decision-making of passengers. Although monthly income is also a significant factor for all groups, the significant monthly income levels for three types of users are different. Moreover, monthly income has a positive impact on OCS choices for infrequent users and frequent users but a negative effect on moderately frequent users. (3) Travel time period has an important effect on choosing taxi service for infrequent passengers and frequent passengers, but moderately frequent passengers show little concern about it. (4) Compared with other two groups, infrequent users are more concerned about safety level. This may be because security is a basic requirement of all passengers. In addition, infrequent passengers have less experience with taxi services and, several serious crimes have occurred in China. These lead to infrequent passengers being more sensitive to safety level. (5) When choosing taxi service, moderately frequent passengers pay more attention to comfort level and travel cost. (6) The travel distance will significantly influence the choice behavior of infrequent users and moderately frequent users. When the travel distance is within 3 km, infrequent users are more possible to choose OCS. When the travel distance is long (15–18 km), the probability of OCS being selected for these two groups will decrease.
3.3. Marginal Effects of Significant Factors on Passengers’ Choice Behavior
The marginal effects of significant factors on the probability of OCS being selected for different types of passengers were calculated. The results are shown in Table 5.
Table 5.
Results of marginal effects of significant factors.
The following conclusions can be drawn from Table 5. (1) In terms of service indicators, moderately infrequent passengers are more sensitive to comfort level than travel cost. (2) The highest absolute value of marginal effect of monthly income (3000–4999 yuan) indicates that monthly income has the highest impact on the decision-making of moderately frequent users with this level. (3) Preference has the highest impact on three types of passengers’ decision-making in all significant factors. Further, the significance of effects is decreasing according to the following sequence: infrequent passengers, frequent passengers, and moderately frequent passengers. (4) Monthly income (5000–6999 yuan) has a higher effect on infrequent users than moderately frequent users. (5) Monthly income (7000–9000 yuan) has a higher effect on frequent users than infrequent users. (6) The effect of travel distance (15–18 km) on moderately frequent users is higher than infrequent users. (7) Having companions or not has the highest impact on infrequent passengers to choose OCS and has a higher impact on moderately frequent passengers than frequent passengers.
4. Discussion
One of the purposes of this study is to provide suggestions for online car-hailing platforms and traditional taxi companies to improve the service, so it is necessary to analyze how the change of corresponding significant factors, including safety level, comfort level, and travel cost, will affect passengers’ choice behavior. It should be pointed out that, although the marginal effects of significant factors are calculated, passengers’ attitudes toward the improvement and deterioration of a certain significant factor may be different, especially when there are alternatives, so it is necessary to conduct sensitivity analyses.
4.1. Sensitivity Analysis of Safety Level
The calibration results show that the safety level of taxi service significantly affects the choice behavior of infrequent passengers, so a sensitivity analysis of safety level for infrequent users was conducted, and the result is shown in Figure 1.
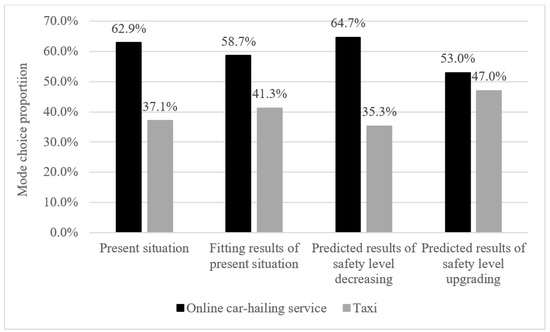
Figure 1.
The effect of safety level on infrequent users.
It can be concluded from Figure 1 that, compared with the fitting results of the calibration model for present situation, if the safety level of OCS is improved or the safety level of TTS is decreased—that is, letting the passengers who think the TTS is safer change their view (if the value of safety level is 0, it will be remained, otherwise it will be changed to 1)—then the proportion of choosing OCS will increase 6.0%, and conversely, the proportion will decrease 5.7%. Further, comparing the influence of safety level on a passenger’s choice behavior, we can see that infrequent passengers are more sensitive to the improvement of the safety level of OCS than the decrease of it.
4.2. Sensitivity Analysis of Travel Cost
The calibration results of moderately frequent passengers show travel cost significantly affects passengers’ choice behavior, so a sensitivity analysis of travel cost was conducted, as shown in Figure 2.
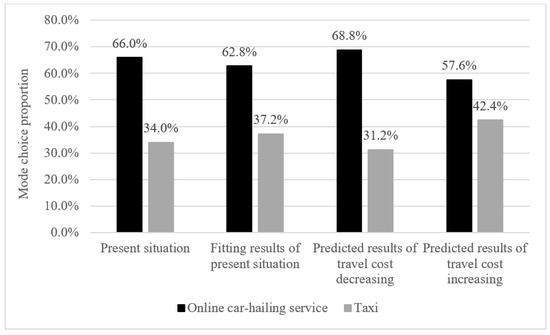
Figure 2.
The effect of travel cost on moderately frequent users.
Figure 2 shows that, compared with the fitting results of the calibration model for present situation, if online car-hailing platforms decrease travel cost or traditional taxi companies increase travel cost—that is, letting the passengers who think the TTS is cheaper change their view (if the value of travel cost is 0, it will be remained, otherwise it will be changed to 1)—then the proportion of choosing OCS will increase 6.0%, and conversely, the proportion will decrease 5.2%. Comparing the change rate of choice proportion, we can see that moderately infrequent passengers are more sensitive to the decrease of travel cost of OCS than the increase of it.
4.3. Sensitivity Analysis of Comfort Level
Based on the calibration results of moderately infrequent passengers, a sensitivity analysis of comfort level for those passengers was conducted, and the results are shown in Figure 3.
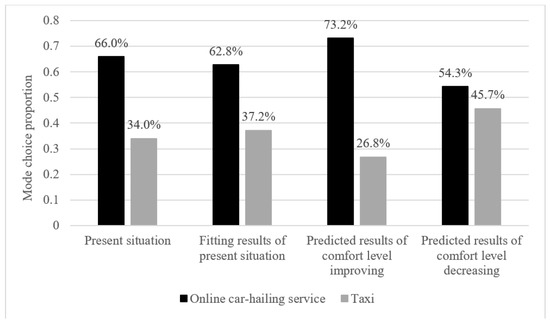
Figure 3.
The effect of comfort level on moderately frequent users.
Figure 3 shows that compared with the fitting results of the calibration model for present situation, if the comfort level of OCS is improved or the comfort level of TTS is decreased—that is, letting the passengers who think the TTS is more comfortable change their view (if the value of comfort level is 0, it will be remained, otherwise it will be changed to 1)—then the proportion of choosing OCS will increase 10.4%, and conversely, the proportion will decrease 8.5%. Further, the change rate of choice proportion indicates that moderately frequent passengers are more sensitive to the improvement of the comfort level of OCS than the decline of it.
Moreover, comparing the effects of travel cost and comfort level on moderately frequent passengers’ choice behavior, we can see that moderately infrequent passengers are more sensitive to comfort level than travel cost.
4.4. Sensitivity Analysis of Whether Having Companions
Whether having companions is a common significant factor for different types of passengers to choose taxi service. The survey results show most passengers think TTS is safer than OCS. As known to us, when there are companions, passengers will feel safer. Therefore, we analyzed passengers’ choice behavior when having companions and not. The results are shown in Figure 4, Figure 5 and Figure 6.
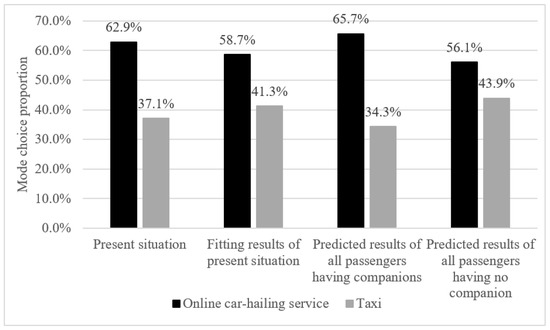
Figure 4.
The effect of whether having companions on infrequent passengers.
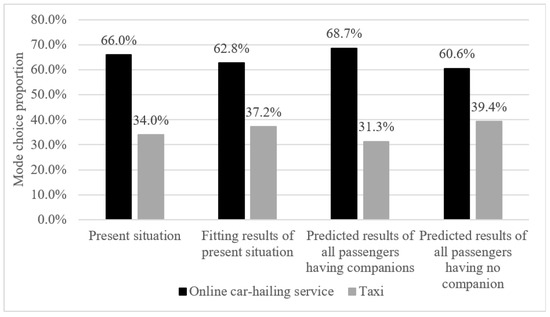
Figure 5.
The effect of whether having companions on moderately frequent passengers.
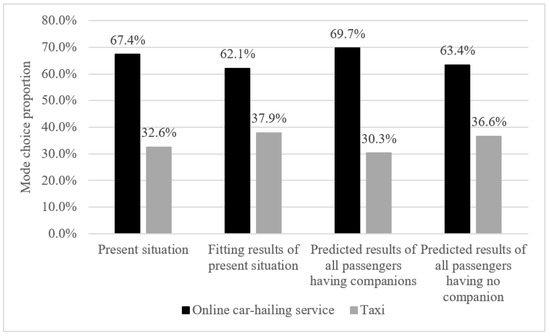
Figure 6.
The effect of whether having companions on frequent passengers.
The sensitivity analysis results indicate that if all passengers have companions, the proportion of OCS being selected will increase 2.8%, 2.7%, and 2.3% and will decrease 6.8%, 5.4% and 4.0% for infrequent passengers, moderately passengers, and frequent passengers, separately. Furthermore, we can find that having no companion has more impact on passengers’ choice of OCS.
4.5. Suggestions for Online Car-Hailing Platforms, Traditional Taxi Companies, and Management Departments
Several management strategies and policy recommendations are discussed, from operators and governments, respectively, to improve the taxi service. The results show that only 34.8% of passengers think that OCS is safer than TTS. Unfortunately, safety level is a significant factor for infrequent passengers to choose taxi service. For online car-hailing platforms, the following management actions can be considered to improve the safety level. (1) Operators can strengthen the construction of software and hardware equipment, such as setting up emergency contacts, using automatic alarm hot keys, and installing monitoring facilities. (2) Based on real-time GPS data, platforms can develop a system, which can monitor the driving behavior and remind drivers of dangerous situations, such as speeding and fatigue driving. (3) More resources should be invested in improving the safety education and management of drivers.
TTS needs to improve its performance in terms of waiting time and convenience. An important reason for this is that traditional taxi companies cannot make full use of big data (GPS data). Traditional taxi companies can set up a data analysis department to explore the spatial and temporal characteristics of passengers’ trips in order to adjust the capacity rationally.
Further, moderately frequent passengers are more sensitive to the decrease of travel cost of OCS (the increase of travel cost of the TTS), so it is necessary for online car-hailing platforms and traditional taxi companies to adjust their pricing strategies to enhance competitiveness.
Finally, in terms of management departments, three policy suggestions could be taken into account to enhance the safety level of taxi service. (1) The management departments should strengthen background checks of online car-hailing drivers and withdraw the operating qualifications of unqualified ones. (2) It is necessary for management departments to tighten up sanctions against drivers who do not have commercial licenses and companies where there are unqualified drivers and vehicles. (3) The credit system that can link the social credit system with taxi enterprises and drivers should be developed in time.
5. Conclusions
Frequency of use is one of the most important indicators for taxi companies. It is also a key indicator for management departments to analyze the status of the development of the taxi industry. Further, the attitudes of passengers with different using frequencies to the taxi service can help taxi companies and management departments know how to deal with different passenger needs. In this study, passengers are divided into infrequent passengers, moderately frequent passengers and frequent passengers based on the survey data in Nanjing. The characteristics of each group and differences among groups are analyzed, further, three binary logit models are established for different groups to explore the significant factors and the effects of these factors on passengers’ choice behavior. The results show that if the passenger’s preference is OCS, there will be a high probability that he or she will choose OCS, but if the passenger’s preference is TTS, the probability that he or she will choose TTS is only about 60%. Moreover, preference has the highest impact on the decision-making of passengers in all significant factors. Passenger satisfaction is considered the link between the service and passenger loyalty. Thus, improving the performance of the service indicators, especially the significant indicators, is the most effective way to promote passenger satisfaction and attract more prospective customers. Infrequent users are more concerned about the safety level than other two groups. Therefore, online car-hailing platforms can dispatch drivers with good service to these passengers to change their view. Besides, the suggestions discussed in this study should be taken into account for platforms or governments to fundamentally improve the safety level. Moderately frequent passengers are more concerned with comfort level and travel cost, and the effect of comfort level on passengers’ decision-making is higher than travel cost. Thus, online car-hailing platforms and traditional taxi companies should give priority to improving comfort level. With regard to travel cost, online car-hailing platforms can stimulate passengers to use more OCS and increase customer loyalty by handing out vouchers. Frequent passengers are associated with more long-distance travel. When travelling by taxi service, they are less affected by travel time period, but when choosing taxi service, travel time period significantly affects their decisions. Wait time is a key indicator of passengers’ choices in most cases. Unfortunately, traditional taxi companies do badly in this respect. To provide better service, enhancing the capability of analyzing big data is necessary.
There are also some limitations in this paper. Further research is needed to fill the following gaps. First, the passengers are only divided into three groups in this paper. In future research, passengers can be divided into more groups or divided based on different criteria, and the differences of the results can be compared. In addition, more meteorological data, such as season, temperature, and weather, could be considered in future studies.
Author Contributions
Literature search and review, T.W.; data preparation, M.L.; model adaptation, T.W. and Y.Z.; manuscript writing, T.W., Y.Z., M.L., and L.L.; manuscript editing, T.W., Y.Z., and L.L.
Funding
This work was supported by the Science and Technology Demonstration Project of Multi-modal Freight Transport in Jiangsu Province (2018Y02).
Acknowledgments
We are grateful for suggestions from Xing Fu.
Conflicts of Interest
The authors declare no conflict of interest.
References
- Austin, D.; Zegras, P.C. Taxicabs as public transportation in Boston, Massachusetts. Transp. Res. Rec. J. Transp. Res. Board 2012, 2277, 65–74. [Google Scholar] [CrossRef]
- King, D.A.; Peters, J.R.; Daus, M.W. Taxicabs for improved urban mobility: Are we missing an opportunity? In Proceedings of the 91st Transportation Research Board Annual Meeting, Washington, DC, USA, 22–26 January 2012. [Google Scholar]
- Salanova, J.; Estrada, M.; Aifadopoulou, G.; Mitsakis, E. A review of the modeling of taxi services. Procedia Soc. Behav. Sci. 2011, 20, 150–161. [Google Scholar] [CrossRef]
- Douglas, G.W. Price regulation and optimal service standards: The taxicab industry. J. Transp. Econ. Policy 1972, 6, 116–127. [Google Scholar]
- De Vany, A.S. Capacity utilization under alternative regulatory restraints: An analysis of taxi markets. J. Political Econ. 1975, 83, 83–94. [Google Scholar] [CrossRef]
- Shreiber, C. The economic reasons for price and entry regulation of taxicabs: A rejoinder. J. Transp. Econ. Policy 1981, 15, 81–83. [Google Scholar]
- Beesley, M.E.; Glaister, S. Information for regulating: The case of taxis. Econ. J. 1983, 93, 594–615. [Google Scholar] [CrossRef]
- Häckner, J.; Nyberg, S. Deregulating taxi services: A word of caution. J. Transp. Econ. Policy 1995, 29, 195–207. [Google Scholar]
- Cairns, R.D.; Liston-Heyes, C. Competition and regulation in the taxi industry. J. Public Econ. 1996, 59, 1–15. [Google Scholar] [CrossRef]
- Dempsey, P.S. Taxi industry regulation, deregulation, and reregulation: The paradox of market failure. Transp. Law J. 1996, 24, 73–120. [Google Scholar]
- Arnott, R. Taxi travel should be subsidized. J. Urban Econ. 1996, 40, 316–333. [Google Scholar] [CrossRef]
- Flores-Guri, D. An economic analysis of regulated taxicab markets. Rev. Ind. Organ. 2003, 23, 255–266. [Google Scholar] [CrossRef]
- Çetin, T.; Eryigit, K.Y. Estimating the effects of entry regulation in the Istanbul taxicab market. Transp. Res. Part A Policy Pract. 2011, 45, 476–484. [Google Scholar] [CrossRef]
- Yang, H.; Wong, S.C. A network model of urban taxi services. Transp. Res. Part B Methodol. 1998, 32, 235–246. [Google Scholar] [CrossRef]
- Wong, K.I.; Wong, S.C.; Yang, H. Modeling urban taxi services in congested road networks with elastic demand. Transp. Res. Part B Methodol. 2001, 35, 819–842. [Google Scholar] [CrossRef]
- Yang, H.; Wong, S.C.; Wong, K.I. Demand-supply equilibrium of taxi services in a network under competition and regulation. Transp. Res. Part B Methodol. 2002, 36, 799–819. [Google Scholar] [CrossRef]
- Yang, H.; Ye, M.; Tang, W.H.; Wong, S.C. A multi-period dynamic model of taxi services with endogenous service intensity. Oper. Res. 2005, 53, 501–515. [Google Scholar] [CrossRef]
- Wong, K.I.; Wong, S.C.; Yang, H.; Wu, J.H. Modeling urban taxi services with multiple user classes and vehicle types. Transp. Res. Part B Methodol. 2008, 42, 985–1007. [Google Scholar] [CrossRef]
- Yang, H.; Leung, C.W.Y.; Wong, S.C.; Bell, M.G.H. Equilibria of bilateral taxi-customer searching and meeting on networks. Transp. Res. Part B Methodol. 2010, 44, 1067–1083. [Google Scholar] [CrossRef]
- Yang, H.; Yang, T. Equilibrium properties of taxi markets with search frictions. Transp. Res. Part B Methodol. 2011, 45, 696–713. [Google Scholar] [CrossRef]
- Cohen, A.P.; Shaheen, S.A. Planning for Shared Mobility; American Planning Association: Chicago, IL, USA, 2016. [Google Scholar]
- Botsman, R. The sharing economy lacks a shared definition. Fast Co. 2013, 21, 2013. [Google Scholar]
- Dawes, M. Perspectives on the Ridesourcing Revolution: Surveying Individual Attitudes toward Uber and Lyft to inform Urban Transportation Policymaking. Ph.D. Thesis, Massachusetts Institute of Technology, Cambridge, MA, USA, 2016. [Google Scholar]
- Edelman, B.G.; Geradin, D. Efficiencies and regulatory shortcuts: How should we regulate companies like Airbnb and Uber? Stanf. Technol. Law Rev. 2016, 19, 293–328. [Google Scholar] [CrossRef]
- Rogers, B. The social costs of Uber. Univ. Chic. Law Rev. 2015, 82, 85. [Google Scholar] [CrossRef]
- Leng, B.; Du, H.; Wang, J.; Li, L.; Xiong, Z. Analysis of taxi drivers’ behaviors within a battle between two taxi apps. IEEE Trans. Intell. Transp. Syst. 2016, 17, 296–300. [Google Scholar] [CrossRef]
- Wen, J.; Zou, M.; Ma, Y.; Luo, H. Evaluating the influence of taxi subsidy programs on mitigating difficulty getting a taxi in basis of taxi empty-loaded rate. Int. J. Stat. Probab. 2017, 6, 9–20. [Google Scholar] [CrossRef]
- Su, R.; Fang, Z.; Luo, N.; Zhu, J. Understanding the dynamics of the pick-up and drop-off locations of taxicabs in the context of a subsidy war among e-hailing apps. Sustainability 2018, 10, 1256. [Google Scholar] [CrossRef]
- Fang, Z.; Su, R.; Huang, L. Understanding the Effect of an E-Hailing App Subsidy War on Taxicab Operation Zones. J. Adv. Transp. 2018, 2018, 1–14. [Google Scholar] [CrossRef]
- Rayle, L.; Dai, D.; Chan, N.; Cervero, R.; Shaheen, S. Just a better taxi? A survey-based comparison of taxis, transit, and ridesourcing services in San Francisco. Transp. Policy 2016, 45, 168–178. [Google Scholar] [CrossRef]
- Anderson, D.N. “Not just a taxi”? For-profit ridesharing, driver strategies, and VMT. Transportation 2014, 41, 1099–1117. [Google Scholar] [CrossRef]
- Glöss, M.; McGregor, M.; Brown, B. Designing for labour: Uber and the on-demand mobile workforce. In Proceedings of the 2016 CHI Conference on Human Factors in Computing Systems, San Jose, CA, USA, 7–12 May 2016. [Google Scholar]
- Young, M.; Farber, S. The who, why, and when of Uber and other ride-hailing trips: An examination of a large sample household travel survey. Transp. Res. Part A Policy Pract. 2019, 119, 383–392. [Google Scholar] [CrossRef]
- Henao, A. Impacts of Ridesourcing—Lyft and Uber—On Transportation Including VMT, Mode Replacement, Parking, and Travel Behavior. Ph.D. Thesis, University of Colorado at Denver, Denver, CO, USA, 2017. [Google Scholar]
- Clewlow, R.R.; Mishra, G.S. Disruptive Transportation: The Adoption, Utilization, and Impacts of Ride-Hailing in the United States; Research Report UCD-ITS-RR-17-07; Institute of Transportation Studies, University of California: Davis, CA, USA, 2017. [Google Scholar]
- Kenney, M.; Zysman, J. Choosing a future in the platform economy: The implications and consequences of digital platforms. In Proceedings of the Kauffman Foundation New Entrepreneurial Growth Conference, Amelia Island, FL, USA, 18–19 June 2015. [Google Scholar]
- Li, C.; Zhao, J. Humanizing travel: How e-hail apps transform stakeholder relationships in the US taxi industry. In Proceedings of the 94th Transportation Research Board Annual Meeting, Washington, DC, USA, 11–15 January 2015. [Google Scholar]
- Banerjee, S.; Johari, R.; Riquelme, C. Pricing in ride-sharing platforms: A queueing-theoretic approach. In Proceedings of the Sixteenth ACM Conference on Economics and Computation, Portland, OR, USA, 15–19 June 2015. [Google Scholar]
- Wang, X.; He, F.; Yang, H.; Gao, H.O. Pricing strategies for a taxi-hailing platform. Transp. Res. Part E Logist. Transp. Rev. 2016, 93, 212–231. [Google Scholar] [CrossRef]
- Zha, L.; Yin, Y.; Du, Y. Surge pricing and labor supply in the ride-sourcing market. Transp. Res. Procedia 2017, 23, 2–21. [Google Scholar] [CrossRef]
- Rayle, L.; Shaheen, S.A.; Chan, N.; Dai, D.; Cervero, R. App-Based, on-Demand Ride Services: Comparing Taxi and Ridesourcing Trips and User Characteristics in San Francisco; University of California Transportation Center: Berkeley, CA, USA, 2014. [Google Scholar]
- Smith, A. Shared, Collaborative and on Demand: The New Digital Economy. Available online: http://www.pewinternet.org/2016/05/19/the-new-digital-economy/ (accessed on 20 November 2019).
- Alemi, F.; Circella, G.; Handy, S.; Mokhtarian, P. What influences travelers to use Uber? Exploring the factors affecting the adoption of on-demand ride services in California. Travel Behav. Soc. 2018, 13, 88–104. [Google Scholar] [CrossRef]
- Tang, L.; Zou, T.; Luo, X.; Chen, S.W. Choice behavior of taxi-hailing based on mixed-Logit model. J. Transp. Syst. Eng. Inf. Technol. 2018, 18, 108–114. [Google Scholar]
- Cao, Y.; Li, Y.J.; Luo, X. Simulation of taxi passenger travel mode considering the influence of online booking taxi. J. Syst. Simul. 2018, 30, 162–169. [Google Scholar]
- Qian, X.; Ukkusuri, S.V. Taxi market equilibrium with third-party hailing service. Transp. Res. Part B Methodol. 2017, 100, 43–63. [Google Scholar] [CrossRef]
- Cheng, L.; Chen, X.; Yang, S.; Cao, Z.; De Vos, J.; Witlox, F. Active travel for active ageing in China: The role of built environment. J. Transp. Geogr. 2019, 76, 142–152. [Google Scholar] [CrossRef]
- Balsa-Barreiro, J.; Valero-Mora, P.M.; Montoro, I.P.; García, M.S. Geo-referencing naturalistic driving data using a novel method based on vehicle speed. IET Intell. Transp. Syst. 2013, 7, 190–197. [Google Scholar] [CrossRef]
- Balsa-Barreiro, J.; Valero-Mora, P.M.; Berné-Valero, J.L.; Varela-García, F.A. GIS Mapping of Driving Behavior Based on Naturalistic Driving Data. ISPRS Int. J. Geo-Inf. 2019, 8, 226. [Google Scholar] [CrossRef]
- Goodspeed, R.; Xie, T.; Dillahunt, T.R.; Lustig, J. An alternative to slow transit, drunk driving, and walking in bad weather: An exploratory study of ridesourcing mode choice and demand. J. Transp. Geogr. 2019, 79, 102481. [Google Scholar] [CrossRef]
- Nuzzolo, A.; Comi, A.; Papa, E.; Polimeni, A. Understanding Taxi Travel Demand Patterns Through Floating Car Data. Adv. Intell. Syst. Comput. 2018, 879, 445–452. [Google Scholar]
- Liu, X.; Gong, L.; Gong, Y.; Liu, Y. Revealing travel patterns and city structure with taxi trip data. J. Transp. Geogr. 2015, 43, 78–90. [Google Scholar] [CrossRef]
- Cai, H.; Zhan, X.; Zhu, J.; Jia, X.; Chiu, A.S.; Xu, M. Understanding taxi travel patterns. Physica A Stat. Mech. Appl. 2016, 457, 590–597. [Google Scholar] [CrossRef]
- Guo, Y.; Li, Z.; Wu, Y.; Xu, C. Evaluating factors affecting electric bike users’ registration of license plate in China using Bayesian approach. Transp. Res. Part F Traffic Psychol. Behav. 2018, 59, 212–221. [Google Scholar] [CrossRef]
- Yang, W.; Lam, P.T. Evaluation of drivers’ benefits accruing from an intelligent parking information system. J. Clean. Prod. 2019, 231, 783–793. [Google Scholar] [CrossRef]
- Sheykhfard, A.; Haghighi, F. Performance analysis of urban drivers encountering pedestrian. Transp. Res. Part F Traffic Psychol. Behav. 2019, 62, 160–174. [Google Scholar] [CrossRef]
- Zhang, Y.; Jiang, Y.; Rui, W.; Thompson, R.G. Analyzing truck fleets’ acceptance of alternative fuel freight vehicles in China. Renew. Energy 2019, 134, 1148–1155. [Google Scholar] [CrossRef]
- Zeng, Q.; Gu, W.; Zhang, X.; Wen, H.; Lee, J.; Hao, W. Analyzing freeway crash severity using a Bayesian spatial generalized ordered logit model with conditional autoregressive priors. Accid. Anal. Prev. 2019, 127, 87–95. [Google Scholar] [CrossRef]
- Losada-Rojas, L.L.; Gkartzonikas, C.; Pyrialakou, V.D.; Gkritza, K. Exploring intercity passengers’ attitudes and loyalty to intercity passenger rail: Evidence from an on-board survey. Transp. Policy 2019, 73, 71–83. [Google Scholar] [CrossRef]
- Meng, M.; Memon, A.A.; Wong, Y.D.; Lam, S.H. Impact of traveller information on mode choice behaviour. Proc. Inst. Civ. Eng. Transp. 2017, 171, 11–19. [Google Scholar] [CrossRef]
- Aarts, H.; Verplanken, B.; Van Knippenberg, A. Habit and information use in travel mode choices. Acta Psychol. 1997, 96, 1–14. [Google Scholar] [CrossRef]
- Aarts, H.; Verplanken, B.; Van Knippenberg, A. Predicting behavior from actions in the past: Repeated decision making or a matter of habit? J. Appl. Soc. Psychol. 1998, 28, 1355–1374. [Google Scholar] [CrossRef]
- Fujii, S.; Gärling, T. Development of script-based travel mode choice after forced change. Transp. Res. Part F Traffic Psychol. Behav. 2003, 6, 117–124. [Google Scholar] [CrossRef]
- Chen, C.F.; Chao, W.H. Habitual or reasoned? Using the theory of planned behavior, technology acceptance model, and habit to examine switching intentions toward public transit. Transp. Res. Part F Traffic Psychol. Behav. 2011, 14, 128–137. [Google Scholar] [CrossRef]
- Nordfjærn, T.; Şimşekoğlu, Ö.; Rundmo, T. The role of deliberate planning, car habit and resistance to change in public transportation mode use. Transp. Res. Part F Traffic Psychol. Behav. 2014, 27, 90–98. [Google Scholar] [CrossRef]


© 2019 by the authors. Licensee MDPI, Basel, Switzerland. This article is an open access article distributed under the terms and conditions of the Creative Commons Attribution (CC BY) license (http://creativecommons.org/licenses/by/4.0/).