Article

An Optimal Purchase Decision of Reusable Packaging in the Automotive Industry

1
College of Global Business, Korea University, 2511 Sejong-ro Sejong City 30019, Korea
2
Department of Industrial & Systems Engineering, Seoul National University of Science and Technology, 232 Gongneung-ro, Nowon-gu, Seoul 01811, Korea
3
Strategic Sourcing–Automotive, Illinois Tool Works, 9629 W 197th St, Mokena, IL 60448, USA
*
Author to whom correspondence should be addressed.
Sustainability 2019, 11(23), 6579; https://doi.org/10.3390/su11236579
Submission received: 9 September 2019 / Revised: 25 October 2019 / Accepted: 29 October 2019 / Published: 21 November 2019
(This article belongs to the Special Issue Optimal Decisions and Risk Assessment in Sustainable Supply Chains)

Abstract

:
Among the many components of material delivery operations, packaging is one of the foundations of secure and cost-efficient on-time delivery. Current environmental concerns have increased the popularity of returnable packaging over disposable packaging. This study considers a supply chain in the automotive industry where a single supplier adopts returnable packages for delivery operations to a single recipient. If a returnable package is not available, then an expendable package will be used as a more expensive alternative. Thus, an investment decision on the number of returnable packages must be made prior to launching a returnable packaging system. Using the actual data from an automotive supply chain, this study conducts simulated experiments, under the uncertainty of future demand and required lead time of reverse logistics, to identify the optimal quantity of returnable packages. Sensitivity analysis is then performed by varying the assumptions on operation duration, demand variability, and lead time variability. In general, the results indicate that a greater initial purchase of returnable packages is desirable for longer operation duration, higher demand variability, and higher lead time variability. However, if operation duration is short and the uncertainty is high, then there may be little benefit in using reusable packages. These results generalize the findings from previous studies. This approach and solution can enhance reliable and efficient supply chain operations in the automotive industry and may be applied to other industries where packaging is important and expensive.

1. Introduction

A closed-loop supply chain (CLSC) refers to a bi-directional supply chain between a sender and a receiver that aims to achieve both business and environmental benefits. It has gained attention from both industry and academics, due to growing interest in sustainability and the green economy [1,2,3,4]. CLSCs include forward logistics (procurement of materials, production, and distribution) and reverse logistics (collection and processing of returned products and parts) [5,6]. Due to its bi-directional nature, returnable packaging, or returnable transport items (RTIs), is an essential element of CLSCs [7,8,9]. RTIs may be applicable to both open and closed systems and have been widely accepted in the automotive industry. Typical materials in the automotive industry are expensive and therefore require sturdy packaging. Customized packaging reduces overall costs and improves reliability and productivity in the assembly line. For these reasons, along with long supply chain lifetimes and environmental motivations, many automotive supply chains in the US have adopted RTIs, including GM, Hyundai, Chrysler, and Ford [10,11,12].
For automotive supply chains adopting RTIs, the readiness of empty RTIs in the right locations is particularly important due to high stock-out costs in the automotive industry [12]. Stock-out costs in these supply chains are very high because expensive machinery is typically utilized and responsiveness toward highly fluctuating demand is crucial. This means that idling in a supply chain is very costly. To tackle the high stock-out costs, 100% on-time delivery is typically required of tier suppliers. Among RTI control strategies, an automotive supply chain also generally adopts a highly responsive switch-pool system, where the switch is triggered upon every delivery of an RTI from a sender to a recipient, and the recipient must return the empty containers immediately [7]. In the temporary absence of returnable packages, single-use expendable packages must be consumed as an expensive but inevitable alternative. Figure 1 illustrates typical containers used for packaging. A returnable container is typically made of metal, wood, and plastic, whereas an expendable container is typically a single-use corrugated box.
Research has been conducted on the importance of RTIs in the automotive industry. The authors of reference [13] compared the percentage of returnable container use in ten automobile assembly companies and assessed their annual cost savings. Upon the initialization of a returnable packaging program, an automotive supply chain must make an appropriate investment decision on the number of returnable packages purchased to allow for cost-savings and an environmentally-friendly supply chain operation. Identifying the required number of containers has already been attempted [8,9,14]. Given a fixed number of annual container movements and a fixed velocity of circulation, the optimal number of reusable packages was identified [14]. However, we feel that the assumptions in this study should be relaxed to include stochastic variations in the number of movements and the speed of delivery, since the two factors are by no means deterministic in practice. For similar purposes, determining the economic return lot size has been attempted using an analytic model [8] and a discrete optimization model [9]. However, since these studies focused on determining the return lot size, they are not applicable to the most prevalent switch-pool system in automotive supply chains, where the return lot size is determined by a time-frame such that one day means one return trip.
This study focuses on the most important and variable factors, return time and demand, when deciding on the level of initial investment for RTIs in automotive supply chains. As a seminal paper, reference [15] presented several stochastic factors that are typically found in supply chains. These include lead time, demand, the market prices of materials and end products, the reliability of the transport chain, and the reliability of suppliers. In the use of RTIs, the return lead time is the most important factor [8,9]. Demand fluctuations that cause additional packages to be used at unexpected times also present challenges for operations management. An improper amount of initial investment may cause a longer cycle time and necessitate additional investments at higher marginal costs [12].
This study aims to propose a strategy for finding the optimal level of initial investment. Since identifying the optimum with multiple stochastic factors is not generally solvable in an analytic way, this study formulates the problem with simplifying but practical assumptions, and the optimal quantity is then found using computerized simulation experiments. This study formulates the problem on practical applications, thus providing resolutions to the high stock-out costs that automotive supply chains face [10,11,12]. Compared to analysis on the current status and benefits of investment on returnable packages [13], this study discusses how to make a practical investment decision. Enhancing the deterministic view on lead time and demand [14], this study incorporates the stochastic variations in an automotive supply chain.
The remainder of this paper is structured as follows: Section 2 briefly discusses the relevant literature, Section 3 formulates the problem and describes the simulation settings, Section 4 presents the main results and sensitivity analysis, and Section 5 discusses the main findings and concludes the paper.

2. Literature Review

The main roles of packaging in supply chains are protection, containment, and preservation [16]. In addition to these traditional functions, there is a growing awareness of the benefits of more efficient and environment-friendly packaging. From both financial and sustainable perspectives, efficient packaging leads to a more efficient supply chain [17]. Reducing packaging materials is one of the representative efforts, which improves environmental performance and reduces operational costs [18]. Furthermore, due to recent legislative changes regarding packaging and packaging waste, many firms must reconsider their use of packaging [19]. Given these motivations, returnable packaging has been widely adopted in supply chains in the automotive industry. In the early 1990s, the Automotive Industry Action Group in the US proposed guidelines for returnable package management [20].
The Reusable Packaging Association defines reusable transport packaging as including pallets, bins, tanks, intermediate bulk containers, reusable plastic containers, and other hand-held containers. Such reusable packaging is designed for lasting use in a system that ensures their effective recovery and return for continuous operations [21]. The terms ‘reusable packaging’ and ‘returnable packaging’ are often used interchangeably by practitioners and academics [22]. Especially in the automotive industry, returnable packaging helps to reduce waste, costs, and transport damages [23], and companies can attain economic and environmental benefits through reusable packaging [24]. The authors in reference [12] report that use of returnable packaging can contribute to reducing purchase and disposal costs of packaging materials, improving productivity of an assembly line, and enhancing cleanliness of the assembly line. Although returnable packaging has been increasingly adopted by the automotive industry for many of these advantages, field practitioners often have trouble controlling container logistics, i.e., getting the right number of the empty containers to the right place at the right time. Inefficient allocation of reusable packaging requires more containers in a system, which in turn, requires higher investment costs. Another possible factor affecting higher investment costs is a longer return time [12].
There are trade-offs between returnable packaging and non-returnable packaging. When the delivery distance is longer and the seasonal variability is higher, one-way (non-returnable) packaging is generally preferred to returnable packaging. This is because the return transport of empty containers involves high costs [25]. Authors in reference [26] identified six factors to analyze the economics of RTI systems: container unit cost, cycle time, pack quantity, delivery distance, average daily volume, and peak volume. Then, the authors performed a multivariate regression. They found that as the average daily volume increases, reusable systems should be preferred, whereas the opposite is true when the delivery distance or cycle time is longer [26].
RTI systems can be classified into three types based on the main control strategy [7]. The first type is a switch-pool system, where a switch is triggered upon every RTI delivery. The second type is a transfer system where the sender has full responsibility for tracking, storing, and administrating RTIs. The last type is a depot system where a designated central agency maintains and stores RTIs; the sender obtains RTIs from the depot and uses them to deliver products, and the receiver returns the empty RTIs to the depot. A simulation approach is adopted to explore how the choice of control strategy affects the performance of the RTI system in the case of a food company [7]. We confine our attention to switch-pool systems as they are adopted by most automotive supply chains.
RTI systems can vary by who owns the returnable packages. They can be owned by a supplier (dedicated mode) or an assembler (shared mode). In a dedicated mode, a supplier and an assembler use the RTIs exclusively for their supply chain. In a shared mode, RTIs are used for an assembler and its multiple suppliers. In automotive supply chains, the assembler naturally has more power and initiative. In many cases, assemblers initiate RTI systems and take ownership of returnable packages [10,11,27]. A shared mode may have cost benefits through its shared use of packages among tier suppliers, but the prerequisites of commonly serviceable container boxes for various materials from various suppliers is hard to meet [10]. In addition, when deciding on the initial investment, assemblers tend to make decisions on the conservative side while the responsibility of on-time delivery stays with the suppliers. Given all these considerations, the dedicated mode can also be found in the car industry. For example, suppliers of Ford and Hyundai must purchase returnable packages, whereas GM and Chrysler purchase their own [12]. When initializing an RTI system, a dedicated mode is easier to implement. Thus, this study confines attention on a supplier’s investment decision in a dedicated mode. Specifically, we formulate the optimization problem with one supplier and one assembler.
Several studies exist related to the investment decision of RTIs. In the study of annual cost savings of ten companies [13], size of company and type of ownership are varied. Thus, it is hard to draw a conclusion on the initial optimal number of containers. Authors in reference [14] assume that the total number of containers traveled (A) and the average speed of circulation (B) are given. It tells us that the company needs the number of containers equal to B/A, all else being fixed. We feel this study can be improved if the travel demand (A) and lead time (B) are relaxed to include stochastic variations. In the analytic approach in reference [8], lead time is modeled as a random variable while travel demand is fixed. This model is more suitable to industries where demand is fixed or easily predictable. The study using mixed-integer programming [9] is more concerned with economic lot size, which has limited applicability in switch-pool systems. Overall, we consider that this line of study is lacking in reflecting practical stochastic components into the main problem.
In an effort to introduce random components into modeling RTI systems, four different procedures for forecasting the return lead time of reusable packages are proposed [28]. A supply chain model for agricultural products was presented using stochastic lead time for RTIs. As the considered agricultural products were perishable, the relationship between the variations in lead time and delayed supply were assessed with realistic monetary terms [8]. Among stochastic lead time studies, there is a case in which a vendor with a temporary shortage of packages may rent from a nearby service provider [9]. This problem setting is similar to ours where expendable packages must be used when reusable packages are unavailable. As demand greatly affects the circulation of reusable packages in the automotive industry supply chain, this study views future demand as a stochastic component affecting operational costs and lead time for package travel.
In summary, as a reflection of the typical supply chain for the automotive industry, this study assumes (1) a switch-pool system, where the packages must be returned to a supplier immediately upon arrival, (2) that the returnable packages are owned by a supplier, therefore the packages are used exclusively by the supplier and assembler, and (3) that both demand and lead time are stochastic.

3. Model and Method

3.1. Formulation

This study considers a CLSC consisting of one supplier and one assembler. Returnable packages owned by the supplier circulate within the loop. Under the assumption that demand and lead time for the returnable packages are both stochastic, this study aims to find an optimal number of packages for initial purchase so that the total operational costs including RTI system operations are minimized. A few other simplifying assumptions are made as follows:
  • No containers are lost during circulation.
  • Only a single type of product is supplied.
  • Expendable packaging is always available in case returnable packaging is out-of-stock.
  • Returnable containers sent out together on the same day come back together on the same day.
  • Daily demand approximately follows a normal distribution.
Figure 2 illustrates the circulation of returnable containers. On day 10, the number of remaining returnable containers from the previous day is 30, and the other 140 containers are returned from the assembler on the day. This means there are 170 on-hand containers available, which is enough to meet the demand of 150 packages. Thus, 20 containers remain. On day 11, on-hand containers become 140, after 120 of them are returned. However, the demand of 160 packages exceeds the available on-hand containers, thus 20 units of expendable packages should be used as a result of the stock-out.
Our formula for the total cost of reusable packages reflects realistic operations as well as the study entailing the cost factors in an RTI system [26]. Studies reviewed in the previous section provide insight on the modeling of each component: overall cost for an automotive supply chain [13], lead time [28], variability in lead time [8], and expendable packages as replacements [9].
Table 1 summarizes the variables.
Let D t be the demand for the packages on day t, I t be the number of available returnable packages on day t, R t be the number of returned packages on day t, and L t be the return time for the returnable packages that are sent out on day t. In addition, let Q t r be the number of returnable packages used on day t and Q t e be the number of expendable packages used on day t. Then, the following equations summarize the circulation process illustrated in Figure 2:
Q t r = m i n ( D t ,   I t )   for   t 1
Q t e = m a x ( D t Q t r ,   0 )   for   t 1
I t = I t 1 + R t 1 Q t 1 r   for   t 2
R t =   i = 1 t 1 Q i r 𝟙 ( L t =   t i )   for   t 2
where 𝟙(·) is a binary indicator function that returns 1 if true and 0 if false. Letting P r be the unit price for a returnable package and P e be the unit price for an expendable package, we can formulate the cost component as follows:
Initial cost = P r V
Expandable packages costs =   Q t e P e
Holding costs for returnable package =   h   I t
where V is the total number of returnable packages and h is the daily holding cost for a returnable package. Although expendable packages also incur holding costs, they are considerably lower than that of returnable packages. As Figure 1 illustrates, most expendable packages are made of corrugated cardboard that can be folded for storing. Thus, the holding cost for expendable packages is not considered in the formulas. In consideration of introducing returnable packages, parties in the supply chain should find the optimal level of initial investment V * that minimizes the total cost incurred for the period of T days as follows:
V * = argmin V   P r V + t = 1 T Q t e P e + h t = 1 T I t   subject to Equations (1)–(4).

3.2. Simulation Settings

The previous subsection formulated the problem of deciding how many units of returnable packages should be initially purchased. In this section, we present simulation tests using actual data gathered from a supply chain in the US automotive industry. Using the simulated results, the following questions should be addressed:
  • Under the specific costs, what is the optimal level of purchase?
  • What are the cost components that mainly drive the optimal decision?
  • When the considered duration of operation is lengthened, how does the optimal level of purchase change?
  • If lead time and demand have more uncertainty, how does this affect the optimal decision?
Table 2 presents the identified quantities from the actual data. We assume that both types of packages do not result in disposal costs at end-of-life, because (1) returnable containers at end-of-life can be sold to plastic recyclers and (2) expendable packages are collected by wood and paper recyclers for free after use.
For the simulated tests, the following variations were applied:
  • For stochastic variables Dt and Rt, the coefficients of variations (CVs) are set to 0.1, 0.2, or 0.3. That is, this study tests for the cases where the standard deviations of these variables are 10%, 20%, or 30% of their mean, respectively. This allows for simulation of the uncertainty in demand and return time.
  • For the duration of operations under consideration, we test for T = 2, 3, 4, and 5 years. We assume there are 250 business days in a year.
  • For the decision variable V, each scenario corresponding to 1700, 1725, 1750, …, 2200 is considered.

4. Results

4.1. Period of Operation of Three Years

We first consider a duration of operation of three years. This preliminary setting allows us to observe which cost components have the greatest effect on the total expected cost and how the optimal quantity of investment changes according to the variations in lead time and demand. Figure 3 presents how optimal quantity is determined when the CV for both lead time and demand is 20%.
As greater initial investments are made, this causes greater investment cost and holding cost. On the other hand, the expendable package cost decreases. It is noticeable that the initial investment for reusable packages comprises a large portion of the total cost. This cost grows linearly as greater initial investment in reusable packages is made. The expendable packages cost decreases as more reusable packages are secured. The marginal decrease of this cost is decreasing, i.e., the curve is decreasing but convexly decreasing. The holding cost comprises the smallest portion among the component costs as the supplier is located in a suburban area. The holding cost increases as more investment is made. This is because there is a greater chance of reusable packages becoming idle. Overall, the optimal quantity for initial investment is 1975 packages.
Now that the interaction of each component in the expected total cost is understood, Figure 4 investigates how randomness in demand and lead time affect the total cost and optimal decision.
Figure 4a fixes the variation in lead time and Figure 4b fixes the variation in demand. From both sub-figures, it is noticeable that higher randomness implies higher costs in the overall operations. In a deterministic setting, there will be less understock and overstock of reusable packages. However, in the realistic setting of fluctuations in lead time and demand, higher variations incur costs in the operations. More variation implies that greater initial investment is desirable. This is because more packages are needed in this supply chain to play the role of a buffer in the stochastic fluctuation of demand and lead time.

4.2. Period of Operation of 2–5 Years

Now that cost components and optimal quantity of initial investment have been investigated for period of operation of three years, in this subsection we investigate more general lengths of operations. Figure 5 presents results for the total duration of operation of two, three, four, and five years while fixing the CV of both lead time and demand to 20%.
To observe how optimal values are determined differently for the varying length of operation, Figure 5a presents the total expected cost as the quantity of initial investment changes. As insufficient investment negates the benefits of using reusable packaging and too high investment wastes a portion of initial investment, the optimum value balances the trade-off decision. A longer operation justifies greater initial investment because there are more chances to utilize the reusable packages and to save the cost of expendable packaging. Aside from the total expected cost as discussed previously, observing the annualized cost clearly demonstrates how the investment in reusable packaging makes the overall operation cost-efficient. Figure 5b presents the average annual cost. As the length of operation increases, greater cost savings are generated.
Figure 6 investigates how the relationship between randomness and optimal quantity is affected by the length of operation. For two years of operations, a lower optimal quantity (circled) is found for greater randomness. On the other hand, results for operation lengths of 3–5 years differ. The optimal quantity for greater randomness in demand and lead time increases for longer operations.
This seemingly counter-intuitive result is interpreted as the higher randomness for the shorter operations indicates that the initial investment decision should be more conservative. This is because the utilization of reusable packaging is less guaranteed under higher variation. Thus, two years of operation is not sufficient to justify the initial investment. The effects of variations in demand and lead time are similar. The effect of variations in demand and lead time should be carefully assessed by considering the length of operation.

5. Discussion

Investing in more reusable packages increases investment and holding costs, but costs of expendable packages are reduced. From this trade-off relationship, an optimal quantity of investment can be determined (Figure 3). A longer length of using a reusable package system brings out substantial cost savings by reducing annual operations costs (
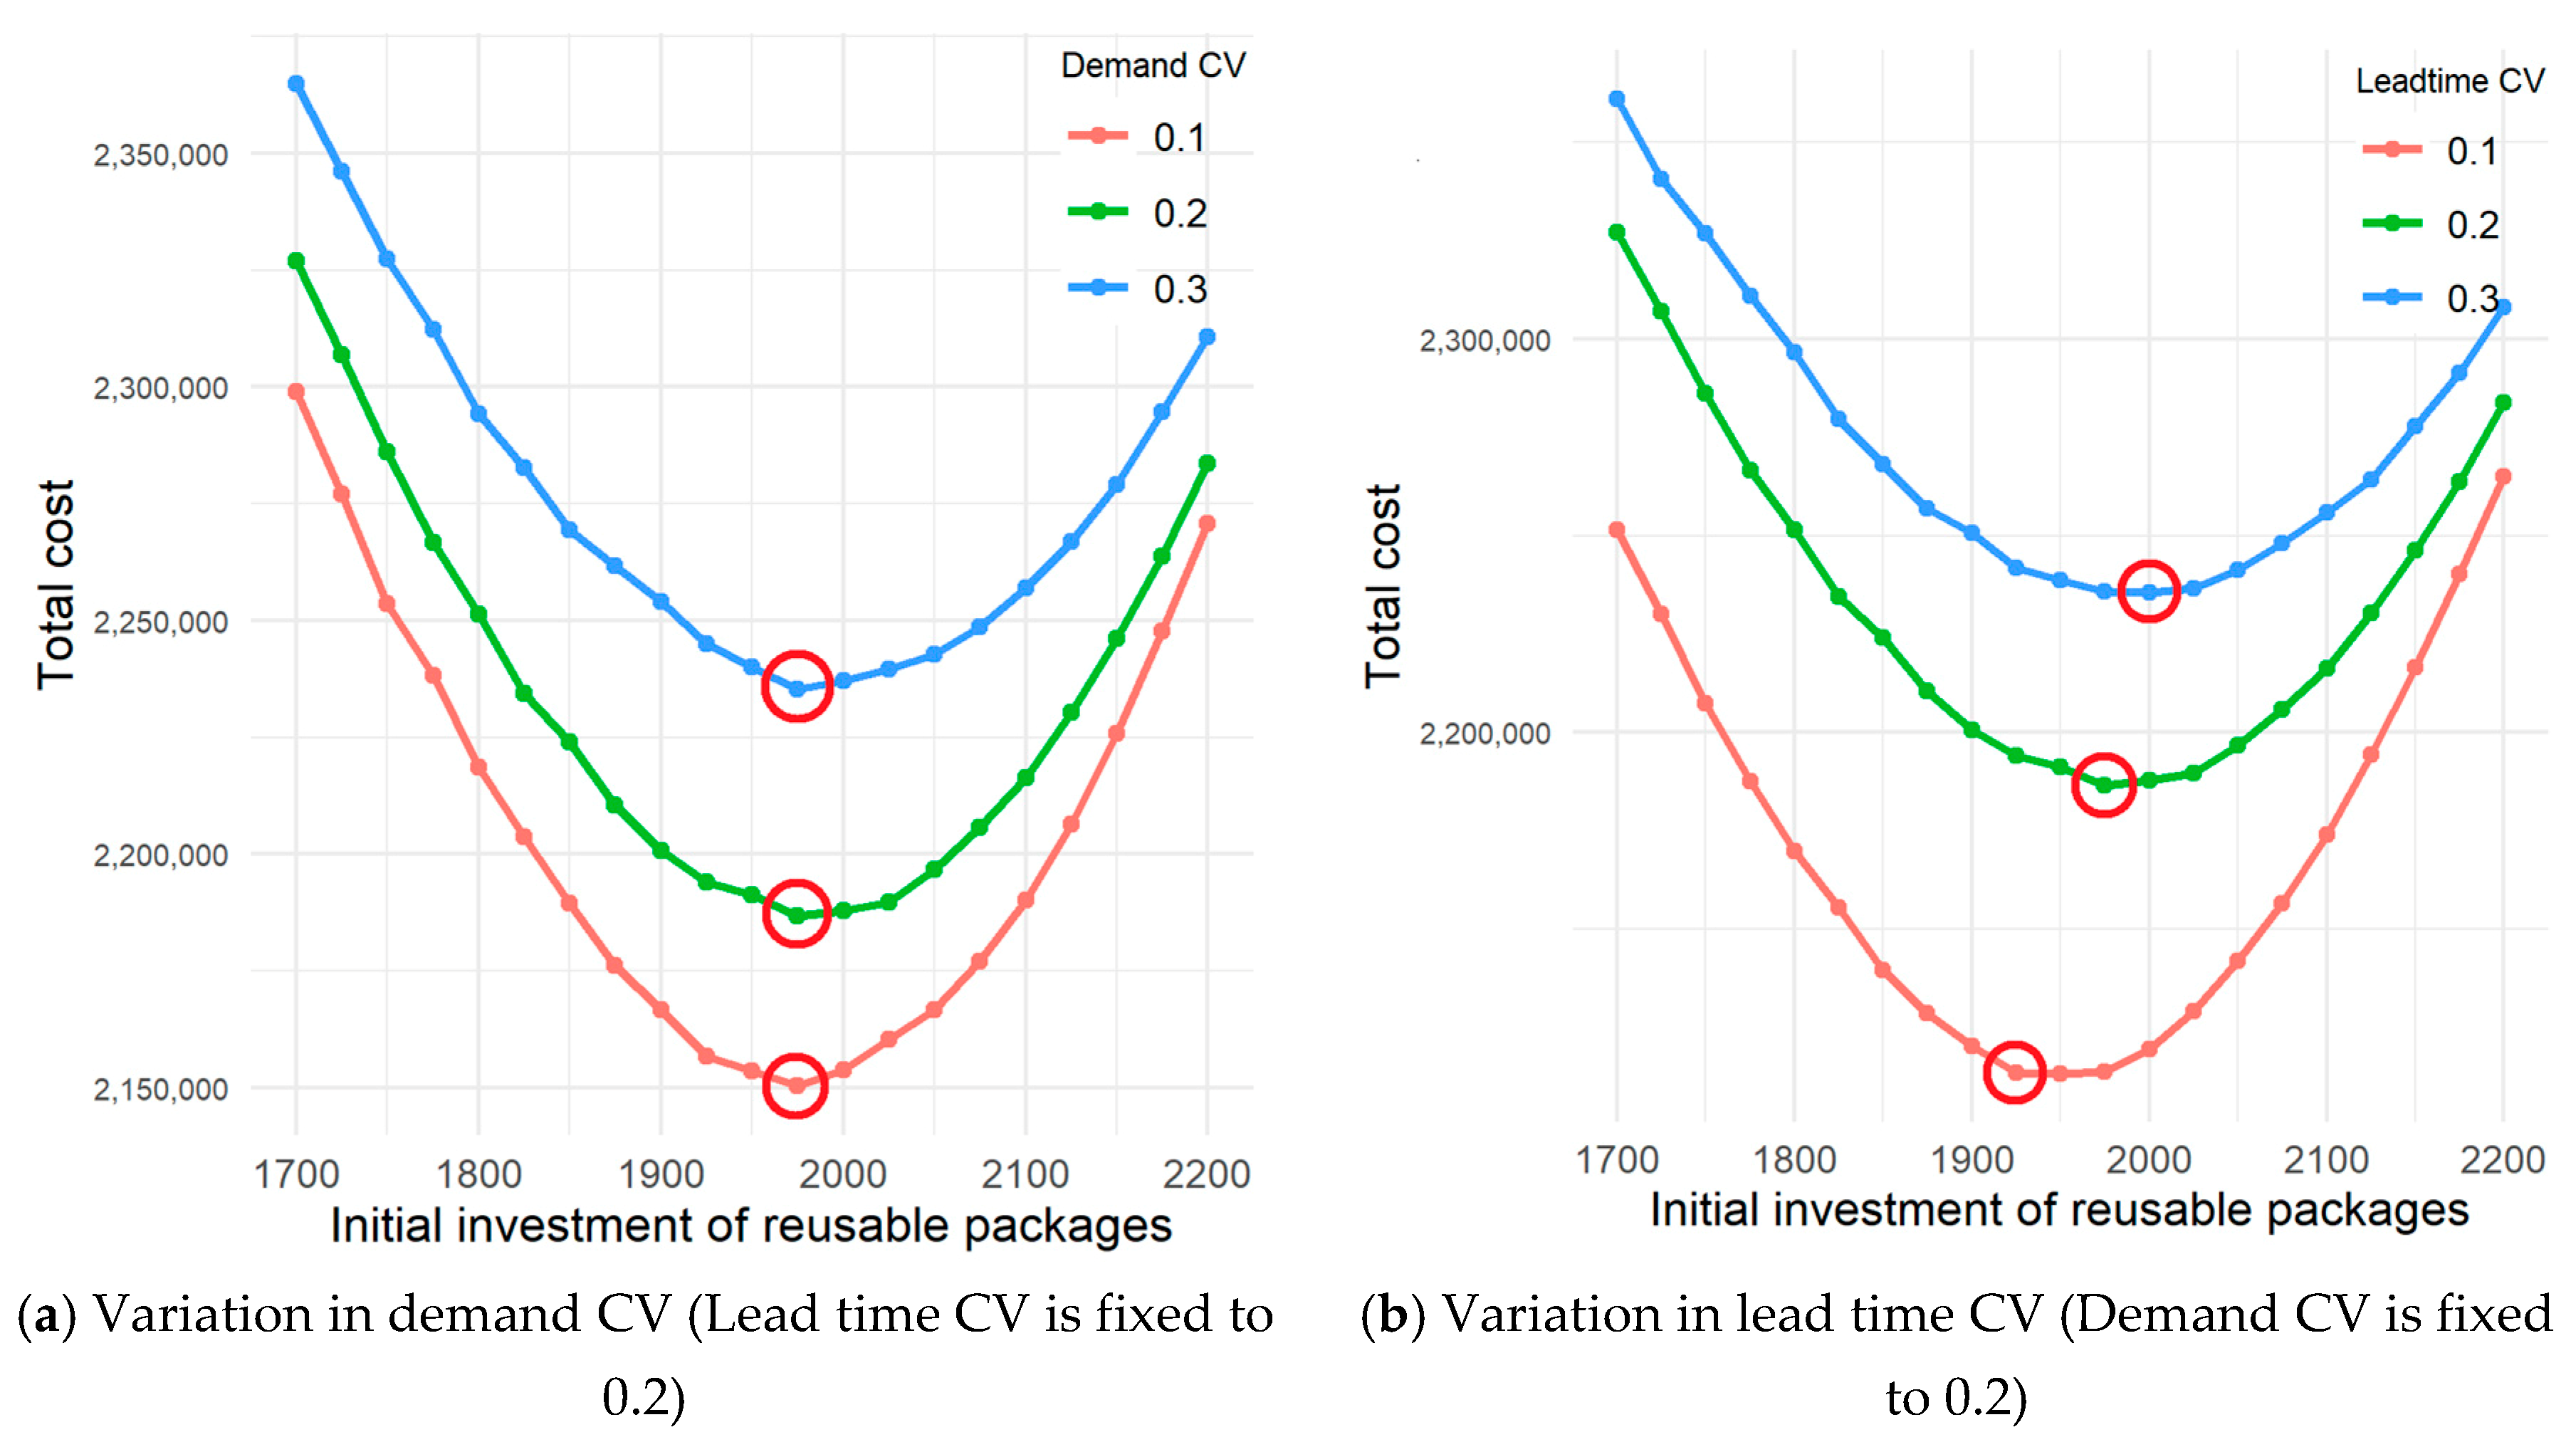
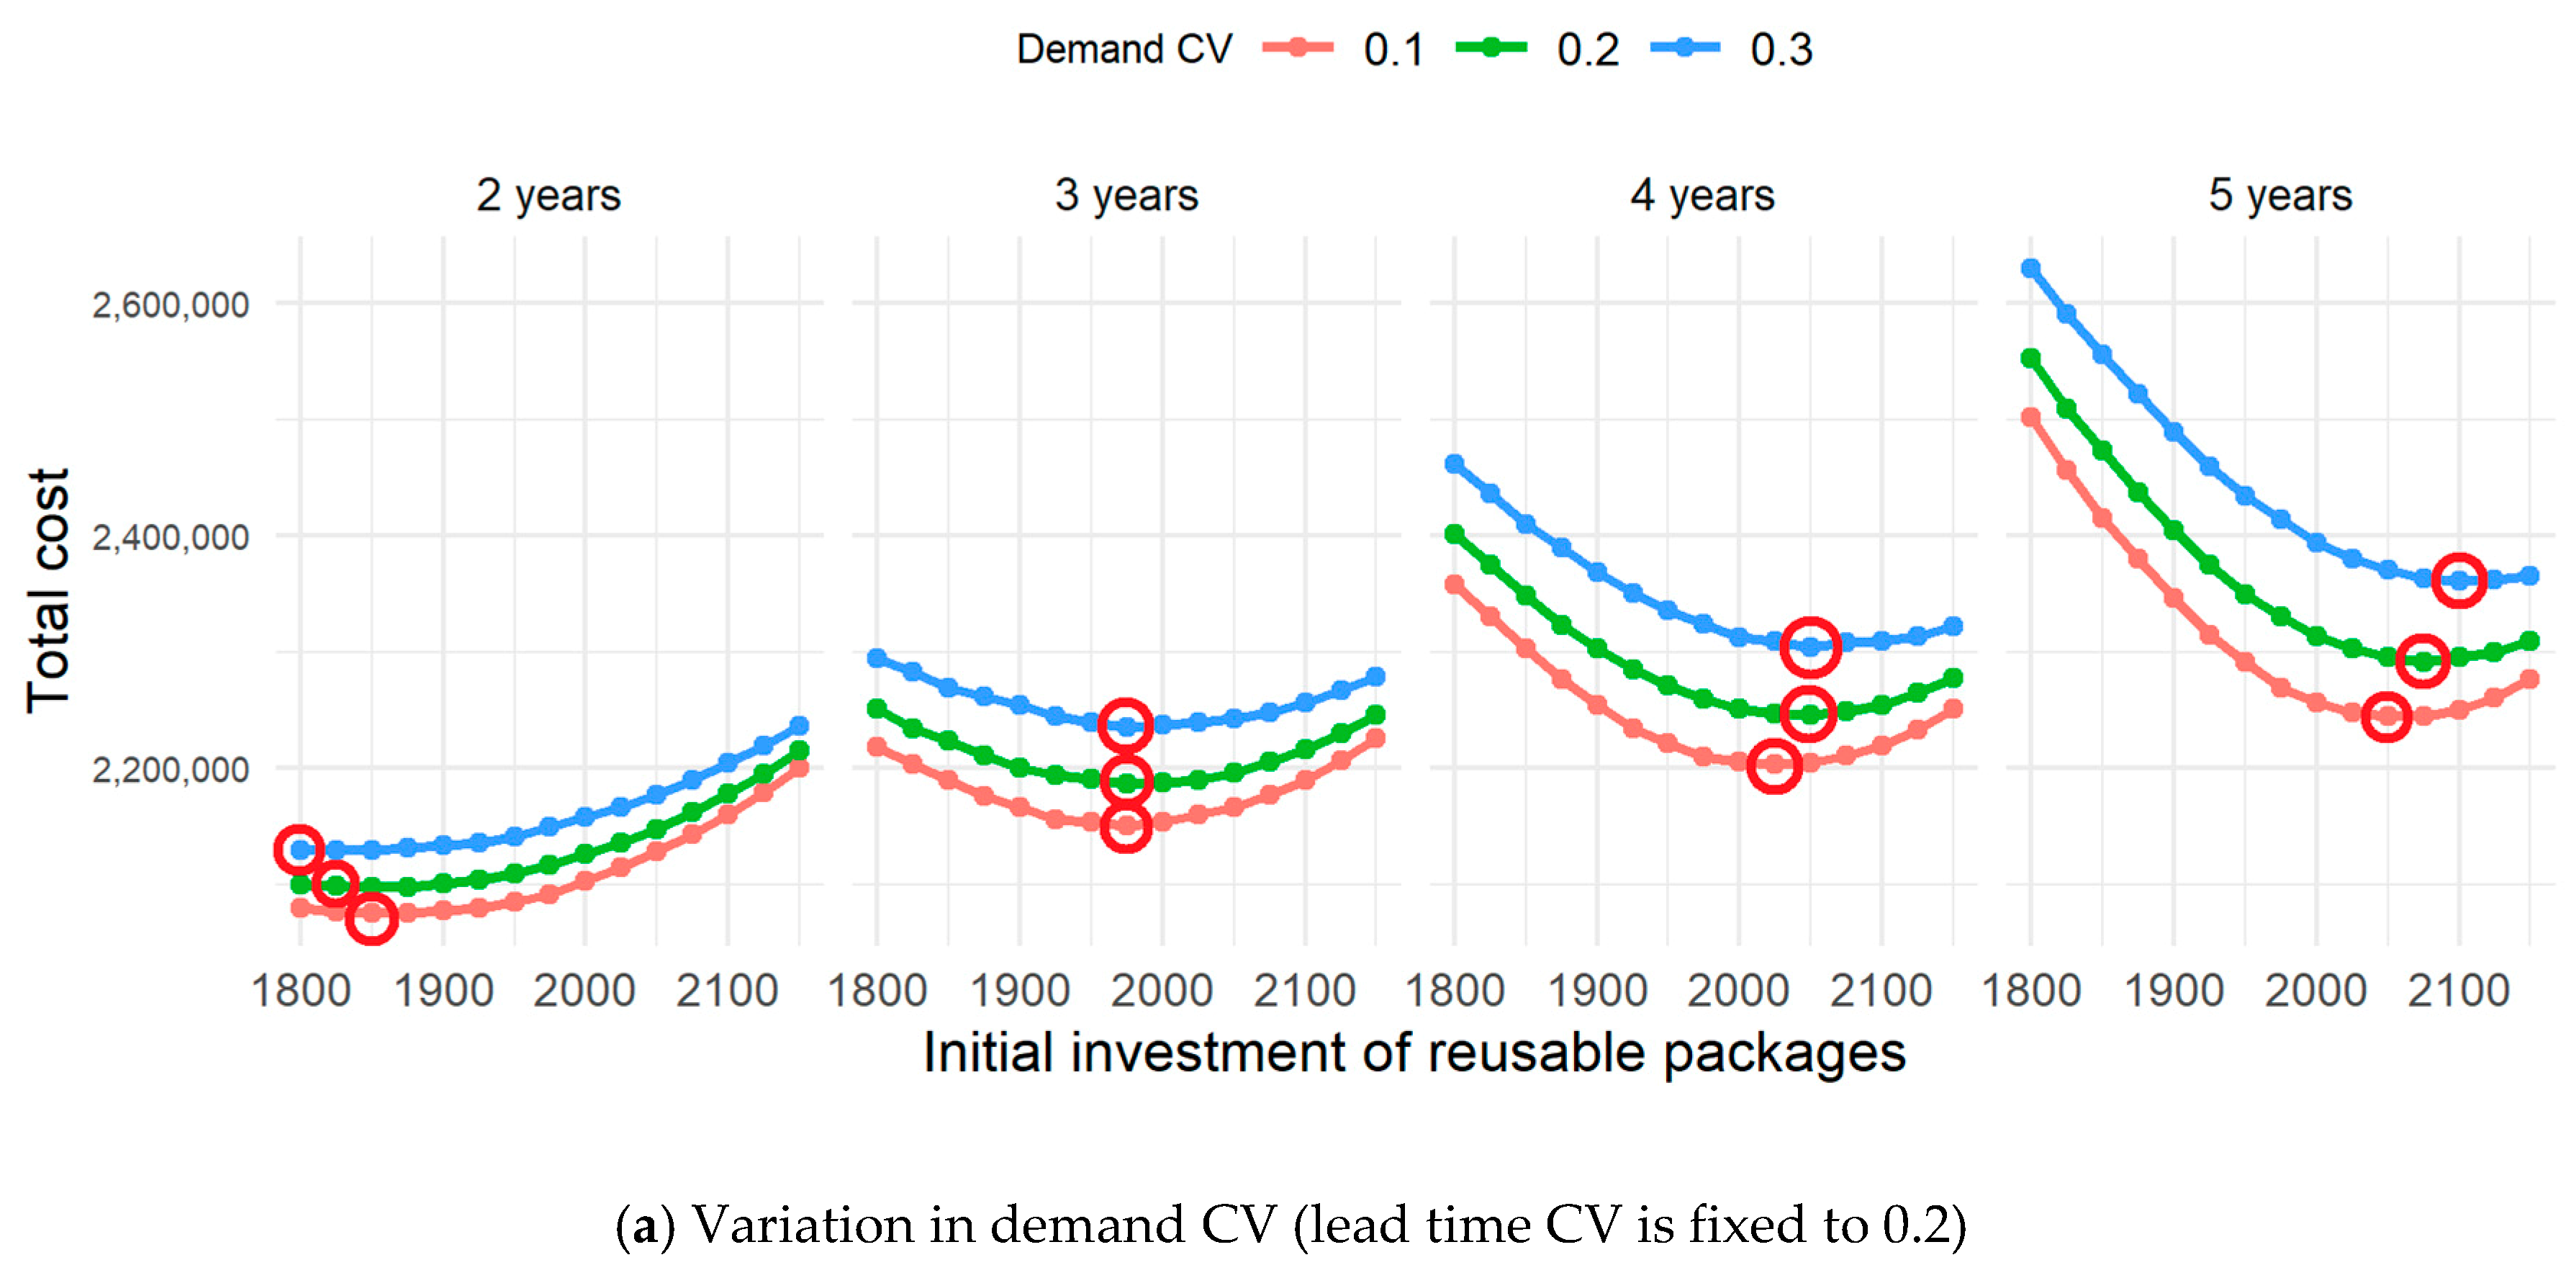
Figure 5). Statistical variations such as demand CV and lead time CV affect the decision in a similar way. For operation lengths more than or equal to three years, higher quantity of investment is desirable to deal with higher variation (Figure 4 and Figure 6). However, if operation length is short and uncertainty in lead time and demand is high, then it may be hard to justify introduction of reusable packages that incur substantial initial costs (Figure 6).
When empty containers are allocated efficiently, the right number of empty containers are placed in the right place at the right time. Under inefficient allocation, it has been discussed that more reusable containers need to be provided [12]. This is equivalent to having a relatively longer return cycle, which also requires more reusable containers to be provided [26]. Variations in demand and that in return lead time discussed in this study are analogous to the difficulty of efficient allocation. That is, more variation means less controllability and more required investment. These findings are aligned with findings of previous studies [12,26] and challenges that practitioners face in the operation of returnable packaging systems [12].
In a multivariate regression approach [26], the authors find increases in delivery distance or cycle time make returnable packages less efficient. This can be generalized by our results showing that more variability in lead time lowers the efficiency of RTI systems requiring a higher number of returnable packages or even preferring expendable packages instead. In terms of demand variability, the results are aligned with findings on US automotive manufacturing practices [10] showing that more reusable containers are required to cover peak periods due to high cycle variation.

6. Conclusions

To facilitate the introduction of reusable packaging, several measures can be taken. First, even in a dedicated mode, governments may encourage the assembler to subsidize the purchase of reusable packages. In this way, the risk of initial investment can be shared [29]. Second, in a multi-year contract between a supplier and an assembler, the payment schedule can be designed to promote reusable packaging. In particular, a substantial initial down payment is made and reduced periodic payments follow as the business relationship persists. Finally, a supplier may adopt a reusable packaging system with standardized containers that carry various products [12]. These standardized reusable containers can be used for delivery operations to multiple other receivers.
In discussing the trade-offs between returnable packaging and non-returnable packaging, a study [25] claims that return transport of empty containers take high costs, thus longer distance delivery should adopt non-returnable packaging. This study assumes 10 days for mean travel time, suited for domestic delivery; thus, the result is aligned. On the other hand, there are still quite a few materials that need to be delivered a further distance than 10 days’ travel. If return transportation costs are expensive in those cases, transportation and the packages themselves may need to evolve to justify the use of returnable packages. For example, reusable but foldable containers may make delivery costs for empty packages a lot lower than the original non-collapsible packages as shown in Figure 1.
Although this study considers two stochastic components to reflect practical aspects in the supply chain, there are still a few practical limitations. Future studies can discuss the following limitations and issues of RTI systems:
  • This study assumes the investment decision is made to minimize the total cost of delivery operations. However, the different parties involved in decision making may vary, i.e., owner and payer, and they may have different objectives on launching an RTI system.
  • This study assumes 10 days for the mean travel time. Though this time is a reasonable estimate for most domestic operations, there are still a few materials to be delivered over a further distance. In such inter-country delivery, an RTI system may lose its economic advantage since the single-use expendable package can still cover long miles.
  • This study does not explicitly assume damage and loss events. In reality, two types of damage or loss are possible. The first type is a small amount of damages or losses that occur during ordinary operations. This can be reflected by setting the individual price of a package to include the cost of such loss, similar to applying an insurance cost. The second type is a significant amount of damages or losses that may occur in extreme accidents during storage or travel. This low probability event can be regarded as an innate business risk; thus this type of concern may be dealt with in a future study with a different focus.
Reusable packages save operational costs and promote an environmentally-friendly supply chain by reducing usage of expendable items. Results of this study indicate that reusable packages are more promising if variability in delivery operation and demand are small and if long term business commitments can be made. In a dedicated mode where reusable packages are owned by the supplier, the supplier must assess the prospective of the contract with the particular assembler continuing into the future when considering initialization of an RTI system. In other CLSC studies outside of the automotive industry, the methods and conclusion of this study may be applicable. In particular, CLSC with dedicated RTI and high variability in both demand and lead time can be analyzed within our proposed framework.

Author Contributions

B.N. and W.J.L. designed the research and methodology; B.N. and M.K.S. developed the mathematical model and conducted experiments. M.K.S. analyzed the data; B.N. wrote the original draft; M.K.S. and W.J.L. reviewed and finalized the draft. This research project was conducted under the supervision of B.N.

Funding

No funding was provided for this research.

Conflicts of Interest

The authors declare no conflict of interest.

References

  1. Wells, P.; Seitz, M. Business models and closed-loop supply chains: A typology. Supply Chain Manag. Int. J. 2005, 10, 249–251. [Google Scholar] [CrossRef]
  2. Guide, V., Jr.; Van Wassenhove, L. OR FORUM—The evolution of closed-loop supply chain research. Oper. Res. 2009, 57, 8–10. [Google Scholar] [CrossRef]
  3. Srivastava, S.K. Green supply-chain management: A state-of-the-art literature review. Int. J. Manag. Rev. 2007, 9, 53–80. [Google Scholar] [CrossRef]
  4. Kumar, N.; Kumar, R. Closed loop supply chain management and reverse logistics—A literature review. Int. J. Eng. Res. Technol. 2013, 6, 455–468. [Google Scholar]
  5. Carrasco-Gallego, R.; Ponce-Cueto, E.; Dekker, R. A Framework for Closed-Loop Supply Chains of Reusable Articles; Econometric Institute Research Papers EI; Econometric Institute, University Rotterdam, Erasmus School of Economics (ESE): Rotterdam, The Netherlands, 2009. [Google Scholar]
  6. Turki, S.; Didukh, S.; Sauvey, C.; Rezg, N. Optimization and Analysis of a Manufacturing–Remanufacturing–Transport–Warehousing System within a Closed-Loop Supply Chain. Sustainability 2017, 9, 561. [Google Scholar] [CrossRef]
  7. Hellström, D.; Johansson, O. The impact of control strategies on the management of returnable transport items. Transp. Res. Part E: Logist. Transp. Rev. 2010, 46, 1128–1139. [Google Scholar] [CrossRef]
  8. Kim, T.; Glock, C.H.; Kwon, Y. A closed-loop supply chain for deteriorating products under stochastic container return times. Omega 2014, 43, 30–40. [Google Scholar] [CrossRef]
  9. Hariga, M.; Glock, C.H.; Kim, T. Integrated product and container inventory model for a single-vendor-single-buyer supply chain with owned and rented returnable transport items. Int. J. Prod. Res. 2016, 54, 1964–1979. [Google Scholar] [CrossRef]
  10. Zhang, Q.; Segerstedt, A.; Tsao, Y.-C.; Liu, B. Returnable packaging management in automotive parts logistics: Dedicated mode and shared mode. Int. J. Prod. Econ. 2015, 168, 234–244. [Google Scholar] [CrossRef]
  11. Vöröskői, K.; Böröcz, P. Framework for the packaging supply chain of an automotive engine company. Acta Tech. Jaur. 2016, 9, 191–203. [Google Scholar] [CrossRef]
  12. Twede, D.; Clarke, R. Supply Chain Issues in Reusable Packaging. J. Mark. Channels 2004, 12, 7–26. [Google Scholar] [CrossRef]
  13. Rosenau, W.; Twede, D.; Mazzeo, M.; Singh, S. Returnable/reusable logistical packaging: A capital budgeting investment decision framework. J. Bus. Logist. 1996, 17, 139. [Google Scholar]
  14. Kroon, L.; Vrijens, G. Returnable containers: An example of reverse logistics. Int. J. Phys. Distrib. Logist. Manag. 1995, 25, 56–68. [Google Scholar] [CrossRef]
  15. Goetschalckx, M.; Vidal, C.J.; Dogan, K. Modeling and design of global logistics systems: A review of integrated strategic and tactical models and design algorithms. Eur. J. Oper. Res. 2002, 143, 1–18. [Google Scholar] [CrossRef]
  16. Johansson, K. Packaging Logistics; Packforsk: Kista, Sweden, 1997. [Google Scholar]
  17. Gnoni, M.G.; De Felice, F.; Petrillo, A. A Multi-Criteria Approach to Strategic Evaluation of Environmental Sustainability in a Supply Chain. Int. J. Bus. Insights Transf. 2011, 3, 54–61. [Google Scholar]
  18. Hollos, D.; Blome, C.; Foerstl, K. Does sustainable supplier co-operation affect performance? Examining implications for the triple bottom line. Int. J. Prod. Res. 2012, 50, 2968–2986. [Google Scholar] [CrossRef]
  19. European Commission. Packaging and Packaging Waste. Available online: https://ec.europa.eu/environment/waste/packaging/legis.htm (accessed on 22 October 2019).
  20. Fleckenstein, T.; Pihlstroem, E. Returnable Packaging in the Automotive Supply Chain: From a Supplier’s Perspective. Master’s Thesis, Jönköping University, Jönköping, Sweden, 2015. [Google Scholar]
  21. Reusable Packaging Association. What is Reusable Packaging. Available online: https://reusables.org/what-is-reusable-packaging/ (accessed on 22 October 2019).
  22. Witt, C.E. Are reusable containers worth the cost? Mater. Hand. Manag. 2000, 55, 75–80. [Google Scholar]
  23. White, G.R.; Wang, X.; Li, D. Inter-organisational green packaging design: A case study of influencing factors and constraints in the automotive supply chain. Int. J. Prod. Res. 2015, 53, 6551–6566. [Google Scholar] [CrossRef]
  24. Soroka, W. Illustrated Glossary of Packaging Terminology; DEStech Publications, Inc.: Lancaster, PA, USA, 2008. [Google Scholar]
  25. Dominic, C.; Johansson, K.; Lorentzon, A.; Olsmats, C.; Tiliander, L.; Weström, P. Förpackningslogistik–2: A Utgåvan; Packforsk; Kista: Stockholm, Sweden, 2000; pp. 1–5. [Google Scholar]
  26. Closs, D.; Burgess, G.; Mollenkopf, D.; Twede, D.; Lee, S. Assessing the Viability of Reusable Packaging: A Relative Cost Approach. J. Bus. Logist. 2005, 26, 169–197. [Google Scholar]
  27. Pålsson, H.; Finnsgård, C.; Wänström, C. Selection of packaging systems in supply chains from a sustainability perspective—The case of Volvo. Packag. Technol. Sci. 2013, 26, 289–310. [Google Scholar] [CrossRef]
  28. Kelle, P.; Silver, E.A. Forecasting the returns of reusable containers. J. Oper. Manag. 1989, 8, 17–35. [Google Scholar] [CrossRef]
  29. Guo, D.; He, Y.; Wu, Y.; Xu, Q. Analysis of Supply Chain under Different Subsidy Policies of the Government. Sustainability 2016, 8, 1290. [Google Scholar] [CrossRef] [Green Version]
Figure 1. Examples of a returnable container and an expendable container.
Sustainability 11 06579 g001
Figure 2. Circulation of returnable packages.
Sustainability 11 06579 g002
Figure 3. Components for the total cost and optimal quantity (circled) of reusable package investment. The operation period is three years and the coefficients of variation (CV) for both lead time and demand are 20%.
Sustainability 11 06579 g003
Figure 4. The effect of randomness in demand and lead time on the optimal level of initial investment and the expected total cost.
Sustainability 11 06579 g004
Figure 5. Effect of length of operation (both CVs are fixed to 20%).
Sustainability 11 06579 g005
Figure 6. Optimal quantity and total cost under variations in demand CV and lead time CV.
Sustainability 11 06579 g006aSustainability 11 06579 g006b
Table 1. Variable descriptions.
VariableDescription
D t Demand for the packages on day t
I t Number of available returnable packages on day t
R t Number of returned packages on day t
L t Return time for the returnable packages that are sent out on day t
Q t r Number of returnable packages used on day t
Q t e Number of expendable packages used on day t
P r Unit price for a returnable package
P e Unit price for an expendable package
VTotal number of returnable packages
hDaily holding cost for a returnable package
Table 2. Identified quantities from the actual data.
NotationQuantityDescription
P r $1000Price of a returnable container
P e $40Price of an expendable container
H$0.09Holding cost for a returnable container per day
D t Normal distribution with a mean of 800 unitsDaily demand
R t Normal distribution with a mean of 10 daysReturn time of the packages

