Article

Evaluation of City Sustainability from the Perspective of Behavioral Guidance

1
School of Management, Shenyang Jianzhu University, Shenyang 110168, China
2
School of Business Administration, Northeastern University, Shenyang 110168, China
3
School of Economics and Management, Harbin Engineering University, Harbin 150001, China
*
Author to whom correspondence should be addressed.
Sustainability 2019, 11(23), 6808; https://doi.org/10.3390/su11236808
Submission received: 8 November 2019 / Revised: 27 November 2019 / Accepted: 28 November 2019 / Published: 30 November 2019

Abstract

:
High-quality evaluation of city sustainability is an important part of city policy making and development. In this paper, we evaluated the sustainability of the 14 cities in Liaoning, China, from 2015 to 2017. Based on the comprehensive consideration of the interactions among the social, economic and environmental systems, the traditional evaluation indicator system is refined. We incorporate the attitude of decision makers into the evaluation model and propose an objective weighting method by considering data distribution to objectively guide the cities to develop towards the established goals. The empirical research results show that cities located in eastern Liaoning performed the best and in western Liaoning performed the worst. The performances of the 14 cities in Liaoning were not perfect. Both the evaluation values and growth rates of 7 cities (accounting for 50.00%) were lower than the overall average level. The evaluation values of the three systems of the 14 cities were not balanced. The evaluation values of the social, economic and environmental systems fluctuated within the range of [0.0159, 0.0346], [0.0151, 0.0677] and [0.0123, 0.0483], respectively. The social and economic systems of most cities supplied more for the environmental system than for the other system. Cities with higher environmental base rankings offered less supply to other systems. At the same time, we also provide some individualized and concrete suggestions for the guidance of city sustainable development. By comparing the empirical data with the reality, it confirms the credibility of the method and the recommendations in this paper.

1. Introduction

The emergence of cities is a sign of human maturity and civilization, as well as an advanced form of human social life. Urbanization has become a global trend with the development of social productivity, the advancement of science and technology, and the adjustment of the industrial structure. In fact, urbanization has both positive and negative effects on cities’ social, economic and environmental systems. Therefore, city sustainability is an important part of urbanization.
Related research is gaining increasing attention and prevalence worldwide [1,2,3,4,5,6,7,8,9,10,11,12,13,14,15,16,17,18], such as work on the sustainable city [1,2], smart city [3,4,5] and smart sustainable city [7,8,9]. Bibri et al. argue that sustainable cities can be defined as a city environment designed with the aim of contributing to improved environmental quality, social equity and well–being over the longrun [1]. Chourabi et al. define a smart city as a city that strives to become more efficient, livable, equitable and sustainable [3]. Although there are many works of research literature on the smart city, the European Smart Cities Ranking developed by Giffinger et al. is widely used [5]. According to D’Auria [6], both concepts of sustainable city and smart city cannot be thought of as contrasting because they share many commonalities. The attention focused on social, economic and environmental issues has framed the debate over sustainability and converged in both concepts. The smart sustainable city is a new techno–urban phenomenon that was widely used in the mid-2010s [7]. It is rapidly gaining momentum as a holistic approach to city development and academic pursuit, especially in ecologically and technologically advanced societies [8,9].
Furthermore, sustainability evaluation is an essential part of city sustainability research, because the evaluation can support the next sustainable development policy while monitoring the status of the objects [10,11,12,13,14,15,16,17,18]. Yi et al. develop the deviation maximization weighting method to observe the sustainable levels of 17 cities in Shandong Province, China [11]. Several studies on city sustainability evaluation can be found, and the related literature can be grouped into three categories, i.e., evaluation indicators selection [19,20,21,22,23,24,25,26,27,28], indicators’ weights setting [29,30,31,32,33,34,35,36,37,38,39,40,41,42,43] and information aggregation [44,45,46,47,48,49,50,51,52]. A detailed review of the related work is shown in Section 2. Prior studies have made significant contributions to city sustainability. However, existing studies have not considered the interaction among different systems in the construction of evaluation indicators. At the same time, the thoughts of the evaluator on behavioral guidance are not introduced in the objective weighting methods. In this paper, we try to find corresponding solutions based on the above problems.
We focus on the evaluation of city sustainability in Liaoning Province from the perspective of behavioral guidance. There are two main research goals of our research. On the one hand, through the evaluation, each city evaluation stakeholder can comprehend the sustainable development level of their city from multiple perspectives, such as the dimension of systems’ sustainability, the sub-dimension of the system base, and its supply to other systems. Simultaneously, it is convenient to compare with other cities or their evaluation values in different years. On the other hand, the idea of behavioral guidance is integrated into the evaluation model, which aims to objectively guide cities to develop towards the goals established.
The rest of this paper is organized as follows. Section 2 provides an overview of the related work on city sustainability evaluation. Section 3 constructs the evaluation indicator system for city sustainability, which considers the base of each system and its interaction with other systems, that is, it refines the traditional evaluation indicator system. Section 4 proposes an evaluation method with behavioral guidance. An objective weighting method with behavioral guidance is proposed by considering the data distribution. Section 5 conducts an empirical study on the sustainable level of 14 cities in Liaoning Province. In Section 6, conclusions and suggestions are outlined.

2. Related Work on City Sustainability Evaluation

The research on city sustainability evaluation can be mainly divided into three categories, namely, evaluation indicators selection, indicators’ weights setting and information aggregation.
For city sustainability evaluation, the selection of sustainable indicators is a key factor influencing the conclusions of the evaluation. The three-pole or three-pillar model that combines social system, economic system, and environment system together are widely used because of its concise and comprehensive features [19,20,21,22,23]. Ding et al. indicate that the sustainable development of the city is a harmonious and comprehensive development of the three elements [24]. Among them, environmental sustainable development is the foundation, economic sustainable development is the guarantee, and social sustainable development is the ultimate goal. Sun et al. use social, economic and natural indicators to monitor the sustainable development of cities and applied it to data from 2000 to 2010 for 277 Chinese cities, including megalopolises, large cities, small cities and medium-sized cities [25]. Because the data acquisition channels are different, there will be some differences in the evaluation indicators of different countries and cities [26,27,28].
The determination of the indicators’ weights is also an important part of the rationality of city sustainability evaluation. The weighting method can be divided into three categories: subjective weighting method [29,30,31,32], objective weighting method [33,34,35,36] and combined weighting method [37,38,39]. The subjective weighting method, such as the Delphi method [40], analytic hierarchy process (AHP) method [41], etc., reflects the subjective judgment and intuition of the evaluator. However in these methods the objectivity and reproducibility of the evaluation result are relatively poor. The objective weighting method, such as the entropy method [42], deviation maximization method [43], etc., uses relatively perfect mathematical theories and methods, but does not consider the subjective information of the evaluator. In order to simultaneously embody the advantages of the two kinds of methods mentioned above, the combination weighting method has been proposed and widely applied.
The information aggregation method in multi-criteria decision making (MCDM) can be widely used to aggregate the evaluation indicator values and the indicator weights together, so as to obtain the corresponding sustainable performances of cities. There are many methods to aggregate information, among which simple additive weighting (SAW) [44] is commonly used. Other aggregation methods are used in city sustainability evaluation as well, such as the weighted geometric average (WGA) method [45], the order preference by similarity to ideal situation (TOPSIS) method [46,47,48] and others [49,50,51,52]. Different methods embodies different evaluation purposes, such as highlighting the advantage indicator, highlighting the disadvantage indicator, reflecting the distance between the indicator and the optimal or worst indicator, etc.
The existing studies have made significant contributions to city sustainability evaluation. In line with the previous studies, we also use the WGA method for information aggregation. However, considering the interaction of social, economic and natural systems, we refine the traditional evaluation indicators system to improve the quality of evaluation. In addition, a new weight method is proposed from the perspective of behavioral guidance, which can match the real problems better.

3. Design of Evaluation Indicator System

Based on the evaluation indicator system construction framework, we can design an evaluation indicator system to measure the sustainable level of cities from the perspective of measuring city sustainability.

3.1. Framework of the Evaluation Indicator System

Due to the interaction of the social, economic and environmental systems of the city, the sustainability of the three systems should be considered when measuring the city sustainability. It can be seen from Figure 1 that the dotted frame contains three interacting systems, namely social system, economic system and environmental system. The corresponding interactions are as follows. The economic system provides corresponding funds and technologies for the sustainability of the social system, while the social system provides the necessary knowledge and services for the economic system. In order to achieve the sustainability of the economic system, it is necessary to obtain the corresponding resources and natural environment from the environmental system. However, the pollutants produced by the economic system have an adverse impact on the environmental system. Therefore, it is necessary to invest the funds into the environmental system to improve its state. The environmental system provides the resources and natural environment for the social system. At the same time, the environmental services provided by the social system promote the sustainability of the environmental system, but the pollutants produced by the social system enter the environmental system.
Therefore, there is no clear boundary between the three systems of the city, and it is difficult to quantify it in practical application research. In order to avoid the impact of this situation on the evaluation results, this paper takes the sustainability of each system as the starting point, comprehensively considers the supply situation of each system to the other systems in the dotted frame, and establishes the framework of evaluation indicator system for city sustainability as shown in Figure 1. By constructing this interactive evaluation indicator system framework, the evaluated objects of each city can realize that the evaluation value of each system is related not only to the basic operational level but also the contributions made to the other systems. For example, the sustainability of city social system can be decomposed into three aspects: social base, society supply to economy and society supply to environment. The social base refers to the operational state of the social system. The society supply to economy refers to the knowledge and services provided by the social system for the economic system. The society supply to environment refers to the services and pollutants that the social system exports to the environmental system. It can be seen that the sustainable level of a social system is not only related to the basic state of the system, but also related to the supply to the economic and environmental system.

3.2. Selection of Evaluation Indicators

Based on the above indicator framework, we selected 21 evaluation indicators by consulting recent policy documents issued by China and relevant references on city sustainability evaluation, as shown in Table 1. The following content is the reasons for selecting these evaluation indicators.
(1) Social system sustainability
The evaluation indicators of social base refer to human living conditions. C 1 refers to the ratio of the natural population increase to the average population during the determined period. For most cities, the larger the population, the more attractive the city is. C 2 is an important indicator to measure the state of a learning society. The development of C 2 is conducive to the social system to adapt to the trend of the knowledge age. C 3 is a reference indicator for judging the development level of medical care in the social system.
The knowledge and services provided by the society to economy are mainly created by the workers of the social system, and then pass to the economic system, which bring certain economic profits. C 4 refers to the proportion of full time research and experimental development personnel to the total population. The growing number of scientific and technological talents in the social system is of great benefit to the economic system that is increasingly driven by innovation. The reason for choosing C 5 is that employees can obtain wages or other forms of labor remuneration by providing knowledge and services in the social system. The incomes can promote the sustainability of the economic system to a certain extent.
Services and pollutants created by individuals or businesses from the social system will have a positive and negative impact on the environmental system, respectively. The larger the value of C 6 , the more serious the pollution to the environment. The basic reason for the shortage of city water resources is that the social system cycle of water exceeds the carrying capacity of the environmental system. C 7 refers to the special vehicles and equipment used for environmental sanitation operations or monitoring. The improvement of city sanitation in the social system can provide better services for the city’s appearance in the environmental system.
(2) Economic system sustainability
The evaluation indicators of the economic base are mainly composed of economic accounting, foreign trade and finance. C 8 is an effective tool to control the operation of the economic system and an important indicator for economic accounting. C 9 equals the sum of imports and exports goods in proportion to the permanent population. It can reflect the total scale of a city in terms of foreign trade. C 10 refers to the amount of deposits and loans from financial institutions at the end of the year.
The various funds, provided by the economic system, can bring certain benefits to the social system. C 11 reflects the residents’ happiness of the social system and the value created by the employed personnel while embodying the status of the economic system. C 12 refers to the per capital expenditures of the entire society for the basic research, applied research and experimental development during the statistical year. The improvement of this indicator can promote the upgrading of traditional industries in social systems and the development of strategic emerging industries.
Funds and pollutants output by the economic system are indicators that change the state of the environmental system. C 13 is the ratio of energy saving and environmental protection financial expenditure to local general public budget expenditure. C 14 is calculated by the ratio of the fixed assets investment in the environmental and facilities management industry to the total investment in the environment and facilities management industry. C 13 and C 14 are used to reflect the efforts of the local government on environmental protection and environmental management.
(3) Environmental system sustainability
The evaluation indicators of the environmental base are composed of natural elements such as air, land and water environment. C 15 is based on the environmental air quality standards and the impact of various pollutants on human health, ecology and nature. It simplifies the concentration of several air pollutants monitored routinely into a single conceptual index form. C 16 includes public green space, residential green space, affiliated green space, protective green space, production green space, road green space and scenic forest land area. C 17 is an important indicator reflecting water resource in the cities.
The supply of environment to society refers to the use of resources and natural environment exported by the environmental system to change the benefits of the social system. C 18 is calculated by dust emissions divided by city area and C 19 equals industrial exhaust emissions divided by city area. These two indicators are provided by the environmental system, which indirectly affects the sustainable development of the social system.
The supply of environment to the economy refers to the use of resources and natural environment exported by the environmental system to change the profit indicators of the economic system. C 20 equals dust emissions divided by regional GDP and C 21 equals industrial exhaust emissions divided by regional GDP. These two indicators are provided by the environmental system, which indirectly affects the sustainable development of the social system. Moreover, they are the key indicators that indirectly promote the profits of the economic system.
It should be noted that there are two reasons why some indicators are not included in the evaluation indicator table. On the one hand, the climatic conditions and natural resource stocks of some cities are different and cannot be changed, such as non-renewable energy (oil, natural gas, coal storage), sudden environmental events, natural disasters. Therefore, these relevant indicators are not selected. On the other hand, some evaluation indicators are excluded because their optimal range cannot be quantified accurately. For example, the higher electricity consumption does not necessarily mean that the economy system is better, perhaps because there is no electricity saving. The smaller consumption does not necessarily mean that the city is saving electricity. Perhaps the city has fewer start-up projects, that is why the demand for electricity is small.

4. Evaluation Method

Without loss of generality, let x i j ( i = 1 , 2 , , n ; j = 1 , 2 , , m ) denote the actual performance value of alternative o i on indicator u j and w j represent the weight of indicator u j . The value of x i j can be obtained by consulting the statistical yearbook and the website of the Statistics Bureau. However, it is necessary to preprocess x i j in order to improve the comparability of the indicators and the evaluation results. On this basis, we can set the weight w j with behavioral guidance effect by analyzing the distribution of the preprocessed x i j .

4.1. Preprocess Data

The indicator values in Table 1 may be negative, such as the population growth rate indicator and the per capita wastewater discharge indicator, so the negative indicator needs to be first converted into a positive indicator. Let x i j denote the positive indicator value, then
x i j = { x i j , x i j 0 ( x i j x j ) / ( x i j + x j ) , x i j < 0
where x j + is the upper limit value of u j and x j is the lower limit value of u j . Usually, we assume x j + = 2 and x j = 2 . Because of the inconsistent property of the indicators in Table 1, we transform cost-type indicators into benefit indicators. Suppose x i j ± is the indicator value of unified property, then
x i j ± = { x i j , i f   u j   i s   a   b e n e f i t   i n d i c a t o r 1 / x i j , i f   u j   i s   a   c o s t   i n d i c a t o r
We can then use the normalization method to range the indicator value in an unit scale, [ 0 , 1 ] , such that
x i j o = x i j ± / i = 1 n x i j ±
where x i j o is the preprocessed indicator value. In this way, the larger the value of the indicator, the better it will be, which is convenient for the comparison of the evaluation values of the cities.

4.2. Data Distribution Analysis

We can explore the overall operational status of u j by analyzing the value distribution of each o i with respect to u j . Skewness coefficient is an important statistic variable to measure the asymmetry of data distribution. It was first proposed by statistician Karl Pearson in 1895. Suppose s k j represents the skewness coefficient of u j , then
s k j = n ( n 1 ) ( n 2 ) i = 1 n ( x i j o x ¯ j s j )
where x ¯ j o = i = 1 n x i j o / n and s j = i = 1 n ( x i j o x ¯ j o ) 2 / ( n 1 ) . The skewness coefficient can be explained as follows:
When s k j = 0 , the data distribution of the indicator u j is symmetrical. It indicates that the data distribution of each evaluated object with respect to u j is balanced. If s k j 0 , it means the distribution is asymmetrical. If s k j > 1 or s k j < 1 , it is considered as a severe skewed distribution. That is, the value of the u j is very uneven and a few alternatives develop very well or very poorly. If 0.5 s k j 1 or 1 s k j 0.5 , it is considered as a moderately skewed distribution. The closer s k j is to 0, the lower the degree of skew. In addition, s k j < 0 and s k j > 0 represent negative skewness and positive skewness, respectively. The x ¯ j o of the negative skewness distribution is less than the median, the probability of data with larger values is higher than that with smaller values. The x ¯ j o of the positive skewness distribution is less than the median, the probability of data with smaller values is higher than that with larger values.

4.3. Determination of Behavioral Guidance Weight

We use y i to represent the sustainable evaluation value of the alternative o i , such that y i = j = 1 m w j x i j o . It can be seen that the value of y i is determined by w j and x i j o . In order to guarantee the fairness of the evaluation, w j is generally given by the evaluator. x i j o can be improved by the efforts of alternative o i . Under normal circumstances, alternative o i will choose the indicator corresponding to the larger w j when the effort of o i is constant. Therefore, we can guide the behavior of o i by adjusting w j .
For example, for most cities, if a certain indicator has a large value, it means that the indicator is easier to upgrade. Therefore, cities with small values of this indicator should focus on improvement. We should give this indicator a larger weight value in order to guide the low-scoring cities to raise this indicator and the high-scoring cities to maintain this indicator. In contrast, if the overall value of a certain indicator in the system is relatively small, it indicates that it is harder to upgrade. In order to promote the overall improvement of the indicator, encourage high-scoring cities to create differences and low-cost cities to continue their efforts, we should also increase the weight of the indicator. In the above two cases, it can be found that the differences are relatively large when comparing the single indicator skewness coefficient with the average skewness coefficient of all indicators. Under normal circumstances, when the indicator value is close to the normal distribution, its weight is relatively small. That is, when the indicator distribution is normally distributed, the indicator operation is relatively stable. From the perspective of behavioral guidance, the need for improvement is relatively small. At this time, the difference is relatively small when comparing the single indicator skewness coefficient with the average skewness coefficient of all indicators.
Therefore we can use the following formula to calculate the behavioral guidance weight, such that
w j = α θ | s k j j = η η + s k j / ( η + η + 1 ) |
where η is the initial number of the system and η + is the end number of the system. For example, when the system is a social system, η = 1 and η + = 7 . Similarly, economic system corresponds to η = 8 and η + = 14 , environmental system corresponds to η = 15 and η + = 21 . α θ is the adjustment coefficient of the system and the calculating method of it will be introduced later. When θ = 1 , θ = 2 , θ = 3 , the systems are the social system, economic system, environmental system respectively. Considering that the data distribution skewness of different systems may be different, we set three system adjustment factors.
In order to achieve city sustainability, the weights j = η j = η + w j of the three systems of society, economy and environment should be the same, that is
j = η j = η + w j = j = η j = η + α θ | s k j j = η η + s k j / ( η + η + 1 ) | = 1 3 j = 1 j = m w j
where j = 1 j = m w j = 1 . So we can solve the value of the adjustment coefficient mentioned above, such that
α θ = 1 3 j = η j = η + | s k j j = η η + s k j / ( η + η + 1 ) |
Through the behavioral guidance weighting, each system has the same total weight. Within the same system, there is a certain difference in indicator weights according to the development status of the indicator.

5. A City Sustainability Evaluation Study

5.1. Study Area

Liaoning Province is a provincial administrative region of China. It is located in the northeast of China, with a boundary between 38°43′ and 43°26′ north latitude and 118°53′ to 125°46′ east longitude. Liaoning Province is the only coastal province in northeast China. It has a number of strategic industries that are related to the lifeline of the national economy and national security. As an old industrial province, Liaoning Province once had the best infrastructure in China and a large amount of investment in the era of the planned economy. However, the plight of Liaoning Province has indeed been more obvious in recent years. With the development of China, Liaoning Province has gradually changed from a former population inflow place to an outflow place. In 2016 and 2017, the natural population growth rates were − 0.18‰ and − 0.44‰, respectively. In 2016, among the growth rates of China’s 31 provinces, only Liaoning Province experienced negative growth. Therefore, sustainable development is an important direction for the current transformation of Liaoning Province. It is necessary to conduct sustainable evaluation and suggestion guidance in Liaoning Province. Liaoning Province has 14 prefecture-level cities, Shenyang is the provincial capital. The brief introductions of these 14 cities are shown in Table 2.

5.2. Evaluation Process

We collected the initial data x i j associated with indicators listed in Table 1 from the Liaoning Province Statistical Yearbook (2016–2018) and China City Statistical Yearbook (2016–2018). It should be noted that there are some missing data in other years corresponding to the indicators in Table 1, so we only conduct empirical research on the data for the three years from 2015 to 2017. In addition, the data of C 15 is obtained from the China air quality online testing and analysis website since it is not involved in the statistical yearbook. By Equations (1)–(3), the preprocessed indicator value x i j o is calculated, respectively. Based on x i j o , the skewness coefficient is calculated by Equation (4). We then obtain the behavioral guidance weight w j by Equations (5)–(7), shown in Table 3.
The relationship between indicators’ weights of different years is shown in Figure 2. There is a slight change in the position of the same color point in the figure, but the overall change is not large. The colored point represents the X and Y axes of an indicator in different years. Furthermore, we use the weights of each year as a sample to calculate the correlation coefficient between the weights in different years. The correlation coefficients of indicator weights for 2015 and 2016, 2016 and 2017, 2015 and 2017 are 0.7860, 0.7676 and 0.5797, respectively. It can be found that the correlation coefficients of the adjacent years are larger (the scatter plots for 2015 and 2016, 2016 and 2017 are more concentrated as shown in Figure 2), and the correlation coefficient between the years with longer intervals is smaller (the weighted scatter plots for 2015 and 2017 are more discrete in Figure 2). This is consistent with the idea of government behavior guiding policy making in reality; that is, the focus of work will gradually change over time, but the overall level must maintain a certain degree of correlation, and the longer the interval, the less relevant.

5.3. Results and Findings

We obtained the sustainability performances of the 14 prefecture-level cities in Liaoning Province (2015–2017) by using y i = j = 1 m w j x i j o , where x i j o and w j have been calculated above, as shown in Table 4. The average evaluation value was obtained by y ¯ i = ( y i ( 2015 ) + y i ( 2016 ) + y i ( 2017 ) ) / 3 ; The growth rate was calculated by y ˜ i = 100 % ( y i ( 2017 ) y i ( 2015 ) ) / 3 . Further, Figure 3 shows the change in the sustainability values of the cities in different years.
Form Table 4 and Figure 2, the following conclusions can be drawn:
(1) The top three cities were Dalian, Benxi and Panjin with average sustainability evaluation values of 0.1269, 0.1056 and 0.0621, respectively. While the last three were Fuxin, Jinzhou and Liaoyang with evaluation values of 0.0500, 0.0514 and 0.0539, respectively.
(2) The cities with stable scores in the past three years were Jinzhou, Liaoyang and Benxi. The differences between their maximum and minimum evaluation values were 0.0007, 0.0015 and 0.0019, respectively. The cities whose scores changed greatly were Anshan, Tieling and Chaoyang, and the corresponding differences were 0.0312, 0.0302 and 0.0165, respectively. The three cities Dalian, Benxi and Huludao ranked steadily and remained first, second and eighth from 2015 to 2017, respectively.
(3) The city in the rising ranking was Anshan, and the city in the declining ranking was Tieling. The cities with continuously rising evaluation values were Shenyang, Anshan and Dandong. By contrast, the cities that continue to decline were Fushun, Fuxin, Liaoyang, Tieling and Huludao. Generally speaking, the number of cities with dynamically declining evaluation values was more than that with dynamically increasing values.
(4) The average evaluation values of eastern, southern, western and northern Liaoning were 0.0888, 0.0771, 0.0624 and 0.0674, respectively. The cities in eastern Liaoning had the highest sustainability level, followed by southern Liaoning, northern Liaoning, and western Liaoning.
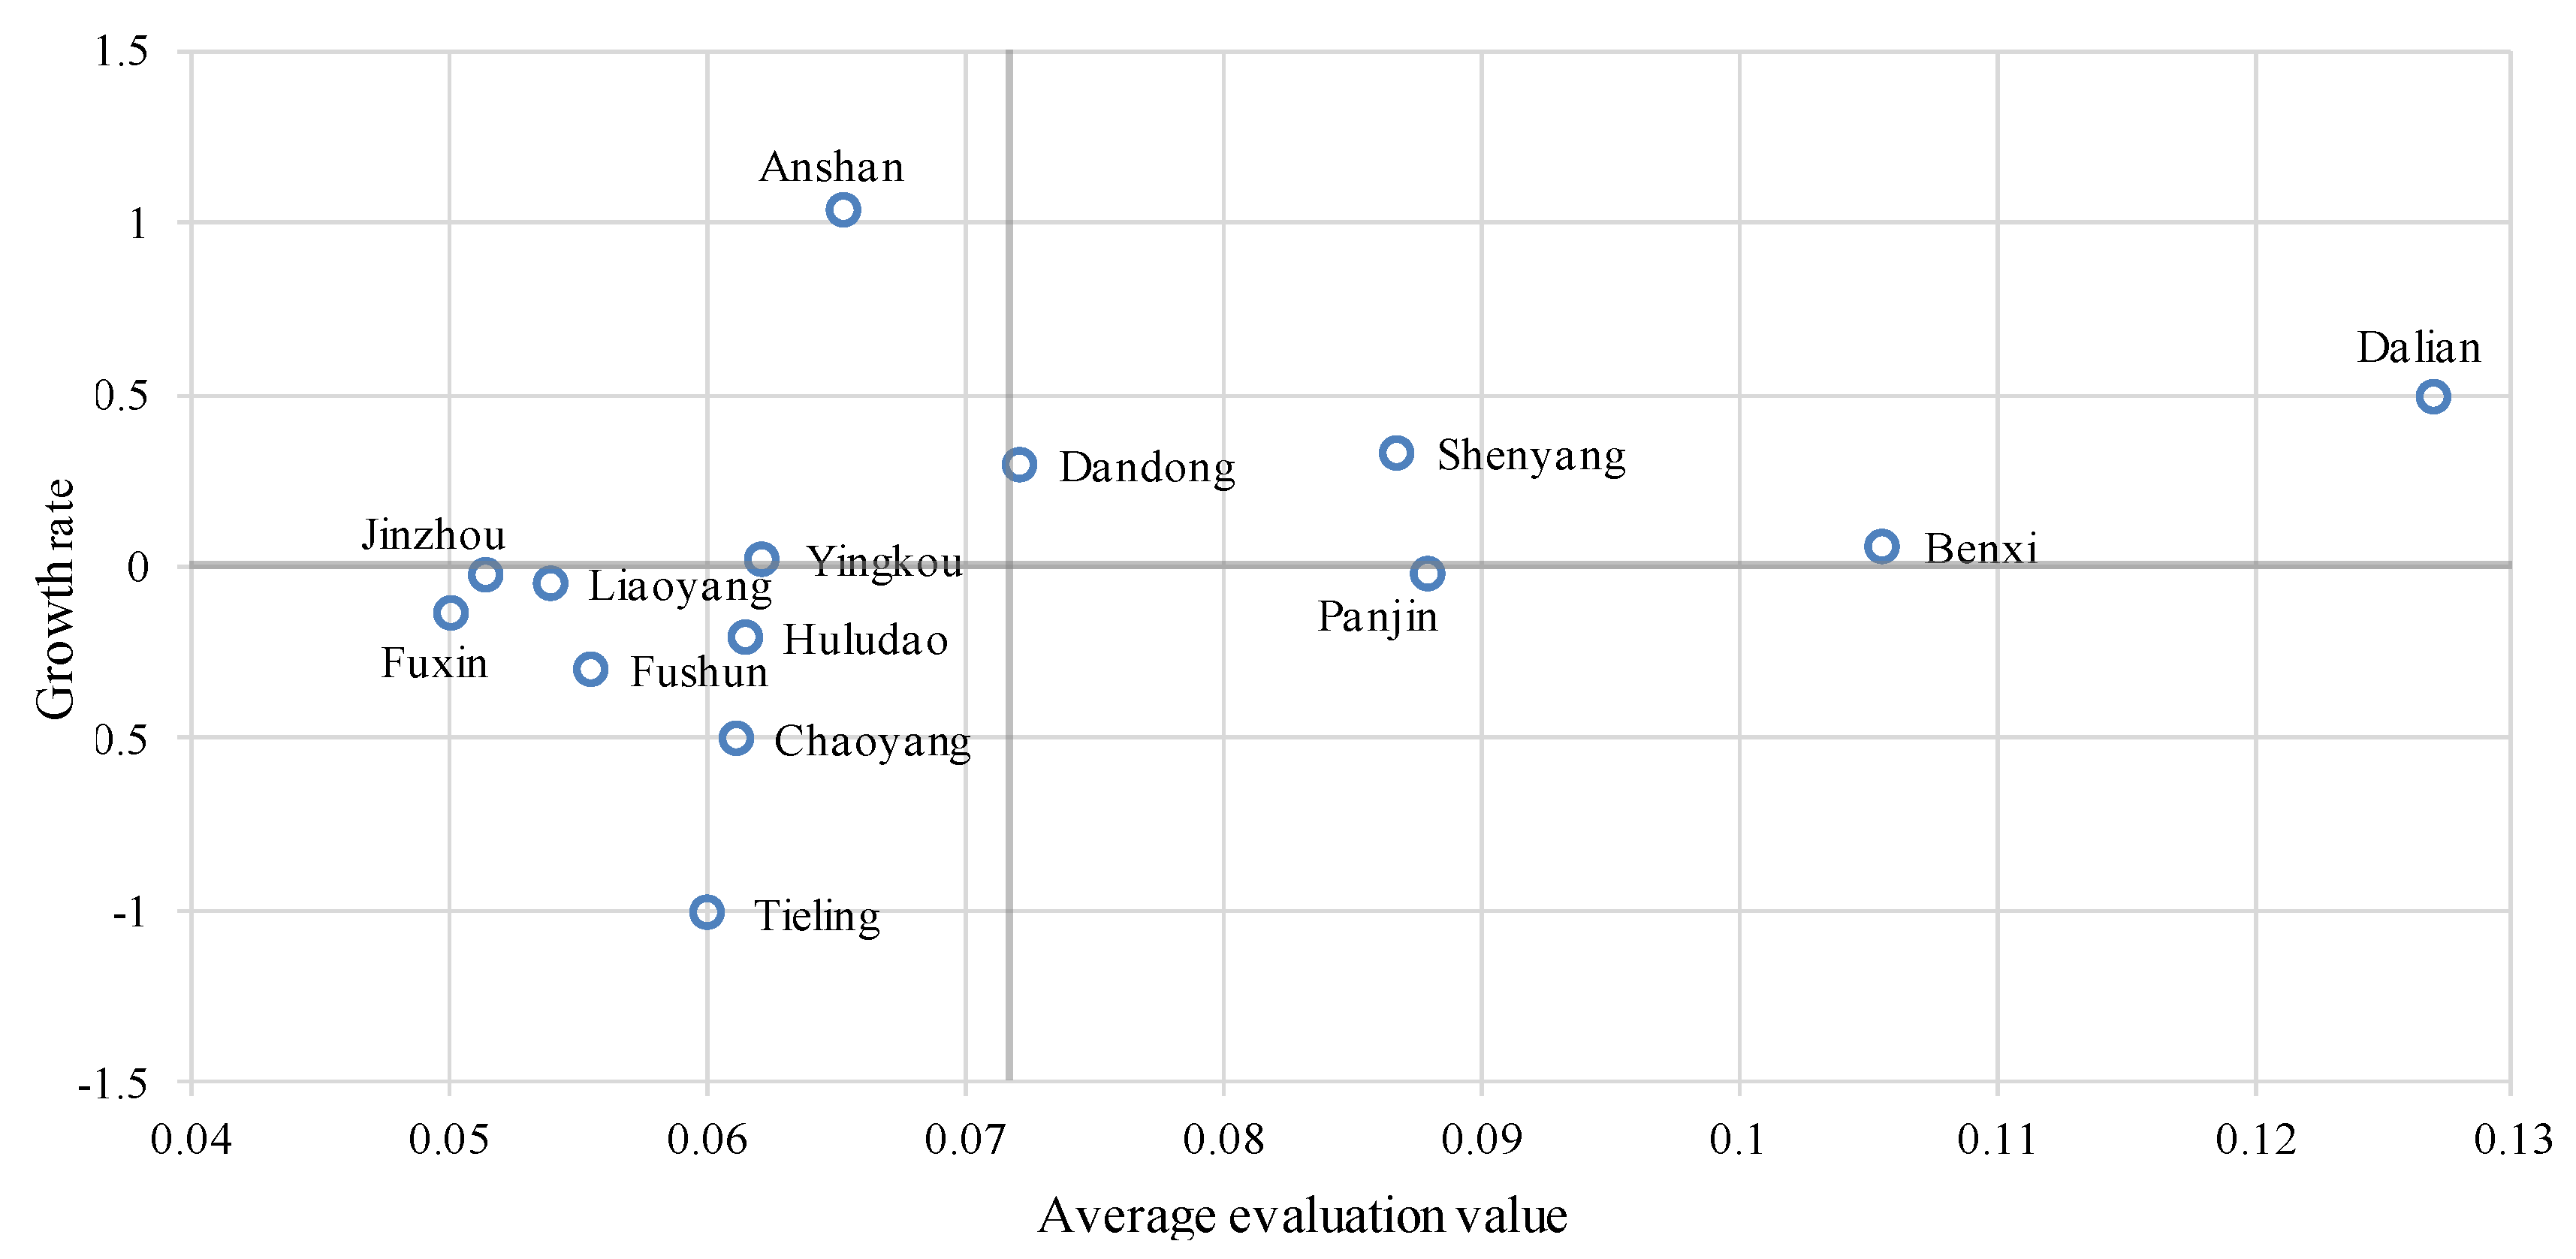
With the data shown in Table 4, we can compare the 14 cities by average evaluation values and growth rates, as shown in Figure 4. Let y ¯ = i = 1 14 y ¯ i / 14 = 0.0714 denote the overall average evaluation value and y ˜ = i = 1 14 y ˜ i / 14 = 0 represent the overall average growth rate. We can find that 50% of the cities had low average evaluation values and negative growth rates, such as Tieling, Chaoyang, Fushun, Huludao, Fuxin, Liaoyang and Jinzhou. The evaluation values and the growth rates of Dalian, Shenyang, Dandong and Benxi (accounting for 28.57%) were higher than the overall average level. Only Panjin had a higher average score but showed negative growth. Anshan and Yingkou had higher growth rates, but their evaluation values were lower.
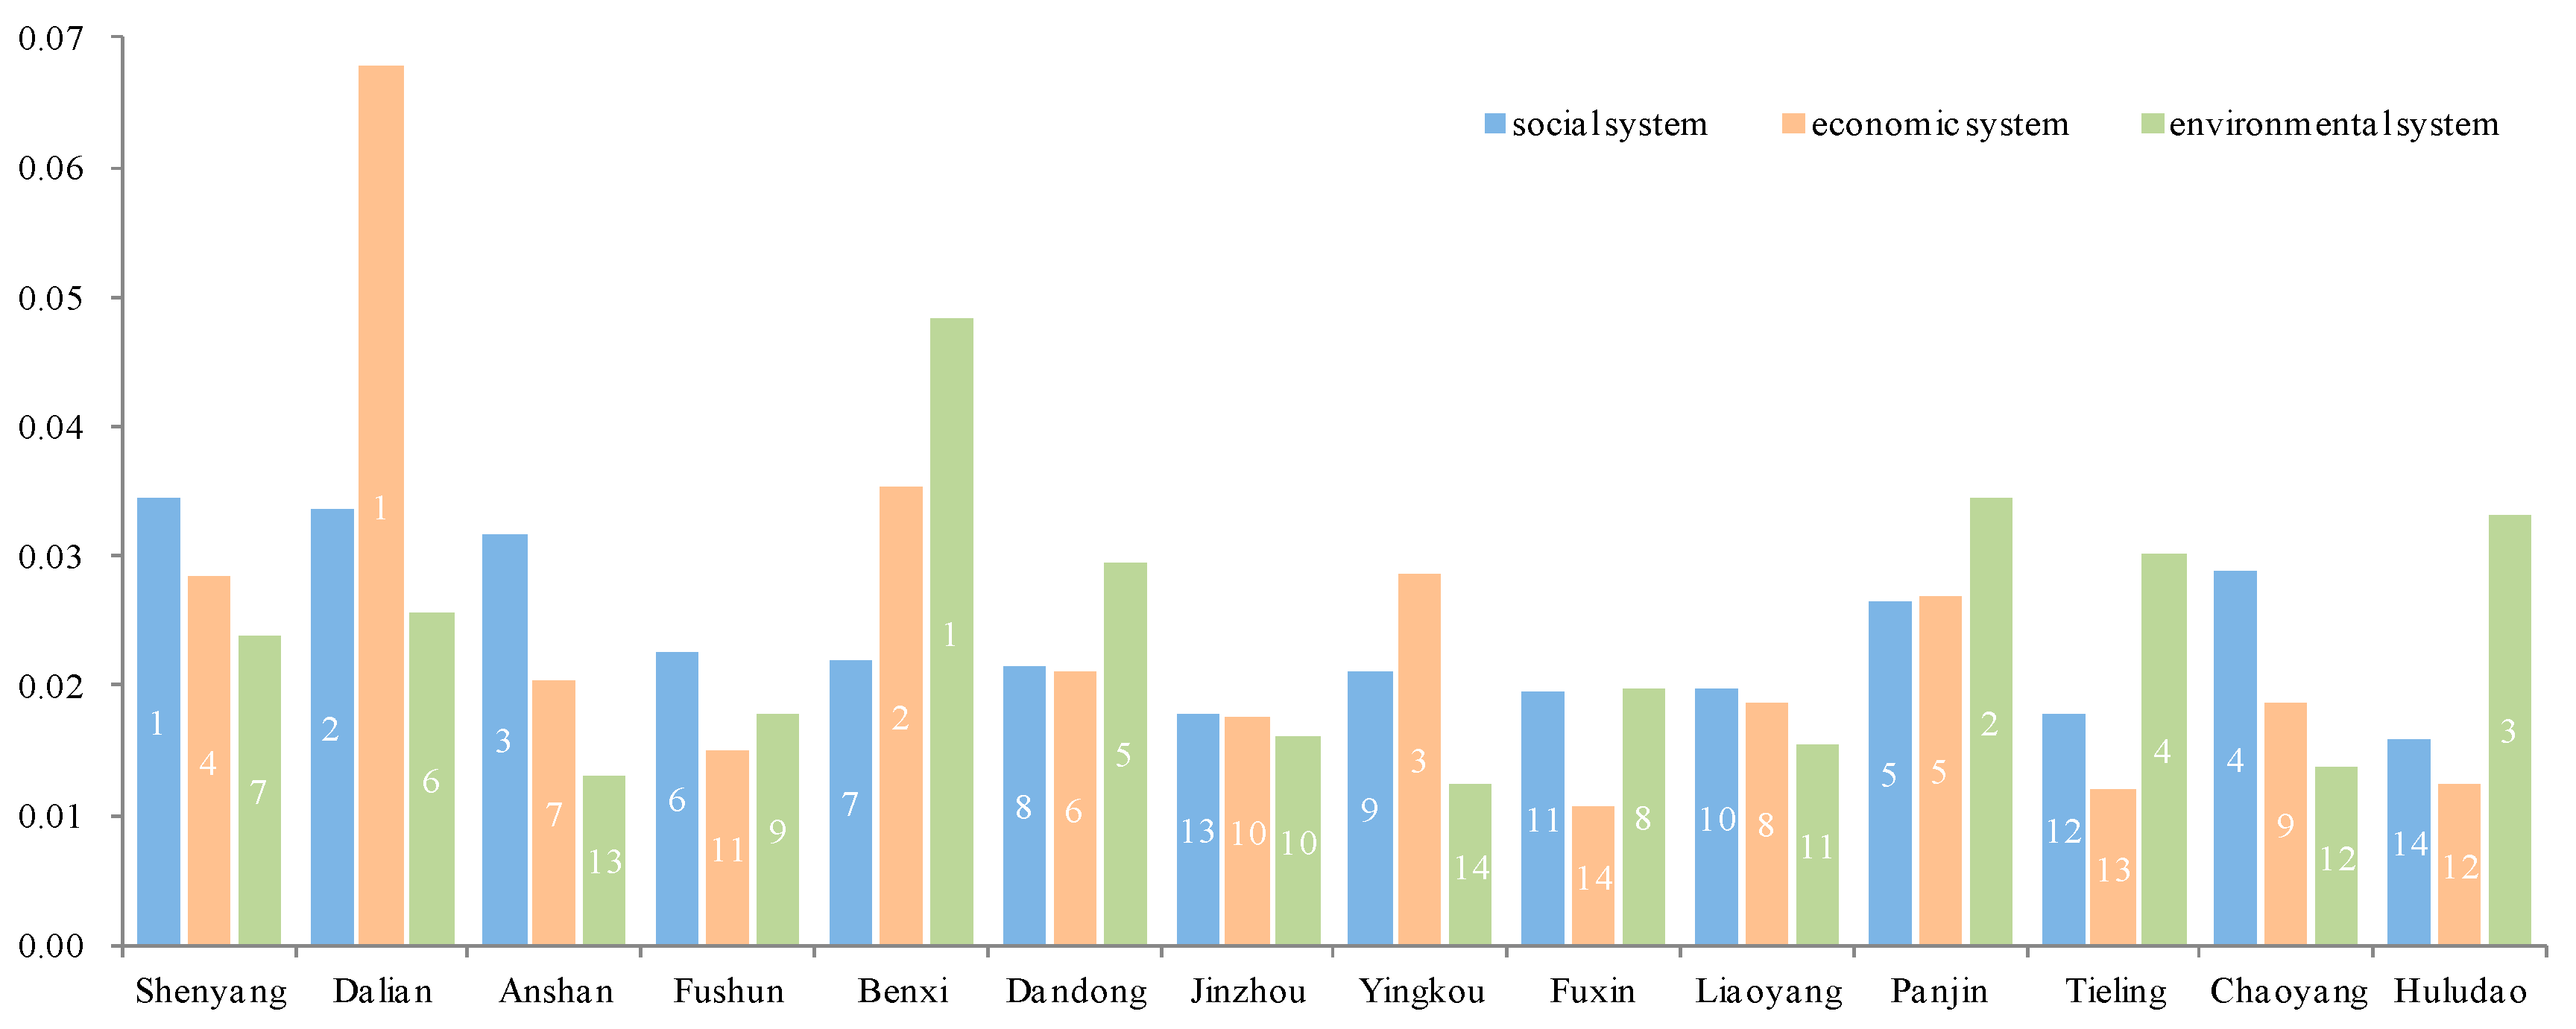
In order to further analyze the specific reasons for the differences of the sustainability performances of the cities, we show the average sustainability evaluation values of social, economic and environmental systems in each city in Figure 5. The social, economic, environmental evaluation values are calculated by y i S = j = 1 7 w j x i j o , y i E = j = 8 14 w j x i j o and y i E = j = 15 21 w j x i j o , respectively. The corresponding average evaluation values are the weighted average of each system in different years.
The following conclusions can be found: The systems’ evaluation values of the 14 cities were not balanced. For example, Shenyang ranked first in the social system, but seventh in the environmental system. Dalian’s economic system ranked first, but its environmental system ranked sixth. By contrast, Benxi ranked first in the environmental system and seventh in the social system. The sustainability of the economic system in Liaoning Province differed greatly from that of the social system. The evaluation values of the social system, economic system and environmental system fluctuated within the range of [0.0159, 0.0346], [0.0151, 0.0677] and [0.0123, 0.0483], respectively. Most cities had different advantages with respect to various systems. Among the three systems, cities with relatively good social performance were Shenyang, Dalian and Anshan. The economic systems of Dalian, Benxi and Yingkou were relatively good. Benxi, Panjin and Huludao performed relatively well on environmental systems.
Similarly, with Table 1, we can calculate the average evaluation values of each sub-dimension, such as social system base y i S 1 = j = 1 3 w j x i j o , social supply to economy y i S 2 = j = 4 5 w j x i j o and social supply to environment y i S 3 = j = 6 7 w j x i j o , as shown in Figure 6.
The conclusions are as follows: From the perspective of social base sub-dimension, the evaluation values of Dalian, Anshan and Shenyang were higher, while those of Jinzhou, Huludao and Tieling were lower. Some cities, such as Dalian and Anshan, had higher social base rankings, but their social systems supply to other systems ranked lower. The social system of most cities supplied more for the environmental system (accounting for 64.29%) than for the economic system (accounting for 35.71%). Compared with the ranking difference between the largest and smallest sub-dimensions of the social system (the social sub-dimension difference of Chaoyang is 12), the ranking difference of the sub-dimensions of the economic system was relatively small. Similar to the social system, the economic system of most cities supplied more for the environmental system (accounting for 57.12%) than for the social system (accounting for 42.86%). Cities with higher environmental base rankings, such as Benxi, Dandong and Fushun, had a relatively poor social and economic base ranking. The higher-ranking cities offered relatively less supply to other systems than those with lower-rankings, such as Panjin and Jinzhou.

6. Conclusions and Suggestions

In this paper, we evaluated the sustainability of the 14 prefecture-level cities in Liaoning Province, China. We expanded the three-pillar model by considering the bases of social, economic and environmental systems and their interactions, and constructed an evaluation indicator system consisting of 21 indicators. We proposed a weighting method based on the data distribution form. The attitude of decision makers is incorporated in the objective weighting process. Therefore, it is possible to objectively guide the alternatives to develop toward the established goal. The empirical results provide us with more references about the status, trends and development suggestions of the cities sustainability.
The sustainability evaluation results showed that the cities in eastern Liaoning (0.0888) had the highest sustainability level, while those in western Liaoning (0.0624) had the lowest level. The sustainable level of southern Liaoning (0.0771) is better than that of northern Liaoning (0.0674). The performances of the 14 cities in Liaoning were not perfect. Both the evaluation values and growth rates of 7 cities (accounting for 50.00%) were lower than the overall average level. In terms of the three dimensions, the systems’ evaluation values of the 14 cities were not balanced. The evaluation values of the social, economic and environmental systems fluctuated within the range of [0.0159, 0.0346], [0.0151, 0.0677] and [0.0123, 0.0483], respectively. There were 10 cities (accounting for 71.43%) with the maximum and minimum ranking differences greater than or equal to 5. From the perspective of sub-dimension, the social system of most cities supplied more for the environmental system (accounting for 64.29%) than for the economic system (accounting for 35.71%). Similarly, the economic system of most cities supplied more for the environmental system (accounting for 57.12%) than for the social system (accounting for 42.86%). Cities with higher environmental base rankings, such as Benxi, Dandong and Fushun, offered less supply to other systems.
Based on the above conclusions, the relevant suggestions are as follows: due to the interactions of the systems, we should systematically improve the state of the 14 cities’ vulnerable systems to improve their sustainability. Taking Shenyang as an example, it can be seen from Figure 5 that the sustainability of its environmental system was inferior to the other systems, which is an important factor hindering the sustainability of the city. Therefore, priority should be given to improving Shenyang’s air quality index (C15) and per capita garden and green space area (C16). The reason is that these two indicators have a larger behavioral guidance weights in the environmental system (as shown in Table 3). In addition, from Figure 6, it can be seen that its environmental base ranked ninth, so priority should also be given to improving the indicators under this classification, namely C15 and C16. In fact, as an important industrial city in Liaoning Province, Shenyang has a serious problem with air quality. The problem of coal burning in Shenyang is an important factor affecting the value of indicator C15. The government can strengthen the transformation of industrial and heating boilers, promote the application of new energy-saving technologies, and optimize the fuel supply structure. As a provincial capital, Shenyang has a large population, resulting in a small per capita garden and green space. The government can raise the level of indicator C16 in many aspects, such as gardened city, tree-lined roads, beautiful parks and gardened communities. Furthermore, the city underground space should be effectively exploited and matched with the ground space. The above method and the reality verify each other, which shows the feasibility and credibility of the behavioral guidance method in this paper. Similarly, other cities can use the above train of thought to ascertain strategies for sustainability.
Some implications can be drawn from this research: (1) stakeholders of city sustainability evaluation in Liaoning Province can be acquainted with the state, trend, advantages and disadvantages of each city from multiple perspectives, such as the dimension of systems’ sustainability, the sub-dimension of the system base and its supply to the other systems; (2) due to the differences among the cities in Liaoning Province, the local authorities can use the above results to analyze and choose their own sustainability pattern. The sustainability pattern for each city is more personalized and detailed; that is, more emphasis is placed on indicators with larger behavioral guidance weights and systems with smaller scores; (3) this method is not only suitable for cities in Liaoning Province, but also for cities in other provinces. It is conducive to improving the sustainability of social, economic and environmental system in each city, and can promote the coordination of the three systems.
Due to the limitations of missing data before 2015, the research span of this paper is short. In terms of future study, we plan to develop more convenient algorithms to interpolate missing data. In addition, we will consider how to effectively combine the text information of related website users with the evaluation model.

Author Contributions

Writing—original draft preparation, Y.Z.; writing—review and editing, W.L.; data curation, P.Y.; supervision, C.G.

Funding

This research was supported by the National Natural Science Foundation of China (71671031, 71701040, 51678375, 71901079).

Acknowledgments

Special thanks to the reviewers for their valuable comments.

Conflicts of Interest

The authors declare no conflict of interest.

References

  1. Bibri, S.E.; Krogstie, J. Smart sustainable cities of the future: An extensive interdisciplinary literature review. Sustain. Cities Soc. 2017, 31, 183–212. [Google Scholar] [CrossRef]
  2. Behrendt, F. Cycling the Smart and Sustainable City: Analyzing EC Policy Documents on Internet of Things, Mobility and Transport, and Smart Cities. Sustainability 2019, 11, 763. [Google Scholar] [CrossRef]
  3. Chourabi, H.; Nam, T.; Walker, S.; Gil-Garcia, J.R.; Mellouli, S.; Nahon, K.; Scholl, H.J. Understanding smart cities: An integrative framework. In Proceedings of the 2012 45th Hawaii International Conference on System Sciences, Maui, HI, USA, 4–7 January 2012; pp. 2289–2297. [Google Scholar]
  4. Caragliu, A.; Del Bo, C.; Nijkamp, P. Smart cities in Europe. Research Memoranda Series 0048 (VU University Amsterdam, Faculty of Economics, Business Administration and Econometrics). J. Urban Technol. 2009, 18. [Google Scholar] [CrossRef]
  5. Giffinger, R.; Fertner, C.; Kramar, H.; Kalasek, R.; Pichler-Milanovi, N.; Meijers, E. Smart Cities: Ranking of European Medium-Sized Cities; Centre of Regional Science (SRF), Vienna University of Technology: Vienna, Austria, 2007. [Google Scholar]
  6. D’Auria, A.; Tregua, M.; Vallejo-Martos, M. Modern conceptions of cities as smart and sustainable and their commonalities. Sustainability 2018, 10, 2642. [Google Scholar] [CrossRef]
  7. Bibri, S.E. A foundational framework for smart sustainable city development: Theoretical, disciplinary, and discursive dimensions and their synergies. Sustain. Cities Soc. 2018, 38, 758–794. [Google Scholar] [CrossRef]
  8. Bibri, S.E. The IoT for smart sustainable cities of the future: An analytical framework for sensor-based big data applications for environmental sustainability. Sustain. Cities Soc. 2018, 38, 230–253. [Google Scholar] [CrossRef]
  9. Bibri, S.E.; Krogstie, J. ICT of the new wave of computing for sustainable urban forms: Their big data and context-aware augmented typologies and design concepts. Sustain. Cities Soc. 2017, 32, 449–474. [Google Scholar] [CrossRef]
  10. Yi, P.; Li, W.; Li, L. Evaluation and prediction of city sustainability using MCDM and stochastic simulation methods. Sustainability 2018, 10, 3771. [Google Scholar] [CrossRef]
  11. Yi, P.T.; Dong, Q.X.; Li, W.W. Evaluation of city sustainability using the deviation maximization method. Sustain. Cities Soc. 2019, 50, 101529. [Google Scholar] [CrossRef]
  12. Pierce, P.; Ricciardi, F.; Zardini, A. Smart cities as organizational fields: A framework for mapping sustainability-enabling configurations. Sustainability 2017, 9, 1506. [Google Scholar] [CrossRef]
  13. Kenworthy, J.R. The eco-city: Ten key transport and planning dimensions for sustainable city development. Environ. Urban. 2006, 18, 67–85. [Google Scholar] [CrossRef]
  14. Angelidou, M.; Psaltoglou, A.; Komninos, N.; Kakderi, C.; Tsarchopoulos, P.; Panori, A. Enhancing sustainable urban development through smart city applications. Journal of Science and Technology Policy Management. J. Sci. Technol. Policy Manag. 2018, 9, 146–169. [Google Scholar] [CrossRef]
  15. Huovila, A.; Bosch, P.; Airaksinen, M. Comparative analysis of standardized indicators for Smart sustainable cities: What indicators and standards to use and when? Cities 2019, 89, 141–153. [Google Scholar] [CrossRef]
  16. Duvier, C.; Anand, P.B.; Oltean-Dumbrava, C. Data quality and governance in a UK social housing initiative: Implications for smart sustainable cities. Sustain. Cities Soc. 2018, 39, 358–365. [Google Scholar] [CrossRef]
  17. Liu, L. IoT and A Sustainable City. Energy Procedia 2018, 153, 342–346. [Google Scholar] [CrossRef]
  18. Albino, V.; Fraccascia, L.; Savino, T. Industrial Symbiosis for a Sustainable City: Technical, Economical and Organizational Issues. Procedia Eng. 2015, 118, 950–957. [Google Scholar] [CrossRef]
  19. Mori, K.; Christodoulou, A. Review of sustainability indices and indicators: Towards a new City Sustainability Index (CSI). Environ. Impact Assess. Rev. 2012, 32, 94–106. [Google Scholar] [CrossRef]
  20. Lu, C.P.; Xue, B.; Lu, C.Y.; Wang, T.; Jiang, L.; Zhang, Z.L.; Ren, W.X. Sustainability investigation of resource-based cities in northeastern China. Sustainability 2016, 8, 1058. [Google Scholar] [CrossRef]
  21. Mori, K.; Yamashita, T. Methodological framework of sustainability assessment in City Sustainability Index (CSI): A concept of constraint and maximization indicators. Habitat Int. 2015, 45, 10–14. [Google Scholar] [CrossRef]
  22. Jin, J.; Wang, R.; Li, F.; Huang, J.; Zhou, C.; Zhang, H.; Yang, W. Conjugate ecological restoration approach with a case study in Mentougou district, Beijing. Ecol. Complex. 2011, 8, 161–170. [Google Scholar] [CrossRef]
  23. Ali-Toudert, F.; Ji, L.M. Modeling and measuring urban sustainability in multi-criteria based systems—A challenging issue. Ecol. Indic. 2017, 73, 597–611. [Google Scholar] [CrossRef]
  24. Ding, L.; Shao, Z.; Zhang, H.; Xu, C.; Wu, D. A comprehensive evaluation of urban sustainable development in China based on the TOPSIS-Entropy method. Sustainability 2016, 8, 746. [Google Scholar] [CrossRef]
  25. Sun, X.; Liu, X.S.; Li, F.; Tao, Y.; Song, Y.S. Comprehensive evaluation of different scale cities’ sustainable development for economy, society, and ecological infrastructure in China. J. Clean. Prod. 2017, 163, 329–337. [Google Scholar] [CrossRef]
  26. Rosales, N. Towards the modeling of sustainability into urban planning: Using indicators to build sustainable cities. Procedia Eng. 2011, 21, 641–647. [Google Scholar] [CrossRef]
  27. Garau, C.; Pavan, V. Evaluating urban quality: Indicators and assessment tools for smart sustainable cities. Sustainability 2018, 10, 575. [Google Scholar] [CrossRef]
  28. Li, F.; Liu, X.; Hu, D.; Wang, R.; Yang, W.; Li, D.; Zhao, D. Measurement indicators and an evaluation approach for assessing urban sustainable development: A case study for China’s Jining City. Landsc. Urban Plan. 2009, 90, 134–142. [Google Scholar] [CrossRef]
  29. Awasthi, A.; Omrani, H. A hybrid approach based on AHP and belief theory for evaluating sustainable transportation solutions. Int. J. Glob. Environ. Issues 2009, 9, 212–226. [Google Scholar] [CrossRef]
  30. Zhang, Y.P.; Sun, Y.B.; Qin, J.B. Sustainable development of coal cities in Heilongjiang province based on AHP method. Int. J. Min. Sci. Technol. 2012, 22, 133–137. [Google Scholar] [CrossRef]
  31. Lu, Y.; Xu, H.; Wang, Y.; Yang, Y. Evaluation of water environmental carrying capacity of city in Huaihe River Basin based on the AHP method: A case in Huai’an City. Water Resour. Ind. 2017, 18, 71–77. [Google Scholar] [CrossRef]
  32. Reza, B.; Sadiq, R.; Hewage, K. Sustainability assessment of flooring systems in the city of Tehran: An AHP-based life cycle analysis. Constr. Build. Mater. 2011, 25, 2053–2066. [Google Scholar] [CrossRef]
  33. Wu, X.; Liu, S.; Sun, Y.; An, Y.; Dong, S.; Liu, G. Ecological security evaluation based on entropy matter-element model: A case study of Kunming city, southwest China. Ecol. Indic. 2019, 102, 469–478. [Google Scholar] [CrossRef]
  34. Wu, S.; Fu, Y.; Shen, H.; Liu, F. Using ranked weights and Shannon entropy to modify regional sustainable society index. Sustain. Cities Soc. 2018, 41, 443–448. [Google Scholar] [CrossRef]
  35. Zhang, L.; Xu, Y.; Yeh, C.H.; Liu, Y.; Zhou, D. City sustainability evaluation using multi-criteria decision making with objective weights of interdependent criteria. J. Clean. Prod. 2016, 131, 491–499. [Google Scholar] [CrossRef]
  36. Azizalrahman, H. Towards a generic multi-criteria evaluation model for low carbon cities. Sustain. Cities Soc. 2018, 39, 275–282. [Google Scholar] [CrossRef]
  37. Xu, S.; Xu, D.; Liu, L. Construction of regional informatization ecological environment based on the entropy weight modified AHP hierarchy model. Sustain. Comput. Inform. Syst. 2019, 22, 26–31. [Google Scholar] [CrossRef]
  38. Ma, F.; He, J.; Ma, J.; Xia, S. Evaluation of urban green transportation planning based on central point triangle whiten weight function and entropy-AHP. Transp. Res. Procedia 2017, 25, 3634–3644. [Google Scholar] [CrossRef]
  39. Duan, Y.; Mu, H.; Li, N.; Li, L.; Xue, Z. Research on comprehensive evaluation of low carbon economy development level based on AHP-entropy method: A case study of Dalian. Energy Procedia 2016, 104, 468–474. [Google Scholar] [CrossRef]
  40. Rowe, G.; Wright, G. The Delphi technique as a forecasting tool: Issues and analysis. Int. J. Forecast. 1999, 15, 353–375. [Google Scholar] [CrossRef]
  41. Saaty, T.L. How to make a decision: The analytic hierarchy process. Eur. J. Oper. Res. 1990, 48, 9–26. [Google Scholar] [CrossRef]
  42. Kapur, J.N.; Sahoo, P.K.; Wong, A.K. A new method for gray-level picture thresholding using the entropy of the histogram. Comput. Vis. Graph. Image Process. 1985, 29, 273–285. [Google Scholar] [CrossRef]
  43. Guo, Y.J. Comprehensive Evaluation Theory, Methods and Applications; Science Press: Beijing, China, 2007; pp. 44–47. [Google Scholar]
  44. Mulliner, E.; Malys, N.; Maliene, V. Comparative analysis of MCDM methods for the assessment of sustainable housing affordability. Omega 2016, 59, 146–156. [Google Scholar] [CrossRef]
  45. Liu, G. Development of a general sustainability indicator for renewable energy systems: A review. Renew. Sustain. Energy Rev. 2014, 31, 611–621. [Google Scholar] [CrossRef]
  46. Awasthi, A.; Chauhan, S.S. A hybrid approach integrating Affinity Diagram, AHP and fuzzy TOPSIS for sustainable city logistics planning. Appl. Math. Model. 2012, 36, 573–584. [Google Scholar] [CrossRef]
  47. Li, W.; Yi, P.; Zhang, D. Sustainability Evaluation of Cities in Northeastern China Using Dynamic TOPSIS-Entropy Methods. Sustainability 2018, 10, 4542. [Google Scholar] [CrossRef] [Green Version]
  48. Chen, W.; Shen, Y.; Wang, Y. Evaluation of economic transformation and upgrading of resource-based cities in Shaanxi province based on an improved TOPSIS method. Sustain. Cities Soc. 2018, 37, 232–240. [Google Scholar] [CrossRef]
  49. Chen, C.; Lam, J.S.L. Sustainability and interactivity between cities and ports: A two-stage data envelopment analysis (DEA) approach. Marit. Policy Manag. 2018, 45, 944–961. [Google Scholar] [CrossRef]
  50. Lo Storto, C. Ecological efficiency based ranking of cities: A combined DEA cross-efficiency and Shannon’s entropy method. Sustainability 2016, 8, 124. [Google Scholar] [CrossRef] [Green Version]
  51. Milan, L.; Kin, B.; Verlinde, S.; Macharis, C. Multi-actor multi-criteria analysis for sustainable city distribution: A new assessment framework. Int. J. Multicriteria Decis. Mak. 2015, 5, 334–354. [Google Scholar] [CrossRef]
  52. Chhipi-Shrestha, G.; Hewage, K.; Sadiq, R. Selecting sustainability indicators for small to medium sized urban water systems using fuzzy-ELECTRE. Water Environ. Res. 2017, 89, 238–249. [Google Scholar] [CrossRef]
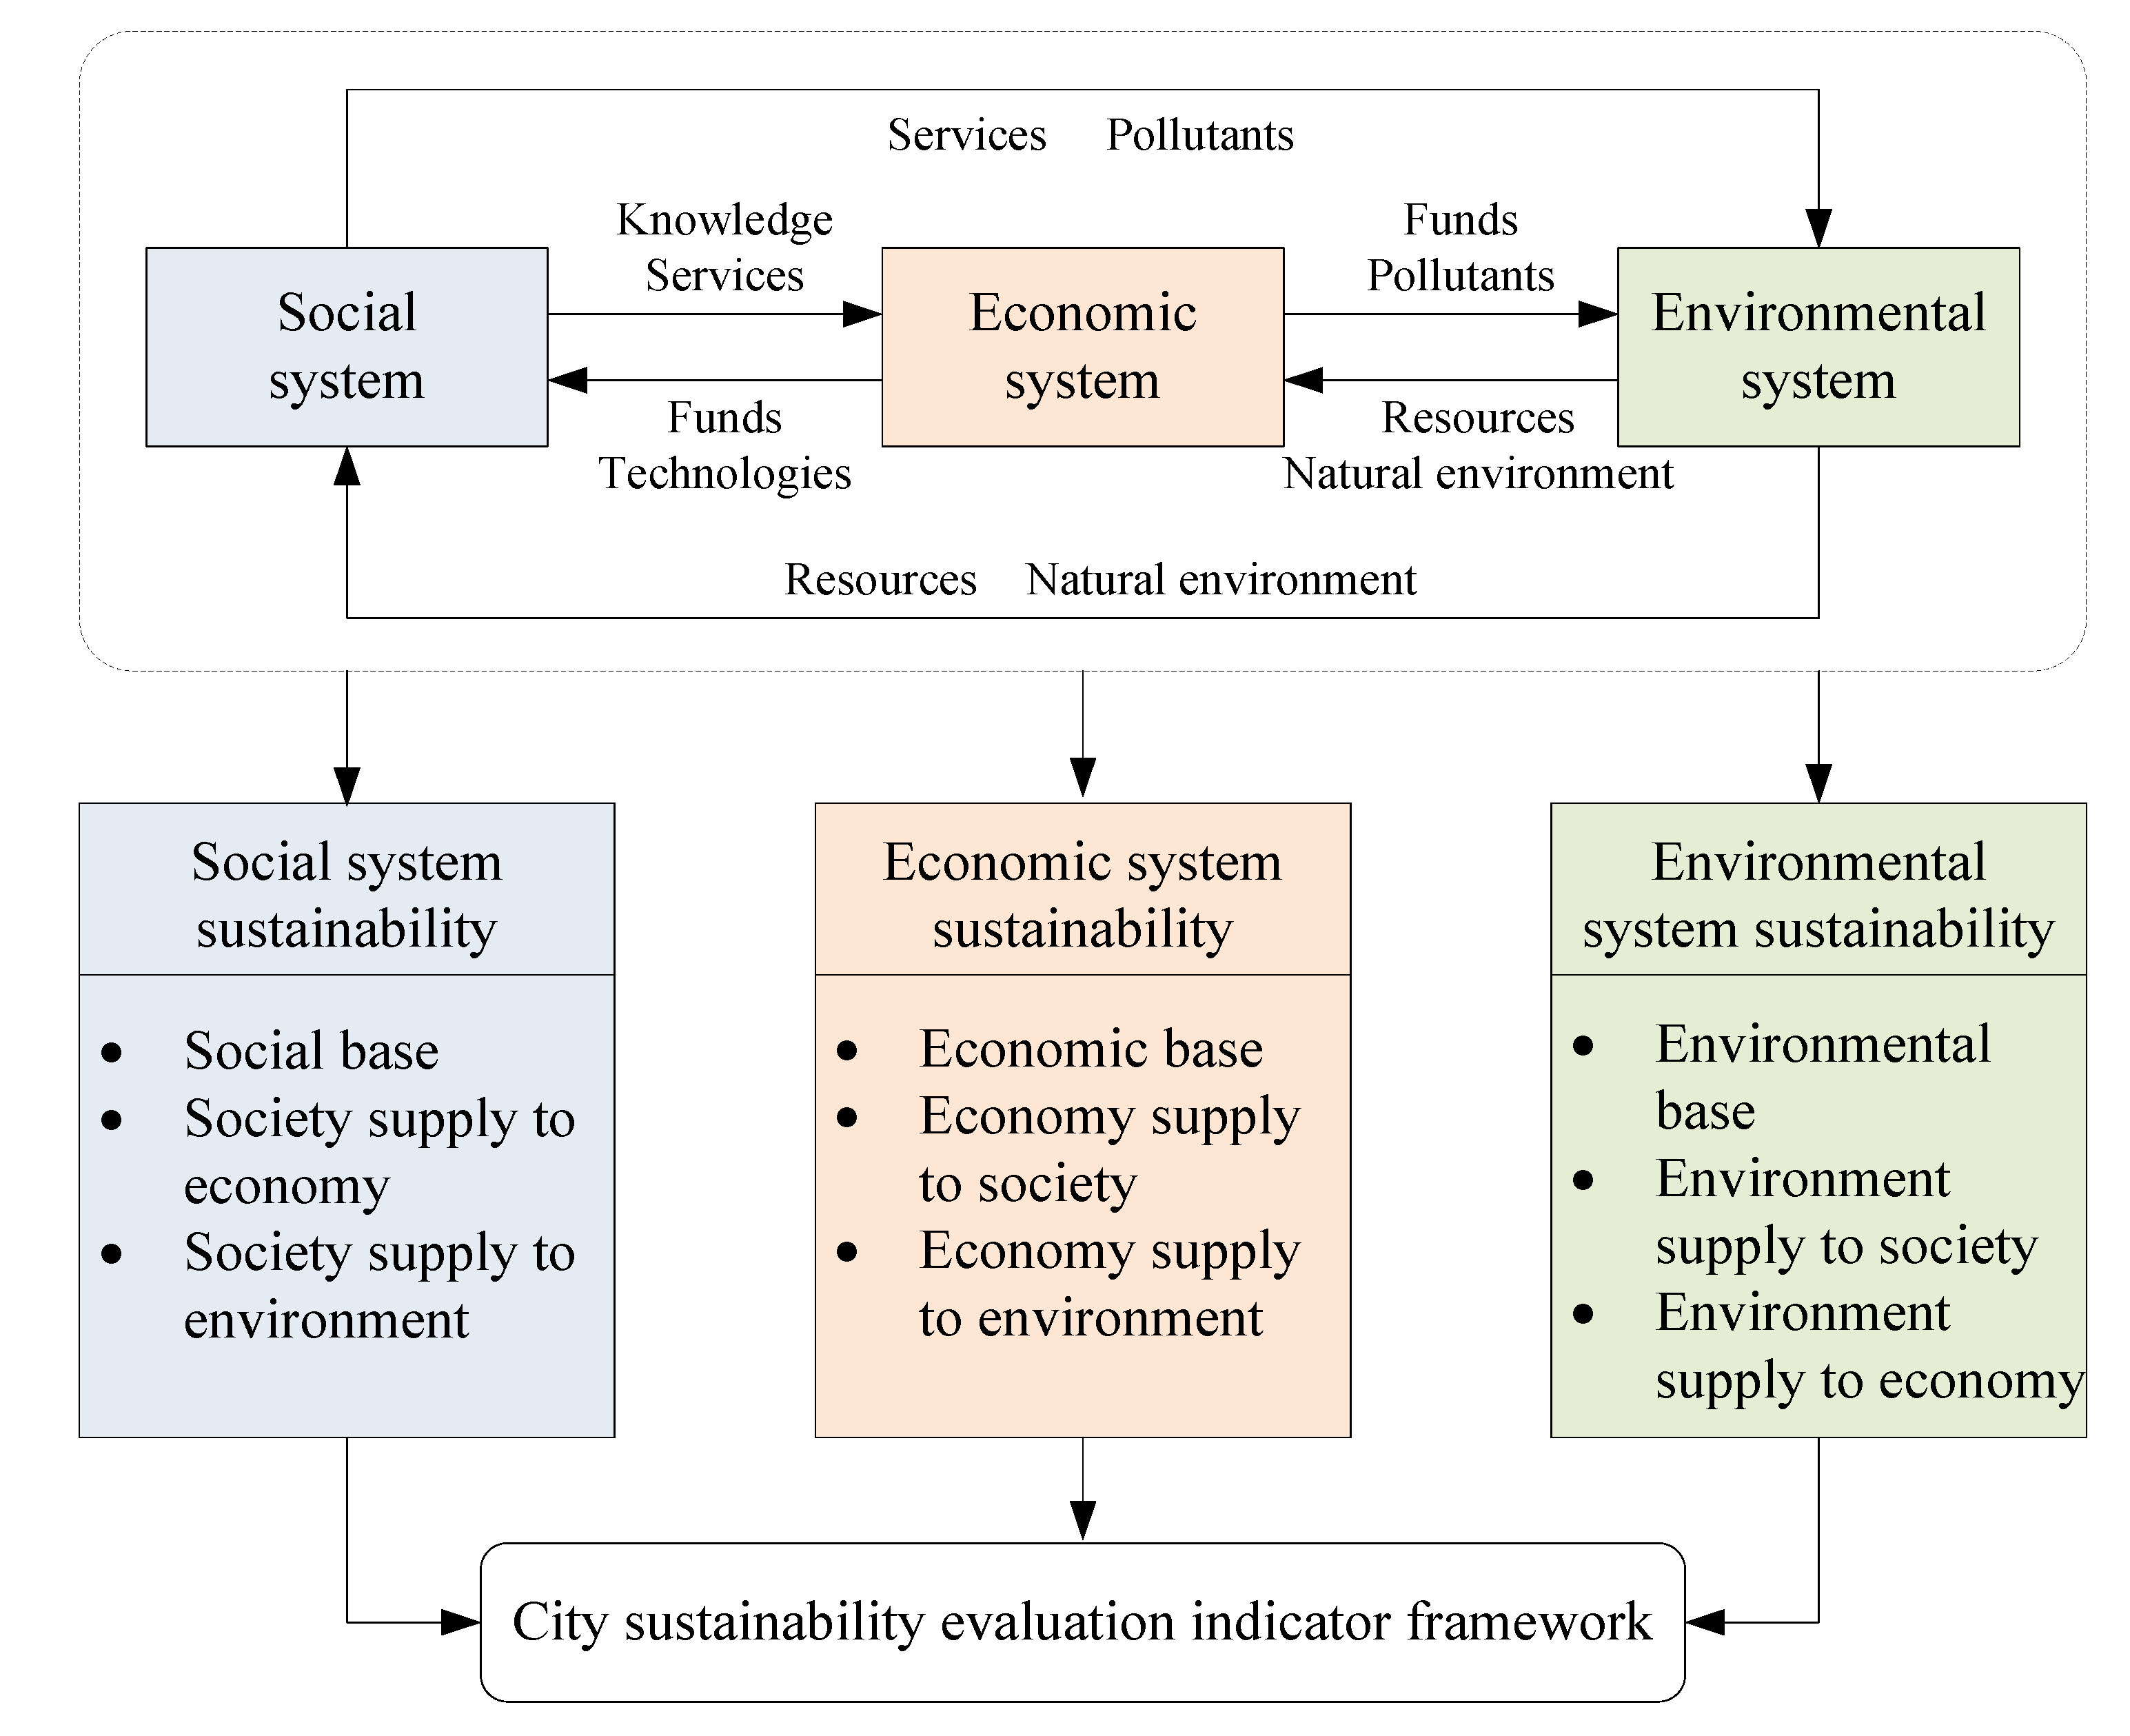
Figure 1. Frame diagram of evaluation indicator system.
Sustainability 11 06808 g001
Figure 2. Matrix scatter plot of indicators’ weights in different years.
Sustainability 11 06808 g002
Figure 3. Change in the performance values of the 14 cities in 2015–2017.
Sustainability 11 06808 g003
Figure 4. Average evaluation values and growth rates of the 14 cities in 2015–2017.
Sustainability 11 06808 g004
Figure 5. System evaluation values and rankings for the 14 cities.
Sustainability 11 06808 g005
Figure 6. Sub-dimension evaluation values and rankings for the 14 cities.
Sustainability 11 06808 g006
Table 1. City sustainability evaluation indicators.
DimensionSub-DimensionIndicator [Code]UnitProperty
Social
system sustainability
BaseNatural growth rate of population [C1]%Benefit
Per capita public library inventory [C2]VolumeBenefit
Number of beds in medical institutions per 1000 population [C3]SetBenefit
Supply to economyProportion of research and development (R&D) staff [C4]%Benefit
Proportion of employees [C5]%Benefit
Supply to environmentPer capita wastewater discharge [C6]TonCost
Number of sanitation vehicles per capita [C7]SetBenefit
Economic system sustainabilityBasePer capita GDP [C8]YuanBenefit
Total import and export per capita [C9]DollarBenefit
Funds of financial institutions per capita [C10]YuanBenefit
Supply to societyAverage wages of unretired employees [C11]YuanBenefit
Per capita R&D expenditure [C12]YuanBenefit
Supply to environmentProportion of financial expenditure on energy conservation and environmental protection [C13]%Benefit
Proportion of fixed assets investment in the environment and facilities management industry [C14]%Benefit
Environmental system sustainabilityBaseAir quality index [C15] Cost
Per capita garden and green space area [C16]m2Benefit
Per capita water resources [C17]m3Benefit
Supply to societyDust emissions per unit area [C18]TonCost
Industrial exhaust emissions per unit area [C19]m3Cost
Supply to economyDust emissions per unit GDP [C20]TonCost
Industrial exhaust emissions per unit GDP [C21]m3Cost
Table 2. Introductions of the 14 cities in Liaoning Province, China.
CityPopulation aArea (km2) aAverage
Temperature (°C) b
Location in
Liaoning Province
Shenyang8,294,00012,8603~15North
Dalian6,988,00012,5749~16South
Anshan3,598,00092637~16South
Fushun2,065,00011,2710~14North
Benxi1,687,00084144~15East
Dandong2,395,00015,2905~15East
Jinzhou3,050,00010,0486~16West
Yingkou2,438,00054206~15South
Fuxin1,766,00010,3552~16West
Liaoyang1,837,00047885~16South
Panjin1,437,00041036~15West
Tieling2,638,00012,9853~15North
Chaoyang2,949,00019,6984~18West
Huludao2,547,00010,4165~16West
a Data from the 2018 Statistical Yearbook of Liaoning Province; b Data from China Weather Website.
Table 3. Behavioral guidance weights for 2015–2017.
YearC1C2C3C4C5C6C7
20150.037440.037800.087510.018290.043290.067290.04172
20160.075660.042750.051560.024330.053740.045850.03944
20170.074080.067270.063880.009490.049850.040050.02870
YearC8C9C10C11C12C13C14
20150.036200.107910.023160.012600.074600.055870.02299
20160.002640.153230.003960.010790.109170.052240.00129
20170.022390.096130.028740.003220.112320.050830.01970
YearC15C16C17C18C19C20C21
20150.070600.108420.001580.096070.025710.003490.02747
20160.093000.109060.008810.042080.025610.022770.03199
20170.024880.122520.044150.024620.020950.056960.03926
Table 4. Performance of the 14 cities in 2015–2017.
CityEvaluation ValueRankingGrowth
Rate (100%)
201520162017Average201520162017Average
Shenyang0.08290.08440.09280.086744340.3307
Dalian0.11660.13280.13140.126911110.4945
Anshan0.05460.05550.08570.0653119461.0387
Fushun0.06010.05510.05120.055510111111−0.2991
Benxi0.10430.10620.10610.105622220.0584
Dandong0.06750.07230.07640.072175650.2965
Jinzhou0.05170.05150.05100.051414131213−0.0240
Yingkou0.06110.06340.06180.062197770.0212
Fuxin0.05210.05010.04800.050013141314−0.1352
Liaoyang0.05450.05420.05300.053912121012−0.0490
Panjin0.08560.09330.08490.08793353−0.0207
Tieling0.07280.06450.04260.0600561410−1.0066
Chaoyang0.07160.05510.05660.061161099−0.4999
Huludao0.06460.06140.05840.06158888−0.2055