1. Introduction
Sustainable development of airports, especially small-scale airports, requires the continual adaptation of air services to serve more markets. This often involves the creation of new connecting services. Besides the air routes, the potential connectivity of airports can be vastly increased through ground links, allowing passengers to fly into one airport and to travel by surface modes to another airport from which they resume their air journey [
1]. For such services to be viable, they must be acceptable to air travelers. In this regard, airports’ sustainable development depends on the willingness of air travelers to use heretofore atypical types of air services [
2], including ones that contain ground transport links [
3]. Hence, we want to assess air travelers’ willingness to try such services based on a case study involving Zhuhai and Hong Kong airports, which have recently been connected by the Hongkong–Zhuhai–Macao Bridge [
4].
In this case, Zhuhai Airport, located in China’s bay area, has been a domestic airport since its opening in 1995. During the past two decades, it put in a lot of effort to attract international air routes but always failed because of the intensive competitions from the three nearby hubs, namely, Hong Kong, Guangzhou, and Shenzhen airports. However, this situation may be changed due to the newly opened Hongkong–Zhuhai–Macao Bridge (The Hong Kong–Zhuhai–Macao bridge, which is a trans-strait bridge across Lingtin Bay, is recognized as one of the seven wonders of modern times.) (hereafter referred to as the Bridge). Taking advantage of the trans-strait linkage as well as the agreement signed with Hong Kong airport, Zhuhai Airport can now provide an air–bridge–air path for international passengers. As shown in
Figure 1, people travelling outbound from mainland China could reach Zhuhai Airport by domestic flights, then Hong Kong Airport through the Bridge, and finally foreign destinations. In this sense, Zhuhai airport may become a new gateway without holding international flights to thus approach foreign markets for supporting its sustainable development within the multi-airport region.
The success of the new gateway service is, to a large extent, dependent on passengers’ preferences to the atypical air service; hence, we should firstly analyze the benefits provided by the air–bridge–air path. The most important one is that the path may reduce travel costs for Chinese passengers who need to transfer at Hong Kong airport. To be specific, because of the “One Country, Two Systems” policy, the flights between Hong Kong and mainland China are treated as international connections with extra taxes [
5]. Therefore, the price from Xi’an to Zhuhai (approximately 760 RMB) was, in general, half of that from Xi’an to Hong Kong (approximately 1272 RMB) in 2019. It is obvious that the semi-ending trip to Hong Kong Airport via the air–bridge–air path can save a lot of money. In this circumstance, people would be highly willing to use the path in reality. However, when we take the time costs into consideration, this path will unavoidably involve extra time cost at the same time, which creates inconvenience [
5,
6].
As per the strengths and weakness of the air–bridge–air path, we contend that the potential travelers using the Bridge would be distinctly different from those using direct flights. To identify the target passengers of the path, the market segmentation approaches should be applied in research [
7]. Referring to the related literatures, personal features such as age, gender, income, experiences, etc. were proven to have significant effects on grouping air travel passengers [
8]. Moreover, the travel preferences affected by context (like travel purpose, group members, destinations, etc. [
9,
10]) as well as the service attributes of airlines and airports (like security, comfort and convenience, flight time, access time, on-time performance, etc. [
11,
12]) are also important in the classification. Taking this case in our research into account, the market segmentation approach should be constructed incorporating personal features and path choice preferences. However, the choice preference of air travel path is commonly modelled on a pure flight network without surface connections between airports, so the existing approaches may be not suitable to identify the target passengers of the new gateway service of Zhuhai Airport [
13,
14]. Hence, it is necessary to construct a market segmentation approach incorporating passengers’ preferences to the atypical air service composed of two aviation legs, one surface transportation though the Bridge, as well as the air–coach transfers.
Apart from the unique intermodal connections, the Bridge itself is also an important element in attracting passengers. To be specific, people who are curious about visiting the Bridge, at least the first time, may recognize the air–bridge–air path as a more attractive option than the similar air–road–air path provided by Shenzhen Airport in the same region [
15]. In this context, the market segmentation in this research should also incorporate passengers’ heterogeneity in personalized curiosity.
Therefore, in order to identify the target demand of the new gateway service, this paper proposes a market segmentation approach incorporating passengers’ heterogeneity in personal features as well as in path choice preferences. In the research, a latent class-discrete choice model will be constructed, in which curiosity will be incorporated into the segment membership function in terms of a variable. The model will be estimated using the stated preference (SP) data collected from 12 Chinese cities. Moreover, the relevant segment-specific strategies related to the gateway service of Zhuhai airport will be proposed in our estimated results.
The subsequent sections are organized as follows:
Section 2 reviews pertinent researches,
Section 3 gives the model framework,
Section 4 introduces the survey design and data collection,
Section 5 presents the estimation results,
Section 6 presents the elasticity analysis,
Section 7 discusses the advantages of our proposed model in the air ticket pricing and in identifying the target markets of Zhuhai Airport from a geographical perspective, and
Section 8 concludes the paper with a discussion of future work.
2. Literature Review
The concept of market segmentation was initially introduced by Smith, who segments the demand for customers with similar tastes [
16]. Over the past 60 years or so, two kinds of segmentation approaches have evolved: the prior classification method and the post hoc method [
17]. The former predetermines the observable segment, while the latter classifies customers in accordance with choice decision data [
18,
19].
The post hoc method has been widely employed in the field of civil aviation [
20], within which cluster methods such as network clustering [
21] and fuzzy clustering [
22] are applied to analyze the market segments of airlines and airports. These methods can accurately provide segmentation results regarding existing data, but it may be impossible to predict the group to which a new individual belongs [
23]. Meanwhile, the clustering method uses statistical correlation to empirically describe the market segment, so it is hard to be linked to econometrical models [
24]. However, the latent class model can perform model-based classification to give the probability that a passenger belongs to a specific market segment [
25], and it is estimated based on the probabilistic distribution of survey data. In this sense, the latent class model would be a suitable method to be linked to other probabilistic models such as the discrete choice model [
26,
27].
The latent class model, established on the basis of categorical data, has received increasing focus because of its advantages in identifying unobservable heterogeneity [
28]. The model was originally proposed by Russell (1989) to distinguish households with different brand preferences [
29]. In the model, the classification is identified on two kinds of probability: the segmental probability and the conditional probability. To be specific, the segmental probability represents the chance that an individual belongs to one defined group [
30], and it can be estimated by maximizing the log-likelihood of the joint probability of the observable variables [
26]. Then, the joint probability is calculated using the posterior probability of an individual who has one specific feature on the condition that he or she belongs to one segment. Moreover, the segment number of the latent class model is determined according to the requirements of the research as well as to the efficiency of the evaluation criteria [
31].
Referring to existing studies, latent class models normally use personal features to clarify the latent groups [
32]. For instance, Seelhorst and Liu, and Chen and Chao use income, gender, age, and nationality as the variables in a membership function for the purpose of exploring airlines’ market segments [
33,
34]. Then, the heterogeneous choice preference is proven to be important in the segmentation [
35,
36]. Among the limited literatures that use the latent class model to segment civil aviation markets, Wen and Lai identified the target passengers of international air carriers incorporating passengers’ flight choice preferences on the route between Taiwan and Tokyo. In their research, a latent class model is integrated with a nested logit model while the utility function only incorporates the air ticket price [
37]. As the latent-discrete choice model constructs the framework of linking personal features and choice preference, it would be a suitable approach for identifying the passengers of the new gateway service in our study. However, because travel time, service frequency, and flight departure time also have important effects on the path choice [
38], we will incorporate more service attributes into the classification.
Apart from the manifest variables, curiosity, which is a psychological element, will be incorporated into the market segmentation. According to Berlyne, there are two kinds of curiosity: perceptual curiosity as well as epistemic curiosity [
39]. The former is the “state of high arousal evoked by uncertain or ambiguous patterns of sensory stimulation”, and the latter is defined as the “curiosity that motivates the quest for knowledge and is relieved when knowledge is procured” [
40]. Then, Collins and Litman further proved that the received information would have the same stimulation on perceptual curiosity generation [
41]. In our research, passengers’ curiosity of the Bridge may be oriented from audio or visual information transmitted by the media or from news spread from mouth to mouth. In this regard, the curiosity in this study can be recognized as the perceptual curiosity stimulated by the magnificent look of the longest cross-sea bridge in the world.
Then, we want to find out the relationship between perceptual curiosity and choice behavior. As per the existing literatures, a lot of studies analyze the effects of perceptual curiosity on the purchase predisposition of new brands or new products [
42,
43] but seldom focus on the curiosity related to travel behavior. In one work written by Dev Jani that we find has close relation to our study, the author figures out that passengers always possess the interest-type curiosity in travelling [
44], which means that people would feel “anticipated pleasure of new discoveries or experiences”, as defined by Litman and Jimerson in 2004 [
45]. According to the above analysis, curiosity of the Bridge would be precisely defined as interest-type curiosity and it may improve the perceived utility of the air–bridge–path. Furthermore, Dev said that the marketers should give out suitable strategies to “cater to” the demand of travelers with different levels of interest-type curiosity [
44]. In other words, curiosity should be an important criterion in market segmentation.
In this paper, curiosity of the Bridge will be incorporated into market segmentation in terms of a variable in the segment membership function, so it is worthy to discuss the measurement of its value. For the research of Collins and Litman, 33 items were listed in the questionnaires to test the individual differences in perceptual curiosity. The items were divided into two groups: the first group comprised questions about seeking new places and interesting things, and the second group was set with enquiries about contexts. As per the results, the top 6 factors that are most significant in measuring the degree of curiosity are “discover new places to go; travel to places/never been to; smell something new/find out what; hear strange sound/find out what caused it; see new fabric/touch and feel it; and hear something/see what it is”. The former two items belong to the first group, and the rest belong to the second group. The results show that the willingness to discover or travel to new places has the highest loading in the measurement, and the self-drive to explore the unknown is also important in measuring the level of curiosity [
41]. Meanwhile, the authors also point out that curiosity should be recognized as a personality which may influence all activities of life [
45].
However, sometimes, the respondents may not able to provide absolute magnitudes to the listed questions [
46]. For instance, it may be difficult for them to declare that his/her degree of discovering new places equals to 4 or 5, so the relative magnitude needs to be applied [
47]. Referring to the researches about measuring innovative attitude, the items are created to test the relatively earlier adoption of innovations [
48], which would be helpful to measure the level of curiosity in our research.
Summarized above, our proposed approach will be constructed based on a latent class-multinomial logit model (latent-MNL model) that incorporates passengers’ personal features and path choice preferences. The personal features include demographic characteristics as well as the curiosity which represents willingness to try the air–bridge–air path in their international air travel.
3. Modeling Approach
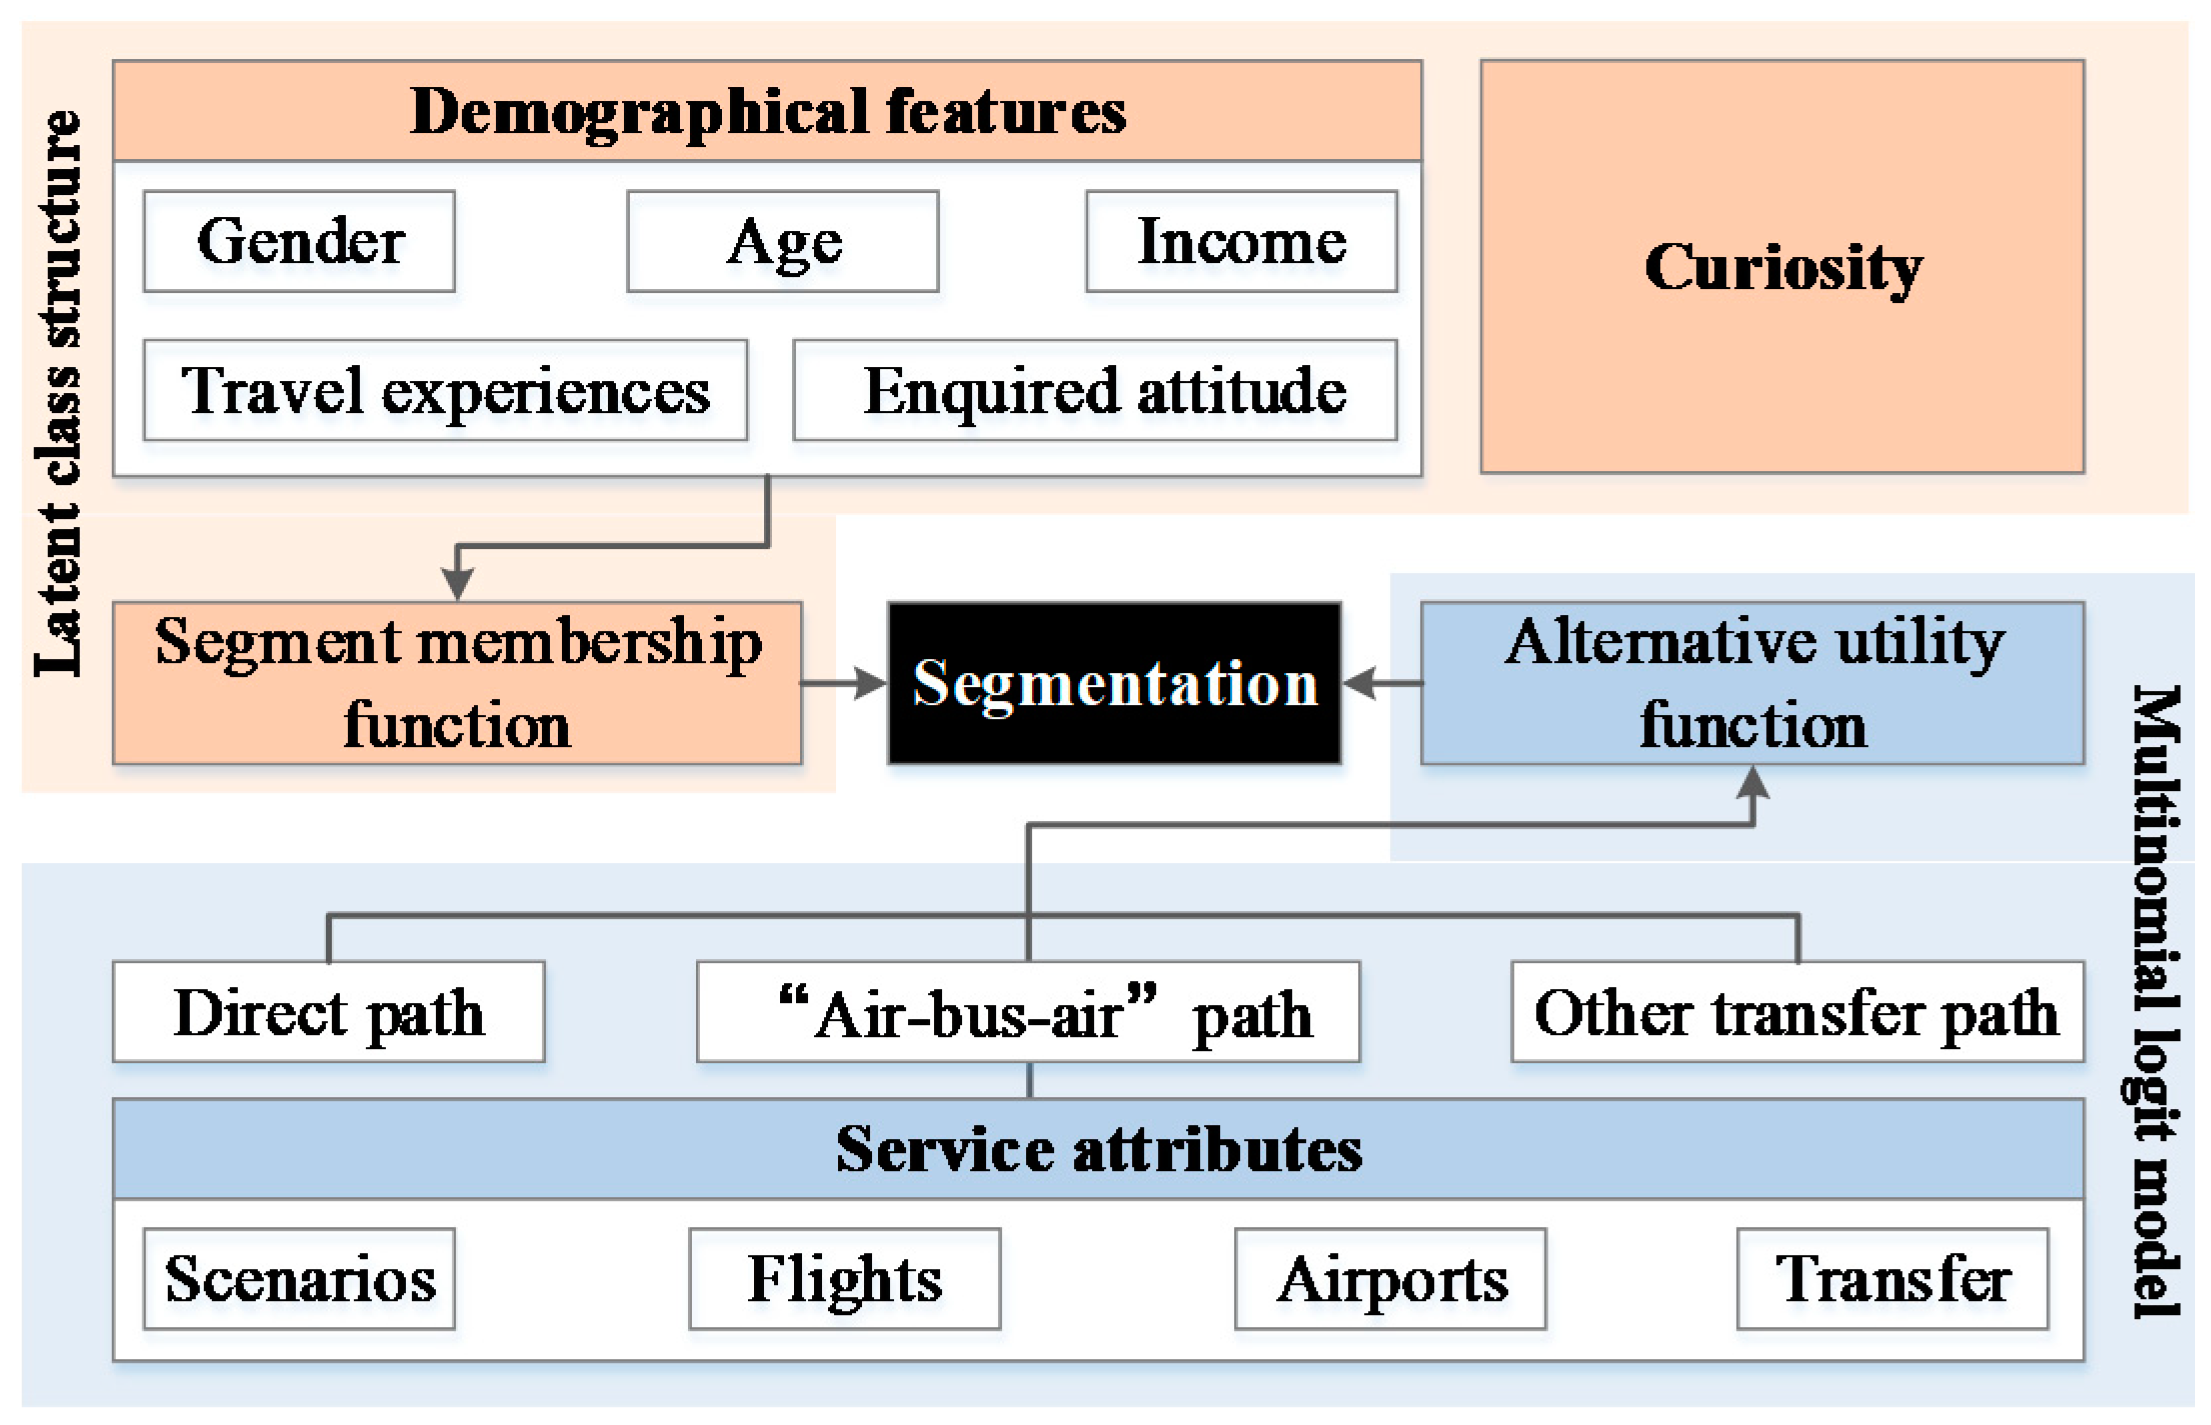
The conceptual framework of the latent-MNL model is described in
Figure 2. The demographical features and curiosity are listed as variables in the segment membership function within the latent class structure, while the utility functions of different alternative paths are composed of trip characteristics and service attributes.
The goal of our proposed model is to predict the probability of passenger
i belonging to segment
s, written as
p(
yis = 1).
yis = 1 if
i belongs to
s (
s = 1, 2, …,
S) and 0 otherwise. The relationship between
p(
yis = 1) and the choice probability of alternative paths is shown in Equation (1).
where
Pij|s(
xis = 1|
yis = 1) is the probability of passenger
i belonging to segment
s and choosing path
j (e.g., going directly to Hong Kong, transferring at Zhuhai Airport, or transferring at Shenzhen Airport).
xij = 1 when individual
i chooses path
j and is 0 when choosing other paths. Accordingly,
p(
j|
yis = 1) represents the probability that passenger
i who chooses path
j belongs to segment
s.
Based on discrete choice theory, the path utility function can be expressed as follows:
where
Uj|s is the utility of the
jth path of a passenger in segment
s,
Vj|s is the direct utility that can be observed,
αjs is a constant,
Zj is the observing attributes of the alternatives or the decision-makers, and
εj|s is the error component that is assumed to be IID (independently identically distribution).
βjs is the calibrated parameter. Accordingly, the probability for selecting path
j can be described by Equation (3).
The second part of the model measures the probability of passenger i being a member of segment s: P(yis = 1).
Let
Uis stand for the effects of passenger
i belonging to segment
s, which is expressed by Equation (4), where
mi donates a variable representing the demographical feature or curiosity of passenger
i and
γis is the parameter of
mi. The probability of passenger
i belonging to segment
s can be calculated by Equation (5):
where
S is the total number of segments. An expectation-maximization (EM) algorithm is designed here to estimate parameters
θis and
γis with respect to demographical features, trip characteristics, and curiosity. Finally, the probability of a passenger belonging to a given segment can be calculated.
Moreover, the segment number
S can be determined based on the performance assessment of different model specifications. The two widely used performance indicators,
AIC (Akaike information criterion) and
BIC (Bayesian Information Criterion), can be calculated by using Equations (6) and (7).
Here, LL is the maximum value of the log-likelihood in the estimation, K is the number of parameters in the proposed model, and N is the sample size. By setting different numbers of latent classes, the criteria can be used to evaluate the goodness-of-fit considering the effects of the number of parameters. Generally, BIC is recognized as a better criterion than AIC because the number of parameters has a larger punishment on the results.
4. Survey Design and Data Collection
To estimate the proposed model, a stated choice experiment was designed to collect passengers’ path choice preference in the context of international air travel with some general questions collecting individuals’ social and demographical features as well as their curiosity.
4.1. Survey Design
The first part of the survey was used to collect data about travelers’ demographical characteristics, including their gender, age, income, occupation, job position, and education level. Meanwhile, respondents were asked to record their air travel experiences, such as the air travel frequency in last year, the tolerance to the flight transfer times, whether they knew direct flights from the lived cities to Hong Kong airport, and whether they were aware of the Hongkong–Zhuhai–Macao Bridge. All the above features would be the variables of the segment membership function in the latent class part. The levels of the features are listed in
Table 1.
In addition, at the end of this part, we introduced the Hongkong–Zhuhai–Macao Bridge with a 2-min video. The video not only showed the grand view of the Bridge to the respondents who did not know it before but also created a conceptual stimulation which may cause respondents’ curiosity.
The second part of the survey was set to interview the differences in passengers’ curiosity. According to Litman, the willingness to know or explore a new place is a significant item in measuring curiosity. Hence, the direct way of testing curiosity of the Bridge was to ask the respondents about their intentions to visit the Bridge. However, in our opinion, such an item may lead to overestimation especially in the context in which the Bridge was highlighted several times in the questionnaire. In this circumstance, considering that curiosity is one kind of personality which may not change a lot across activities, we chose to interview respondents’ attitudes to new routes, new travel modes, new airlines, and new airports instead and thus to use passengers’ curiosity in travel behavior to deduce the potential curiosity of the Bridge.
Six items were created, the first two test the willingness to know or try new commute routes. In order to make the questions easy to reply to, we tested the relatively later awareness and exploration of the new routes by referring to methods about measuring innovations. Moreover, two items about the willingness to try an electric car and to share a bicycle as well as online taxis were listed in the questionnaire to test passengers’ curiosity of new travel modes. Finally, the last two items were used to evaluate curiosity in air travel. The six items listed below ask respondents how much they agree with each question, and the level of agreement is measured by a 5-point Likert scale: 1: absolutely agree, 2: agree, 3: sometimes agree, 4: sometimes disagree, and 5: absolutely disagree. Then, we calculated the average points of the six items for each respondent and used the result to value the variable “curiosity” in the segment membership function.
I am always the last one to be aware of a new commute route to my office compared to others;
I am always the last one to try a new commute route to my office compared to others;
I do not have much interest in purchasing an electric car;
I do not want to try bicycle sharing or online taxis;
I only choose designated airlines and do not want to try new ones even though they may provide much lower-priced air tickets;
I only want to choose familiar airports and do not tend to search for new airports in my travel planning.
The third part of the survey is a stated choice experiment; each respondent is invited to complete the experiment four times. In one experiment, respondents are asked to choose their travel path to Hong Kong Airport in the context of international air travel to foreign countries. The profiles of the experiment should be designed according to an orthogonal fraction design; the design procedure will be introduced in the
Appendix A. The procedure of the design will be shown in
Figure A1. The orthogonal fraction design will be shown in
Figure A2 and part of 128 profiles will be shown in
Figure A3. The correlation matrix will be given in
Table A1. Within the profile, four options are set: a direct path, a transfer path with stopover at airport A with the Bridge, a transfer path with a stopover at airport B, and none of the above. Each alternative is attributed to several variables with different levels of value. In the following, we will divide the variables into three parts: the environmental variables, the generic service variables, and alternative specific service variables.
Table 2 gives an overview of the selected variables about travel environment and their levels. When choosing the environmental variables, we firstly confirm the variable of “travel purpose”, commonly incorporated in the utility function [
49,
50]. Then, as “the decisions differ from destination to destination and from product to product” [
51], we highlight the “trip destination” in the survey because path choice behavior may be strongly affected by the final destination of the international trip. To be specific, the same air travel path with two transfers may be more acceptable for people flying to the US than those flying to Singapore (from China) because the total travel time to the US would be much longer and the direct flight is commonly more expensive. Third, a lot of literatures prove that the number of passengers traveling together has great impact on the route choice, especially in international air travel [
52]; we set it as the third environmental variable in our survey.
Then, we select the generic variables which are incorporated in the utility function of all alternatives; they are listed in
Table 3. The values of each level are determined as close as possible to the reality.
The alternative-specific variables are listed in
Table 4; the variable 18 is the airfare for the alternative of direct flight, and the others are for transfer flights. To be specific, because direct flights to Hong Kong are generally more expensive than transfer flights, two variables with respect to “airfare” are designed with different levels. In addition, the “transfer time” between two consecutive flights and the “luggage delivery” are incorporated to account for the unique needs of transfers in international air travel.
Other variables are designed to explain the characteristics of the bridge leg within the air–bridge–air path. The “customs check procedure” is an important variable that reveals the special cross-boundary procedure regulated by the “one country, two systems” policy between mainland and Hong Kong in China. The variable contains four levels, and each level is a procedure attributed to (i) whether travelers pass the customs check on coach and (ii) number of times travelers need to be checked by customs. For example, “get off coach and two times check” means passengers should get off the coach and go through the check point of customs by themselves twice, once when leaving the mainland and once when arriving in Hong Kong. In addition, the variable “path feature” denotes whether the alternative path includes the Hongkong–Zhuhai–Macao Bridge.
4.2. Data Collection and Descriptive Analysis
Taking our research topic into account, air travelers who lived in mainland China would be the largest body of passengers who may prefer the air–bridge–air path, so we need to cover as many cities as possible in the survey to collect the attitudes of travelers from different Chinese cities. However, the selection of cities should follow some criteria. First, we need to confirm that the cities were located over 800 km away from Hong Kong, that is, to guarantee that the respondents would prefer flying to Hong Kong than using high-speed trains or other modes. Second, we need to confirm that people in the selected cities have rich experiences of international air travel; hence, 22 provincial capitals with high international air travel demand in 2018 were chosen. Third, in order to analyze the path choice behavior in the cities with and without direct flights to Hong Kong, we kept the above two kinds of cities in the survey. Forth, the cities without connections to Zhuhai and Shenzhen airports are removed.
Finally, considering the difficulty of interviewing all the cities, we choose 11 cities: they are Changsha, Shanghai, Nanjing, Xi’an, Beijing, Wuhan, Kunming, Lanzhou, Yinchuan, Chengdu, and Xining. The international demand of the selected cities comprises 63.8% of the total international air travel demand in China in 2018 (Chinese Civil Aviation Year Book 2019). All the cities have flights to Zhuhai and Shenzhen airports (Xining has direct flights to Zhuhai in Summer), but three of them (Yinchuan, Xining, and Lanzhou) are not connected to Hong Kong airport. In addition to the 11 cities, Zhuhai is added for interviewing passengers who lived in other cities in China and, at the same time, have the experiences in choosing Zhuhai airport.
Totally, 12 cities were selected; the locations are shown in
Figure 3. We could see that the interviewed cities have covered almost all developed regions of mainland China and that the respondents in these cities would be the suitable sample in our research based on the above selection criteria. Meanwhile, 40% of questionnaires was delivered face to face in the airports of the selected cities (Pudong in Shanghai) and the rest (60%) was delivered online.
A total of 994 valid questionnaires were collected, containing 3976 sets of choice data: 8.6% of the sample was collected in Changsha, 11.2% was in Shanghai, 7.8% was in Nanjing, 8.2% was in Xi’an, 13.2% was in Beijing, 6.5% was in Wuhan, 7.3% was in Kunming, 6.8% was in Lanzhou, 7.9% was in Yinchuan, 6.2% was in Chengdu, 5.8% was in Xining, and 10.5% was in Zhuhai. A preliminary descriptive analysis was conducted. The percentages of women and men were 45.9% and 54.1%, respectively. Meanwhile, 7.3% of the respondents was in the age threshold of “younger than 22”, 23.5% was in “>22 and ≤30”, 36.8% was in “>30 and ≤40”, 18.7% was in “>40 and ≤50”, and 13.7% was over 50 years old. The age distribution indicates that passengers within the age range from 22 to 50 are the main consumers of civil aviation. For work status, only 4.3% of the respondents are not employed, 47.6% of them are company workers or merchants, 31.8% are civil servants, and only 4.3% are farmers. Within the employed workers, 45.6% are first-line officers and workers, 11.2% are top-level managers, and others were middle-level directors. From the data, the top-level managers always have a high education level, and we find that 70.1% of the passengers have a bachelor’s degree, showing the high education level of passengers of civil aviation. In addition, according to income distribution, 65% of respondents’ income concentrate in the range between 50 to 100 thousand RMB per year, stating that the respondents would be concerned a lot with the costs of travel.
According to the respondents’ travel experiences, 8.6% of them do not travel by air, 62.8% have 1–3 times of air travel experiences in 2018, 23.7% have 4–6 times of air travel, and 4.9% travel over 6 times in last year. Moreover, the latest travel purpose of 54.5% respondents is leisure or family visit and 46.6% is business, which is almost the same with the distribution of the assumed travel purpose in the SP survey (50% for business and 50% for leisure). Furthermore, within the respondents, only 34.7% of them know the direct flights to Hong Kong airport; others are not sure or are not aware of the direct flights. In this sense, we could deduce that respondents may be more objective in treating direct flights and transfer flights in the survey.
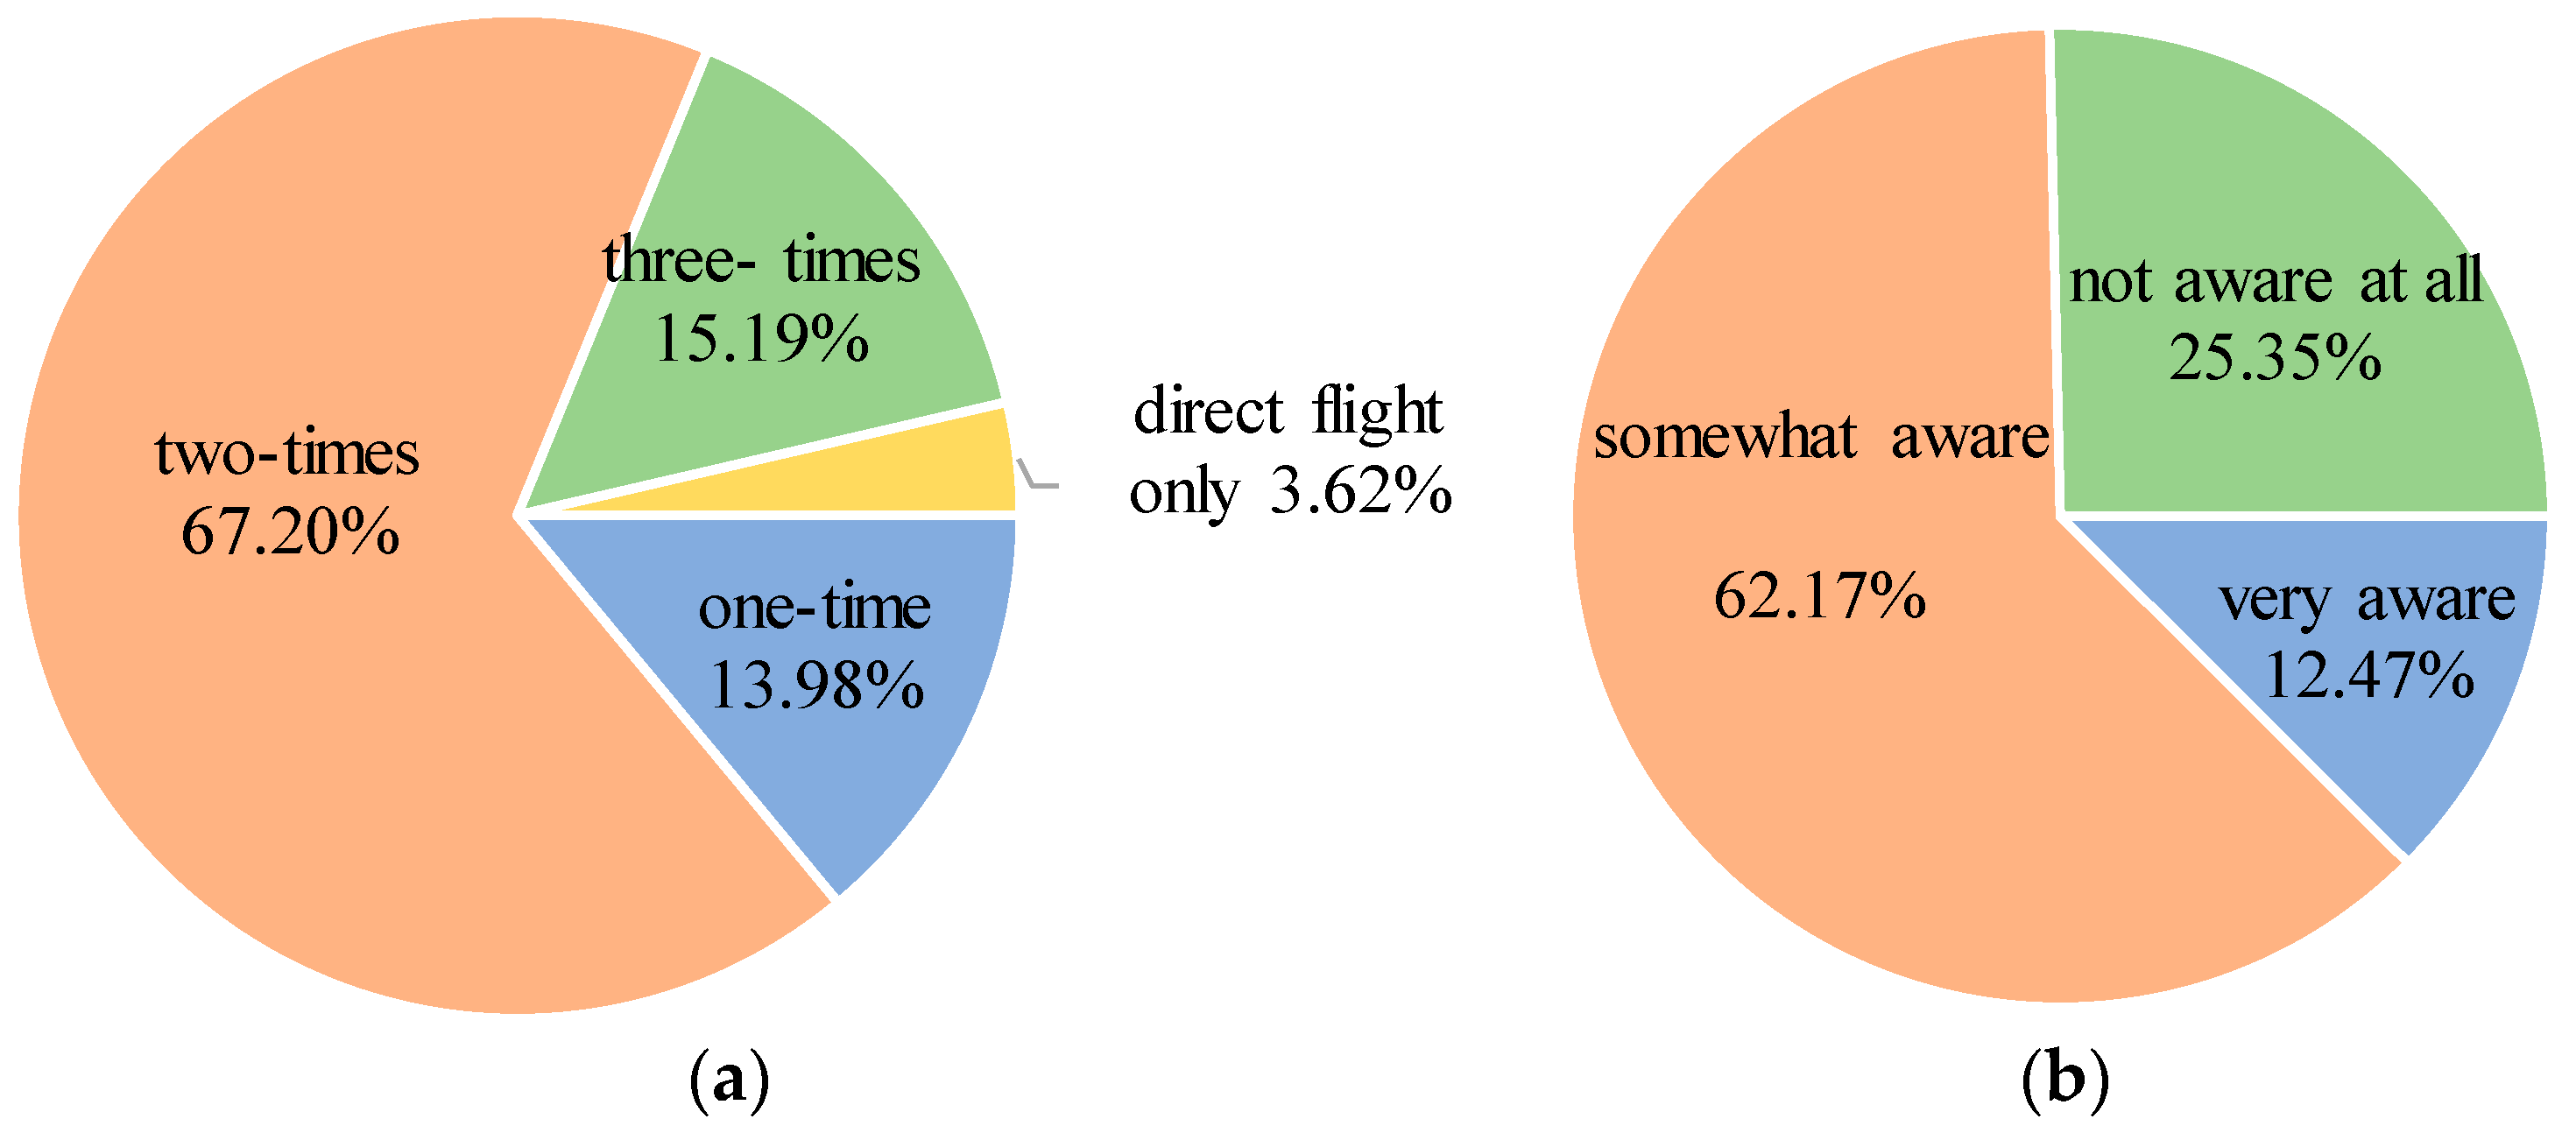
In addition, respondents’ acceptable number of transfers during flight trips and awareness of the Hongkong–Zhuhai–Macao Bridge are shown in
Figure 4. It is clear that 82.39% of the travelers can accept more than two but up to three transfers in a flight trip. This means that most passengers can accept the multiple transfers of the air–bridge–air path. Meanwhile, 74.64% of them are aware of the Bridge, indicating that the respondents can easily understand the multi-modal path composed of the two air legs and one Bridge leg.
On the basis of the second part of our survey, the distribution of respondents’ curiosity levels is shown in
Figure 5; the horizontal axis denotes the level of the curiosity, where the larger the number is, the stronger the predisposition to visit the Hongkong–Zhuhai–Macao Bridge is. It can be seen that travelers who have low, middle, and high levels of curiosity comprise 50.1%, 47.8%, and 2.2% of respondents, respectively.
5. Estimation Results
To determine the model specification with the best fit, we tested a variety of models by varying the segment number and segment membership function as well as the utility functions.
Table 5 summarizes 7 models with number of parameters, log-likelihood value (
LL),
AIC, and
BIC. The table is divided into two parts in terms of incorporating curiosity into the segment membership function or not. In each part, they are further distinguished according to the segment number. It can be seen that the values of
AIC and
BIC change with different model specifications. In the second category, “without curiosity”, the lowest
BIC appears when the segment number is 2; thus, Model 2 is the optimal one. For the category “with curiosity”, the
BIC decreases with increasing segment number, indicating that the four-segment model is statistically the best model. However, as more segments result in more parameters and smaller segment membership, which may cause instability in the logit model estimation, we finally chose Model 6, the three-segment model, as the best model specification in the second category.
The segment-specific estimation results are shown in
Table 6, in which the first “Utility function” part introduces the segment-specific choice model as well as the contribution of the level-of-attributes to path choice preference, and the second “Segment membership function” part specifies the segment sizes and lists the coefficients in the segment membership function. In the estimation, the “Non-travel” alternative and the last segment in each model are set as reference bases. In order to reduce the dimension of the data, the last level of the variable is set as the reference base in the estimation.
In the table, the second column demonstrates the results of nested logit model, the third and fourth columns show the coefficients of the two-segment latent-MNL model without incorporating curiosity, and the rest of the columns are for the three-segment latent-MNL model with curiosity. The MNL model is theoretically treated as an original benchmark in our paper; it can be found that the goodness-of-fit in terms of Rho-square and p-value significance are improved by using the latent-MNL model. Meanwhile, the incorporation of curiosity helps to distinguish the demand in a more practical way to identify the target market of the new gateway service provided by Zhuhai airport. The subsequent paragraphs will analyze in detail the segment-specific characteristics of passengers’ social demographic features, curiosity, and path choice behavior.
5.1. Segment-Specific Characteristics Estimated by Model 2
Without incorporating passengers’ curiosity, Model 2 distinguishes two segments that make up 26% and 74% of the sample. In the results, “Income”, “Air travel frequency”, and “Transfer tolerance” are the three significant variables; however, “Occupation”, “Bridge awareness”, and “Direct flight awareness” did not show significance on the segmentation. According to the positive and negative statuses of the coefficients, it is easy to find that “Air travel frequency” makes the largest positive contribution to the segment membership function, indicating that the air travel experience is an explicitly important personal feature affecting passengers’ path choice. “Income” has the second most important positive impact on grouping the passengers, which follows the common recognition that high-salary persons would afford more expensive travel modes. “Transfer tolerance” is the significant variable with a negative sign, indicating that passengers prefer direct flights to transfer ones. Regarding the choice behavior as well as social demographical features, the two segments are named as follows:
Model 2-S1 (business-type travelers): Travelers in this segment only account for 26% of the sample. Within the population, 77.5% of them travelled for business in their last trips in reality, so members in this group could be titled business-type travelers. According to the constants, the group members have the strongest preference for “direct flights” to Hong Kong. At the same time, compared to members in Model 2-S2, they have stronger negative attitude towards travel time but less concern on money costs; hence, they can be recognized as time savers. In this regard, the group members prefer shorter in-flight time as well as higher coach frequency connecting the flights. Meanwhile, the members are also concerned a lot with comfort during the trip. For instance, they show a significant preference for direct luggage delivery, which means that passengers do not need to carry heavy suitcases with them from one airport to another in international air travel. In addition, the coefficients of “custom check procedure” confirm that the simplified procedures of customs control significantly increase the choice probability of the new gateway service for business travelers.
Model 2-S2 (leisure-type travelers): Travelers in this segment comprise 74% of the sample data; the most significant feature of the segment members is that they prefer transfer flights. As 65.7% of the population travelled for family and leisure purpose in their last trips, we call the group members leisure- type travelers. Compared to the business-type travelers, they do not like the increase of air fare and even the price increment in transfer fees, so passengers in this group seem to have higher negative attitude to money costs. Furthermore, their negative attitudes to the air fare of direct flights would be much higher than that to the fees of transfer flights, which is due to the reason that direct flights are always more expensive than transfer ones. However, most coefficients related to travel time are not significant in estimation, indicating that the time value perceived by the passengers in this segment would be lower than that perceived by people in Model 2-S1.
Apart from the similar attitudes with the passengers in Model 2-S1 regarding luggage delivery and customs check, members in this group give additional consideration to “trip destination”. From the coefficients of different levels of this variable, we could see that leisure travelers do not like long-distance trips but business travelers in the other group do not care about the destination. Meanwhile, when taking the coefficients about travel time, travel costs, and trip destination into joint consideration, it could be found that the leading value of the transfer-flight utility over the direct-flight utility on the “China–Amsterdam” route may be larger than the value in the context of flying from China to Singapore. That is because the marginal increase of the negative attitude to air fare of direct flights is quicker than that of the transfer flights. From another perspective, the negative utility caused by long-distance trips should be offset by low travel costs especially for leisure travelers.
Moreover, when we check the constants of “Transfer A (Bridge)”, it can be found that all members of the two segments are with stronger inherent preferences to the path with Bridge than the normal transfer path. In this sense, we could deduce that curiosity would be a reason that causes the difference in the inherent preference. In addition, business travelers seem to be more inherently interested in the Bridge path and leisure travelers may also be concerned a lot about the “feature of transfer path” (with and without the Bridge). That is to say, people who are curious about the Bridge may existed in both segments. Therefore, in the following, we will introduce the market segmentation model incorporating passengers’ curiosity.
5.2. Segment-Specific Characteristics in Model 6
When taking into account passengers’ curiosity in travel behavior, Model 6 divides the market into three segments that account for 13%, 58%, and 29% of the sample. The pseudo R2 of the segment-specific path choice models in Model 6 are almost higher than those in Models 1 and 2, demonstrating that the proposed model incorporating curiosity has the advantage with data fitting over the existing approaches, especially when modelling the path choice preference to new routes. According to the results, the group of Model 6-S1 is composed of passengers with limited tolerance towards connecting flights, Model 6-S2 accommodates passengers who have high curiosity regarding the Bridge, and Model 6-S3 consists of travelers who are low fare seekers. As per the complexity of the segment-based characteristics, we will introduce the three segments in great detail in the following paragraphs.
Model 6-S1 (experienced direct-flight loyalists): The members of this group comprise 13% of the sample population. They are staunchly in favor of direct flights as per the highest alternative-specific constant and strongest negative attitude to “in-flight time”, so the group members could be called direct-flight loyalist. The formation of loyalty is due to several reasons, first is high income. To be specific, 73.6% of the group members are leadership managers, 32.7% of which could earn income over 400 thousand RMB per year, so they could afford the air ticket prices of direct flights. The second reason is due to the time value. As declared by the coefficients of the segment-membership function, the group members have the strongest negative attitude to flight transfer, that is because 35.1% of them need to travel more than 6 times every year, thus the direct flights which can provide quick and comfortable connections become the first choice. Third is because of the relatively low level of curiosity. People in this segment show less curious interests in their daily travel or air travel, the average degree of the statistical curiosity equals 1.6, which may be related to their age (75.4% of the members are over 40 years old). The fourth reason is because of their rich experiences in air travel, nearly all the respondents (95.1%) have the clear awareness of the direct flight from their lived cities to Hong Kong. Therefore, the group members would be precisely titled experienced direct-flight loyalist.
Due to loyalty, this segment seems not to be the target market of the new gateway service of Zhuhai airport. However, when checking the variable of “airfare to Hong Kong”, it could be found that the coefficient of level_3 is two times lower than that of level_1, indicating that travelers in this segment may also be concerned with money cost when the air fare is high. Thus, the group members may switch to the new gateway service when facing some expensive air routes. It needs to be pointed out that the members also have higher requirements on airlines’ service quality, for example, they request shortest connections between flights and frequent coach services, which can provide in-time surface transfer. Moreover, they will be attracted to perfect luggage delivery as well as the convenient custom check procedure. In other words, members in this group would pay more attention to the comfort during the trip. One interesting phenomenon is that the group members also care about the scene during the transfer because the coefficient of “path feature” is significant and larger than that of Model 6-S3. Summarized above, passengers belonging to S1 may tend to choose the air–bridge–path when direct flights are really expensive, but the service quality of the path would be the key to capture them in practice.
Model 6-S2 (bridge-curious travelers): The members of this group account for 58% of the sample population. Within the members, 54.5% of them are have a degree of curiosity over 3 and the average curiosity degree (3.4) is the highest value compared to those in other segments. Therefore, we could deduce that the group members have the strongest curious attitude to the Hongkong–Zhuhai–Macao Bridge. Due to curiosity, passengers in this segment show higher inherent preferences for “Transfer A (Bridge)” than other alternatives. Meanwhile, as the “path feature” in this segment is assigned with the highest coefficient in the estimation, the group members may possess the strongest intention to try the Bridge.
Moreover, we can find that the difference between the constants of “Transfer A (Bridge)” and “Direct flight” is much smaller than that between “Transfer B” and “Direct flight”, declaring that curiosity would increase the perceived utility of transfer flights through the Bridge. Meanwhile, Compared to S1, members in S2 show stronger negative attitude to the travel fare but lower negative attitude to the travel time. When going through the coefficients of all the variables, it is easy to know that members in this segment may take all attributes, such as money costs, time costs, and curious feel into joint account. That is to say, although with high degree of curiosity, they may switch to direct flights when the service of the air–bridge–air is not satisfied.
When we check the socioeconomical features of the group, 74.4% of members are in the age range between 22 and 40; 86.1% of them are employed, and 45% are middle-level managers with salaries over 100 thousand per year. More importantly, only 24.3% of the travelers may travel by air over 4 times every year; thus, passengers in this group may not be experienced travelers. As a result, they need longer connecting time between flights because they worry about missing the flights to foreign countries. In addition, the group members are not concerned a lot about luggage delivery but care a lot about customs check.
Summarized above, the Bridge-curious travelers will be attracted by the Bridge but they may also shift to direct flights because of high air fare, too-long transfer time, or unacceptable service quality. Therefore, they are potential customers of the air–bridge–air path; we should figure out appropriate strategies to capture them.
Model 6-S3 (low-fare seekers): The members of this group make up 29% of the respondents and have the strongest predisposition to use Zhuhai Airport for cheaper flights rather than for the new bridge or comfortable services. As these travelers are driven by the cheaper prices, we call them low fare seekers. As per the personal features, 56.6% of the group members lie in the age thresholds of ≤22 and >55, 13.8% of them do not have any job or are retired, 87.6% of the employed members are first-line workers, and the average salary may not exceed 100 thousand RMB per year. Moreover, the long-distance travel frequency is less than 3 times per year. Apart from the feature of low-fare seeking, members in S1 also have other segment-specific characteristics in the path choice. For example, the constants of the utility functions state that they prefer using transfer flights, they may also prefer the path with Bridge inherently, but the difference between the constants of two transfer flights is not that large as the one in S2. Therefore, we could say members in this segment do not show a favorite choice obviously.
Moreover, travel purpose seems to have weaker impact on the purchase decision than that it has in other segments, demonstrating that passengers in this group would choose the cheapest alternative regardless of the travel purpose. Furthermore, the group members may not be concerned a lot with the service quality such as luggage delivery, custom check procedure, and even the feature of the transfer path because low-cost and high service quality could not exist simultaneously. In general, members in S1 are attributed to low-fare seeking; thus, they might be treated as the stable target passengers of the new gateway service, as the main benefit of the air–bridge–air path provides low travel costs between mainland and Hong Kong in China.
In a summary, members in every segment would be potential customers of the new gateway service of Zhuhai airport. However, the marketing strategies would be different according to the segment-specific features. In the coming section, we will further discuss the appropriate strategies of the new gateway service.
6. Elasticity Analysis
Based on the segmentation results, we further calculate the segment-specific elasticity of the choice probability of the alternative paths to the changes in service attributes (airfare of a transfer flight, transfer time, customs check procedures, and coach frequency) in Model 6; the results are shown in
Table 7. We generate three alternative paths (P1 to P3) between Xi’an in China and Bangkok in Thailand.
With 1% increment in the airfare from Xi’an to Zhuhai, the elasticity value calculated for P1 and P3 is positive, indicating that some passengers would shift to other alternative paths if Zhuhai Airport could not provide competitive air ticket prices. In addition, passengers in S3 are distinctly price sensitive, and Shenzhen Airport would be an equally acceptable airport to them. Conversely, the group members in S2 may persist in using Zhuhai Airport because curiosity may encourage their desire to visit the Hongkong–Zhuhai–Macao Bridge.
“Transfer time” between two connecting flights is an important criterion in evaluating travel paths. It is found that passengers in both S2 and S3 are sensitive to a reduction in transfer time. Passengers in S1 seem insensitive, as they are staunch fans of the direct path. “Custom control procedure” is a new attribute here that did not appear in previous studies, revealing the complex customs control procedure in the transfer from Zhuhai Airport to Hong Kong Airport. In the elasticity analysis, we changed the level from “one time on coach” to “two times get off coach” and examined the choice responses. The results show that passengers in S2 may find it easier to accept the change, resulting from the stimulation of their curiosity. For “coach frequency”, the largest negative elasticity appears in S3 when choosing the alternative P2. It can be seen that curiosity also eases passengers’ inconvenience feelings regarding transfers.
Based on the elasticity analysis results, some tips about improving the new gateway service of Zhuhai Airport are summarized:
Keeping the advantages of lower airfare, especially for passengers in S3 who prioritize cheaper air tickets;
Optimizing the flight schedule to provide appropriate transfer times between two consecutive flights;
Simplifying the customs control procedures to attract more passengers who are interested in the new gateway service;
Some strategies should be applied to reduce the feelings of inconvenience during transfers, such as a bridge tours for passengers who are traveling for leisure.
7. Discussion
The results of elasticity analysis show the differences in the segment-specific attitudes to the changes in air fare, transfer time, coach frequency, and service quality, indicating that marketing strategies should be proposed on a group-based demand. However, it is too ideal to set the right strategy for each segment in reality; thus, we should figure out the most appropriate strategies based on the benefits of satisfying different segments. In order to calculate such benefits, the segment scale and segment-specific preferences should be precisely predicted using a well-designed market segmentation model. In this section, we want to verify the advantages of our proposed model in setting strategies for the air–bridge–air path compared to existing segmentation approaches.
From the elasticity analysis, we can see that the air ticket price is one of the most important elements affecting the demand of the air–bridge–air path. Meanwhile, a well-set pricing strategy would improve airlines’ revenue and increase passenger flow at Zhuhai airport. Hence, we want to firstly test the effects of the proposed model in optimizing the pricing strategy of the flights arriving at Zhuhai airport. In order to conduct the test, we design an experiment to compare the revenues as well as the passenger volumes of the flight from Nanjing to Zhuhai. In the experiment, we assume that 77 respondents in Nanjing in our survey will fly to Amsterdam, 55% for business and 45% for leisure. Four alternatives are provided according to the service information in reality, involving direct flight, transfer flight through the Bridge, transfer flight via Shenzhen airport, and none. The detailed information is shown in
Table 8.
Based on the above information, we fix the value of all service attributes of the alternatives except for the price of the “Nanjing–Zhuhai” flight and then use the surveyed personal features and the estimated Model 2 and Model 6 to predict the revenues as well as the sold seats of this flight with different pricing strategies.
Table 9 declares the results with two pricing strategies: 600 RMB and 700 RMB.
For each strategy, the passenger volume of the flight predicted by Model 6 is larger than that forecasted by Model 2, which demonstrates that the incorporation of curiosity would help catch passengers’ inherent preferences to the air–bridge–air path and may help avoid underestimating the demand of the new gateway service of Zhuhai airport. Hence, our proposed model has the advantage of precisely predicting the demand volume of the air–bridge–air path.
When using Model 2, 26 people are distinguished as business-type travelers and 51 are leisure-type travelers. Their choices under different pricing strategies are listed in columns 2 and 3. With the increment of the air ticket price, 4 passengers were predicted to leave and 300 RMB will be lost in total. By applying Model 6, 8 passengers are experienced direct-flight loyalists, 44 passengers are Bridge-curious travelers, and 25 passengers are low-fare seekers. According the choice results, 3 passengers will leave and, at the same time, the flight revenue increases by 1300 RMB. The success of strategy 2 is due to the reason that it captures the passengers who would pay higher prices for their curiosity. In other words, Model 6 would distinguish the right distribution of passengers with different segment-specific preferences to the air–bridge–air path. Therefore, our proposed model would have effects on improving airlines’ profits and airports’ passenger flow with its adoption in air ticket pricing for the gateway service.
Apart from “curiosity”, the other variable incorporated in our approach is the “in-flight time”, which donates the distance between the origin city and the transfer airport. As the flights obtained by different airports are not the same, some of the origin cities do not have direct flights to Hong Kong airport and others may have weak connections to Zhuhai airport. Therefore, we want to test passengers’ willingness to use the air–bridge–air path in different cities in China and thus to capture the target markets of the new gateway service of Zhuhai airport from a geographical perspective.
In the test, we set the “in-flight time”, “airfare”, and “volume of direct flights to Hong Kong airport” for each city using realistic data and then used our proposed model as well as the survey data to calculate the market segments and segment-specific preferences for different cities. The solid columns in
Figure 6 represent the aggregated probability of choosing Zhuhai airport when traveling for business, and the empty columns are the results for passengers traveling for leisure. The three divisions in each column mean the choice probability made by passengers in S1 to S3 of Model 6 in the bottom-up sequence.
In general, the probability of choosing the air–bridge–air path will decline with an increase in “in-flight time”; therefore, the highest probability appears in Kunming and the lowest one appears in Xining. However, the probability is affected by “airfare”; thus, the probability in Beijing is higher than that in Yinchuan, resulting from a much cheaper price of flights to Zhuhai Airport. Meanwhile, because the airfare gap between Nanjing–Zhuhai and Nanjing–Hong Kong is not distinct, passengers in S1 (those who prefer direct flights) and S3 (those who are price sensitive) seem not to be interested in the new gateway services. In addition, the results further prove that passengers in S2 have the highest predisposition to use the new gateway service offered by Zhuhai Airport, especially those in Xining, Yinchuan, and Lanzhou, from which there are no direct flights to Hong Kong.
With the above analysis, we could find that the demand for the air–bridge–air path may vary across segments and cities. In this sense, it is beneficial to incorporate the geographical variables into the market segmentation for helping distinguish the target cities in the development of the flight network of Zhuhai airport. In summary, the target markets of the new gateway service are located in two kinds of cities: those that do not have established air routes to Hong Kong Airport and those that have frequent and cheap flights to Zhuhai Airport. Therefore, to support the sustainable development of Zhuhai airport. which is confronted with a serious competition from nearby hubs, some new flights to the target cities should be added to thus improve its connectivity with mainland China. In a sense, Zhuhai airport would grow as the domestic feeder airport for Hong Kong airport through the air–bridge–air path.
8. Conclusions
Regarding the trans-strait linkage created by the Hongkong–Zhuhai–Macao Bridge, Zhuhai Airport tends to provide international travelers with a new gateway service through an air–bridge–air path. To identify the target passengers using the new gateway, this paper developed a market segmentation approach based on a latent-MNL model. The proposed approach synthesized demographic features, choice behavior, and curiosity. A survey that included a stated choice experiment was conducted in 12 Chinese cities to collect socioeconomic data and choice data.
In the model estimation, we tested the model specifications before and after incorporating the curiosity and finally obtained the segmentation results. Three groups were identified, titled experienced direct-flight loyalists, Bridge-curious travelers, and low-fare seekers. With a comparison to common classifications such as the “business-and-leisure” used in practice, our proposed approach could distinguish passengers according to their purchase predispositions derived from the curiosity of the new-show Bridge. Because of the precise segmentation, the estimated segment-specific purchase models had been proven with advantages over the MNL model for better fitness, indicating that the latent-MNL has advantages in predicting the choice behavior of the air–bridge–air path. Therefore, by constructing the latent-MNL model with careful variable selection as well as survey design, we found an effective way to identify the target market for the air–bridge–air path with unique surface connection.
To further explore the segment-specific preferences, the elasticity of the path choice probability to the change of service attributes was calculated. In addition to the airfare and transfer time, which were widely accepted as significant variables affecting air travel plans, “customs check procedures” and “coach frequency” were clarified as important elements that influence the air–bridge–air path choice. In addition, according to the elasticity analysis, some suggestions with respect to air ticket prices and flight schedule were proposed to satisfy segment-specific demands, thus improving the service quality of Zhuhai Airport.
Furthermore, as the incorporation of curiosity helped distinguish novelty-seeking passengers from those who were distinctly price sensitive, the pricing strategies set based on the market segments classified by the proposed model could avoid underestimating the price tolerance of curious travelers. In this sense, our proposed model could help improve the pricing strategies related to the air–bridge–air path for attracting more passengers as well as increasing the flight revenue. Moreover, the origin city location and the flight network were also found to be important for the market segmentation in the discussion; this helped Zhuhai airport to plan new flights to support their sustainable development. With geographical information, we identified the cities that could be treated as the target markets of Zhuhai Airport. The results showed that the target cities may have two distinct features: one was lacking direct flights to Hong Kong and the other was having cheap and frequent flights to Zhuhai Airport.
However, there are some limitations in our work. First, the risk of overestimation exists in our research for the SP survey data, so we will try to collect real travel data for comparison. Second, the pricing strategy setting may be more complicated than we discussed in the discussion part and the change in revenue would vary with the price difference between the direct flight and transfer flight, as we just used the experiment to reveal the function of our proposed model. Meanwhile, respondents seem to be more sensitive to the lowest or highest levels for some specific price variables in
Table 6, which could be understood as a nonlinear situation in the estimation; we will work on finding out the reason that leads to this nonlinear situation. Besides, in future research, we could also design the flight network between Zhuhai airport and the target cities and could optimize the flight schedule of Zhuhai and Hong Kong airports, with the purpose of establishing better marketing strategies for the air–bridge–air path based on our proposed model.


