Article

A Hybrid GIS and AHP Approach for Modelling Actual and Future Forest Fire Risk Under Climate Change Accounting Water Resources Attenuation Role

by
Gianluigi Busico
1,*,
Elisabetta Giuditta
1,
Nerantzis Kazakis
2 and
Nicolò Colombani
3
1
DiSTABiF—Department of Environmental, Biological and Pharmaceutical Sciences and Technologies, Campania University “Luigi Vanvitelli”, Via Vivaldi 43, 81100 Caserta, Italy
2
Department of Geology, Laboratory of Engineering Geology Hydrogeology, Aristotle University of Thessaloniki, 54124 Thessaloniki, Greece
3
Department of Materials, Environmental Sciences and Urban Planning, Polytechnic University of Marche, Via Brecce Bianche 12, 60131 Ancona, Italy
*
Author to whom correspondence should be addressed.
Sustainability 2019, 11(24), 7166; https://doi.org/10.3390/su11247166
Submission received: 2 October 2019 / Revised: 18 November 2019 / Accepted: 6 December 2019 / Published: 14 December 2019
(This article belongs to the Section Environmental Sustainability and Applications)

Abstract

:
Forest wildfires usually occur due to natural processes such as lightning and volcanic eruptions, but at the same time they are also an effect of uncontrolled and illegal anthropogenic activities. Different factors can influence forest wildfires, like the type of vegetation, morphology, climate, and proximity to human activities. A precise evaluation of forest fire issues and of the countermeasures needed to limit their impact could be satisfactory especially when forest fire risk (FFR) mapping is available. Here, we proposed an FFR evaluation methodology based on Geographic Information System (GIS) and the analytic hierarchy process (AHP). The study area is the Campania region (Southern Italy) that, for the last 30 years, has been affected by numerous wildfires. The proposed methodology analyzed 12 factors, and AHP was used for weight assignment, offering a new approach to some parameters. The method divided the study area into five risk classes, from very low to very high. Validation with fire alerts showed a good correlation between observed and predicted fires (0.79 R2). Analyzing the climate projections, a future FFR for 2040 was also assessed. The proposed methodology represents a reliable screening tool to identify areas under forest fire risk, and can help authorities to direct preventive actions.

1. Introduction

Fires can be considered as an abiotic and natural ecological factor whose characteristics are different according to the various terrestrial ecosystems. Wildfires represent a globally important and a fundamental process of many ecosystems, such as the Mediterranean area, playing a key role in ecosystem dynamics, and in the retention of species that have evolved in response to fire [1]. Most wildfires are natural processes, triggered mainly by lightning, more rarely by volcanic eruptions and spontaneous combustion, and represent one of the primary ecological change agents across the forests [2]. However, forest fires are also triggered by anthropogenic factors and several causes of anthropic wildfires have been identified, such as: (i) culpably, namely related to carelessness or negligence; (ii) arson, associated with the will of individual to obtain personal benefits, and (iii) unknown, not easily linkable to a specific cause [3]. The human influence on forest fires is also well documented in studies of contemporary fire patterns, where fire management activities and land use changes have been implicated [4], as well as the role of humans in changing the pattern, season, and frequency of fires through human-caused ignitions [4,5]. Growing fire problems, especially in forests, has prompted investigation into alternative approaches for preventing and reducing forest fire risk (FFR), such as land use planning, the creation of areas of defensible space adjacent to structures in fire-prone areas [3,6], and prescribed burning [7,8,9]. However, it is important to highlight how these preventive techniques are meant to be applied in natural fire-prone areas, so it is necessary to screen accurately the forest area subject to risk of fire [10,11]. Therefore, to be able to accurately intervene in cases of FFR prevention, it is mandatory to know the correct location of areas subject to risk of fire. It is possible to provide an FFR map and thereby to minimize the fire frequency and eventually avert damages [11,12]. A precise evaluation of forest fire problems and of the countermeasures to be applied can be satisfactory when FFR mapping is available [11]. The knowledge of the spatial distribution of areas under fire risk has become necessary to improve fire prevention strategies and tactics [13]. In this context, geographical information system-based (GIS-based) FFR assessment could represent a powerful tool [14]. Different approaches have been proposed for the modelling and assessment of FFR and behavior. The most applied are physics-based method like FIRETEC [15] and LANDIS-II [16], and statistical methods. The latter are often combined with GIS tools [17,18] and include different methodologies, such as multiple linear and logistic regression [11,19,20], fuzzy logic, and weight of evidence [21] among others. Each one of these methodologies suffers from some problems, e.g., physical methods can simulate potential fire behavior through a set of mathematical equations, but are more suitable for small areas, because they require very detailed information. Statistical methods, instead, can be applied to large areas and are easier compared to the other methods, but in some cases, due to the lack of linearity of the fire regime, erroneous results could occur. To eliminate these drawbacks, it is essential to use different types of factors related to fire ignition and behavior with the same spatial resolutions. On the other hand, the use of spatial data with different ages, scales, and resolutions can bring uncertainties and imprecisions in the FFR assessment [22,23,24]. In many countries, such as China [25], Spain [26], France [27], Brazil [18], Portugal, Corsica, and Greece [28,29], these tools have been successfully used and incorporated in forest management plans. Also, for the Italian peninsula, some studies have been realized. For instance, Semerato et al. [30] assessed the vulnerability to fire during the summer period in the Apulian region (South Italy) using a fuzzy logic system, and Poldini et al. [31] analyzed the fire damage to different types of vegetation, integrating phytosociological maps of vegetation, geomorphology, and climate.

1.1. Factors Influencing Fire Ignition and Behavior

There are many factors influencing fire occurrence in forests in terms of fire ignition and fire behavior, including climate, vegetation (or land cover), topography, human activity [32], and soil texture [11,33]. Climate is surely one of the main agents responsible for fire ignition, while mean annual temperature and precipitation were commonly used as climatic variables for fire regimes as they are the main parameters that control fuel moisture content and the general characteristics of climate conditions [32,34]. Indeed, an important variation of air temperature can affect the severity and frequency of forest fire and, together with the modification of soil moisture induced by rainfall variation [35], can further change the fire behavior. Climate projections for future scenarios have shown a worldwide temperature increase and a higher frequency of extreme climate events, e.g., rainstorms, which could further aggravate the current FFR due to lighting. Indeed, for certain regions, extreme climate events have shown a great impact on forest fire activity [36]. The type of vegetation, as land cover type, has been shown to be especially relevant as a factor influencing fire ignition, together with climate variables [37]. Vegetation types differ in fuel loads and flammability as well as on fuel continuity [38,39]. Topography, in terms of elevation, slope, and aspect, directly influences vegetation composition and fuel structure and often determines where and why fires will occur and spread [32,40]. Topography is an important factor that influences both fire ignition and behavior. Indeed, slope is the primary factor for fire progression because it will define the fire velocity. The fire will travel faster if the slope is steeper [41]. Thus, elevation is the main parameter that influences precipitation, temperature, humidity, and evapotranspiration [42]. Regarding aspect, it influences soil moisture and wind speed, which are strongly linked to fire behavior [43]. Moreover, human activities can directly affect fires in terms of ignition or suppression [44,45], and can also indirectly induce changes in fire occurrence by modifying the spatial pattern of vegetation [46]. The latter is also correlated to the spatial distribution and density of fires too [47].

1.2. Aim of the Research

In this study, a hybrid FFR methodology was produced whereby factor weights were assigned with the analytic hierarchy process (AHP) to 12 chosen parameters and validated using the forest fire alarm of the moderate resolution imaging spectroradiometer (MODIS) database for 2018–2019. The methodology has the object to assess the global FFR, involving in the evaluation 12 parameters responsible for fire triggering and behavior. The use of AHP can overcome the problem of subjectivity in weight assignment. Contrary to the other FFR applications performed around the world, here, a new way to consider the risk associated with the distance to water courses was proposed for the FFR assessment and was then compared with previous literature assumptions. The distance from water courses has been considered an attenuating factor for FFR, reducing the probability of fire ignition and modifying fire behavior. Moreover, among the chosen parameters, climatic factors like temperature and precipitation are mainly subject to future changes. So, using climate projections for temperature and precipitation in the Mediterranean region, an FFR assessment was also provided for 2050.

2. Study Area

The study area is the Campania region (Figure 1) in the Southern Italian Peninsula, with a total area of 13.595 km2. The main regional boundaries are the Central Apennine Chain to the West and the Tyrrhenian Sea to the East. Morphologically (Figure 1b), the Apennine Mountains domain the region, with a maximum height of 1880 m above sea level (a.s.l.), and by two large flat coastal plains, the Campana and Sele plains. These two plains also host the main rivers and canals and are characterized by large land reclamation works. This region has a typical Mediterranean climate with a cold winter and dry summer. Wet summers characterize the coastline while severe winters are specific to the mountainous area. Large differences of temperature occur between the mountainous and coastal zones. Indeed, the maximum and minimum temperatures can vary 6–8 °C between the mountain peaks and the coastal plains [48,49]. The mean annual rainfalls range from 800 to 2000 mm depending on the area and show clear differences in terms of elevation and proximity to the sea. The highest precipitation amounts occur in the Apennine chain, with values of 1200–1500 mm/year, up to 2000 mm/year. Lower values are registered in the coastal plains, with values around 800 mm/year [50]. From a geological point of view, the region is mainly made up of sedimentary and volcanic rocks. With respect to the land cover (Figure 1c), agricultural fields cover more than 50% of the territory and are mainly located in flat areas, followed by forests which occupy around 30%, covering 4800 km2, and urban settlements. Regarding the forest species, the coastline and lower altitudes are characterized by Mediterranean shrub, where oak holms are the predominant species, as well as pine plantations. Following the increase in altitude, oak tree, mixed forest, and beeches can be found, in sequence. The Campania region has been subject to about 900 forest fires per year between 1990 and 2017, and most of these fires were recorded in the summer period from June to September [51]. A particularly dramatic year for the number of forest fires was 2017, with 1199 fires which burned 17,694 hectares of forests, the highest total yearly number of hectares of forest burned since 2007 [52]. Moreover, in the last two years (2018–2019), data from Moderate Resolution Imaging Spectroradiometer (MODIS) Active Fire Data [53] has shown over 1400 fire alerts only in the Campania region (Figure S1). For this reason, attention was again focused on forest fires in the Campania region in terms of actions to prevent FFR. In addition, the Campania region hosts 3400 km2 of sites under special protection (Natura 2000) and 90% of these are occupied by forests. For example, three protected areas in the Campania region that are dominated by pine plantations and have been classified as highly vulnerable to fire are: Castel Volturno Nature Reserve, Cilento, Vallo di Diano e Alburni National Park, and Riserva Statale Tirone, Alto Vesuvio in the Vesuvio National Park. In these areas, several forest fire prevention measures have been carried out from the early 1990s to 2015 in order to reduce FFR, especially during the summer months.

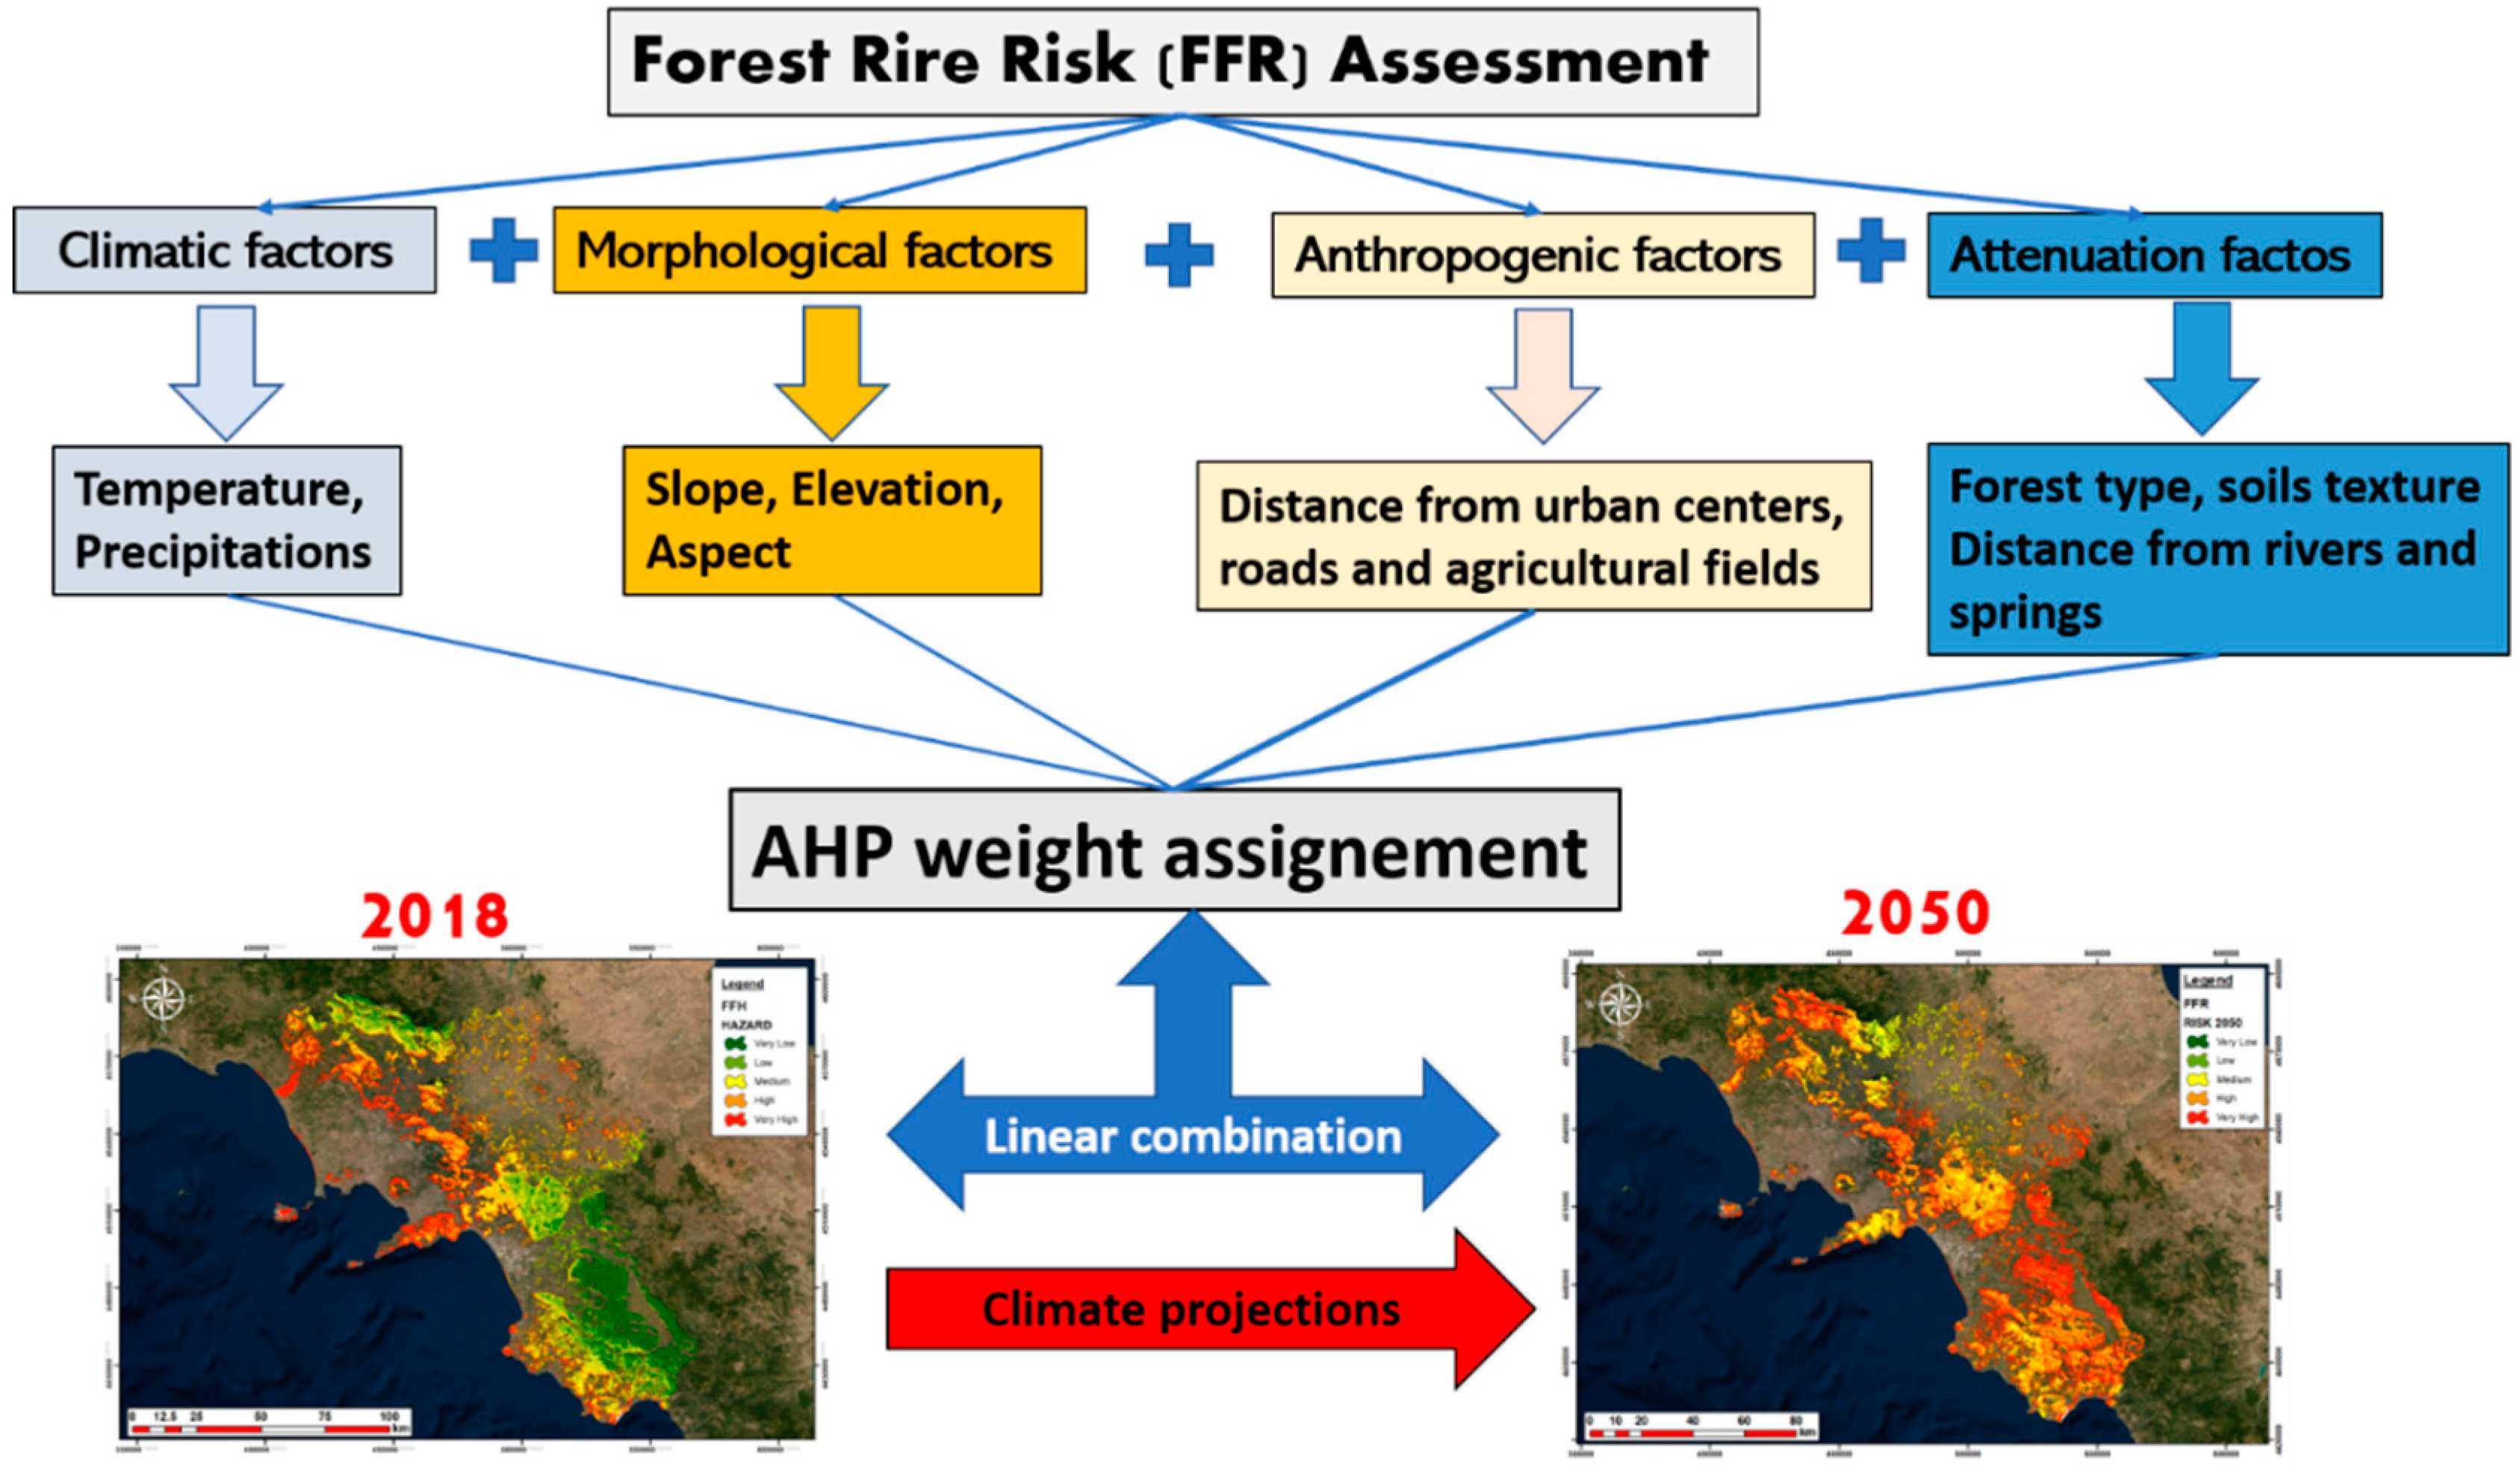
3. Material and Methods

3.1. Data Collection

A complete geo-database has been built collecting data from local authorities to perform the FFR assessment. Data were collected in shapefile format and then converted into a raster image using “topo to raster” function tool in ArcGIS 10.2 with a cell resolution of 20 × 20 m. A complete list of the collected data and the respective sources is shown in Table 1. The morphological factors including slope degree, slope aspect, and elevation were all produced starting from a digital terrain model (DTM) with a resolution of 20 m. Climatic data for the realization of temperature and precipitation maps were obtained by analyzing 14 meteorological stations located in the Campania region, and these are available online from the Ministry of Agriculture website [54]. The mean value of precipitation and temperature, calculated for the two periods 1990–2018 and 2030–2050, were used for the actual and future assessments. In this case, the raster was produced interpolating the punctual data using ordinary kriging technique starting from point measurement and retaining always a resolution of 20 × 20 m. In this work, the distance from urban infrastructure, roads, springs, water courses, and agricultural fields was also considered. Euclidean distance was calculated in ArcGIS 10.2, producing a raster file reflecting buffer zones of 100, 200, 300, 400, and over 500 m, and then classified. Forest type and vegetation cover, representing the fuel material, were recorded using Corine Land Cover (CLC) classification of 2018, and classified according to six forest classes. The location of 118 springs were taken from the online dataset of ARPAC [55] together with the shape file of the main perennial water course (Campania’s main rivers). Finally, soil textures were extracted analyzing the soils classification from “I Sistemi di Terre della Campania” [56].

3.2. Assignment of the Parameters’ Weight

With the help of a weighted hierarchical analysis (Analytical Hierarchy Process—AHP) method developed by Saaty [60], a comprehensive measurement of each factor was determined by giving priority to, and classifying the variables in a pairwise comparison scale, and then defining a linear hierarchy of importance among the factors (precipitation (PCP), temperature (TMP), altitude (ELV), slope (SLP), aspect (ASP), soil (SOL), forest type (FRS), distance from roads (ROD), distance from settlements (URB), distance from agricultural fields (AGR), distance from water courses (WTC), and distance from springs (SPR)). The parameters are ranked according to their relative importance, and hence their weights can be determined. In order to provide a variable hierarchy, a preliminary weight has been attributed to each factor based on their different impact on FFR. The importance values assigned to a factor strictly interfere with the outcome, so this is considered the most important step in the entire process. Initially, the pairwise comparison was obtained in a 12 × 12 matrix in which the diagonal elements are equal to one. The values of each row correspond to the importance between two parameters. The preliminary weight assignment to define the relative importance among the parameters were decided consulting the available literature. The main assumption was to give a higher weight to the bio-physical factors (forest type, slope, aspect, temperature, precipitation), according with Amalina et al. [14] and Pouthagy et al. [11] who analyzed the influence of variables on FFR using different data mining techniques, and stated how rainfall, temperature, and land cover were the most important parameters, followed by slope and anthropogenic factors. Wu et al. [32] similarly clarified that fire regimes at the regional scale are strongly linked, mainly to climate, vegetation, topography, and then human activities. Relative weights of each parameter have been assigned considering these findings. Hence, TMP is equally important as PCP, however, it is much more important than SOL and ELV. The lower impact of elevation is because its effect is considered yet inside the climatic and vegetation factors. After the pairwise comparison, the values were normalized, and the weights of each parameter were estimated. The consistency of the application was checked using the consistency ratio (CR), according to the following equation:
CR = CI/RI
where RI is the random index and CI is the consistency index. The consistency ratio has been calculated CR = 0.09, which is lower than the threshold (0.1), and hence the consistency of the weights is affirmed. In Saaty [60], details for the analytical hierarchy process application can be found. The pairwise comparison of the criteria significance and the weights are shown in Table 2.

3.3. Sensitivity Analysis

The proposed FFR methodology was further validated using a single parameter sensitivity analysis (SA) [61]. SA supports the researcher to analyze the significance of subjectivity components and produces useful information on the importance of weighting values assigned to the corresponding parameters. SA has been widely used and proposed to validate index and rating methods in different fields of study, including FFR assessment [62,63,64,65,66]. The effective weighting was calculated using the following equation:
W = ( P r P w V ) × 100
where W is the effective weighting of each parameter, Pr is the rating value (single parameters map), Pw is the weighting value assigned with AHP, and V is the overall value of the applied index (final FFR map). The SA was applied for 2018 and 2050 analysis to investigate the changing weight of the single parameters while retaining the same Pw.

3.4. Forest Fire Risk Assessment

In this study, different parameters have been considered as the main factors controlling FFR. Among these, morphological characteristics of the study area, are the main FFR’s parameters controlling fire behavior and ignition [10,40,67,68]. The impacts of slope are mainly related to the fire behavior, while aspect and elevation mainly affect ignition. Climate, instead, is considered a key cause of fire triggering [34,69]. Temperature and precipitation are mainly responsible of fire ignition. Another parameter responsible for fire ignition is land cover, which represents the primary fuel material [70]. Together with the aforementioned parameters, human activities and anthropogenic infrastructures can have a big influence on FFR too. In the anthropogenic factor, all the human activities that can trigger fires are taken into account, like roads and settlements [43]. An increased risk was associated with a decreased distance from anthropogenic factors, because easily accessible areas are characterized by a high risk for both criminals and unintentionally triggered fires. Distance from water courses and springs are other common parameters utilized for the assessment of FFR [71]. They are usually classified in the anthropogenic factors because human activity, like the presence of camps near riversides and springs, can affect the occurrence of forest fires. So, usually, the risk connected to water courses and bodies is considered higher as the fire approaches the water system. In this work, however, the presence of water is seen as a mitigation factor, since surface waters can influence the soil’s moisture, thereby reducing the risk of fire. Thus, in this work, the risk has been considered inversely proportional to the distance from the water courses (rivers) and springs. Finally, soil texture was also considered an indicator of fire behavior [35]. The FFR empirical model was developed according to Equation (3), and it is based on the statistical weights for each variable calculated with AHP.
FFR = 0.27 × ELV + 1.22 × SLP + 0.44 × ASP + 1.88 × PCP + 1.22 × FRS + 1.88 × TMP + 0.44 × ROD + 0.75 × AGR + 0.75 × URB + 0.44 × WTC + S0.44 × PR + 0.27 × SOL
where ELV is elevation, SLP is slope, ASP is aspect, PCP is precipitation, FRS is forest type, TMP is temperature, ROD is distance from main road, AGR is distance from agricultural field, URB is distance from settlement, WTC is distance from main water course, SPR is distance from springs, and SOL is soil texture. Each parameter has been classified into five risk classes, namely very high, high, medium, low, and very low. Classes and ratings are shown in Table 3 and a general conceptual model is shown in Figure 2. Elevation and slope were classified using equal interval according to site characteristics, for example, considering elevation, there was a general tendency of higher fire ignition risk at lower elevations [72]. Aspect, instead, was classified according to current literature [18,25,73] considering common patterns of a lower ignition risk in northern aspects. The land cover was classified attributing a higher risk to grassland and conifers, together with pine plantation, medium risk to broad leafed forest, and lower risk to mixed forest according with You et al. [25]. The climatic factor was classified using equal intervals according to site characteristics, following the general assumption that a lower risk is connected to lower temperatures and higher precipitation. Meanwhile, a higher risk was related to higher temperatures and lower precipitation.

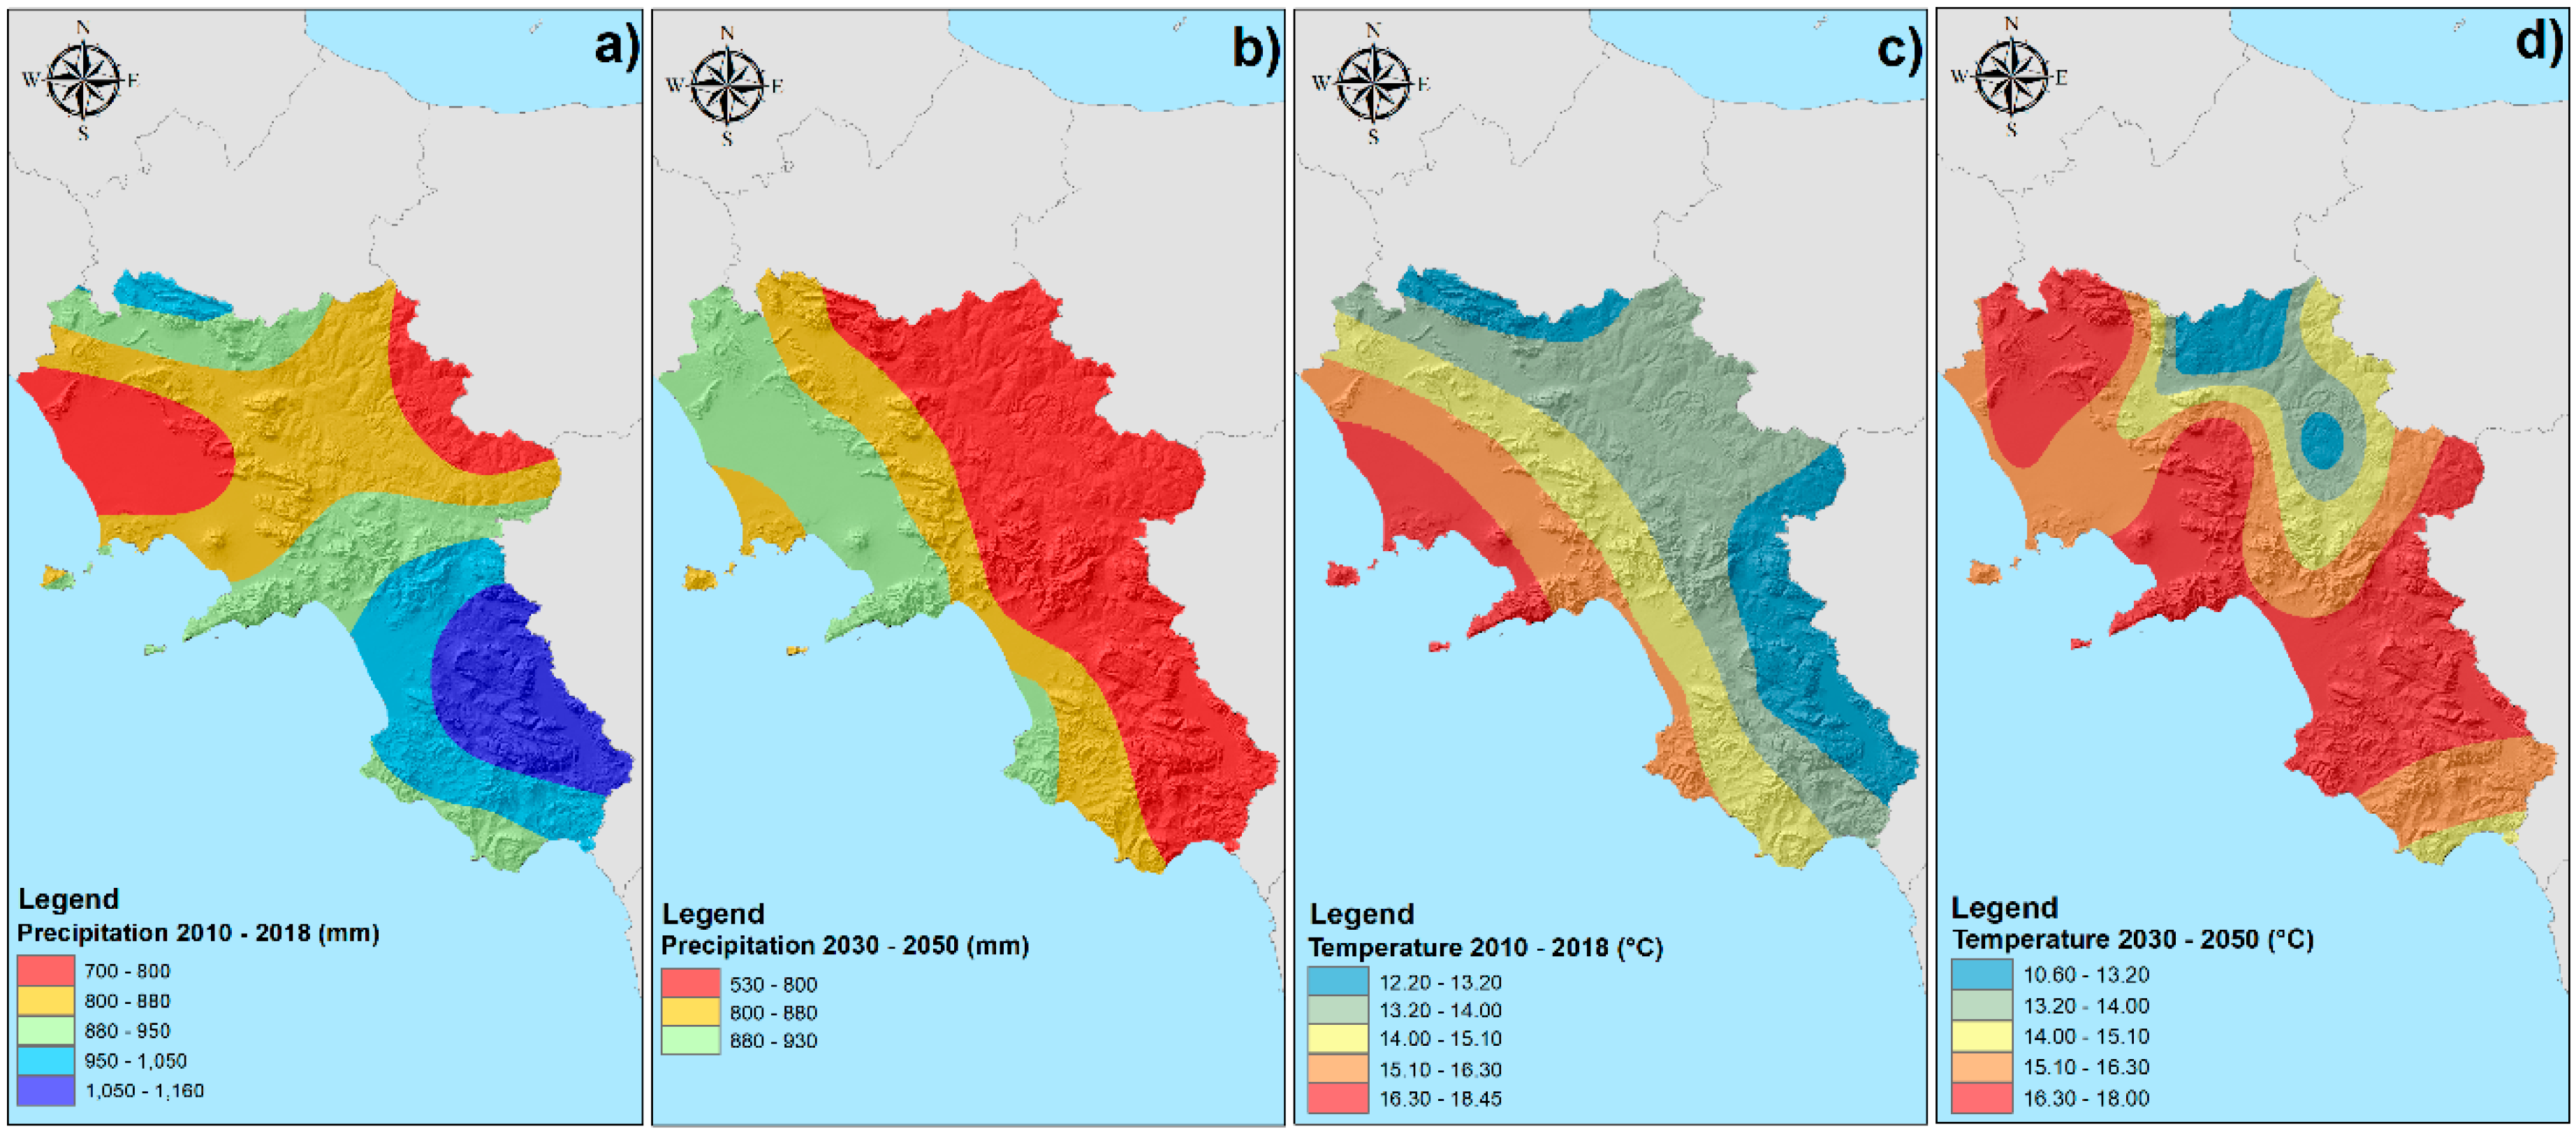
3.5. Climate Predictions

In Italy, climate parameters like temperature and precipitation have been and will remain subject to severe changes in the coming years [74]. To verify the impact of future climate change on FFR, temperatures and precipitation, predictions from the EURO-CORDEX [59] database have been taken into consideration. The data was downloaded using ICHEC-EC_EARTH system model under EUR 11 domain. The reference period was 2030–2050 under RCP4.5 scenario, which is the most likely scenario used in predictive models. Twenty grid points, chosen inside the region (Figure S1), were used to obtain the climate projection of temperature and precipitation. The data were obtained in monthly average values for both precipitation and temperature for the chosen period. Generally, for the Mediterranean basin, a general average increase of 1.5–2.0 °C of temperature has been predicted, with markedly high temperatures during the summer period [75,76]. Regarding precipitation, a general decrease is also forecast with a markedly seasonal regime, i.e., a large decrease of precipitations during the summer period and a slight increase during the winter period [77]. Moreover, an increase of extreme events, like intense storms or extended drought periods will be likely to happen and these factors could negatively influence FFR [78]. In Figure 3, the actual (1990–2018) and future (2030–2050) climate projections for the Campania region are presented. In Figure 3a,b, it is possible to appreciate how the amount of mean precipitation will decrease from a minimum of 700 mm/year to 530 mm/year, and from a maximum of 1200 to 930 mm/year. The spatial distribution suggests an unchanged situation for Campania’s plains, wherein the amount of precipitation will remain stable at around 800–900 mm/year. Menawhile, in the mountains, the precipitation will become less abundant. Regarding the temperature, minor changes will happen, recording a variation of ±1–2 °C. Nevertheless, the temperature distribution will experience large changes. In fact, the mountainous zone will record higher mean temperatures 16 °C, where actual temperatures are between 13 and 15 °C. Higher temperatures and less abundant precipitation can generate favorable conditions for fire triggering, and in areas normally characterized by a low fire risk.

4. Results

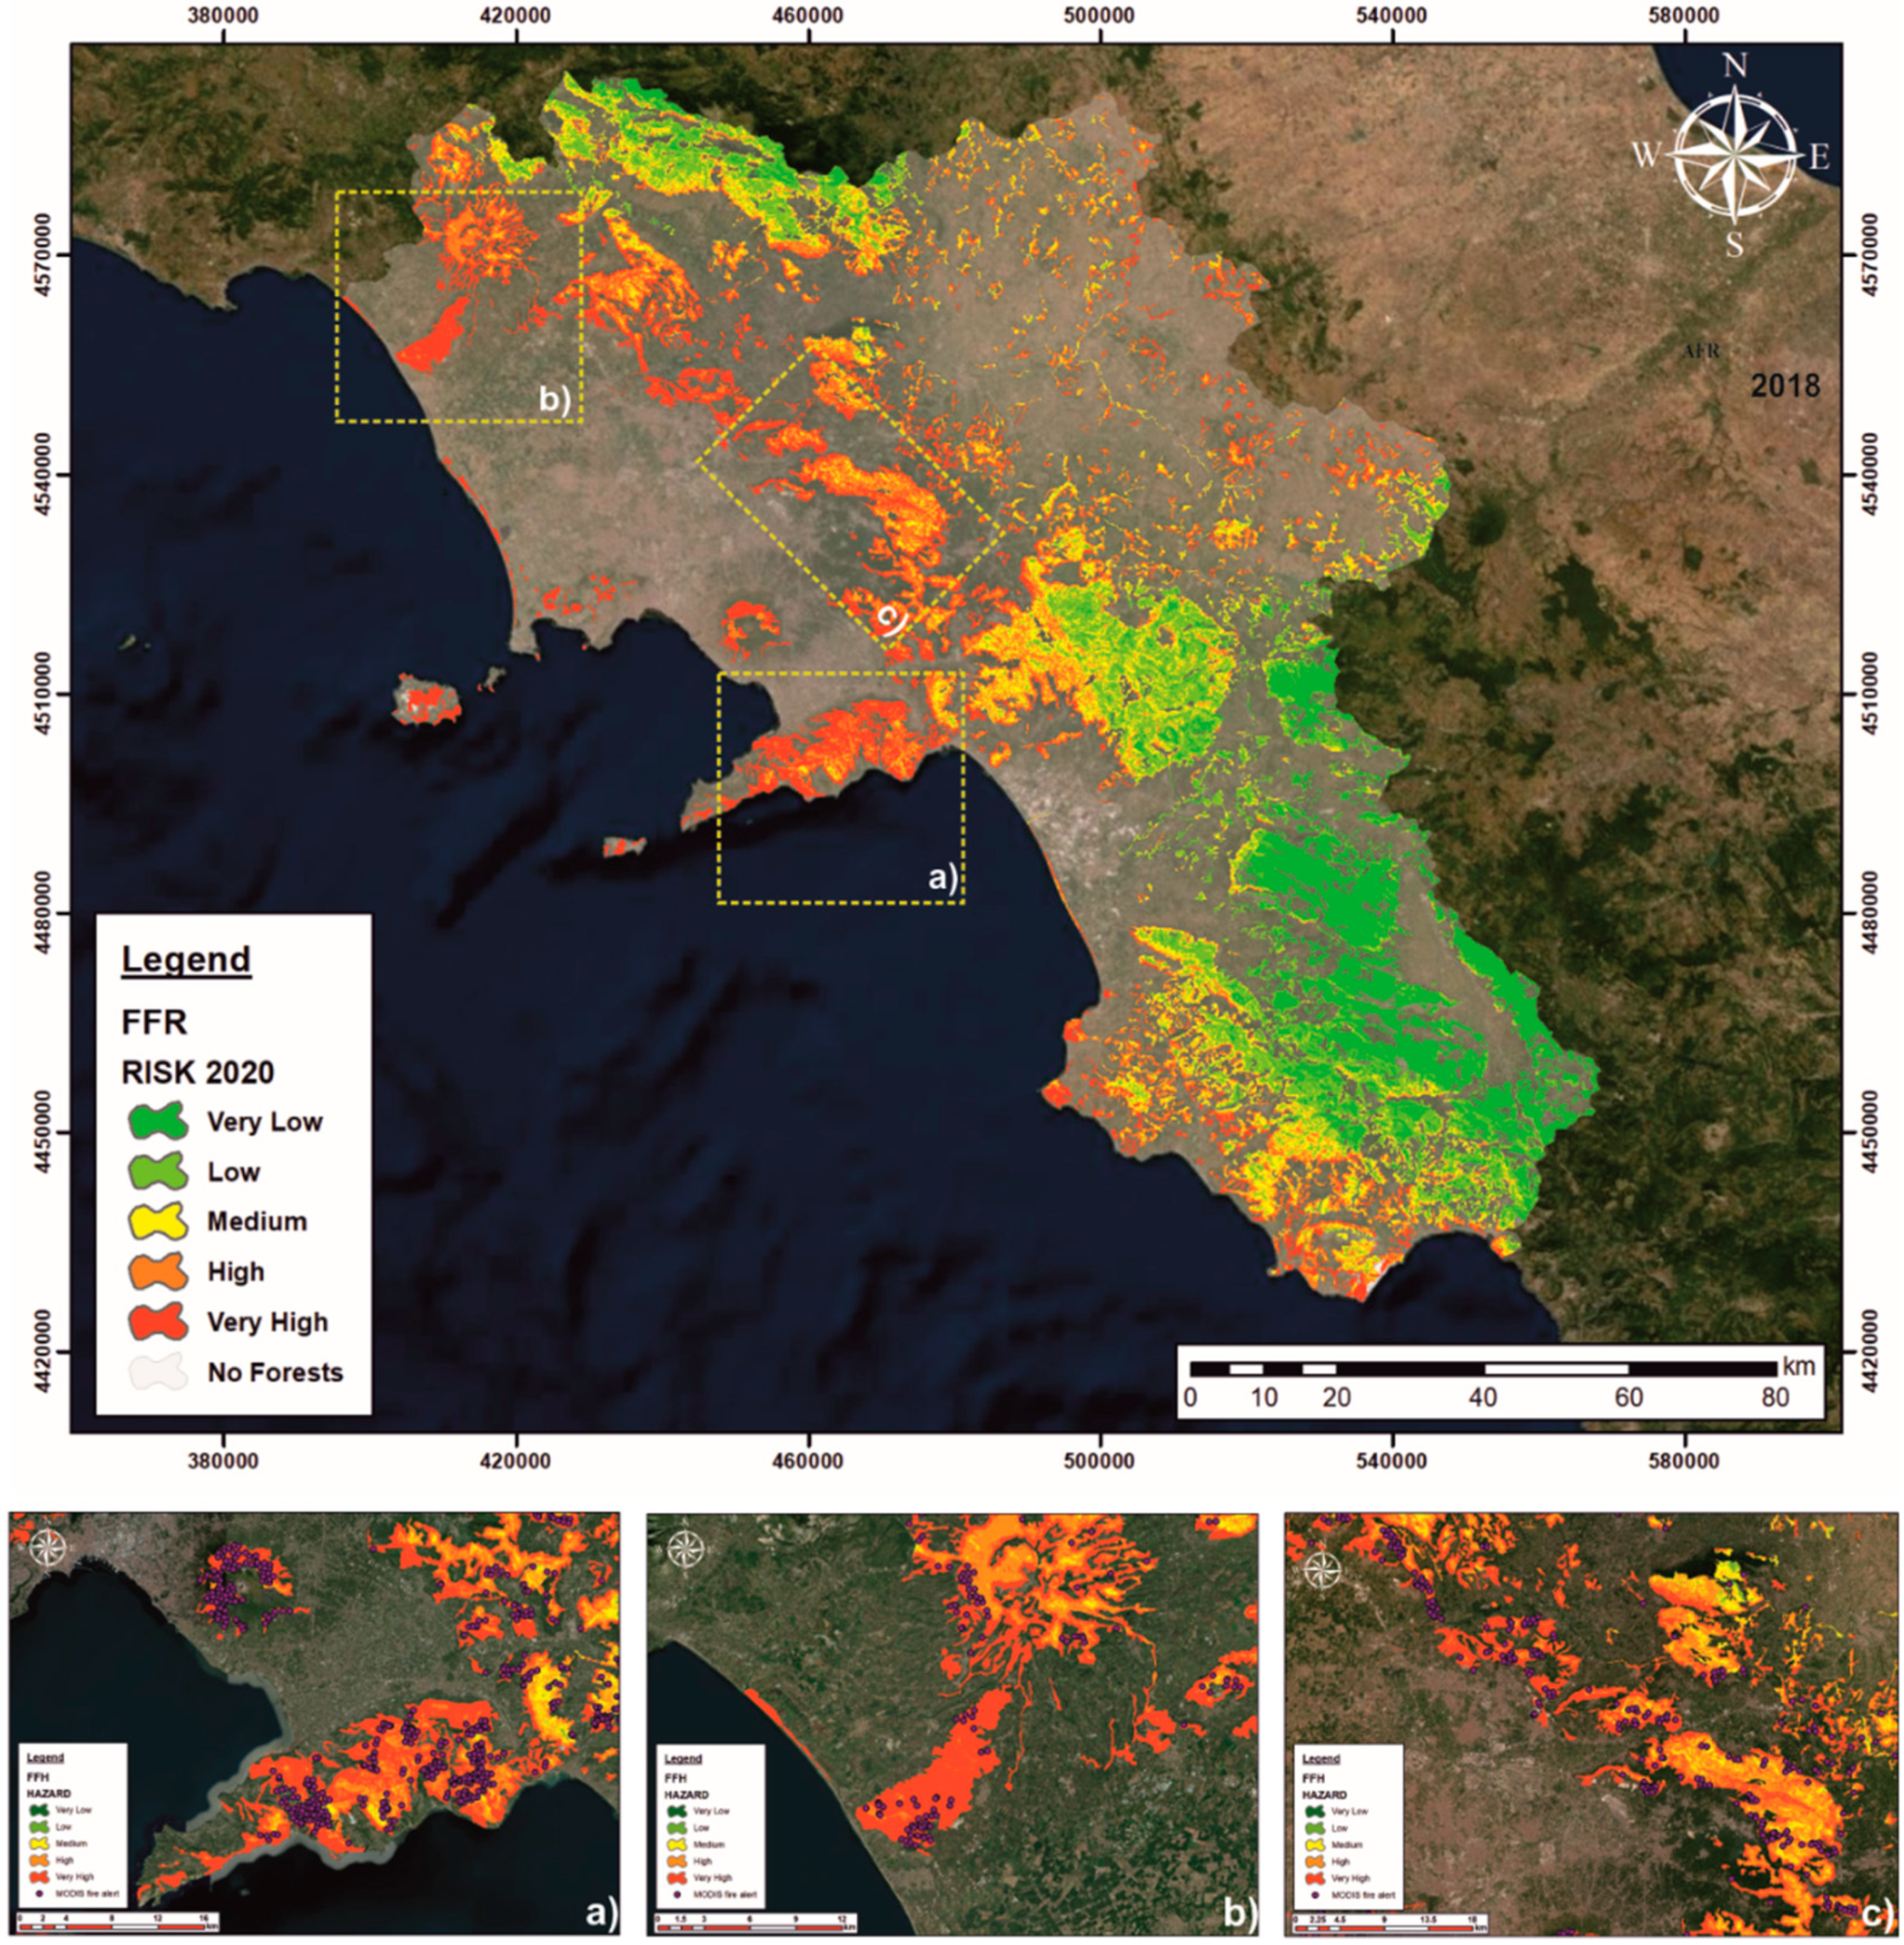
4.1. FFR Assessment for 2018
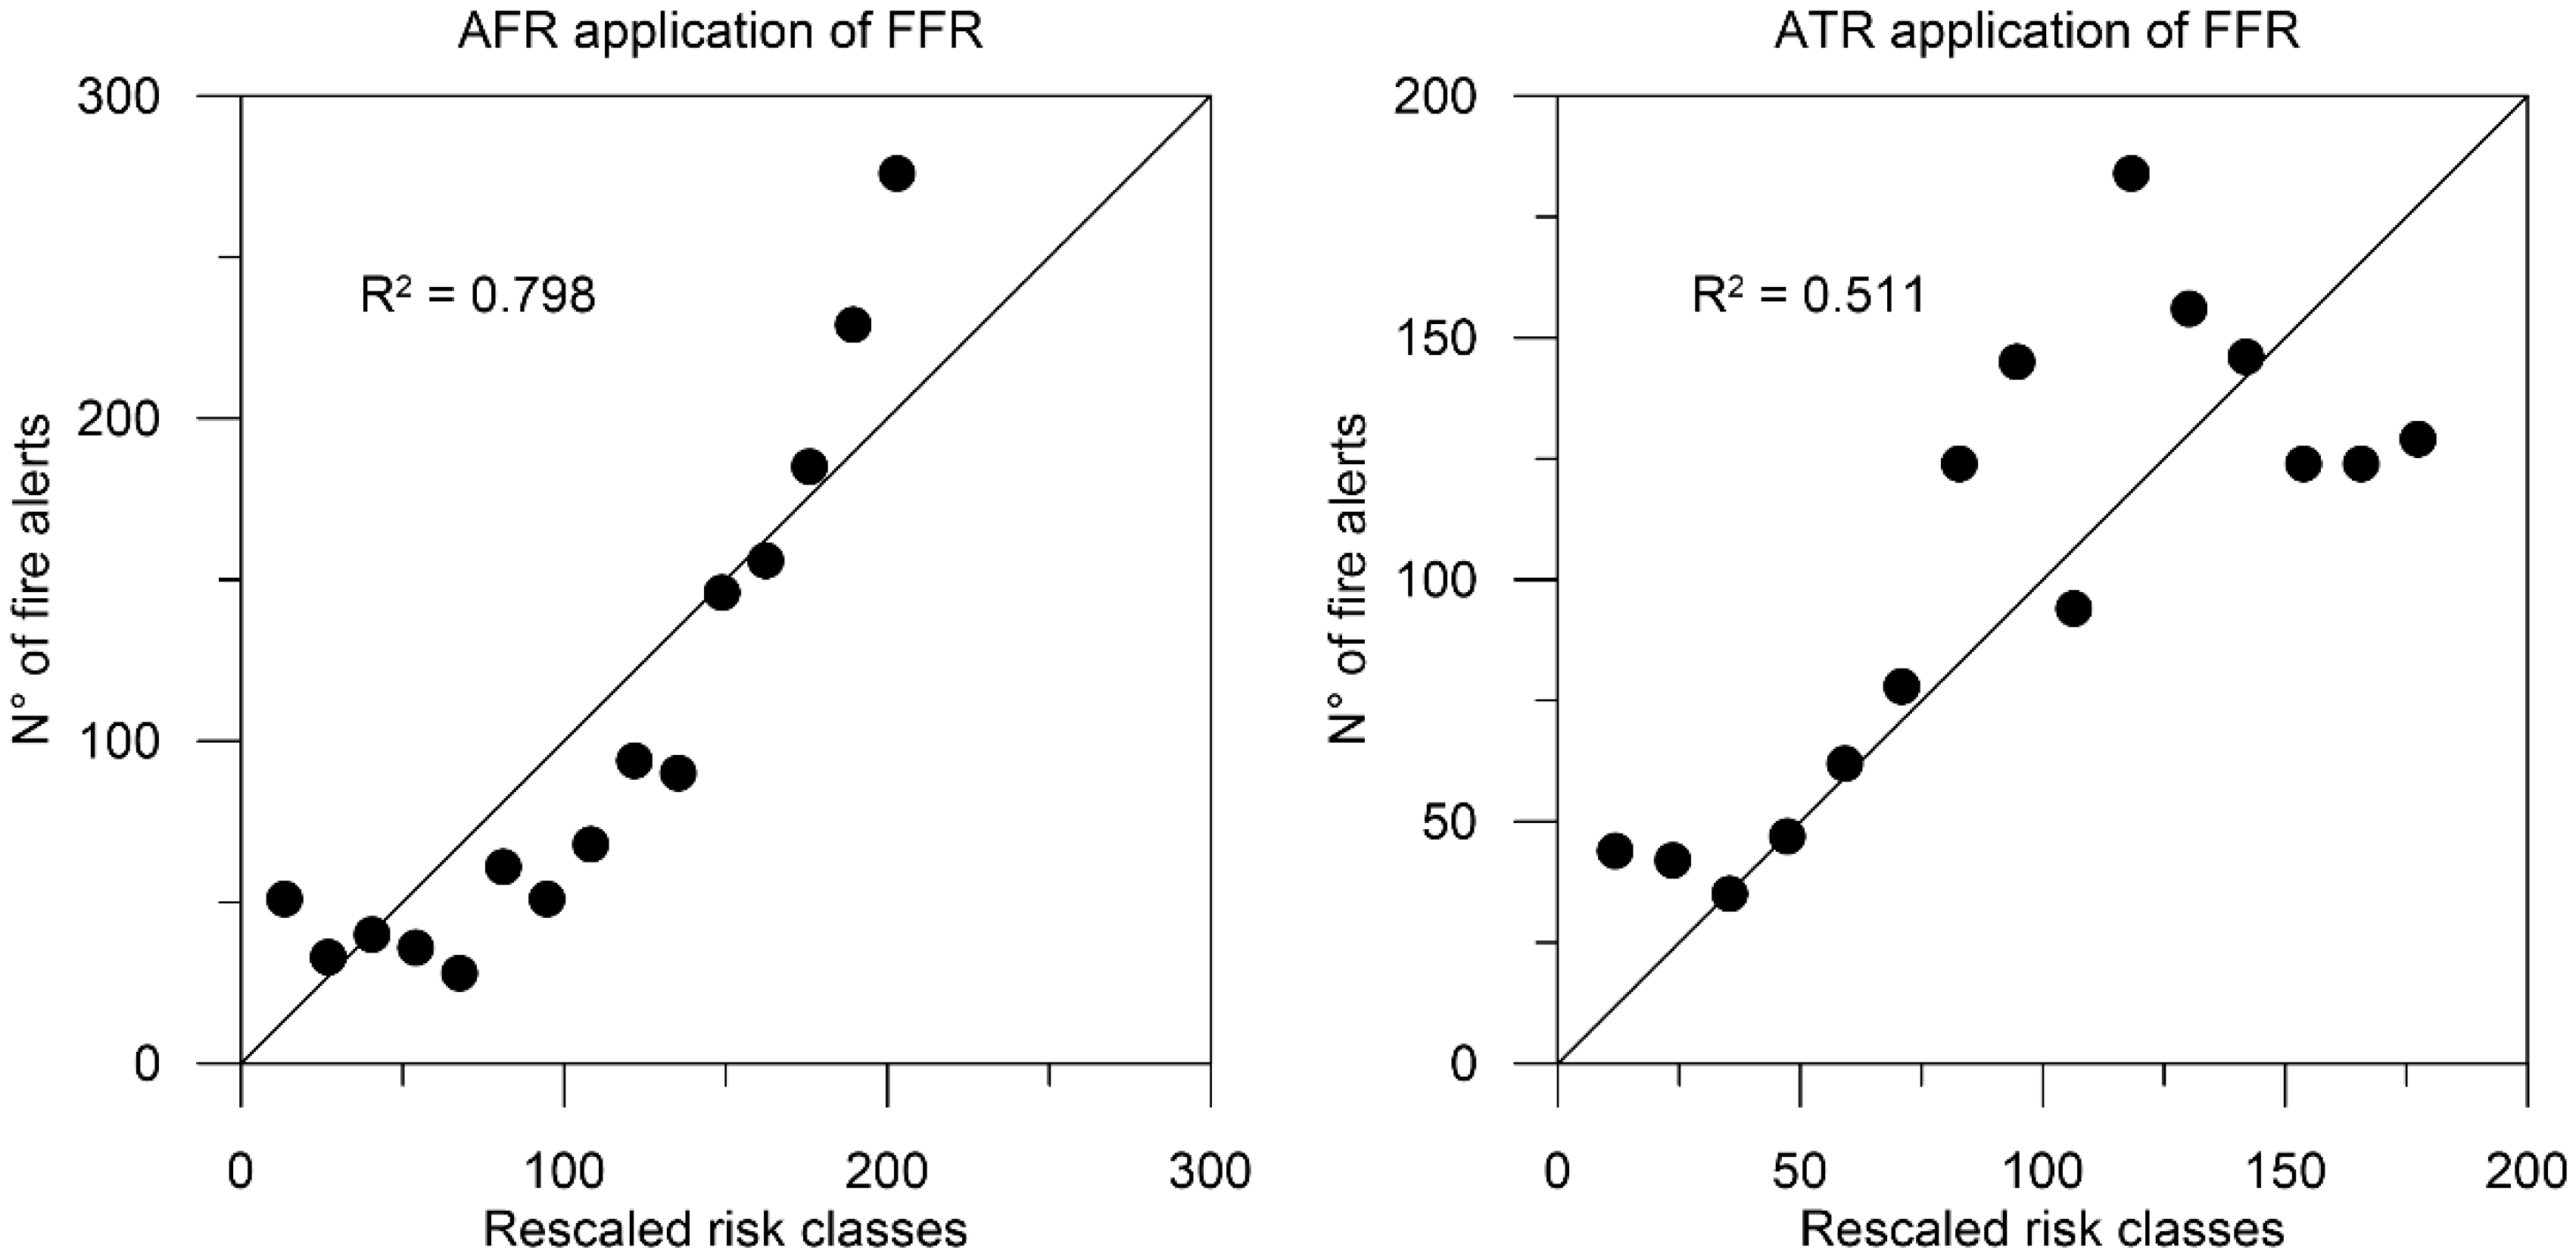
The FFR map for 2018 was produced following Equation (3) using the map algebra function in ArcMap 10.2 and applied only on the forest territory. The initial importance ranking of all parameter, useful for weight assignment was done taking in consideration the current bibliography. In agreement with You et al. [25], Eskandari [79] and Eugenio et al. [18] higher impacts have been attributed to morphological and climatic factor followed by forest type and anthropogenic factors. The maps for each parameter are shown in Figure 4. The final map (Figure 5) was classified by dividing the final index into five classes of risk, as follows: very low (22), low (23–26), medium (26–28), high (28–31), and very high (31) using geometrical intervals. The study area results were equally divided between the five classes. The very high class occupies 21% of the area and is mainly located near the Tyrrhenian Sea towards West (Figure 5a,b) and in the Apennine mountains in the center of the region (Figure 5c). Those areas are characterized by high temperatures and less abundant precipitation, which causes both vegetation and soil litter to dry, creating the conditions for a higher susceptibility to fire. Looking at the temperature and precipitation maps, those areas are marked by a very high risk for both parameters (Figure 4). Furthermore, here, the vegetation is represented by Mediterranean shrubs and maritime pines plantations, which are species highly susceptible to fire, and the presence of a sandy-loamy soil textures can further increase fire propagation since this kind of soil easily lose its moisture [80]. These parts of the Campania region are also the ones with a higher population density, agricultural fields, and urban centers, where human activities connected to roads, agricultural practices, or illegal burning can further increase the FFR. Towards the East, following the higher altitudes, the FFR decreases as temperatures decrease and the extent of precipitation increases. Here, altitude also influences the vegetation types that are less prone to fire triggering. The presence of perennial rivers and springs also contributes to decreasing FFR in these areas. Contrary to Hong et al. [21,73], You et al. [25], and Amalina et al. [14], according to whom a higher risk was associated with a minor distance to water courses and springs, in this work, the opposite scenario has been taken in consideration. Usually, the distance from rivers and springs belongs to the anthropogenic factor and it is thought to negatively influence the occurrence of fire, since the existence of camping sites and holoiday spots where human presence in their proximity could increase the FFR. In this application, the presence of water courses and springs is considered an attenuating factor. Such a factor can directly contribute, together with the precipitation, to increasing the soil moisture and phreatic surface (water table), making wet the surrounding area and reducing the onset of fires. Obviously, a decrease in the springs’ discharge due to groundwater depletion is a further factor which may increase the FFR. Different studies [81,82] have demonstrated how the soil moisture can reduce the depth of fire and its risk, especially near water bodies. The methodology was applied considering both assumptions: (i) a higher risk near rivers and springs (ATR), that represent the main literature assumption, and (ii) a higher risk away from rivers and springs (AFR).

4.2. FFR Validation

After the assessment of the proposed FFR, we proceed with the validation of the methodology, which was possible thanks to the fire alerts available in the MODIS database. As mentioned in the introduction, 1400 fire alerts were registered in the Campania region for the period between 01/2018 and 06/2019. A shapefile of fire alerts was thus projected onto the FFR map to visualize any possible correlation between fire alerts and FFR. Using the function export values in ARCGIS 10.2, it was possible to extract the corresponding risk classification according to each fire alert location. Then, each risk classification of the original FFR rank was divided into three sub-categories for a total of 15 classes of risk, organized in ascending order from 0 (very low) to 15 (very high), and rescaled to the number of fire alarms to fit the equation X = Y, merely to help the eye. Then, the number of fire alerts for each class was calculated to gain an R2 correlation. The results are shown in Figure 6, where the R2 values for the FFR map considering ATR and AFR are presented. The FFR map with AFR assumption obtained a higher R2 (0.79) with respect to the FFR map with ATR (0.51). Figure 5a–c also offers a graphical output of the correlation, whereby it is possible to appreciate how the fire alerts (purple dots) overlap with the areas characterized by a higher fire risk, making this screening methodology reliable.

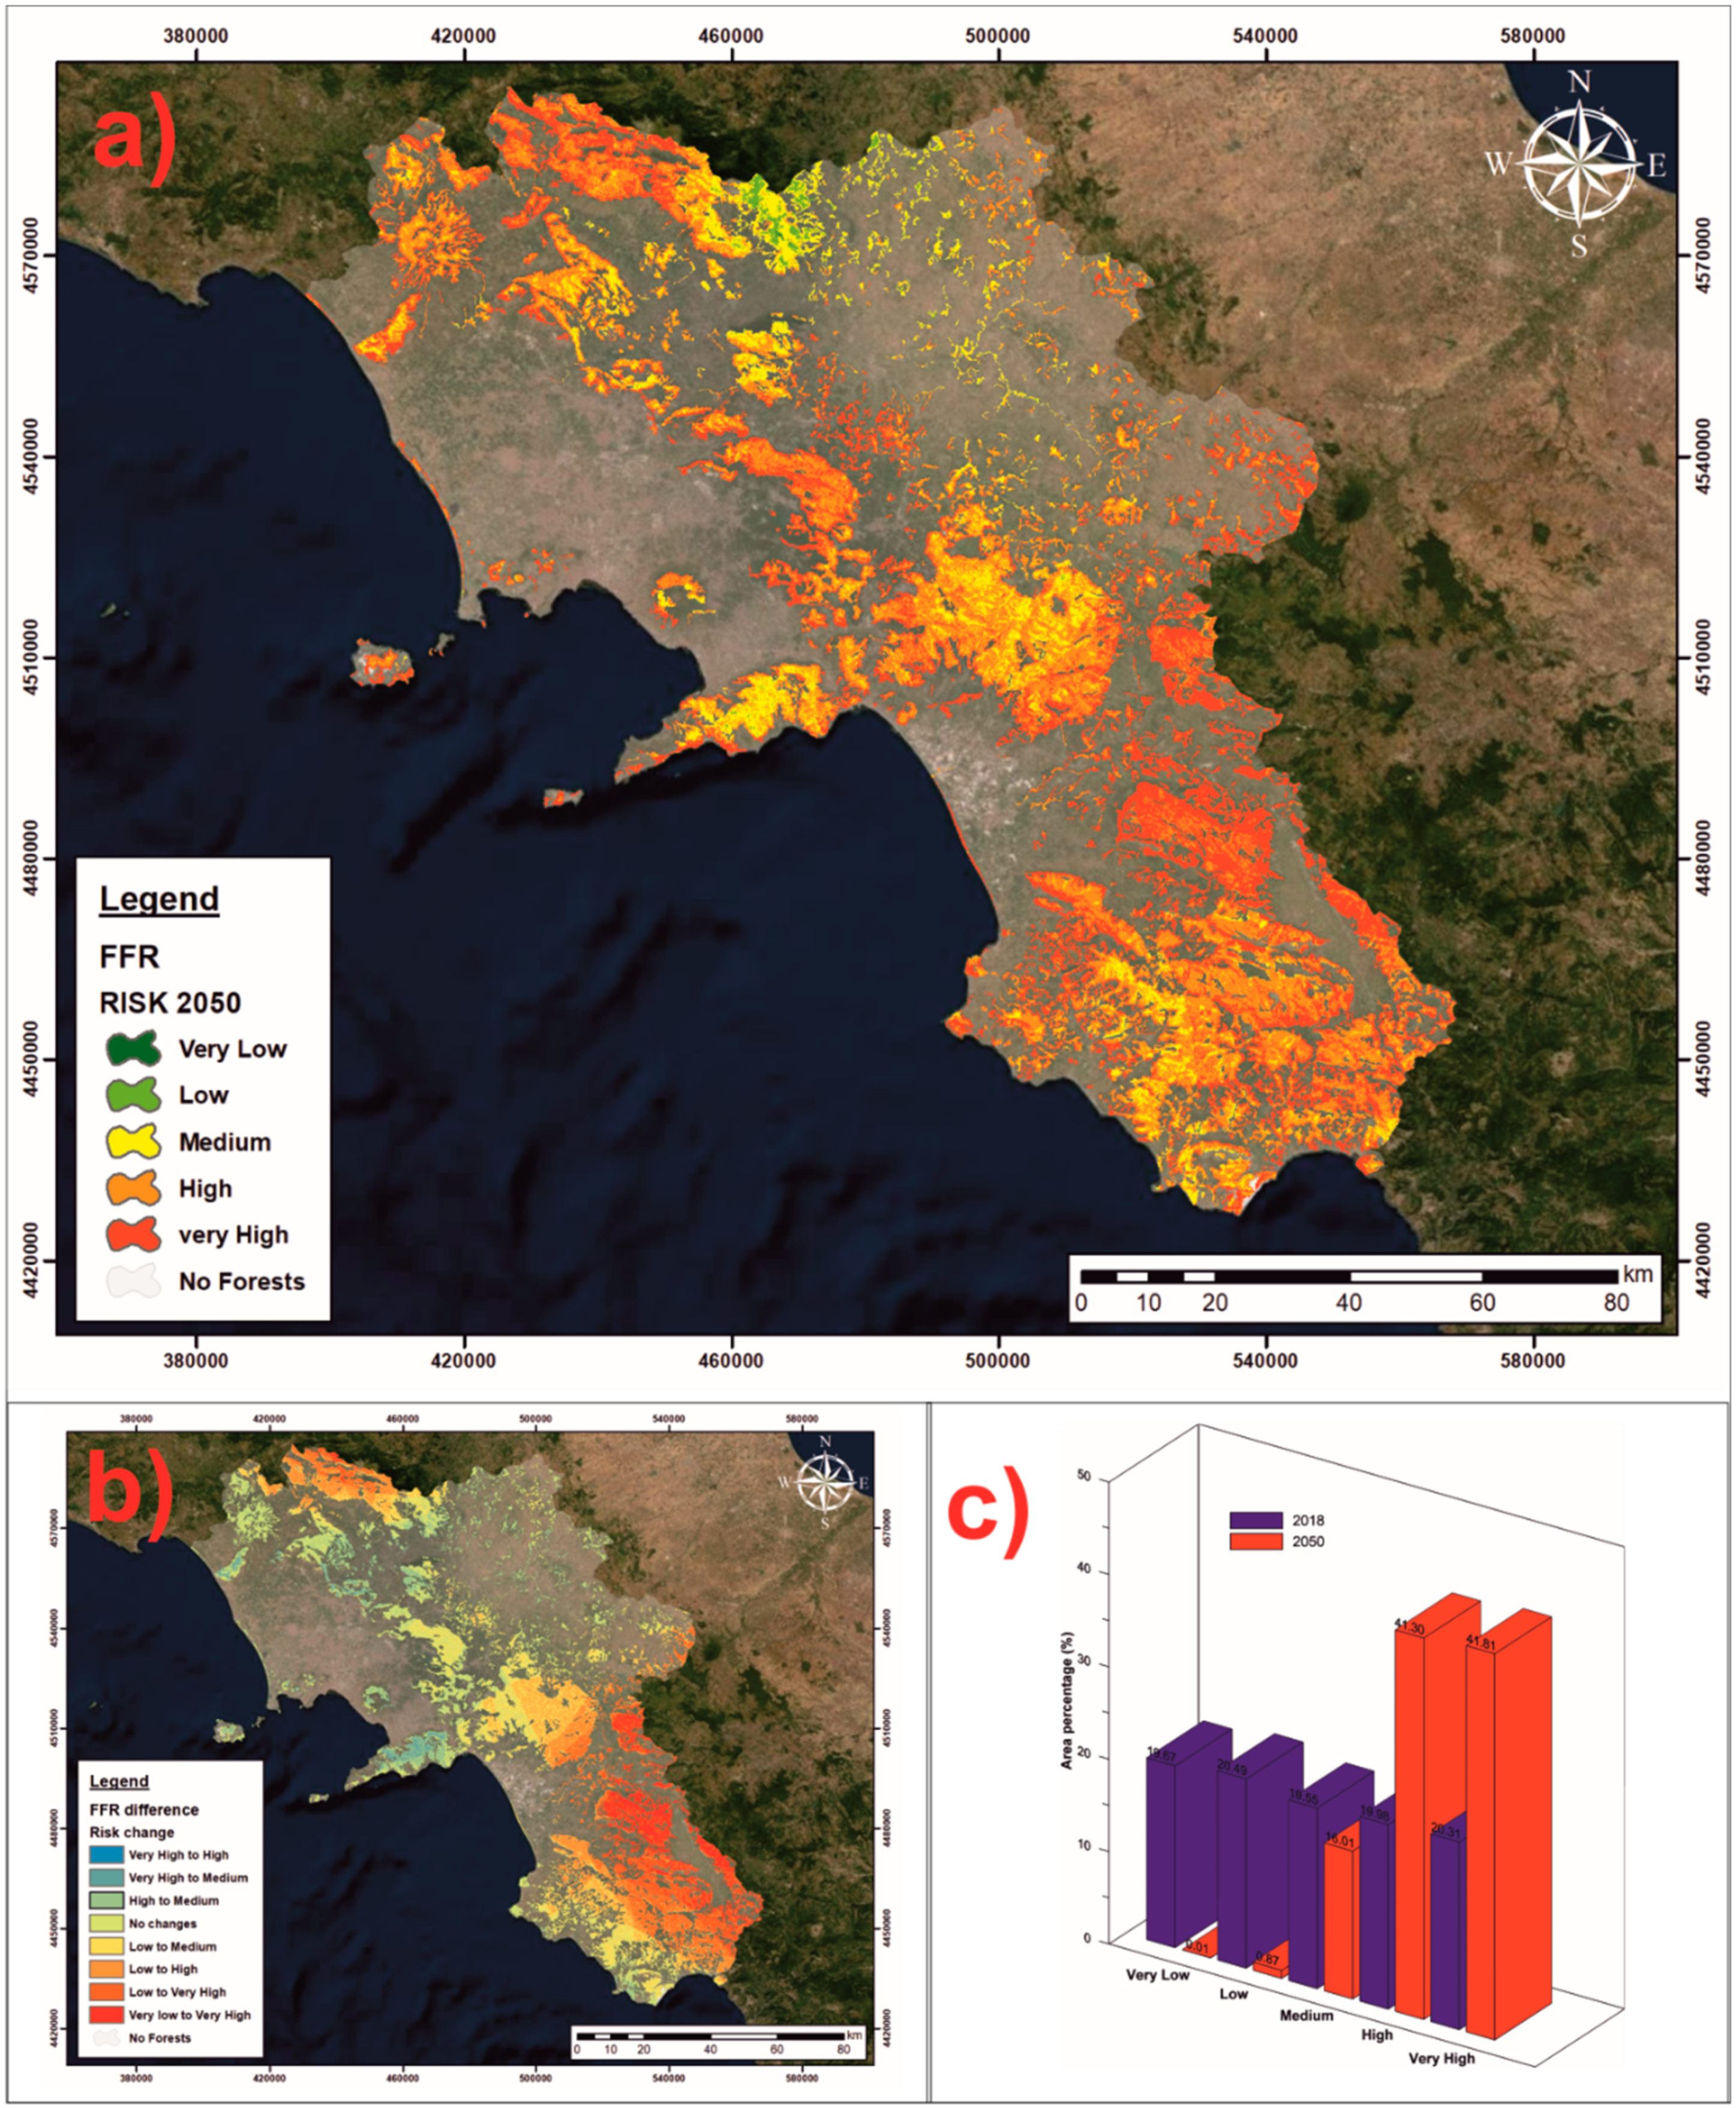
4.3. FFR Assessment for 2050

The validation with actual data and the good results obtained allow for the use of the same methodology for the assessment of FFR for future scenarios. In this case, the period 2030–2050 was considered due to the availability of climatic data. All parameters and classifications were maintained, except for temperature and precipitation, which were replaced with the corresponding climatic projections for 2050. As discussed before, climate projections for the Campania region provided a less abundant increase of both precipitation and temperature. This phenomenon will be more striking at higher altitudes, where precipitation and temperature will register a large reduction and increase, respectively (Figure 3). For the future FFR assessment, the parameters were classified using the value reported in Table 1. The final FFR map for 2050 was obtained using Equation (2). The same final ranking of 2018 map was applied also for 2050 assessment with the classification in 5 classes of risk to make the 2 maps comparable. The map was classified as follows: very low (22), low (23–26), medium (26–28), high (28–31) and very high (31). The map for 2050 is shown in Figure 7a and highlights two main patterns: (i) the very low and low risk will shrink over the region occupying only 1% of the territory, compared to 20% of 2018 (Figure 7c) and (ii) the spreading of the high and very high risk over more than 80% of the territory (Figure 6c), also in zones previously characterized by medium-low risk. Figure 7b shows the patterns of FFR change between 2018 and 2050. The areas that appear to be more prone to deterioration are those located in the South, where a sharp transition from very low and low risk to very high risk takes place. The same happens, but to a smaller area, in the Northern part of the Campania region. This is mainly due to the changed regimes of temperature and precipitation. In those areas, a mean temperature increase of 2–3 °C and a reduction in precipitation of 100 mm/year are predicted. Figure S2 shows the classification risk for temperatures and precipitations in 2050, compared with the classification risk in 2018. The location of higher risk zones will worsen from 2018 to 2050 in the Northern and Southern portion of the Campania region.

4.4. SA Application

Finally, SA was applied for both applications of the FFR model. The results are shown in Table 3. Regarding the 2018 application, among the 12 parameters considered, the two with the higher impact results were the climatic factors followed by the forest type. These three parameters influence almost 50% of the results. Of the morphological factors, only slope seems to have a moderate impact on FFR, followed by aspect and elevation. Accordingly, with AHP weight assignment, the proximity to water courses, to springs and soil properties, also shows a moderate weight, influencing almost 20% of the results, emphasizing the importance of these three parameters in mitigating the FFR. Among the anthropogenic factors, the one with the higher weight is the proximity to agricultural fields, probably due to the large extension of the study area, followed by the distance to settlements and roads. These results agree with the preliminary weights assigned through AHP confirming the robustness and reliability of the methodology. Concerning the 2050 application, the SA application (Table 4) highlights how the effective weights of temperatures and precipitations become higher with respect to the 2018 FFR map despite having the same relative weight. Moreover, the role of the attenuating factors, like proximity to rivers, springs, and soil properties, lose half of their weight and effect.

5. Discussion

The availability of the resulting maps can represent a crucial requirement in the realization of sound forest management plans, and in the execution of preventive actions intended for FFR reduction. The opportunity to know which area is susceptible to fire could allow to mitigate the problem and to better focus preventive actions. Some of these actions, like prescribed burning, have demonstrated to be very effective in fire vulnerable zones. Indeed, during the summer 2017, a major wildfire occurred in the Vesuvio National Park (Southern Italy), which destroyed about 1550 hectares of forest. Here, around 306 hectares were found to be very damaged, and 187 hectares slightly damaged. Among the slightly damaged areas, there were parcels treated with prescribed fires in 2014 and 2016 according to a program promoted in the Campania Region and the SMA Campania with the technical and scientific support of the GDL “Forest Fire Management” of SISEF [83]. This area is characterized by very high FFR in both applications of 2018 (Figure 5b) and 2050 (Figure 7). The application also highlights the importance to correctly consider the role of some parameters inside the evaluation. In fact, the application considering ATR results to be more reliable of the one AFR, remarking the importance of superficial and groundwater in preventing and mitigate FFR. The future scenario depicts a sharp deterioration of a worrying situation, whereby the temperatures increase at higher altitudes also, which will make thousands of hectares of forests more vulnerable to fires. The worsening for the 2050 resulted to be mainly driven by climate changes, as suggested by SA, in fact less precipitations and higher temperature are predicted together with extreme events that could negatively influence fire occurrence. This study highlighted a more severe scenario of the one reported in Michetti and Pinar [74] and Faggian [84], who predicted an increase of fire events and area burnt by 25% and 75%, respectively in central Southern Italy. The FFR mapping tool represents a user-friendly methodology for FFR assessment worldwide since the input data are usually easily accessible from any local authority. Furthermore, accounting land use change could improve the reliability of this methodology. Indeed, together with climatic factors, land use practices represent the main factors influencing FFR, as the expansion of agricultural fields and urban areas can significantly raise the fire ignition. Nevertheless, the methodology suffers for some drawbacks: (i) the approach is empirical and not driven by deterministic numerical models, thus the proposed weights cannot be straightforwardly applied in other regions if not calibrated with a local dataset and (ii) the calibration was performed for a single year, while multiple time series would provide more robust results. Ultimately, the methodology fulfills the obligation to produce clear and easily understandable maps, allowing local agencies to act properly and on time to prevent forest fires

6. Conclusions

Characterized by a Mediterranean climate and with at least 30% of the area covered by forests, the Campania region is highly susceptible to FFR. In the last 30 years over 3400 fires were registered, with 80% of cases occurred in the last three years. This moved the general audience attention to the issue of reducing FFR and protecting the ecosystem. In this study, a new FFR mapping methodology was proposed using a parametric linear combination of easily accessible data supported by an AHP application. The methodology divided the Campania region into five classes of risk, from very low to very high, and was validated using fire alerts from the MODIS database in three different areas. The FFR map that considers a decreasing risk approaching water courses and springs showed a good correlation with fire alert (0.79 R2), confirming that the proposed methodology is reliable. Meanwhile, the standard literature assumption that considers an increasing risk approaching water courses and springs showed a poor correlation with fire alert (0.51 R2). Besides, using the climate projections for 2050, a near-future FFR map was produced. The predicted FFR map highlighted a worsening situation with a spreading of higher risk classes over the territory due to mean temperature increases and a decrease in precipitation. Thus, the proposed methodology represents a reliable screening method for areas under FFR and can support authorities to direct preventive actions towards mitigating forest fires in cases where limited data are available.

Supplementary Materials

The following are available online at https://www.mdpi.com/2071-1050/11/24/7166/s1, Figure S1: Fire alerts and meteorological station location inside Campania Region, Figure S2: Temperature and precipitation risk classification: The 2018 classifications are shown in panel a for temperatures and panel c for precipitations, and those for the 2050 period are shown in panel b for temperatures and panel d for precipitations.

Author Contributions

Conceptualization, G.B. and E.G.; Methodology, G.B. and N.K.; Software, G.B. and N.K.; Validation, G.B. and N.C.; Formal analysis, E.G. and G.B.; Data curation, G.B. and E.G.; Writing—original draft preparation, G.B. and E.G.; Writing—review and editing, N.K. and N.C.

Funding

This research did not receive any funding.

Conflicts of Interest

The authors declare no conflict of interest. The founding sponsors had no role in the design of the study; in the collection, analyses, or interpretation of data; in the writing of the manuscript, and in the decision to publish the results.

References

  1. Pausas, J.G.; Keeley, J.E. Wildfires as an ecosystem service. Front. Ecol. Environ. 2019, 17, 289–295. [Google Scholar] [CrossRef] [Green Version]
  2. Meddens, A.J.; Kolden, C.A.; Lutz, J.A. Detecting unburned areas within wildfire perimeters using Landsat and ancillary data across the northwestern United States. Remote Sens. Environ. 2016, 186, 275–285. [Google Scholar] [CrossRef]
  3. Syphard, A.D.; Brennan, T.J.; Keeley, J.E. The role of defensible space for residential structure protection during wildfires. Int. J. Wildland Fire 2014, 23, 1165–1175. [Google Scholar] [CrossRef]
  4. Syphard, A.D.; Keeley, J.E.; Pfaff, A.H.; Ferschweiler, K. Human presence diminishes the importance of climate in driving fire activity across the United States. Proc. Natl. Acad. Sci. USA 2017, 114, 13750–13755. [Google Scholar] [CrossRef] [Green Version]
  5. Parisien, M.A.; Walker, G.R.; Little, J.M.; Simpson, B.N.; Wang, X.; Perrakis, D.D. Considerations for modeling burn probability across landscapes with steep environmental gradients: An example from the Columbia Mountains, Canada. Nat. Hazards 2013, 66, 439–462. [Google Scholar] [CrossRef]
  6. Wuschke, K.; Clare, J.; Garis, L. Temporal and geographic clustering of residential structure fires: A theoretical platform for targeted fire prevention. Fire Saf. J. 2013, 62, 3–12. [Google Scholar] [CrossRef]
  7. Fernandes, P.M.; Botelho, H.S. A review of prescribed burning effectiveness in fire hazard reduction. Int. J. Wildland Fire 2003, 12, 117–128. [Google Scholar] [CrossRef] [Green Version]
  8. Battipaglia, G.; Strumia, S.; Esposito, A.; Giuditta, E.; Sirignano, C.; Altieri, S.; Rutigliano, F.A. The effects of prescribed burning on Pinus halepensis Mill. as revealed by dendrochronological and isotopic analyses. For. Ecol. Manag. 2014, 334, 201–208. [Google Scholar] [CrossRef]
  9. Catalanotti, A.E.; Giuditta, E.; Marzaioli, R.; Ascoli, D.; Esposito, A.; Strumia, S.; Rutigliano, F.A. Effects of single and repeated prescribed burns on soil organic C and microbial activity in a Pinus halepensis plantation of Southern Italy. Appl. Soil Ecol. 2018, 125, 108–116. [Google Scholar] [CrossRef]
  10. Erten, E.; Kurgun, V.; Musaoglu, N. Forest fire risk zone mapping from satellite imagery and GIS: A case study. In Proceedings of the XXth Congress of the International Society for Photogrammetry and Remote Sensing, Istanbul, Turkey, 12–23 July 2004; pp. 222–230. [Google Scholar]
  11. Pourtaghi, Z.S.; Pourghasemi, H.R.; Aretano, R.; Semeraro, T. Investigation of general indicators influencing on forest fire and its susceptibility modeling using different data mining techniques. Ecol. Indic. 2016, 64, 72–84. [Google Scholar] [CrossRef]
  12. Jaiswal, R.K.; Mukherjee, S.; Raju, K.D.; Saxena, R. Forest fire risk zone mapping from satellite imagery and GIS. Int. J. Appl. Earth. Obs. 2002, 4, 1–10. [Google Scholar] [CrossRef]
  13. Jung, J.; Kim, C.; Jayakumar, S.; Kim, S.; Han, S.; Kim, D.H.; Heo, J. Forest fire risk mapping of Kolli Hills, India, considering subjectivity and inconsistency issues. Nat. Hazard. 2013, 65, 2129–2146. [Google Scholar] [CrossRef]
  14. Amalina, P.; Prasetyo, L.B.; Rushayati, S.B. Forest Fire Vulnerability Mapping in Way Kambas National Park. Procedia Environ. Sci. 2016, 33, 239–252. [Google Scholar] [CrossRef] [Green Version]
  15. Linn, R.; Reisner, J.; Colman, J.J.; Winterkamp, J. Studying wildfire behaviorusing FIRETEC. Int. J. Wildland Fire 2002, 11, 233–246. [Google Scholar] [CrossRef]
  16. Sturtevant, B.R.; Scheller, R.M.; Miranda, B.R.; Shinneman, D.; Syphard, A. Simulating dynamic and mixed-severity fire regimes: A process-based fireextension for LANDIS-II. Ecol. Model. 2009, 220, 3380–3393. [Google Scholar] [CrossRef]
  17. Duarte, L.; Teodoro, A.C.; Goncalves, J.A.; Soares, D.; Cunha, M. Assessing soil erosion risk using RUSLE through a GIS open source desktop and web application. Environ. Monit. Assess. 2016, 188, 351. [Google Scholar] [CrossRef]
  18. Eugenio, F.C.; dos Santos, A.R.; Fiedler, N.C.; Ribeiro, G.A.; da Silva, A.G.; dos Santos, Á.B.; Schettino, V.R. Applying GIS to develop a model for forest fire risk: A case study in Espírito Santo, Brazil. J. Environ. Manag. 2016, 173, 65–71. [Google Scholar] [CrossRef]
  19. Wang, L.; Zhao, Q.; Wen, Z.; Qu, J. RAFFIA: Short-term Forest Fire Danger Rating Prediction via Multiclass Logistic Regression. Sustainability 2018, 10, 4620. [Google Scholar] [CrossRef] [Green Version]
  20. Oliveira, S.; Oehler, F.; San-Miguel-Ayanz, J.; Camia, A.; Pereira, J.M.C. Modeling spatial patterns of fire occurrence in Mediterranean Europe using multiple regression and random forest. For. Ecol. Manag. 2012, 275, 117–129. [Google Scholar] [CrossRef]
  21. Hong, H.; Naghibi, S.; Dashtpagerdi, M.; Pourghasemi, H.; Chen, W. A comparative assessment between linear and quadratic discriminant analyses (LDA-QDA) with frequency ratio and weights-of-evidence models for forest fire susceptibility mapping in China. Arab. J. Geosci. 2017, 10, 167. [Google Scholar] [CrossRef]
  22. Tien Bui, D.; Pradhan, B.; Lofman, O.; Revhaug, I.; Dick, O.B. Landslide susceptibility mapping at Hoa Binh province (Vietnam) using an adaptiveneuro-fuzzy inference system and GIS. Comput. Geosci. 2012, 45, 199–211. [Google Scholar] [CrossRef]
  23. Short, K. A spatial database of wildfires in the United States, 1992–2011. Earth Syst. Sci. Data 2014, 6, 1–27. [Google Scholar] [CrossRef] [Green Version]
  24. Zald, H.S.J.; Ohmann, J.L.; Roberts, H.M.; Gregory, M.J.; Henderson, E.B.; McGaughey, R.J.; Braaten, J. Influence of lidar, Landsat imagery, disturbance history, plotlocation accuracy, and plot size on accuracy of imputation maps of forest composition and structure. Remote Sens. Environ. 2014, 143, 26–38. [Google Scholar] [CrossRef]
  25. You, W.; Lin, L.; Wu, L.; Ji, Z.; Yu, J.A.; Zhu, J.; He, D. Geographical information system-based forest fire risk assessment integrating national forest inventory data and analysis of its spatiotemporal variability. Ecol. Indic. 2017, 77, 176–184. [Google Scholar] [CrossRef]
  26. González-Olabarria, J.; Rodríguez, F.; Fernández-Landa, A.; Mola-Yudego, B. Mapping fire risk in the model forest of Urbión (Spain) based on airborne LiDAR measurements. For. Ecol. Manag. 2012, 282, 149–156. [Google Scholar] [CrossRef]
  27. Varela, V.; Vlachogiannis, D.; Sfetsos, A.; Karozis, S.; Politi, N.; Giroud, F. Projection of Forest Fire Danger due to Climate Change in the French Mediterranean Region. Sustainability 2019, 11, 4284. [Google Scholar] [CrossRef] [Green Version]
  28. Oliveira, S.; Félix, F.; Nunes, A.; Lourenço, L.; Laneve, G.; Sebastián-López, A. Mapping wildfire vulnerability in Mediterranean Europe. Testing a stepwise approach for operational purposes. J. Environ. Manag. 2018, 206, 158–169. [Google Scholar] [CrossRef]
  29. Petrakis, M.; Psiloglou, B.; Lianou, M.; Keramitsoglou, I.; Cartalis, C. Evaluation of forest fire risk and fire extinction difficulty at the mountainous park of Vikos-Aoos, Northern Greece: Use of remote sensing and GIS techniques. IJRAM 2005, 5, 50–65. [Google Scholar] [CrossRef]
  30. Semerato, T.; Mastroleo, G.; Aretano, R.; Facchinetti, G.; Zurlini, G.; Petrosillo, I. GIS Fuzzy Expert System for the assessment of ecosystems vulnerability to fire in managing Mediterranean natural protected areas. J. Environ. Manag. 2016, 168, 94–103. [Google Scholar] [CrossRef]
  31. Poldini, L.; Ganis, P.; Vidali, M.; Altobelli, A.; Bader, F.; Cantele, S. Inclusion of phytosociological data in an index of vegetation fire danger: Application and mapping on the Karst area around Trieste (Italy). Plant Biosyst. 2018, 152, 810–817. [Google Scholar] [CrossRef]
  32. Wu, Z.; He, H.S.; Yang, J.; Liang, Y. Defining fire environment zones in the boreal forests of northeastern China. Sci. Total Environ. 2014, 518, 106–116. [Google Scholar] [CrossRef] [PubMed]
  33. Pradhan, B.; Dini Hairi Bin Suliman, M.; Arshad Bin Awang, M. Forest fire susceptibility and risk mapping using remote sensing and geographical information systems (GIS). Disaster Prev. Manag. 2007, 16, 344–352. [Google Scholar] [CrossRef]
  34. Xystrakis, F.; Koutsias, N. Differences of fire activity and their underlying factors among vegetation formations in Greece. IForest 2013, 6, 132. [Google Scholar] [CrossRef] [Green Version]
  35. Bui, D.T.; Bui, Q.T.; Nguyen, Q.P.; Pradhan, B.; Nampak, H.; Trinh, P.T. A hybrid artificial intelligence approach using GIS-based neural-fuzzy inference system and particle swarm optimization for forest fire susceptibility modeling at a tropical area. Agric. For. Meteorol. 2017, 233, 32–44. [Google Scholar] [CrossRef]
  36. Tian, X.; Zhao, F.; Shu, L.; Wang, M. Distribution characteristics and the influence factors of forest fires in China. For. Ecol. Manag. 2013, 310, 460–467. [Google Scholar] [CrossRef]
  37. Carmo, M.; Moreira, F.; Casimiro, P.; Vaz, P. Land use and topography influences on wildfire occurrence in northern Portugal. Landsc. Urban Plan. 2011, 100, 169–176. [Google Scholar] [CrossRef] [Green Version]
  38. Saura-Mas, S.; Paula, S.; Pausas, J.G.; Lloret, F. Fuel loading and flammability in the Mediterranean Basin woody species with different post-fire regenerative strategies. Int. J. Wildland Fire 2010, 19, 783–794. [Google Scholar] [CrossRef] [Green Version]
  39. Price, O.; Bradstock, R. Countervailing effects of urbanization and vegetation extent on fire frequency on the wildland urban interface: Disentangling fuel and ignition effects. Landscape Urban Plan. 2014, 130, 81–88. [Google Scholar] [CrossRef] [Green Version]
  40. Dillon, G.K.; Holden, Z.A.; Morgan, P.; Crimmins, M.A.; Heyerdahl, E.K.; Luce, C.H. Both topography and climate affected forest and woodland burn severity in two regions of the western US, 1984 to 2006. Ecosphere 2011, 2, 1–33. [Google Scholar] [CrossRef]
  41. Lentile, L.B.; Smith, F.W.; Shepperd, W.D. Influence of topography and forest structure on patterns of mixed severity fire in ponderosa pine forests of the South Dakota Black Hills, USA. Int. J. Wildland Fire 2006, 15, 557–566. [Google Scholar] [CrossRef]
  42. Verde, J.; Zêzere, J. Assessment and validation of wildfire susceptibility and hazard in Portugal. Nat. Hazards Earth Syst. Sci. 2010, 10, 485–497. [Google Scholar] [CrossRef]
  43. Schmidt, D.A.; Taylor, A.H.; Skinner, C.N. The influence of fuels treatment and landscape arrangement on simulated fire behavior, Southern Cascade range, California. For. Ecol. Manag. 2008, 255, 3170–3184. [Google Scholar] [CrossRef]
  44. Liu, Z.; Yang, J.; Chang, Y.; Weisberg, P.J.; He, H.S. Spatial patterns and drivers of fire occurrence and its future trend under climate change in a boreal forest of Northeast China. Glob. Chang. Biol. 2012, 18, 2041–2056. [Google Scholar] [CrossRef]
  45. Zumbrunnen, T.; Menéndez, P.; Bugmann, H.; Conedera, M.; Gimmi, U.; Bürgi, M. Human impacts on fire occurrence: A case study of hundred years of forest fires in a dry alpine valley in Switzerland. Reg. Environ. Chang. 2012, 12, 935–949. [Google Scholar] [CrossRef]
  46. Wu, Z.; He, H.S.; Yang, J.; Liu, Z.; Liang, Y. Relative effects of climatic and local factors on fire occurrence in boreal forest landscapes of northeastern China. Sci. Total Environ. 2014, 493, 472–480. [Google Scholar] [CrossRef] [PubMed]
  47. Sirca, C.; Casula, F.; Bouillon, C.; García, B.F.; Ramiro, M.M.F.; Molina, B.V.; Spano, D. A wildfire risk-oriented GIS tool for mapping Rural-Urban Interfaces. Environ. Model. Softw. 2017, 94, 36–47. [Google Scholar] [CrossRef]
  48. Ducci, D.; Tranfaglia, G. The Effect of Climate Change on the Hydrogeological Resources in Campania Region (Italy). In Groundwater and Climatic Changes; Dragoni, W., Ed.; Geological Society of London: London, UK, 2008; Volume 288, pp. 25–38. [Google Scholar]
  49. Mastrocicco, M.; Busico, G.; Colombani, N. Deciphering Interannual Temperature Variations in Springs of the Campania Region (Italy). Water 2019, 11, 288. [Google Scholar] [CrossRef] [Green Version]
  50. Busico, G.; Kazakis, N.; Colombani, N.; Mastrocicco, M.; Voudouris, K.; Tedesco, D. A modified SINTACS method for groundwater vulnerability and pollution risk assessment in highly anthropized regions based on NO3 and SO42 concentrations. Sci. Total Environ. 2017, 609, 1512–1523. [Google Scholar] [CrossRef]
  51. JRC Forest Fires in Europe, Middle East and North Africa. 2017. Available online: https://effis.jrc.ec.europa.eu/applications/fire-news/ (accessed on 10 June 2019).
  52. Ministero della difesa (Carabinieri.it). Available online: http://datiallefiamme.it (accessed on 24 May 2019).
  53. Fire Global Forest Watch. Available online: https://fires.globalforestwatch.org/home/ (accessed on 2 May 2019).
  54. MIPAAF. Agrometeorological Online Database. 2018. Available online: http://www.agricoltura.regione.campania.it/meteo/agrometeo.htm (accessed on 12 April 2019).
  55. Arpac Database. 2019. Available online: http://www.sinanet.isprambiente.it/it (accessed on 11 March 2019).
  56. Di Gennaro, A. I sistemi di terra della Campania; SELCA: Firenze, Italy, 2002. [Google Scholar]
  57. Advance Spaceborn Thermal Emission and Reflection Radiometer. Available online: https://asterweb.jpl.nasa.gov/gdem.asp (accessed on 11 April 2019).
  58. Copernicus, Land Monitoring Service. Available online: https://land.copernicus.eu/pan-european/corine-land-cover (accessed on 1 April 2019).
  59. EURO-CORDEX. 2019. Available online: https://www.euro-cordex.net/index.php.en (accessed on 10 April 2019).
  60. Saaty, T.H. A scaling method forms priorities in hierarchical structures. J. Math. Psychol. 1977, 15, 234–281. [Google Scholar] [CrossRef]
  61. Napolitano, P.; Fabbri, A.G. Single Parameter Sensitivity Analysis for Aquifer Vulnerability Assessment Using DRASTIC and SINTACS. In Hydrology GIS Application of Geographic Information Systems in Hydrology and Water Resources Management; Kovar, K., Nachtnebel, H.P., Eds.; IAHS Publication: Wallingford, UK, 1996; pp. 559–566. [Google Scholar]
  62. Kazakis, N.; Busico, G.; Colombani, N.; Mastrocicco, M.; Pavlou, A.; Voudouris, K. GALDIT-SUSI a modified method to account for surface water bodies in the assessment of aquifer vulnerability to seawater intrusion. J. Environ. Manag. 2019, 235, 257–265. [Google Scholar] [CrossRef]
  63. Robinne, F.; Bladon, K.D.; Miller, C.; Parisien, M.; Mathieu, J.; Flannigan, M.D. A spatial evaluation of global wildfire-water risks to human and natural systems. Sci. Total Environ. 2018, 610, 1193–1206. [Google Scholar] [CrossRef] [PubMed]
  64. Gontara, M.; Allouche, N.; Jmal, I.; Bouri, S. Sensitivity analysis for the GALDIT method based on the assessment of vulnerability to pollution in the northern Sfax coastal aquifer, Tunisia. Environ. Earth Sci. 2016, 75, 669. [Google Scholar] [CrossRef]
  65. Bui, D.T.; Le, K.T.; Nguyen, V.; Le, H.; Revhaug, I. Tropical forest fire susceptibility mapping at the cat Ba national park area, Hai Phong city, Vietnam, using GIS-Based kernel logistic regression. Remote Sens. 2016, 8, 347. [Google Scholar] [CrossRef] [Green Version]
  66. Chuvieco, E.; Aguado, I.; Yebra, M.; Nieto, H.; Salas, J.; Martín, M.P.; Vilar, L.; Martinez, J.; Martin, S.; Ibarra, P.; et al. Development of a framework for fire risk assessment using remote sensing and geographic information system technologies. Ecol. Model. 2010, 221, 46–58. [Google Scholar] [CrossRef]
  67. Renard, Q.; Pelissier, R.; Ramesh, B.R.; Kodandapani, N. Environmental suscep-tibility model for predicting forest fire occurrence in the Western Ghats of India. Int. J. Wildland Fire 2012, 21, 368–379. [Google Scholar] [CrossRef] [Green Version]
  68. Adab, H.; Devi Kanniah, K.; Solaimani, K. Modeling forest fire risk in the northeast of Iran using remote sensing and GIS techniques. Nat. Hazards 2013, 65, 1723–1743. [Google Scholar] [CrossRef]
  69. Scholze, M.; Knorr, W.; Arnell, N.W. Prentice IC. A climate-change risk analysis for world ecosystems. Proc. Natl. Acad. Sci. USA 2006, 103, 13116–13120. [Google Scholar] [CrossRef] [Green Version]
  70. Nunes, M.C.S.; Vasconcelos, M.J.; Pereira, J.M.C.; Dasgupta, N.; Alldredge, R.J.; Rego, F.C. Land-cover type and fire in Portugal: Do fires burn land cover selectively? Landsc. Ecol. 2005, 20, 661–673. [Google Scholar] [CrossRef]
  71. Rajabi, M.; Alesheikh, A.; Chehreghan, A.; Gamzeh, H. An innovative methodfor forest fire risk zoning map using fuzzy inference system and GIS. Int. J. Sci. Technol. Res. 2013, 2, 57–64. [Google Scholar]
  72. Calviño-Cancela, M.; Chas-Amil, M.L.; García-Martínez, E.D.; Touza, J. Interacting effects of topography, vegetation, human activities and wildland-urban interfaces on wildfire ignition risk. For. Ecol. Manag. 2017, 397, 10–17. [Google Scholar] [CrossRef] [Green Version]
  73. Hong, H.; Tsangaratos, P.; Ilia, I.; Liu, J.; Zhu, A.X.; Xu, C. Applying genetic algorithms to set the optimal combination of forest fire related variables and model forest fire susceptibility based on data mining models. The case of Dayu County, China. Sci Total Environ. 2018, 630, 1044–1056. [Google Scholar] [CrossRef] [PubMed]
  74. Michetti, M.; Pinar, M. Forest Fires Across Italian Regions and Implications for Climate Change: A Panel Data Analysis. Environ. Resour. Econ. 2019, 72, 207. [Google Scholar] [CrossRef] [Green Version]
  75. Nadezhdina, N.; Ferreira, M.I.; Conceição, N.; Pacheco, C.A.; Häusler, M.; David, T.S. Water uptake and hydraulic redistribution under a seasonal climate: Long-term study in a rainfed olive orchard. Ecohydrology 2015, 8, 387–397. [Google Scholar] [CrossRef]
  76. Giorgi, F.; Lionello, P. Climate change projections for the Mediterranean region. Glob. Planet. Chang. 2008, 63, 90–104. [Google Scholar] [CrossRef]
  77. Bucchignani, E.; Montesarchio, M.; Zollo, A.L.; Mercogliano, P. High-resolution climate simulations with COSMO-CLM over Italy: Performance evaluation and climate projections for the 21st century. Int. J. Climatol. 2016, 36, 735–756. [Google Scholar] [CrossRef]
  78. Turco, M.; von Hardenberg, J.; AghaKouchak, A.; Llasat, M.C.; Provenzale, A.; Trigo, R.M. On the key role of droughts in the dynamics of summer fires in Mediterranean Europe. Sci. Rep. 2017, 7, 81. [Google Scholar] [CrossRef] [Green Version]
  79. Eskandari, S. A new approach for forest fire risk modeling using fuzzy AHP and GIS in hyrcanian forests of Iran. Arab. J. Geosci. 2017, 10, 190. [Google Scholar] [CrossRef]
  80. Giuditta, E.; Coenders-Gerrits, A.M.J.; Bogaard, T.A.; Wenninger, J.; Greco, R.; Rutigliano, F.A. Measuring changes in forest floor evaporation after prescribed burning in southern Italy pine plantations. Agric. For. Meteorol. 2018, 256, 516–525. [Google Scholar] [CrossRef] [Green Version]
  81. Lukenbach, M.C.; Hokanson, K.J.; Moore, P.A.; Devito, K.J.; Kettridge, N.; Thompson, D.K.; Wotton, B.M.; Petrone, R.M.; Waddington, J.M. Hydrological controls on deep burning in a northern forested peatland. Hydrol. Process. 2015, 29, 4114–4124. [Google Scholar] [CrossRef]
  82. Hokanson, K.J.; Lukenbach, M.C.; Devito, K.J.; Kettridge, N.; Petrone, R.M.; Waddington, J.M. Groundwater connectivity controls peat burn severity in the boreal plains. Ecohydrology 2016, 9, 574–584. [Google Scholar] [CrossRef]
  83. Battipaglia, G.; Tognetti, R.; Valese, E.; Ascoli, D.; De Luca, P.F.; Basile, S.; Ottaviano, M.; Marchetti, M.; Esposito, A. Incendi 2017: Un’importante lezione. J. Silvic. For. Ecol. 2017, 14, 231. [Google Scholar] [CrossRef] [Green Version]
  84. Faggian, P. Estimating fire danger over Italy in the next decades. J. Environ. Integr. 2018, 3, 15. [Google Scholar] [CrossRef]
Figure 1. Overview of the study area: (a) area localization, (b) morphology and (c) land use classification.
Sustainability 11 07166 g001
Figure 2. Conceptual model of FFR application.
Sustainability 11 07166 g002
Figure 3. Mean precipitations and temperatures distribution maps for the Campania region, from EURO-CORDEX database (2019). Panel (a) shows the 2010–2018 precipitations, panel (c) the 2010–2018 temperatures, panel (b) the 2030–2050 projection for precipitations and panel (d) the 2030–2050 projection for temperatures.
Sustainability 11 07166 g003
Figure 4. Risk map for all the 12 parameters involved in FFR assessment.
Sustainability 11 07166 g004
Figure 5. FFR map of the Campania region for the year 2018. Figure a, b, and c represents a zoom on those areas characterized by higher FFR.
Sustainability 11 07166 g005
Figure 6. Representation of statistical correspondence between FFR classification and fire alerts.
Sustainability 11 07166 g006
Figure 7. (a) FFR map of the Campania region for the year 2050, (b) risk changes on the region from 2018 to 2050, (c) risk classes distribution for 2018 and 2050.
Sustainability 11 07166 g007
Table 1. List of collected data for the generation of the Forest Fire Risk (FFR) parameters.
DataParametersSource
DTMSlopeAdvance Spaceborne Thermal Emission and
Reflection Radiometer (ASTER) [57]
Aspect
Elevation
CLC 2018Distance from settlementCopernicus, Land Monitoring Service [58]
Distance from agricultural
Forest Type
Meteorological dataPrecipitation 2018MIPAAF. Agrometeorological Online Database 2018 [54]
Temperature 2018
CORDEX DatabaseTemperature 2050EURO-CORDEX 2019 [59]
Precipitation 2050
MODISFire alertsFire Global Forest Watch [53]
Hydrographic networkDistance from riverARPAC: Regional environmental protection agency [55]
Springs locationDistance from springsARPAC: Regional environmental protection agency [55]
Soil mapSoil textureDi Gennaro. [56]
Table 2. Pairwise comparison of the preparatory factors.
ParameterTMPPCPSLPFRSURBAGRSPRRODWTCASPELVSOLWeight
TMP1122334444551.88
PCP1122334444551.88
SLP0.50.511223333441.22
FRS0.50.511223333441.22
URB0.330.330.50.5112222330.75
AGR0.330.330.50.5112222330.75
SPR0.250.250.330.330.50.51111220.44
ROD0.250.250.330.330.50.51111220.44
WTC0.250.250.330.330.50.51111220.44
ASP0.250.250.330.330.50.51111220.44
ELV0.20.20.250.250.330.330.50.50.50.5110.27
SOL0.20.20.250.250.330.330.50.50.50.5110.27
Table 3. System indicators with classes and ratings for the assessment and mapping of FFR.
Precipitation (mm)Temperature (°C)Forest Type
ClassesRiskClassesRiskClassesRisk
800Very High13Very LowGrassland, sclerophyllVery High
800–900High13–14LowConiferHigh
900–1000Medium14–15.5MediumBroad leafed forestMedium
1000–1100Low15.5–17HighTransition forestLow
1100Very Low17Very HighMixed forestVery Low
Distance from Springs (m)Distance from Water (m)Soil Texture
ClassesRiskClassesRiskClassesRisk
100Very Low100Very LowClayVery Low
100–200Low100–200LowSilty, Silty clayLow
200–300Medium200–300MediumLoamyMedium
300–400High300–400HighLoamy sandHigh
400Very High400Very HighSandVery High
Elevation (m)Slope (°)Aspect
ClassesRiskClassesRiskClassesRisk
300Very High5Very Low0–70Very Low
300–600High5–25Low70–140Low
600–900Medium25–35Medium140–210Very high
900–1200Low35–45High210–280High
1200Very Low45Very High280Medium
Distance from Agricultural (m)Distance from Urban Settlements (m)Distance from the Main Road (m)
ClassesRiskClassesRiskClassesRisk
100Very High100Very High100Very High
100–200High100–200High100–200High
200–300Medium200–300Medium200–300Medium
300–400Low300–400Low300–400Low
400Very Low400Very Low400Very Low
Table 4. Sensitivity analysis results for FFH. Wherein ELV is elevation, SLP is slope, ASP is aspect, PCP is precipitation, FRS is forest type, TMP is temperature, ROD is distance from main road, AGR is distance from agricultural field, URB is distance from settlement, WTC is distance from main water course, SPR is distance from springs, and SOL is soil texture.
ParametersAssigned WeightRelative Relative
Weight 2018Weight 2050
TMP1.8815.7522.22
PCP1.8820.226.32
SLP1.2211.269.03
FRS1.2215.4411.56
URB0.753.322.69
AGR0.756.845.63
SPR0.448.546.8
ROD0.440.481.48
WTC0.447.425.61
ASP0.445.034.02
ELV0.273.352.75
SOL0.272.371.89

