1. Introduction
China has experienced tremendous progress in developing solar energy, with a cumulative installed photovoltaic power increasing from 19 MW in 2000 to 78,070 MW in 2016. Whereas there was no installed photovoltaic power before 2000 [
1], China now ranks first in the world. Starting from 2009, the growth rate in solar energy has been at least 50% each year, reaching the highest growth rate of 300% in 2011. Meanwhile, research and development (R&D) investments are taking advantage of solar energy, which can create significant benefits over a long period of time [
2,
3], and reduce carbon emission [
4,
5]. Along this line, an increasing number of research institutes and researchers in China have joined this research field, leading to a sharp increase in publications about solar energy.
However, this rapid growth raises a number of questions. First, to what extent is scientific research output rapidly developing in China? Second, what is the impact and efficiency of the scientific research output? Third, are the impacts and efficiencies developing simultaneously? Answering these questions helps identify whether China’s solar research is quantitatively or quality-driven, and highlights policy implications for the healthy development of China’s solar research field and industrial sector.
Many scholars have used statistical methods, particularly the bibliometric method, to quantify energy-related research products. Mao et al. explored research activities and future directions of alternative energy by using the SCI-E and the Social Sciences Citation Index (SSCI) [
6]. Xu and Boeing assessed the temporal, spatial, structural, and current perspectives in the biofuels field, using records from the Institute for Scientific Information (ISI) and Web of Science from 1979 to 2012 [
7]. Du et al. examined the rising number of publications about energy efficiency from 1991–2010 through a bibliometric method. That study analyzed the most important journal and the most highly cited article [
8]. Wang et al. applied a series of indicators to describe the development of waste-to-energy incineration research; that work combined a variety of methods, including TP, TC, ACPP, IF and a visualized SNA method to identify hot topics in renewable energy research fields [
9]. Mao et al. explored the knowledge about biomass energy from 1998 to 2013, from the following five perspectives: authorship, countries, institutions, high-cited papers, and keywords [
10]. Yu et al. investigated and summarized the characteristics of low-carbon energy technology literature to show the distribution of geography, journals, subjects, collaboration, national comprehensive strength, and hot topics, and subsequently evaluated the research trends of such studies in the future [
11]. Chen et al. investigated the characteristics of energy-related literature, recognized global research patterns, and forecasted future research directions, conducting a complete review on related research progress [
12]. Sinha and Joshi analyzed the status of solar PV research in India, presented the pattern of output, impact of research, thrust of research, and discovered the leading agencies, institutes and authors including their own research thrust [
13]. Using the feature extraction and data analysis methods, Vidican-Sgouridis, Woon et al. explored the patterns and trends of public research institutions in technological innovation on the solar photovoltaic (PV) sector [
14]. Some studies have applied bibliometric methods to identify the current status of other energy research areas [
15,
16] and carbon emission research [
17].
Focusing on the field of solar energy, Dong et al. revealed a linear growth in the number of publications on solar energy from 1991 to 2010; their study described the full range of global research, including publication type and language, publication distribution by countries, subject categories and journals, and keyword frequencies [
18]. Du et al. reviewed and sorted out the solar energy literature of 1992–2011 from four aspects: characteristics of publications, publication distribution in different countries and territories, institutes and research subjects, and main solar energy research fields [
15]. De Paulo and Porto investigated an open innovation map, analyzing solar energy and opening innovation publications between 2000 and 2014 [
19]. Sanz-Casado et al. analyzed scientific publications on solar energy published in Germany and Spain, and revealed a significant increase in solar research. The study evaluated these papers from a citation point of view and further found evidence that these papers had a greater impact compared to publications on other renewable energy [
20]. Chen et al. used the Thomson Data Analyzer (TDA) method to summarize Chinese energy and fuel research; they presented a keyword analysis to assess and evaluate research priorities, topics, and shifts in topic [
21]. Li et al. applied bibliometric and technology methods to estimate the future development of the dye-sensitized solar cell technology-based industry in China [
22]. Zhang et al. compared the solar energy research between the United States (USA) and China by exploring scientific relatedness at the topic and country levels using keywords in papers from 2000 to 2013 [
23].
Previous studies have focused on energy and solar energy using bibliometric methods to discover research characteristics, but not efficiency and present the status quo of solar research. However, facing the scientific research output rapidly developing in China, evaluating whether China’s solar research is quantitatively or quality-driven, which is of great importance for formulating and implementing research policy. From the perspective of basic research, this study highlights the need for a systematic evaluation of the scientific production, impact, and efficiency with respect to the growing body of literature related to solar energy in China. The study’s innovation is to reveal the development, impact, and efficiency of solar energy related literature derived from SCI-E database between 2000 and 2017 for China. Answering these questions helps indicate and highlights policy implications for the healthy development of China’s solar research field and industrial sector.
The remaining structures of the paper are organized as follows:
Section 2 describes the research framework, data source and methods;
Section 3 presents the analysis results;
Section 4 discusses the results;
Section 5 summarizes the main conclusions and then presents the limitation and the boundaries of this paper, as well as the future study.
2. Data Source and Methodologies
2.1. Research Framework and Data
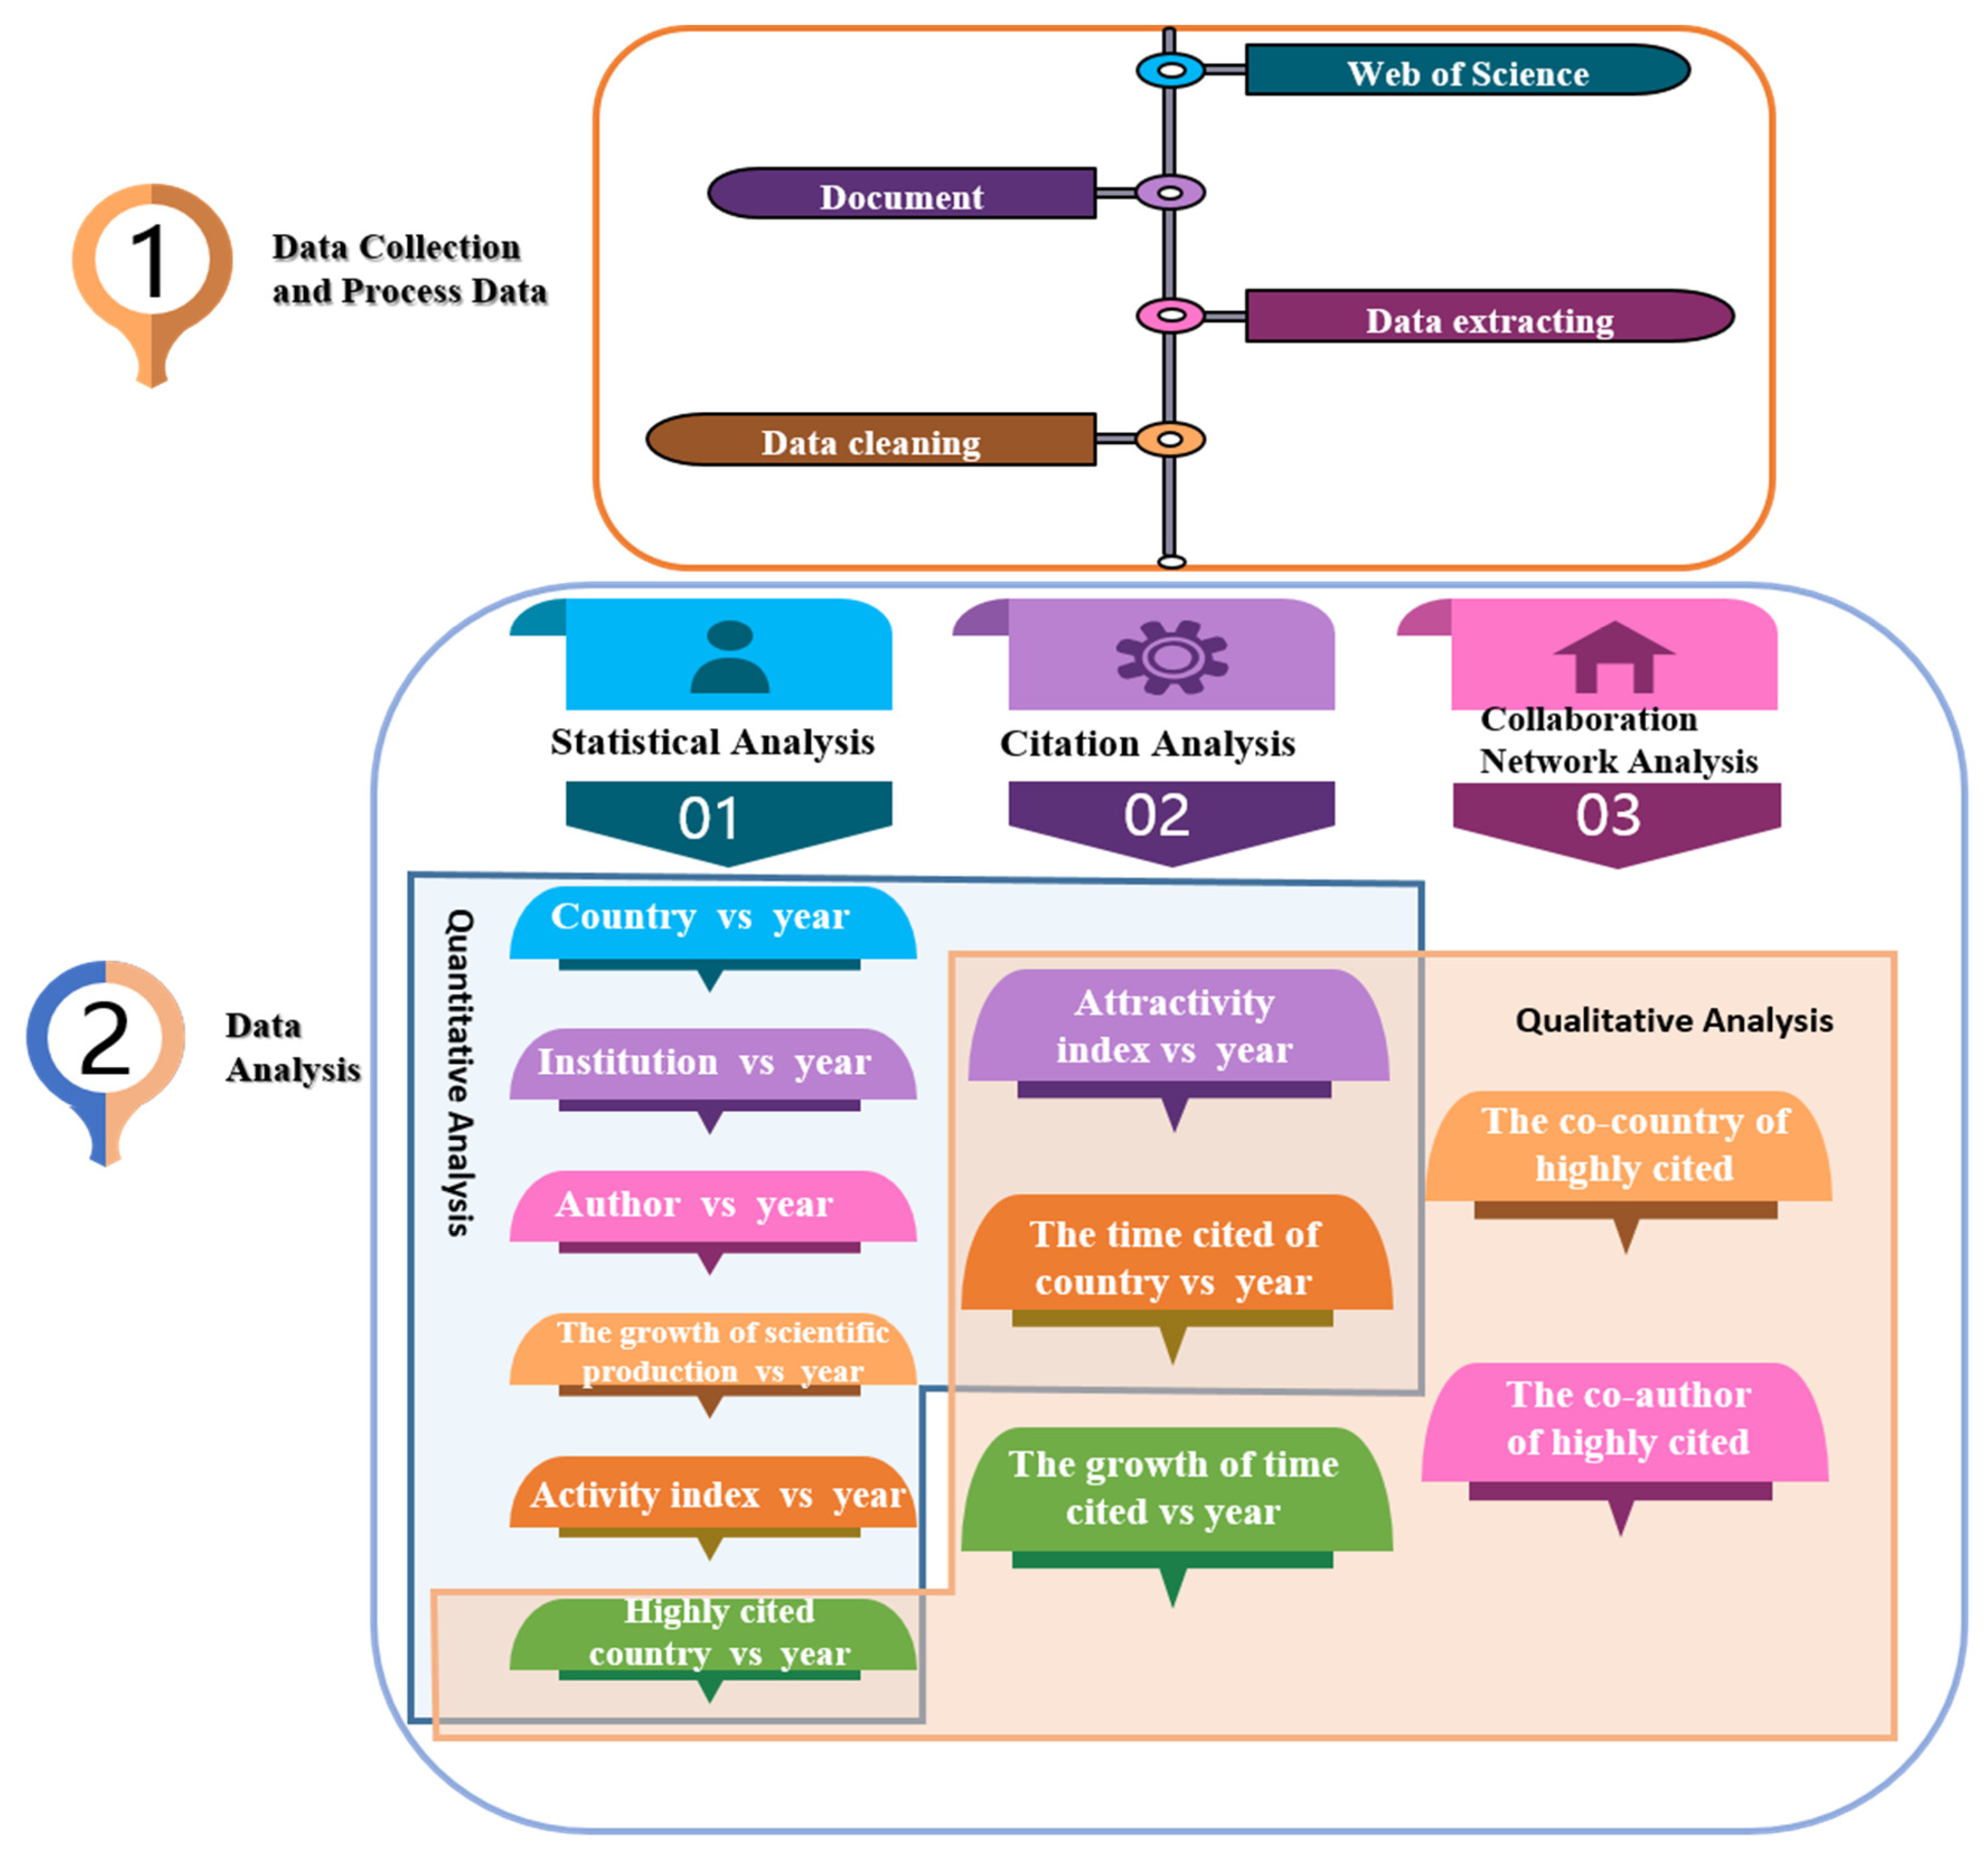
Figure 1 provides the research framework of this study. After data collection and data processing, this study analyzed both the quantity and quality of China’s solar energy research by means of applying statistical analysis, citation analysis, and collaboration network analysis methods. The object of this study is to investigate China’s solar energy research between 2007 and 2015 from two perspectives: quantity (numbers of papers) and quality (number of paper citations). The study drew upon the SCI-E dataset, produced by the ISI, which includes more than 33,000 notable and significant journals. This resource is considered the authoritative dataset because of a rigorous selection process [
24,
25,
26,
27]. The research literature is fully indexed by authors, author affiliations, countries, publication year, times cited, and other factors [
28,
29].
The data for 2018 was incomplete at the time of this study. Therefore, the break point for the data collected in our paper was the end of 2017, current as of 23 May 2018. We used a query method to collect the data from SCI-E. The specific search formula was as follows: Topic = (“solar energy” OR “solar heating” OR “photovoltaics” OR “solar thermal energy” OR “solar photovoltaics”). The document type was limited to articles published during the period 2000–2017, 100,928 articles were collected. For papers with authors from different countries, each country was counted only once. Therefore, the country-level count could be larger because there were multiple authors from a single country.
2.2. Citation Analysis
When an article references another article, it forms a citation relationship between the two papers. A “times cited analysis” refers to a citation analysis characterized by the source article, the influential article, and the inheritance relationships. The analysis can determine the papers that both make and receive citations, and provide information about the total number of citations those papers make or receive [
30,
31,
32]. Moreover, the scientific citation index approach uses unique citation channels and comprehensive scientific data to count a large number of citations. To this end, the quantitative indicators emerged, such as the impact factor, citation frequency, and real-time index of a certain journal’s paper in a certain discipline. These are important indicators of scientometrics. Citation analysis is widely applied to identify knowledge structures in many disciplines [
33,
34,
35]. The highest citation frequency indicates that the article has a significant impact in the field, has been highly valued by international peers, and has a high academic level. To be exact, the citation analysis reflects the impact analysis of academic papers.
2.3. The Activity Index and Attractivity Index
The Activity Index (AI) was first proposed by Frames [
36] and determined by Schubert [
37]. It reflects the contributions and efforts associated with a country’s publications in a certain field. The AI compares the research effort of a country with the worldwide research effort in a given field. The formula for AI is expressed as follows:
In this expression,
represents the scientific publication production of country
j in year
t on the topic of solar energy;
represents the total scientific publication production from country
j during the given period on solar energy;
represents total scientific publication production worldwide in year
t themed on solar energy;
represents the total scientific publication production around the world during the given period on solar energy. AI is a relative evaluation indicator of research work, comparing one country with the worldwide level. Indicator values highlight three situations, as follows. If AI = 1, a country’s research effort is equivalent to the world’s average level for the given field. I AI
1, a country’s research effort exceeds the world’s average level for the given field. If AI
1, a country’s research effort is lower than the world’s average level for the given field [
37].
The Attractivity Index (AAI) reflects the impact of a country’s publications in a particular area. The AAI compares one country’s research impact, using citations, with the worldwide average level in a given field [
37]. The formula for AAI can be expressed as:
In this expression,
represents the total citations cited by publications published by country
j in year
t about solar energy;
represents the total citations cited by publications published by country
j during a certain period about solar energy;
denotes the total citations cited by publications with respect to solar energy published globally in year t;
denotes the total number of citations in publications published worldwide during the given period about solar energy. AAI is a relative evaluation indicator of research impact, comparing one country with the worldwide average level. Indicator values highlight three situations, as follows. If AI = 1, a country’s research impact is equivalent to the world’s average level for the given field. If AI
1, a country’s research impact exceeds the world’s average level for the given field. If AI
1, a country’s research impact is lower than the world’s average level for the given field [
37].
2.4. Collaboration Network Analysis
This study applied visual analysis software developed by the Knowledge Management and Data Analysis Lab of Beijing Institute of Technology to carry out a collaborative network analysis. Using co-author collaboration as an example, this method was specifically implemented as follows:
Author identification and normalization. First, the authors in the documents were identified and extracted, using the name dictionary and regular expression technology to standardize and merge the same authors. A normative relationship matrix between the author and literature was established, and the order in which each author appears in each paper was recorded. Then, the papers of the same author were merged to establish the membership relationship matrix between the author and documents, as shown in Matrix C. To simplify the analysis, the third author and any additional authors were classified as a third author.
In this expression,
indicates that document
j belongs to the author i. Otherwise,
.
Calculate the number of papers that the authors co-authored. The number of documents was calculated and a number matrix was constructed for each author, with classification as first, second, third, and other co-authors.
Construct collaboration matrix. Each author’s partnership matrix CC’ was constructed using the matrix C. The elements of the collaboration matrix represented the number of co-authors; the sum of rows or columns indicated the number of papers published by the author. This relationship was mapped to the nodes and connections of the collaboration network: the line represents the collaboration, the node represents one author, and the size of the node represents the number of papers published.
3. Analysis Results
100,928 articles are raw data collected from SCI-E. We used the visual analysis software Vantagepoint to process the raw data and conduct statistical analysis. After statistical analysis, the total scientific production, institutions and researchers, total times cited, and highly cited were counted and obtained, analyzed, and shown in Figures 2–6, and 8. In addition, we reprocessed the statistical results applying formulas 1–3 to show the results in Figures 7 and 9.
3.1. The Development of Scientific Production
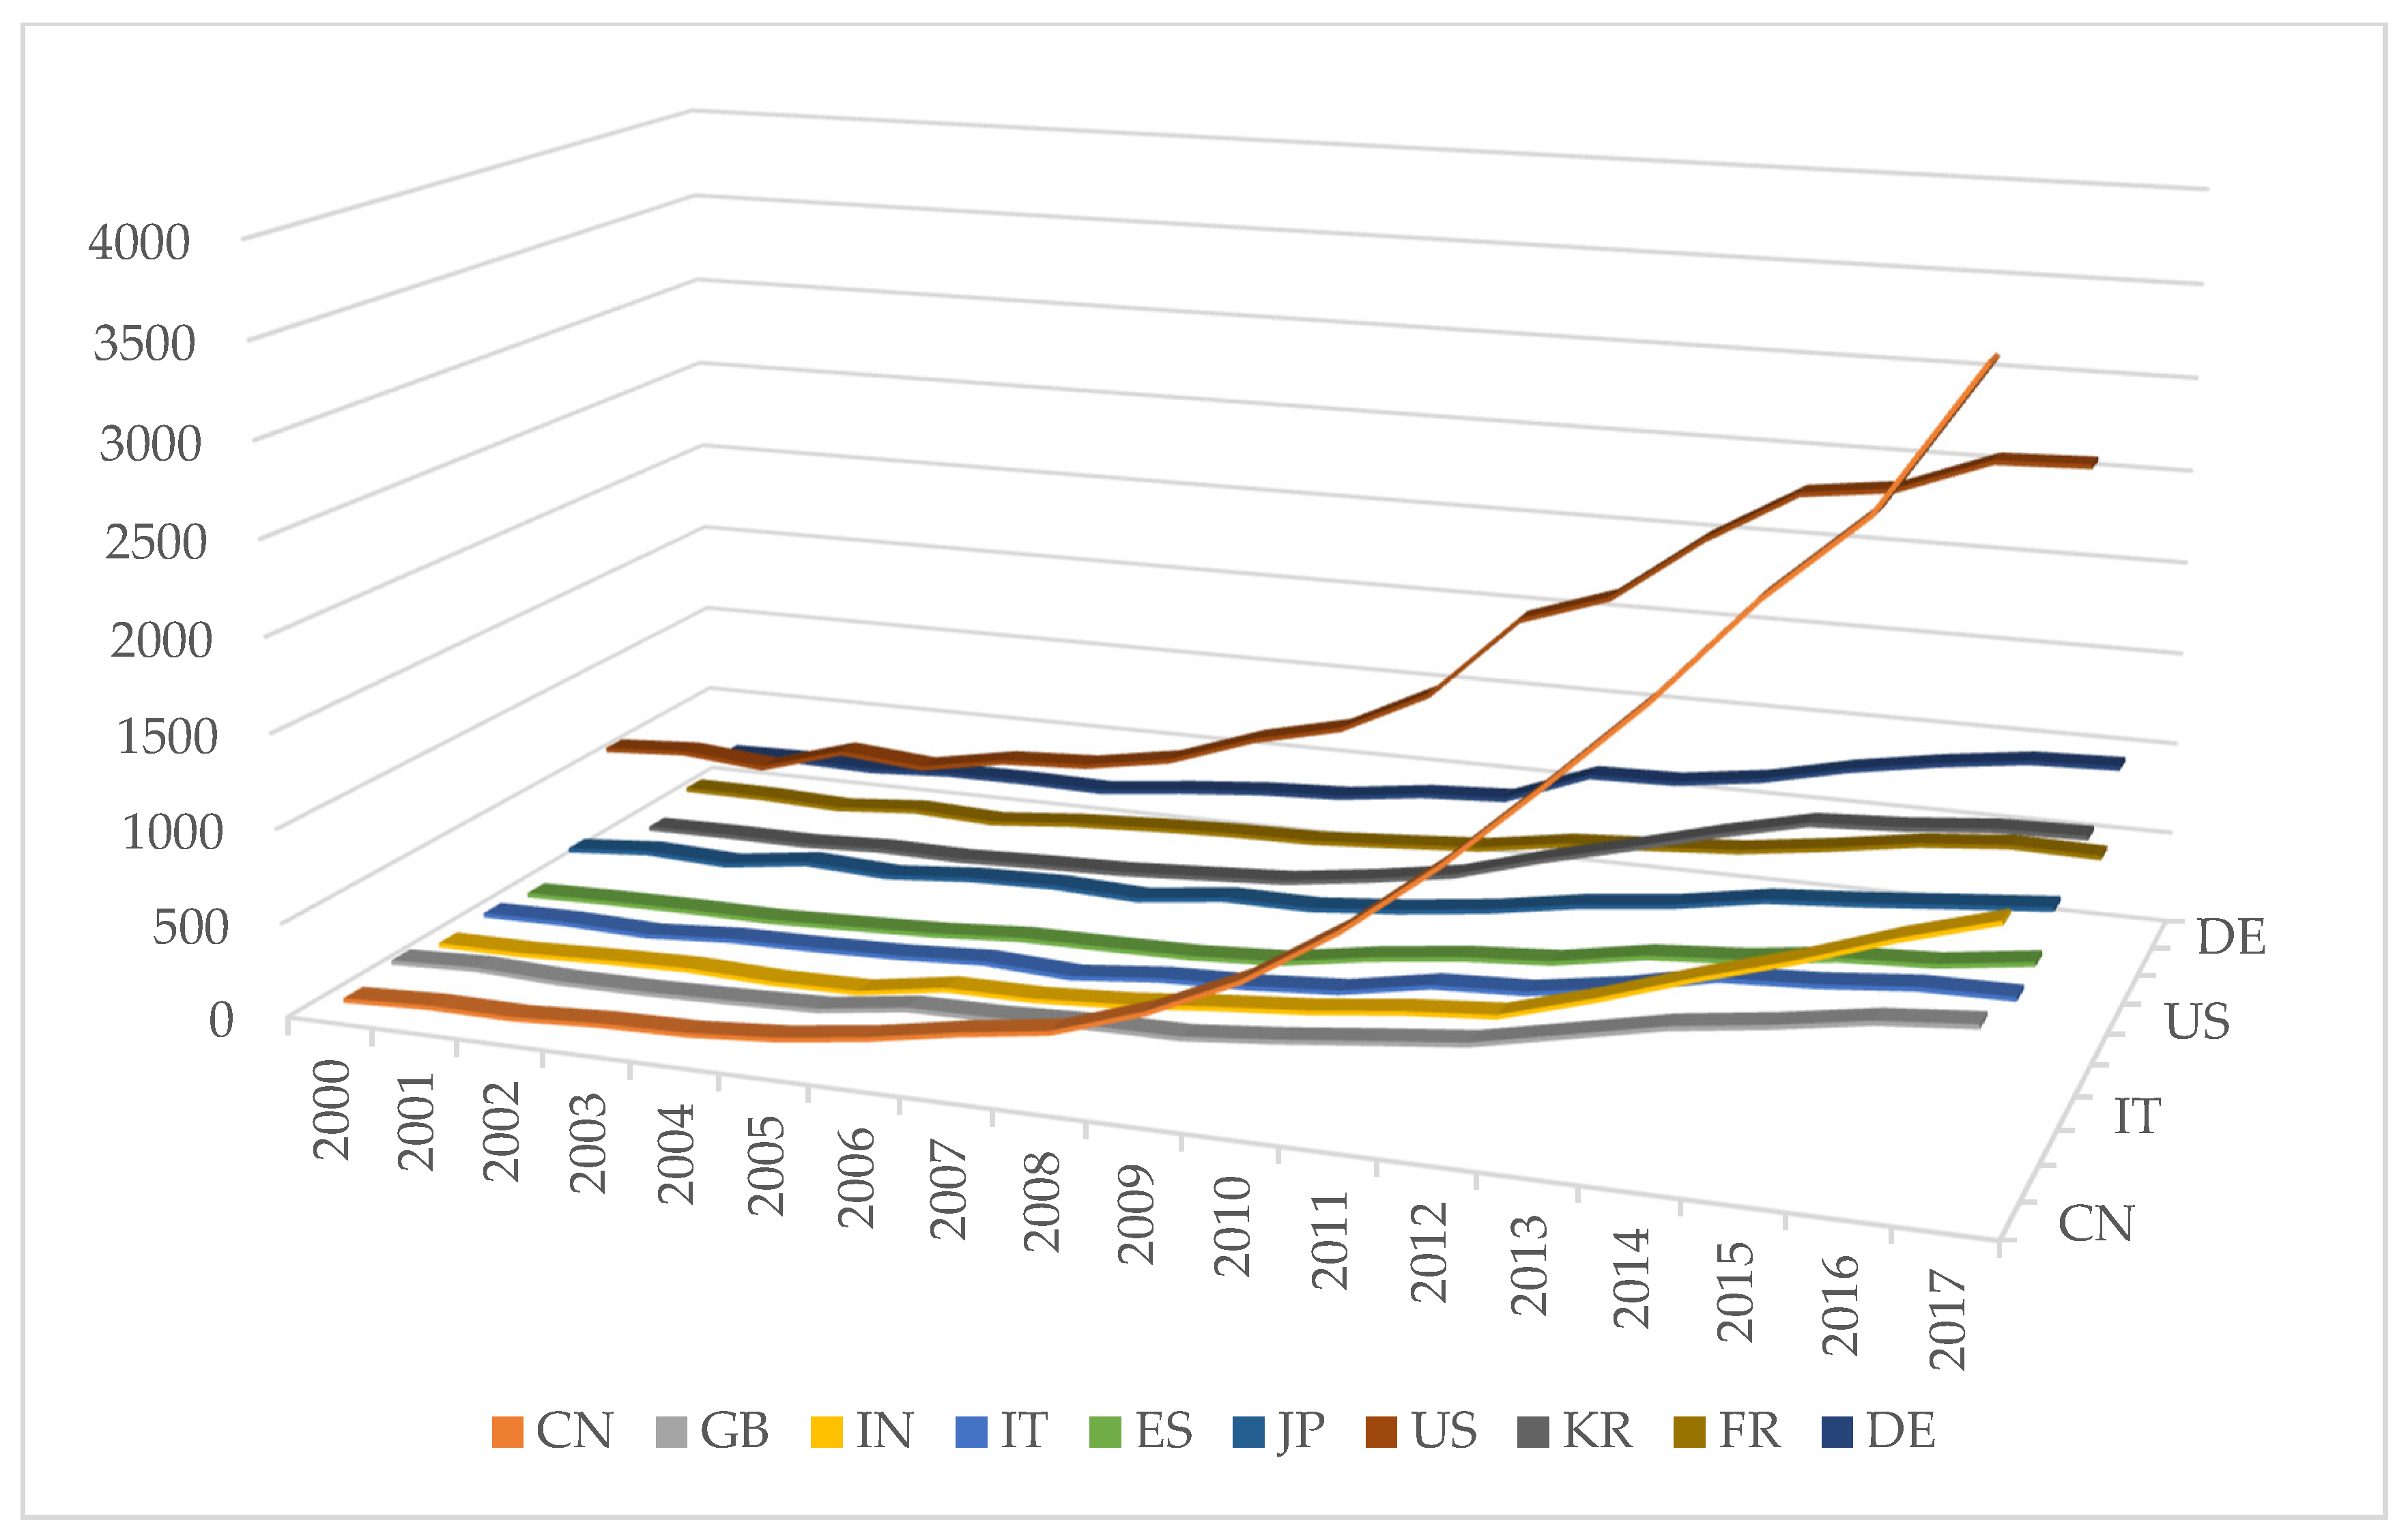
Figure 2 exhibits the temporal characteristics of scientific production in the area of solar energy during the period 2000–2017; it indicates that scientific publications consistently increased throughout the period. The number of scientific publications increased from 69 in 2000 to 3928 in 2017; there is a cumulative increase of 570%, and an average annual growth rate of 33% during this phase. The development of scientific production in solar energy can be divided into two stages: the incubation stage and the burgeoning stage. In the incubation stage (2000–2005), scientific production in solar energy experienced a steady increase except 2002, which saw a weak downturn. This was followed by a significant increase in the burgeoning stage (2006–2017). During the burgeoning stage, the scientific production continued to rise, with an average annual growth rate up to 46%.
Scientific production of China exceeded Italy, France, England, Japan, Germany, and the United States starting in 2001, 2004, 2006, 2007, 2008, and 2015, respectively. The key turning points appeared in 2000, 2005, and 2015. There was no installed photovoltaic power in China before 2000; China began developing solar energy that year, reaching a cumulative installed photovoltaic power level of 19 MW in 2000. The Renewable Energy Law of the People’s Republic of China was formulated, promulgated, and implemented in 2006. In 2015, China planned to make renewable energy account for 20% of primary energy consumption by 2030.
Alongside this development, scientific production first surpassed 1000 in 2011 and passed 3000 in 2016. The progressive increase of scientific production highlights the consistent growth and communication in the solar energy research field over the past 18 years.
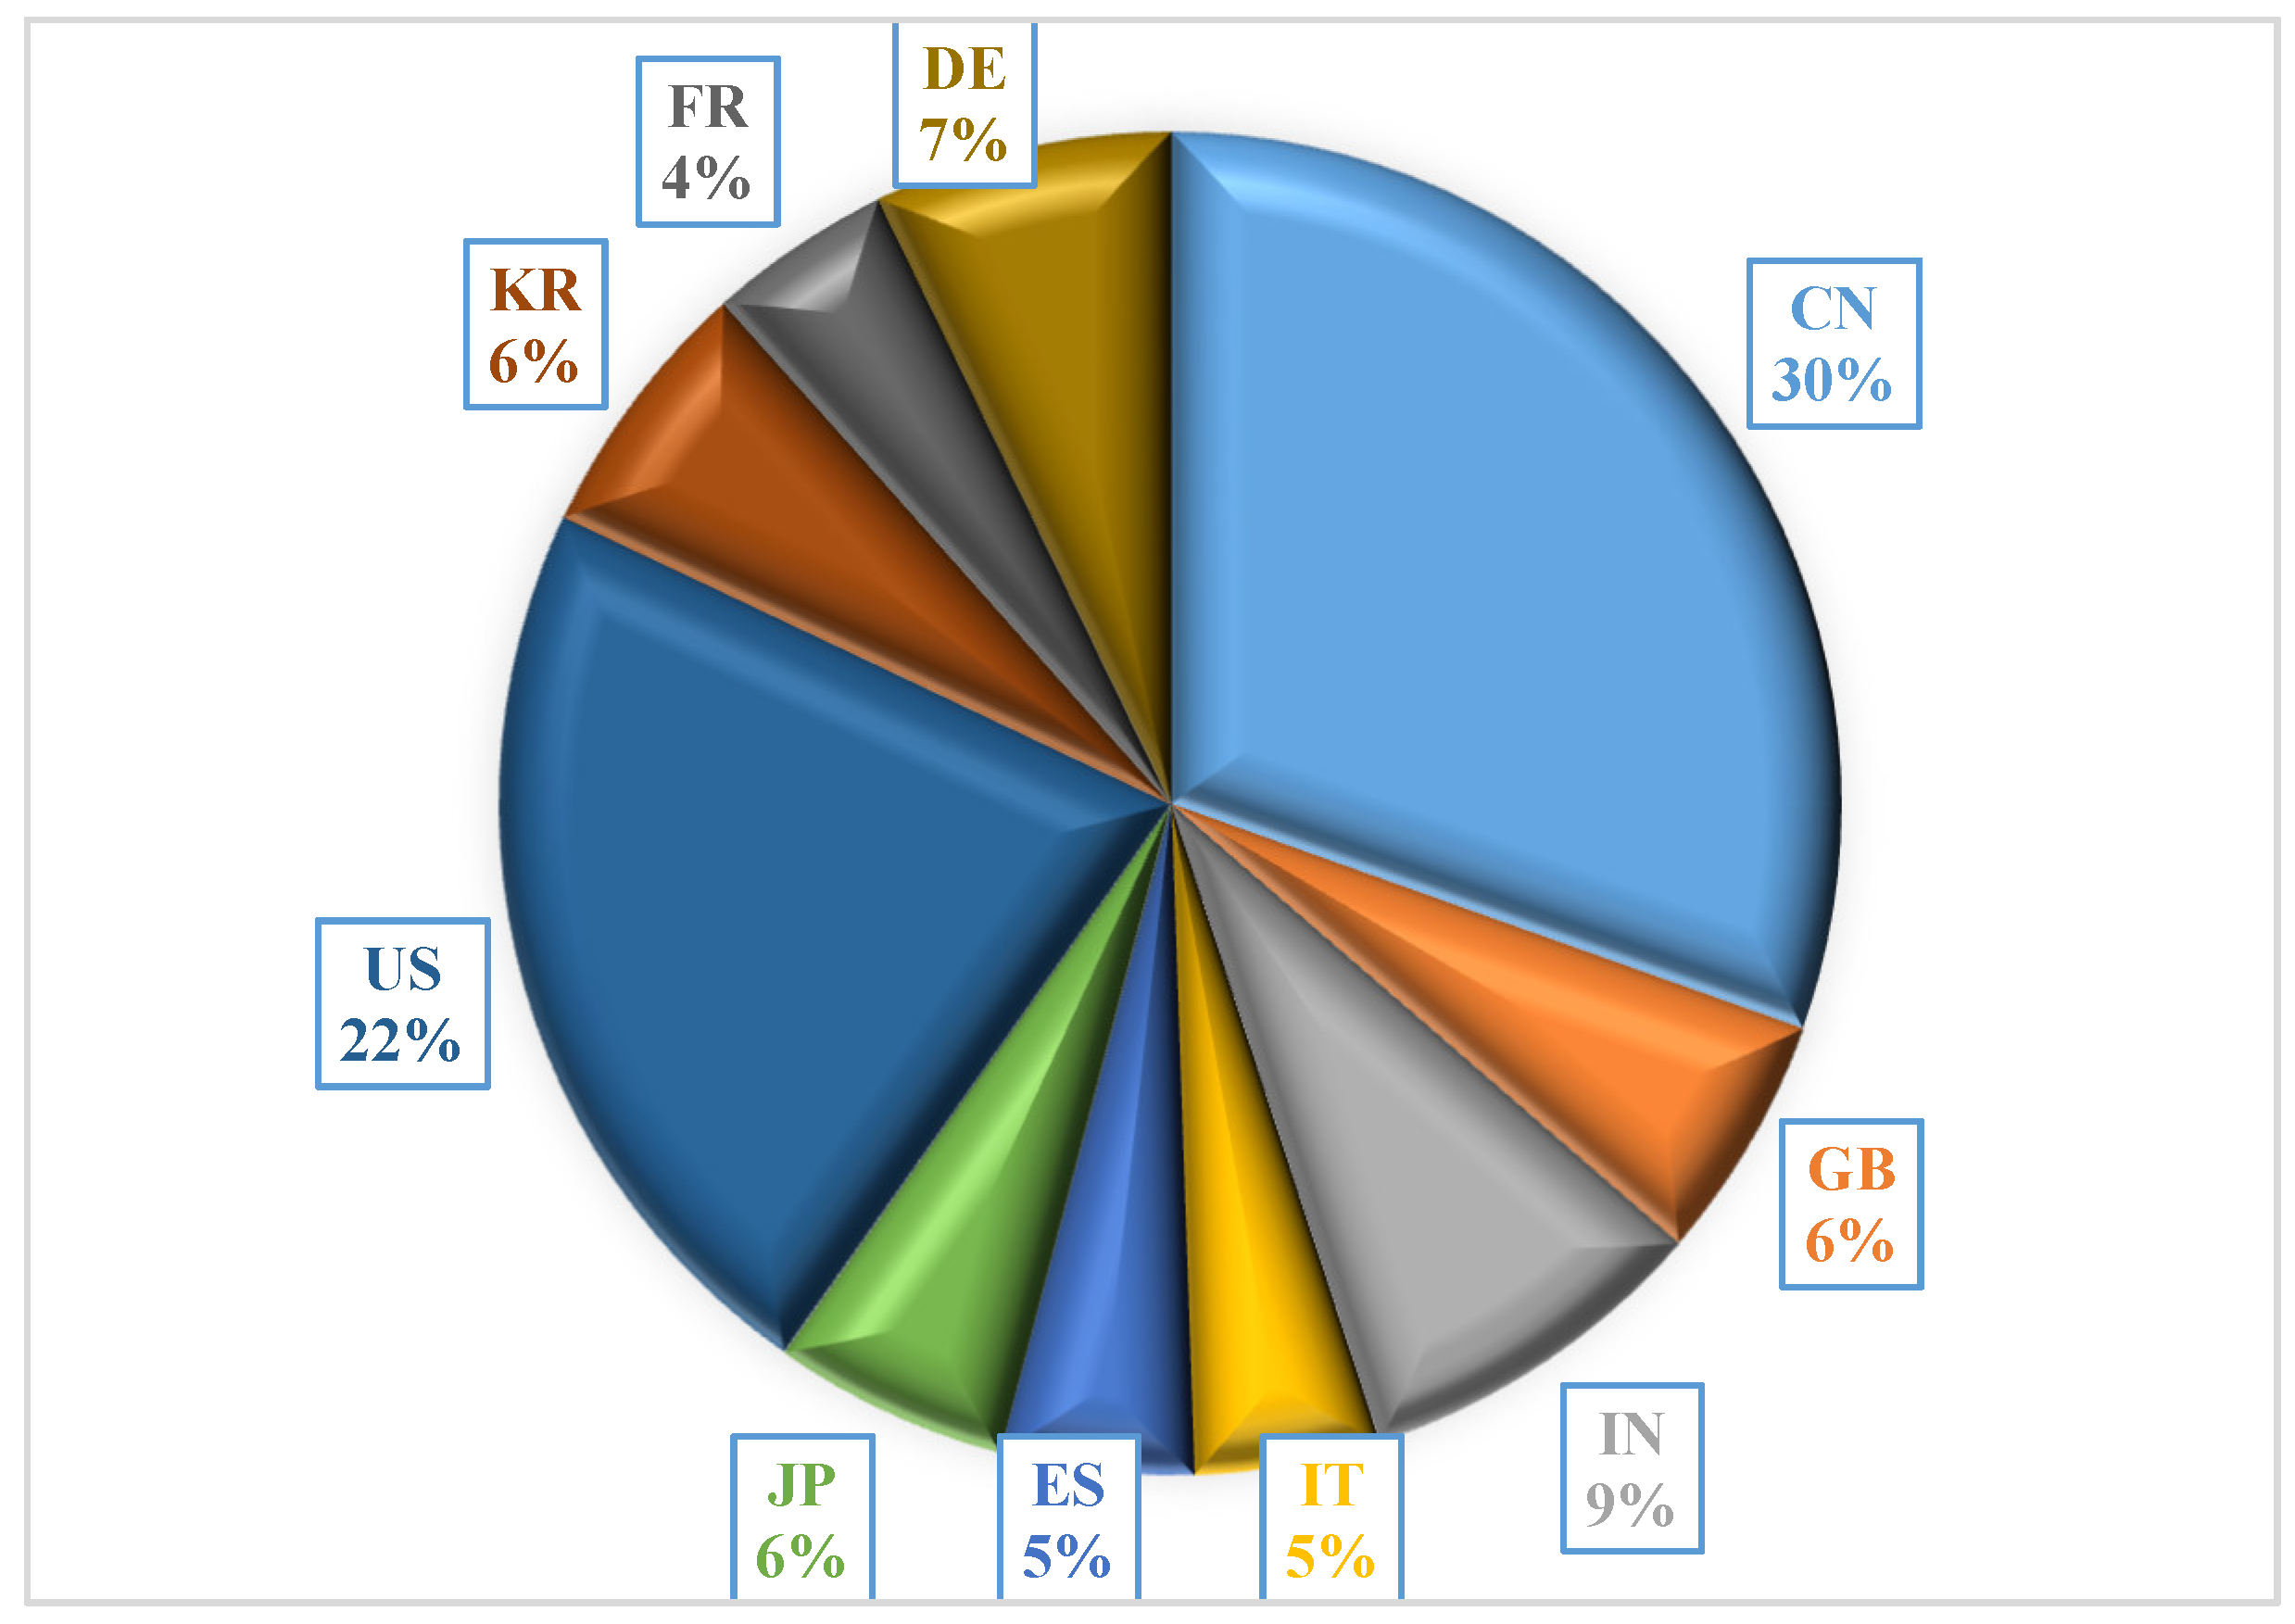
Figure 3 shows that China is the country with the largest population, occupying 30% of the world. The changes in scientific production are in line with solar energy development trends in China. China has surpassed the United States, becoming the most productive country with respect to solar energy in 2015.
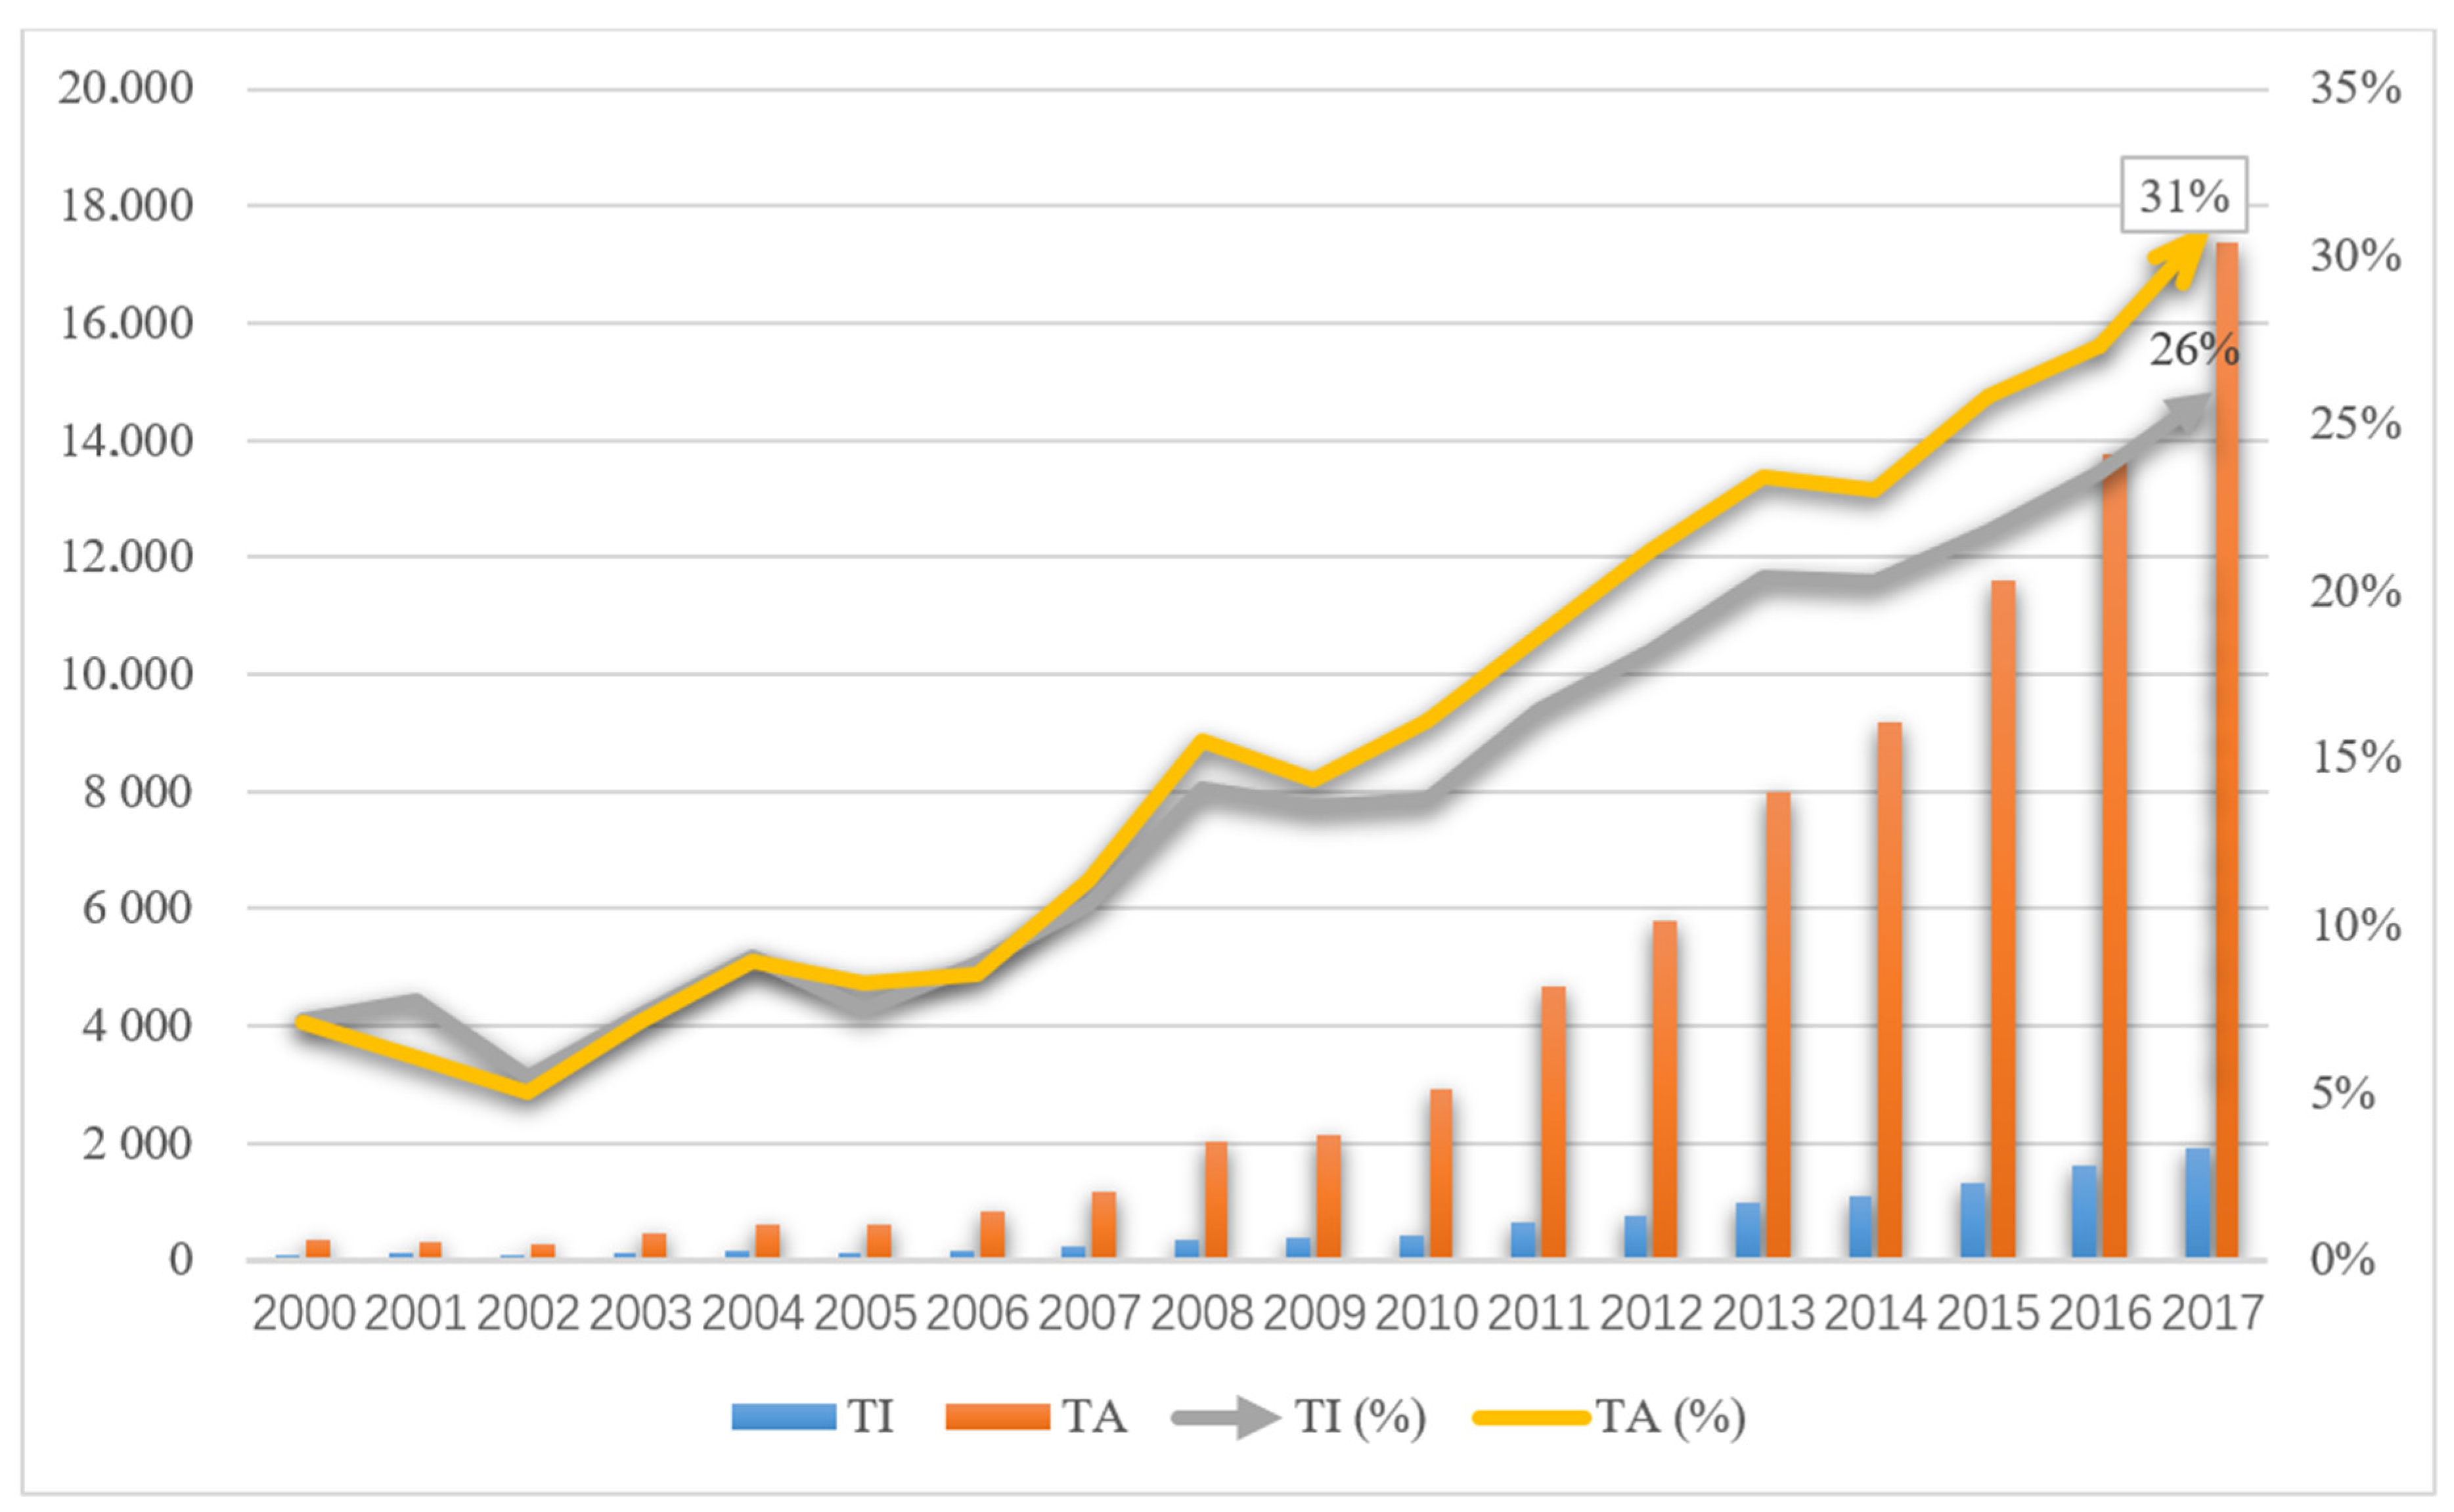
Figure 4 shows a sharp increase in the number of total researchers and a steady growth in the number of total institutions engaged in solar energy. The number of total researchers sharply increased from 346 in 2000 to 17,387 in 2017. China contributes up to 31% of total research worldwide. The number of total institutions studying solar energy increased by 1800%, from 96 in 2000 to 1904 in 2017. This represents an 18-fold increase.
3.2. The Impact of Scientific Production
Due to the lagging effect of the citation rate, publications generally receive more citations two years after publication. In addition, because the database had not yet been completed for 2018, the impact analysis used scientific production metrics that reflect publication dates at the end of 2015. The number of citations was up-to-date as of 23 May 2018. It reflects the significant differences between the growth rate of scientific production and the growth rate of citation quantity.
Figure 5 reveals that the growth rate of scientific production and the growth rate of citations experienced a general decrease; the growth rate of scientific production was consistently larger than the growth rate of times cited between 2006 and 2015.
From 2000 to 2005, the growth rate in scientific production and the growth rate in number of times cited all suffered significant fluctuations. Because of the very small initial number of scientific publications, ranging from 69 in 2000 to 152 in 2015, a slight change led to a relatively large change in the growth rate of scientific production and number of times cited. From 2006–2015, even though the growth rate of scientific production presented a generally decreasing trend, the value remained higher than 40% in 2006, 2009, 2010, and 2011. With the scientific production reaching 2282 in 2015, the growth rate of scientific production reached 22.48%.
Based on the author’s address and affiliations, we extracted country-level information to evaluate the contributions of different countries/territories. Papers with country-level information were used to assess the characteristics of country/territory productivity; papers without author address and affiliations were eliminated. There were 13,959 papers in 2017 across all countries/territories; 128 countries contributed to published papers related to solar energy. Therefore, nearly 65% of the world’s 196 countries have authors who have published in the field of solar energy. In this study, we compared the top ten most productive countries. While there was significant geographic breadth, the top ten most productive countries/territories were responsible for 76% of the 10,551 papers.
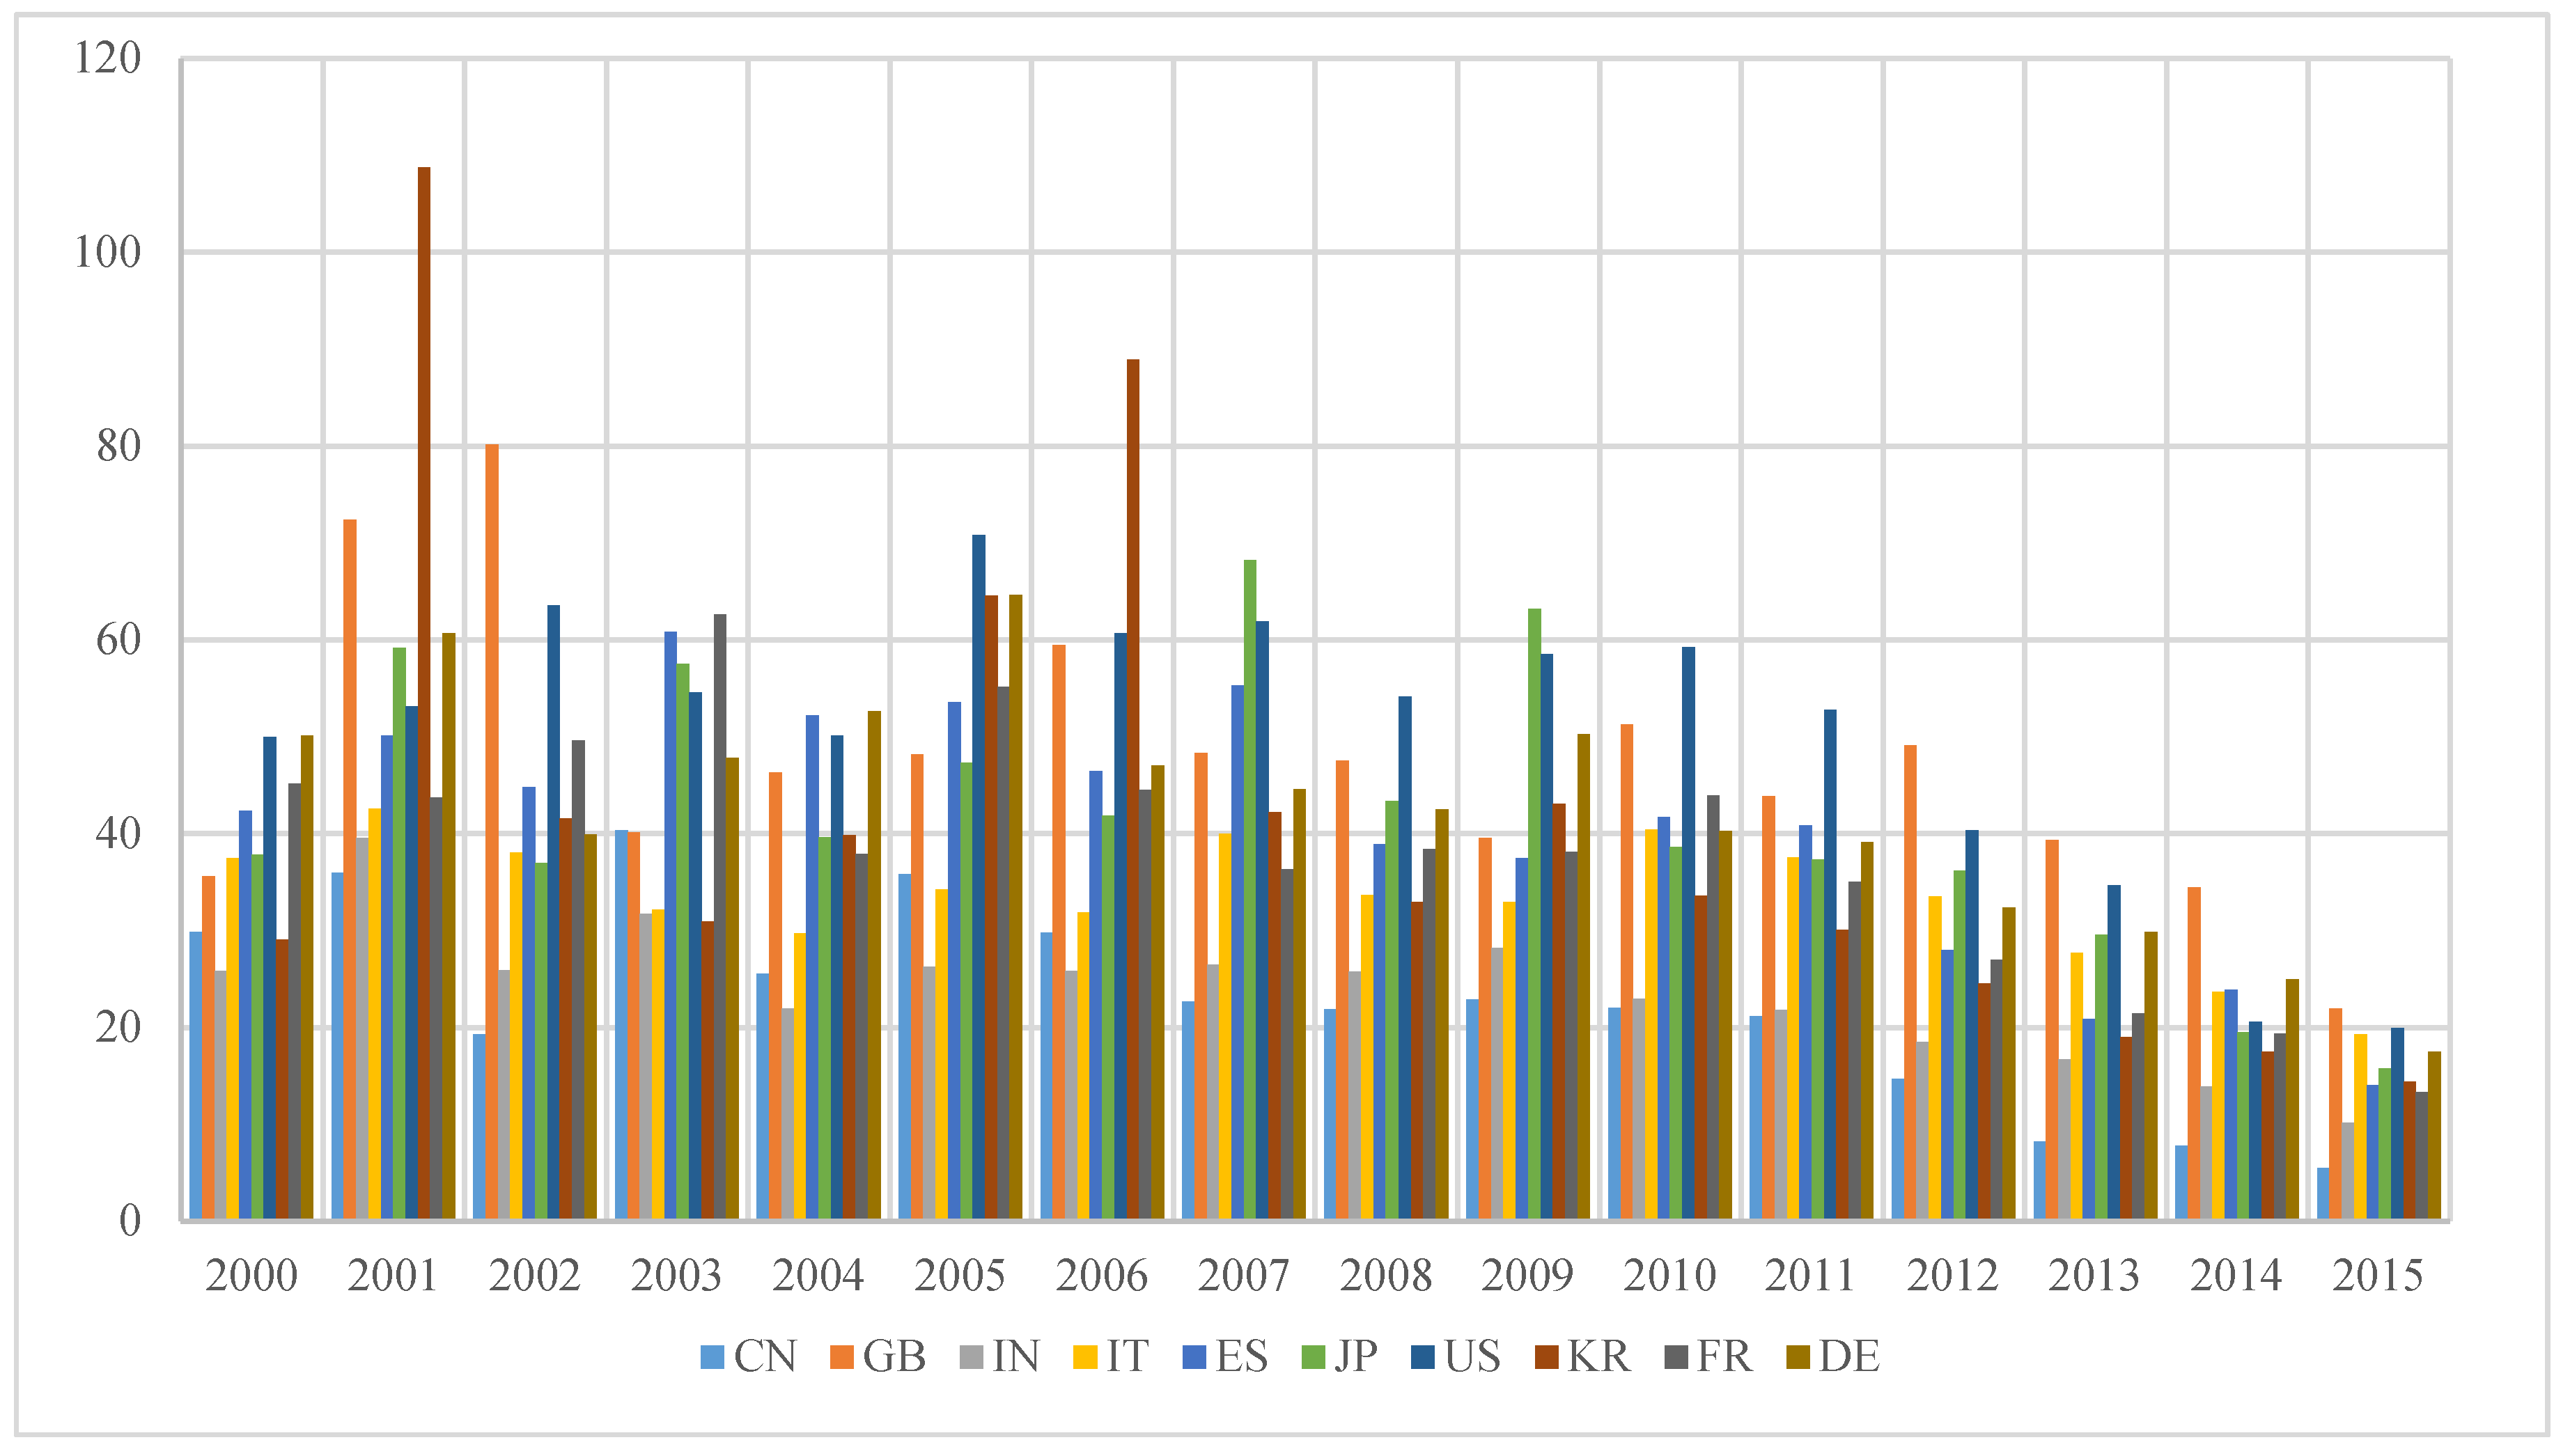
The number of citations of the literature was calculated within the timeframe of the publication date to 23 May 2018. Due to different publication dates, the amount of time available for citations to occur is different. This made it unreasonable to compare average numbers of citations per paper for different countries in different years. As such, this study further compared the average number of citations of papers from different countries in the same publication year, as shown in
Figure 6. The scatter plot shows that the top ten countries can be divided into two groups: high-impact countries and low-impact countries. The high-impact countries are GB, US, JP, IT, and DE. The low-impact countries include CN, IN, KR, FR, and ES.
China remained low across the study period. China was the antepenultimate country in 2000 and 2005, and ranked the fifth from the bottom in 2003. China remained in last place from 2007 to 2015. The United States was consistently ranked in the top 2, with the exception of 2004 (top 3), 2001 and 2003 (top 4), and 2014 (top 5). Meanwhile, the US shows a declining trend, which can be attributed to GB moving beyond the US to become the first in 2012 and 2015.
3.3. The Activity Index and Attractivity Index
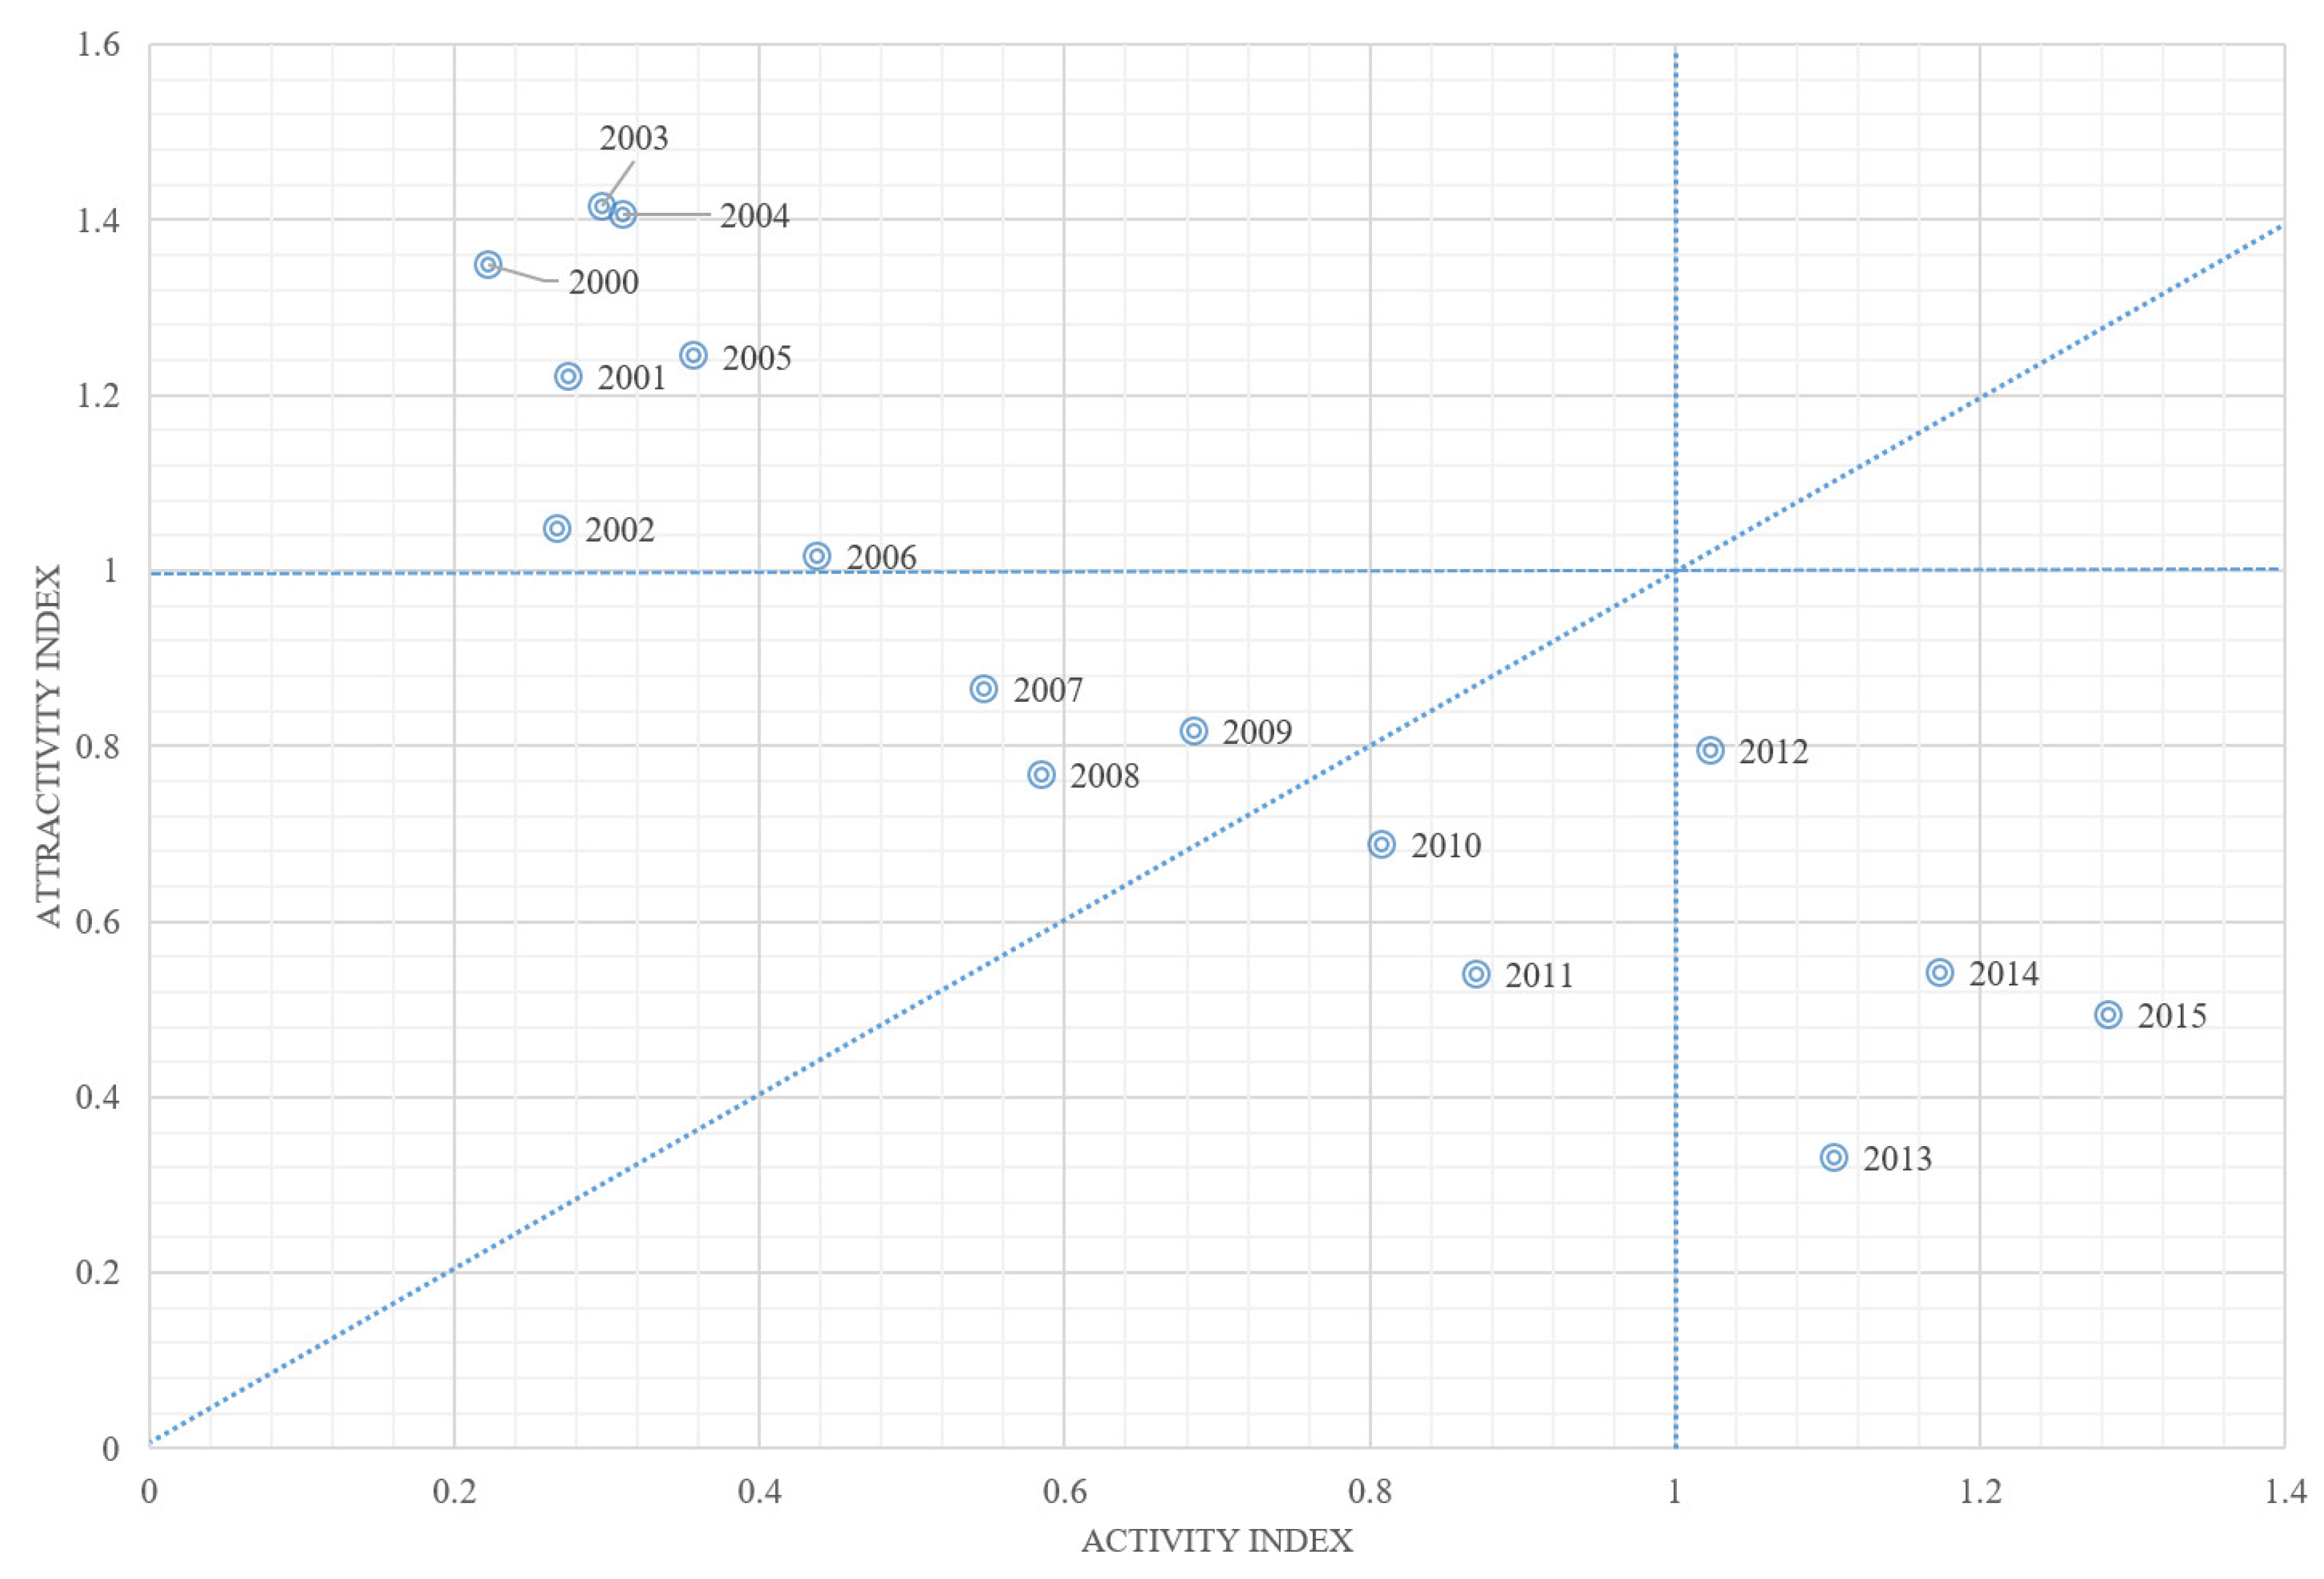
The relational chart in
Figure 7 displays China’s activity and attractivity index compared with the world average in different years. The attractivity index versus the activity index reflects effectiveness. The horizontal axis represents the activity index, which reflects the research effort; the vertical axis represents the attractivity index, which reflects the impacts of papers. In addition, the three dashed lines represent the unit level (world average level) of the activity index, attractivity index, and the attractivity index versus the activity index. A point above the horizontal or diagonal dashed line indicates the performance is better than average. A point to the right to a vertical dashed line also indicates the same. Otherwise, the performance was less than average.
China reached the highest scientific production level in 2015, during the 2000–2015 study period. The scientific production in 2012–2015 exceeded the world average; in other years, scientific production was below the world average.
Figure 7 shows a marked upward trend in the activity index. The impact value of China’s scientific production in 2012–2015 were below the world average. The highest attractivity index appeared in 2003, indicating the scientific publication production in 2003 had the most impact. The impact between 2000 and 2006 exceeded the world average, and the other years were lower than the world average, implying a downward trend in the attractivity index. The most efficient year was 2000, and the lowest efficiency appeared in 2013.
From 2000 to 2009, the attractivity index versus the activity index exceeded 1; this means the research effort devoted to solar energy achieved sufficient returns from the perspective of impact. Overall, there was a sharp decrease of effectiveness. From 2010 to 2015, the effectiveness was below the world average, indicating that the impact did not compensate the effort. Both the relative effort and impact were below the world average in 2007–2011. In particular, the effectiveness of China’s solar research transcended the world average and still deserved support and attention from 2007 to 2009. The impact and effectiveness were below the world average from 2012 to 2015, and there was a sharp decrease in the impact and effectiveness.
3.4. Highly Cited Analysis
The Highly Cited Papers are the top 1% of papers per year, based upon the most recent 10 years of publications in each of the 22 ESI subject areas. The list is dynamic and is updated once every two months [
38,
39]. The indicator is classified as “highly cited” in Essential Science Indicators (ESI), which is known as an indicator of scientific excellence and top performance [
40].
This part of the study analyzed the highly cited papers in the field of solar energy in order to explore top performance with respect to research.
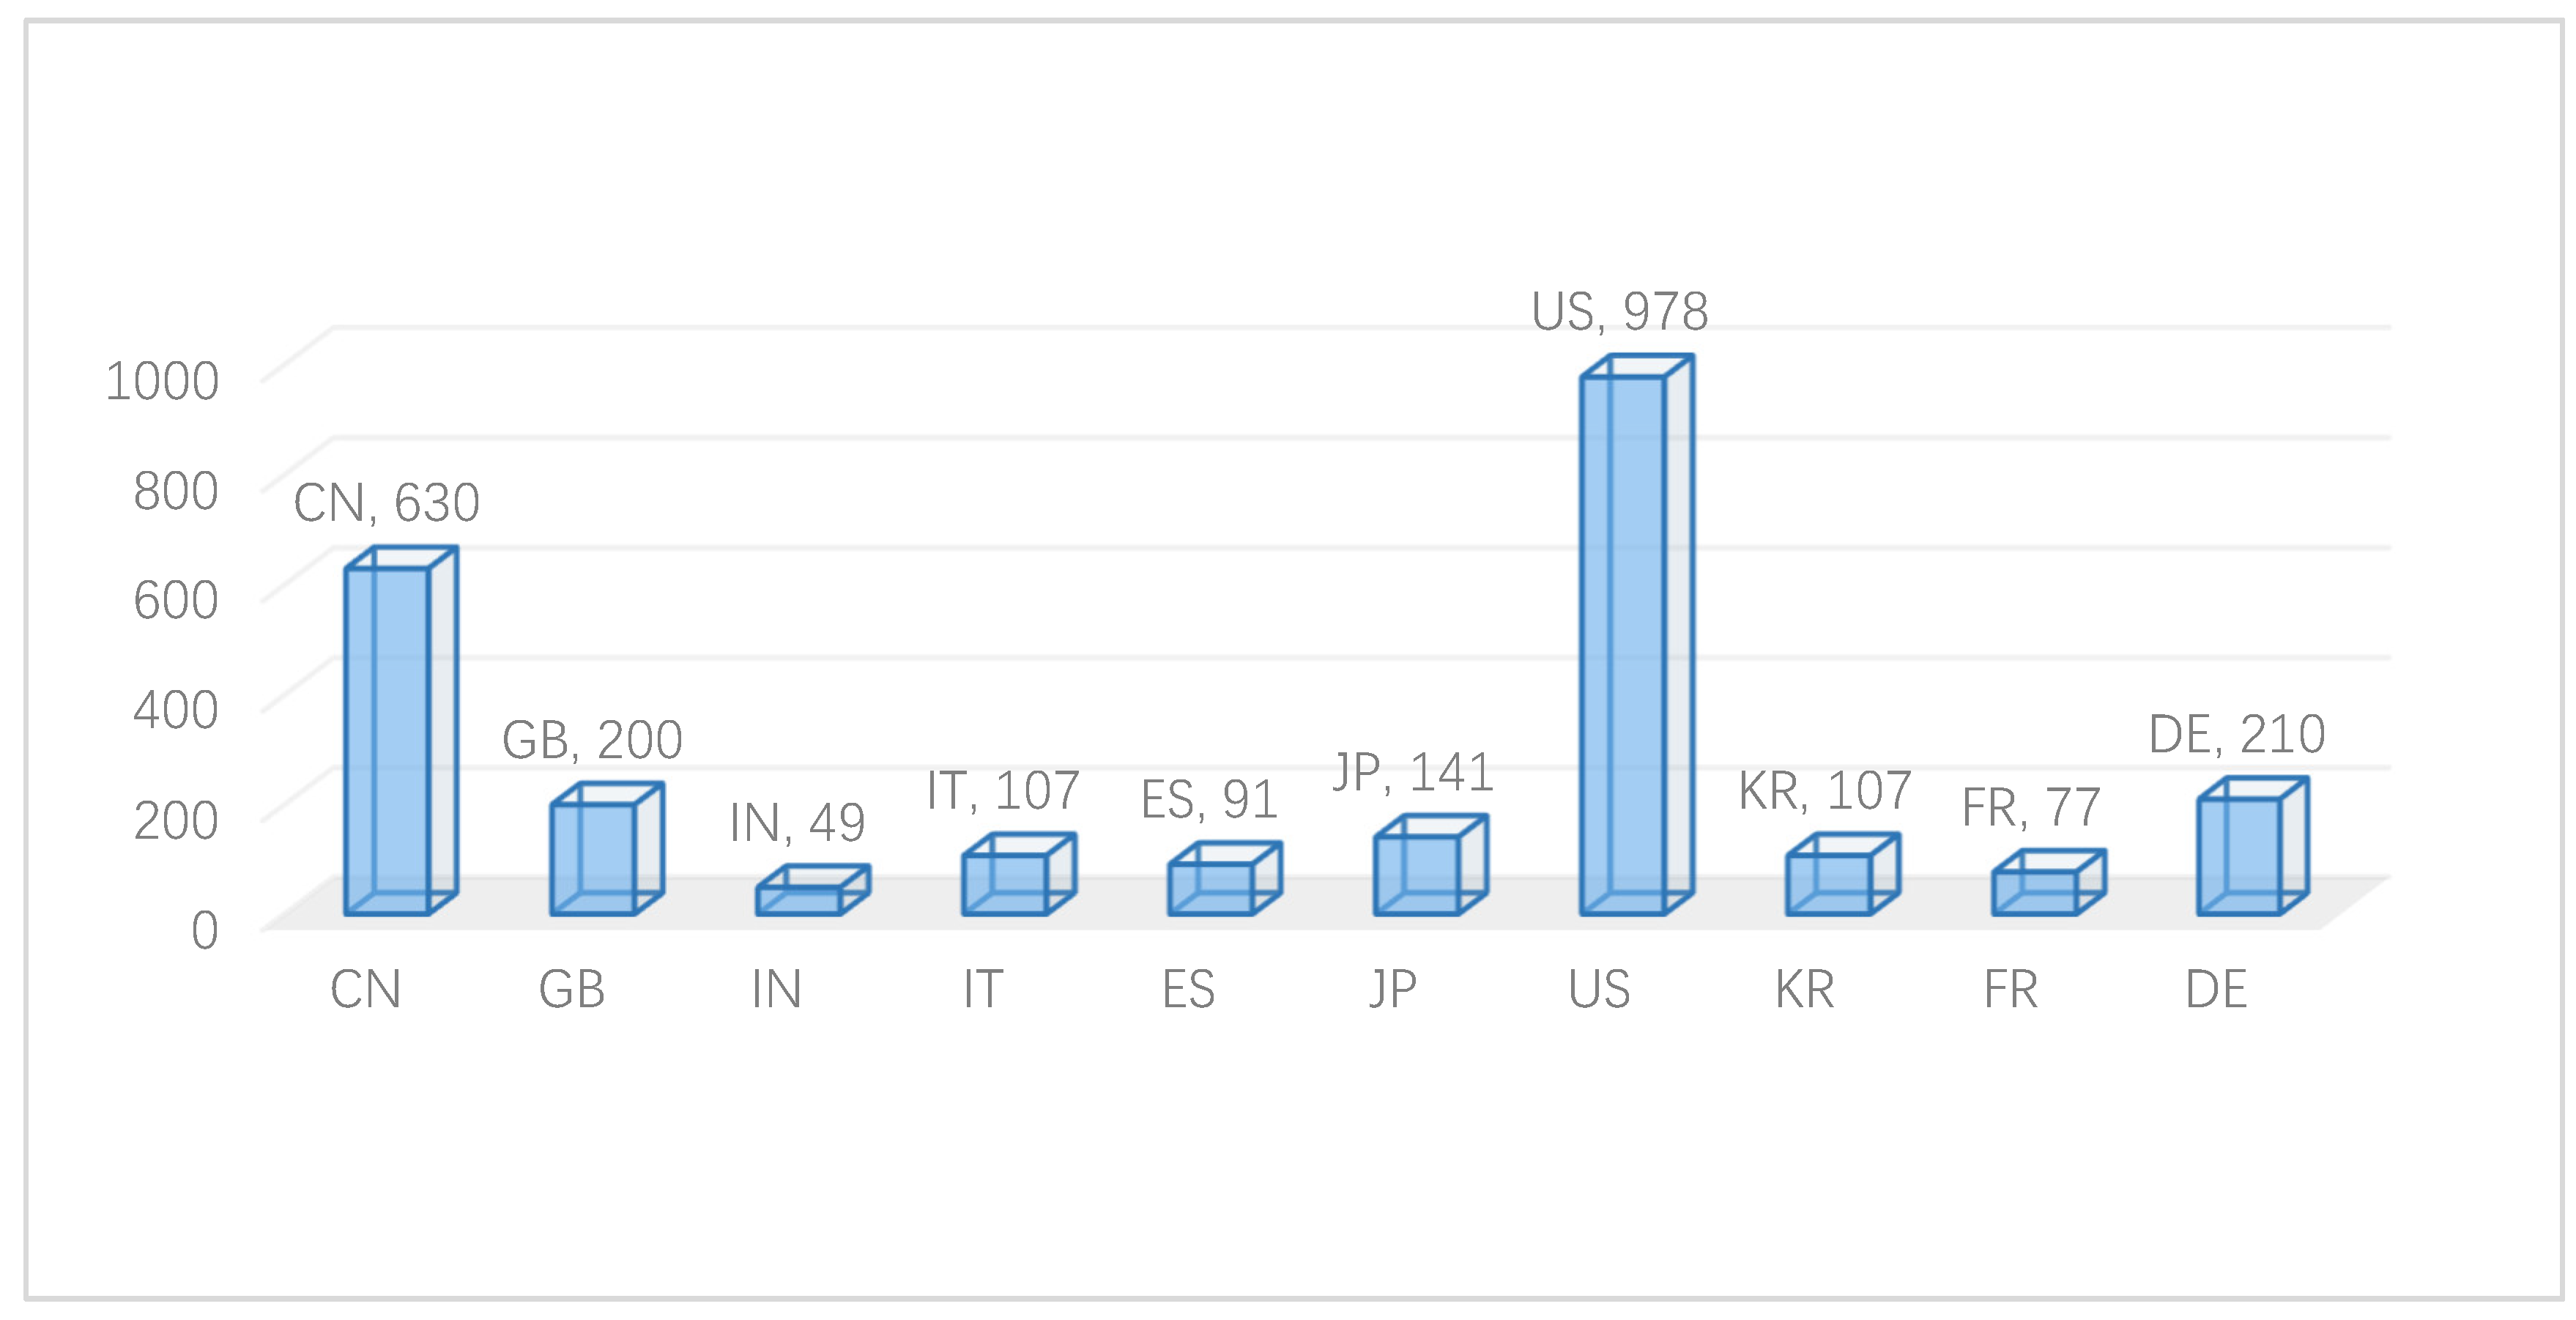
Figure 8 illustrates the number of highly cited papers in the top 10 countries, which include the United States, China, Germany, England, Japan, Italy, Korea, Spain, France, and India. The bar chart shows significant differences among the top 10 countries. The number of highly cited papers of the United States reached 978, followed by China (630) and Germany (210). The total number of highly cited papers across all countries, except the United States and China, is equivalent to the number of the United States; China’s number was approximately 65% of that of the United States.
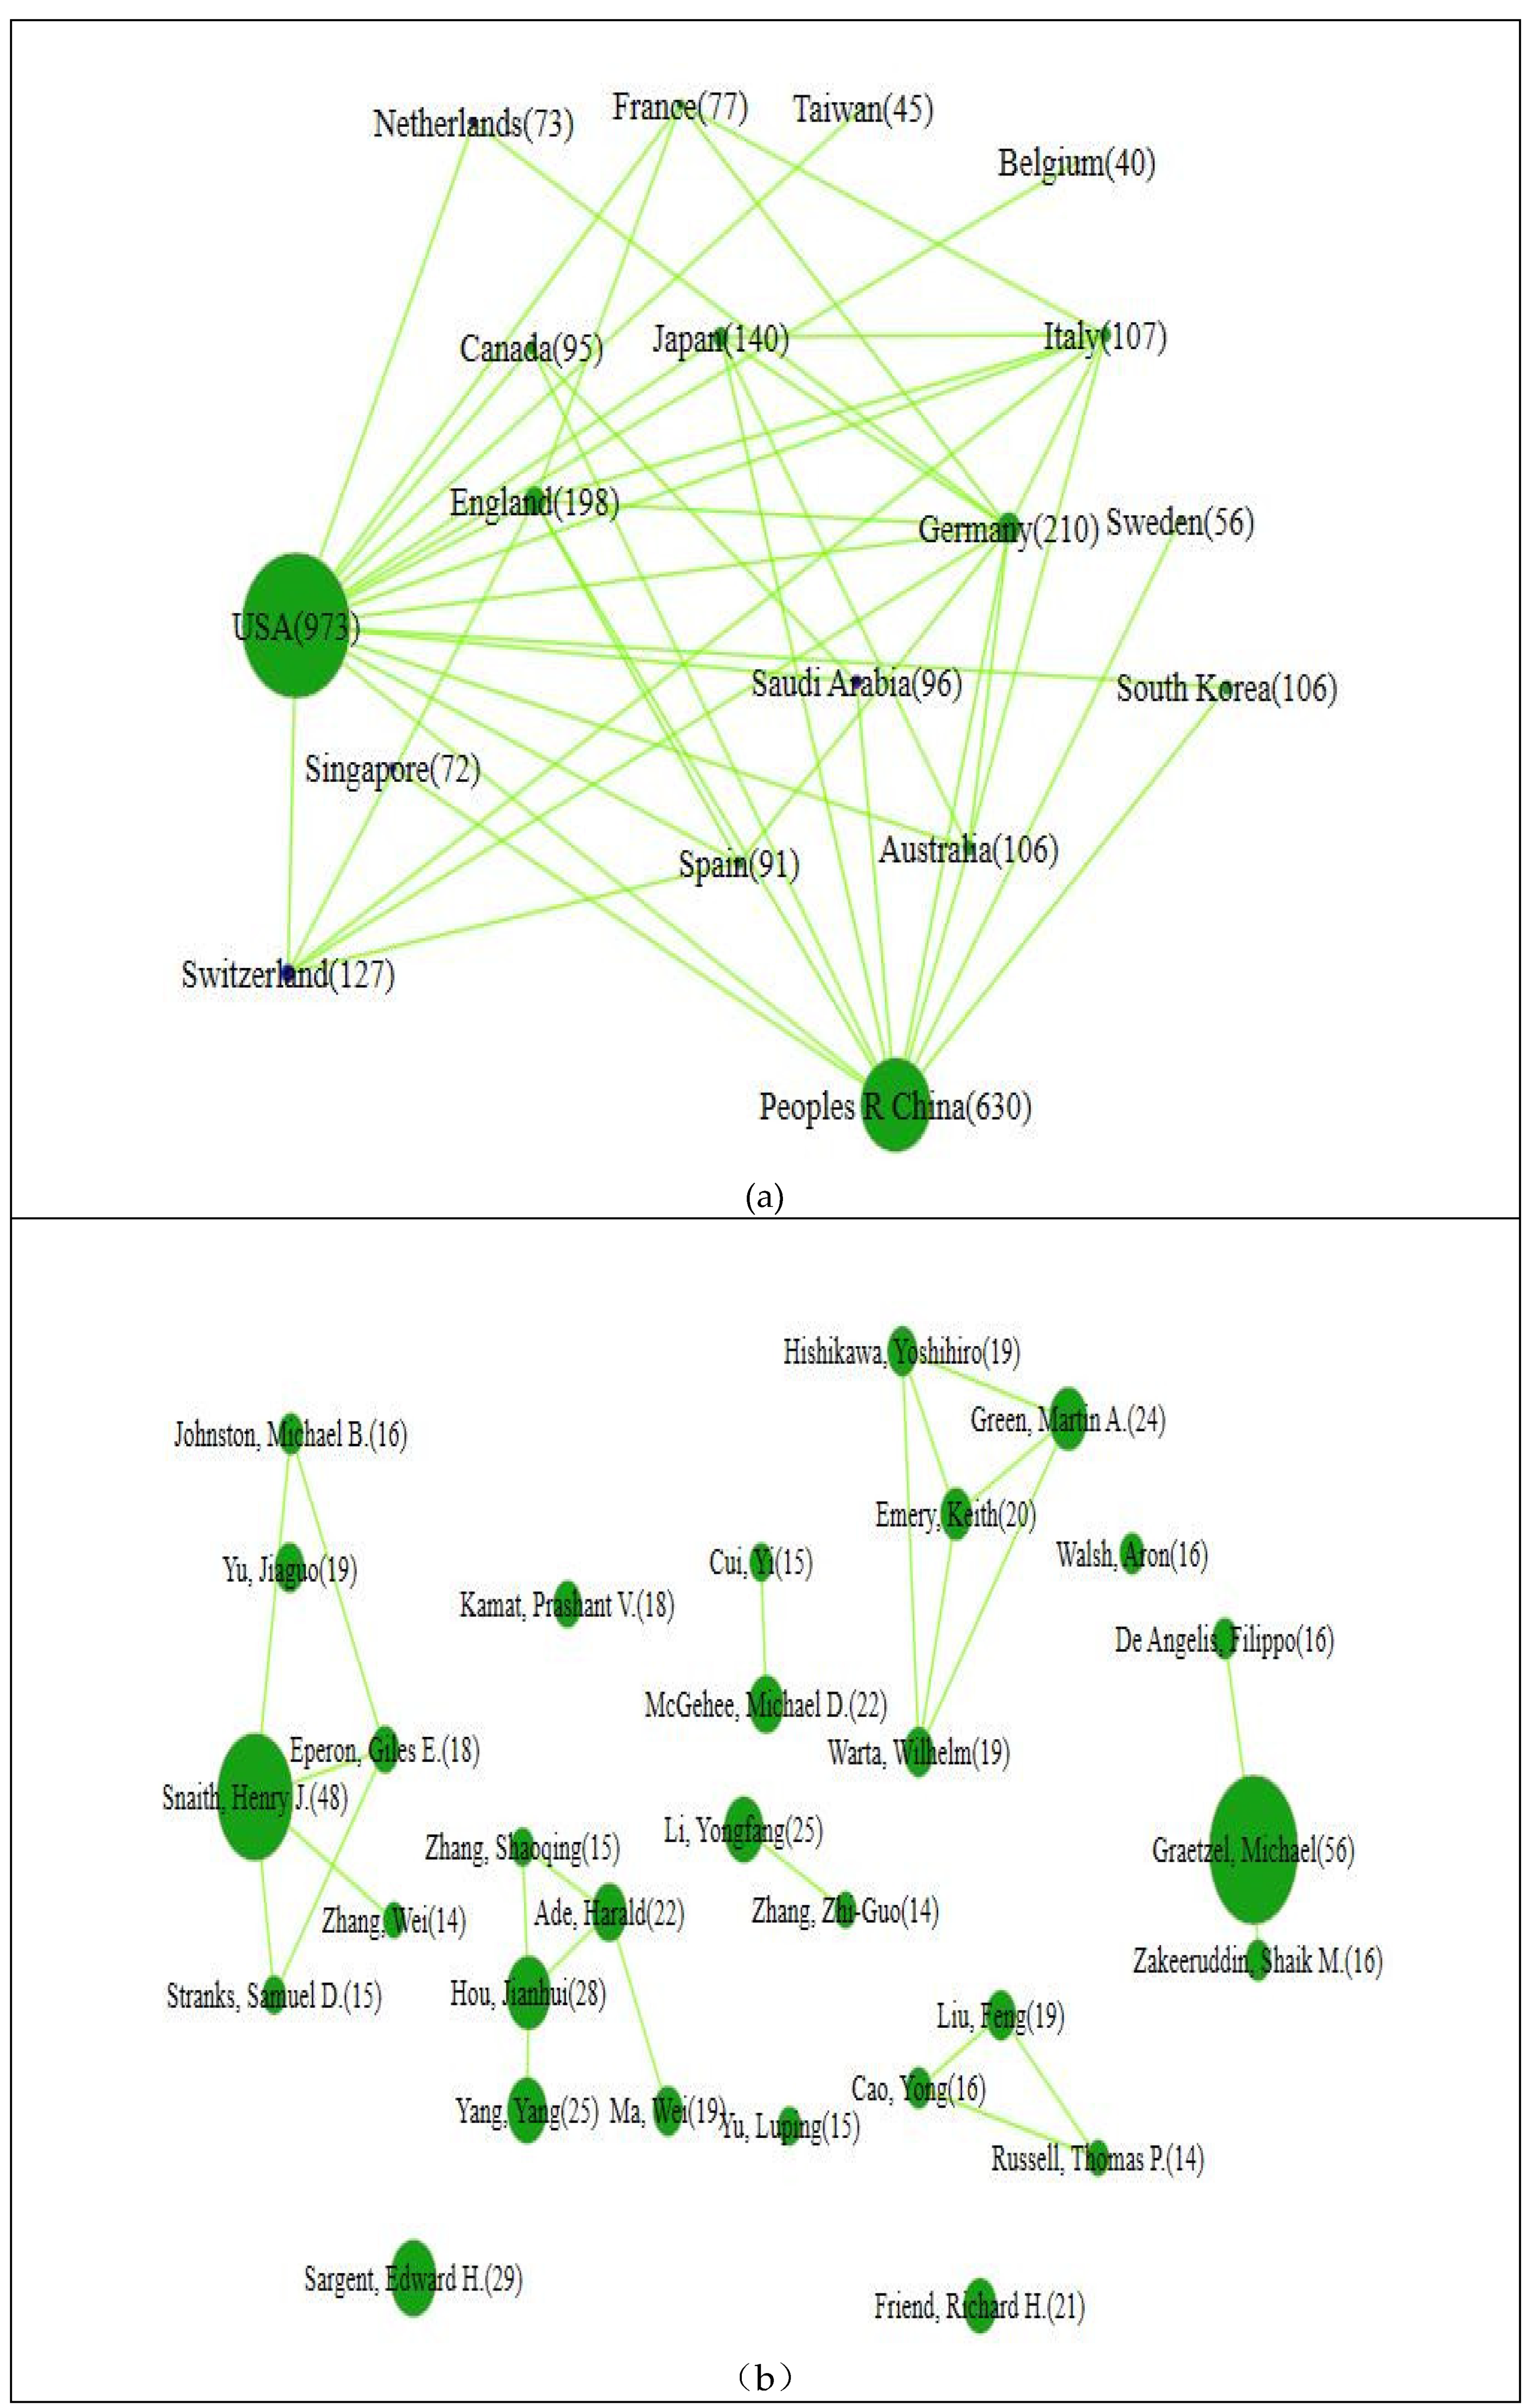
Figure 9 depicts the collaboration network of co-country and co-author for highly cited papers. The line represents the collaboration; the node represents one author; and the size of the node represents the number of papers published in
Figure 9a. In the solar energy field, high-cited papers were produced in the top 30 countries, establishing a cooperative network map with a cooperation threshold of 13. On this basis, it formed a connected collaborative network, with a tight overall connection. From a macro perspective, China has a high degree of development, with close international cooperation.
However, from the micro-point of view in
Figure 9b, the top 30 high-yield researchers of highly cited papers have set up a cooperative network with a cooperation threshold of 3, forming a non-connected joint network. This means that the overall connection is sparse, with a few closely connected groups in the network. The overall degree of cooperation is less than it could be. The co-located network includes three large sub-networks: Graetzel, Michael (Lausanne Federal Institute of Technology, Switzerland); Snaith, Henry J (University of Oxford, England); and Hou, Jianhui (Chinese Academy of Sciences, State Key Laboratory of Polymer Physics and Chemistry, China).
The number of highly cited papers from Graetzel, Snaith, and Hou was 58, 48, and 28, respectively. The number of papers by Hou was half that of Graetzel. The Hou-centered clusters did not collaborate with the high-yield researchers Graetzel and Snaith.
4. Discussion
The temporal characteristics of scientific production indicate that scientific publications consistently increased throughout the period. The development of scientific production in solar energy can be divided into two stages: the incubation stage and burgeoning stage. In the burgeoning stage, the scientific production continued to rise, with an average annual growth rate up to 46%. From the perspective of investment in scientific research resources, this shows the significant effort invested in solar energy. In short, China has led the development of solar energy research worldwide.
In addition, the gap between the growth rate of scientific production and the growth rate in the number of times cited increased up to 57.86% in 2013. The graph also reveals that the gap in the number of times cited per paper between the US and CN expanded over time. The average number of times each paper was cited for the US was 1.67 times the average number of times each paper was cited for China in 2000. This level increased to 3.65 times in 2015. The gap reached a peak, at up to 4.24 times in 2013. These results indicate that even though China surpassed the US in becoming the most productive country in solar energy worldwide, there was no simultaneous improvement in the impact of China. Further, the gap between China and high-impact countries continued to grow.
The impact and effectiveness were below the world average from 2012 to 2015, and there was a sharp decrease in the impact and effectiveness. This was inconsistent with the rapid rise in scientific production. Based on the analysis above, there is room to improve performance, impact, and effectiveness. The impact and effectiveness were inconsistent with the rapid rise in scientific production. Based on the analysis above, there is room to improve performance, impact, and effectiveness. And also, solar energy research has resulted in limited international cooperation within a small scope. The next step is to improve the output of high-quality results and strengthen international cooperation with high-quality outcomes researchers and teams.
5. Conclusions
This paper explored the development of scientific production, the impact of scientific production, and the activity index and attractivity index to investigate the development, impact, and effectiveness of China’s research in solar energy. The study resulted in the following findings and conclusions:
The number of scientific publications in China has increased significantly. China has surpassed the US to become the most productive country with regard to solar energy, and ranked first in the world in 2015. This shows a sharp increase in the number of total researchers and institutions working in solar energy. During the study period, China contributed up 31% researchers in this area worldwide.
- II.
There is an imbalance between quantity and quality in Chinese solar research
Above all, even both the growth rate of scientific production and the growth rate in the citation counts revealed a general decreasing trend, the growth rate of scientific production was consistently larger than the growth rate in the number of times cited between 2006 and 2015. Furthermore, the gap between the growth rate of scientific production and the growth rate in citation counts increased up to 57.86% in 2013.
Besides, when comparing the average times cited per paper among top ten countries in solar energy, there was not a significant difference in China’s ranking, which remained low. China remained in the last place from 2007 to 2015. The gap in the number of times a paper was cited between the US and CN continued to expand. The average number of citations was 1.67 times higher for the US compared to the average number of times a paper was cited for China in 2000. This gap widened to 3.65 times in 2015.
Finally, China experienced a marked upward trend in the activity index and a downward trend in the attractivity index. Scientific production in 2012, 2013, 2014, and 2015 exceeded the world average; in other years, production was below the world average. However, the impact during 2012, 2013, 2014, and 2015 were below the world average. Overall, this indicates a sharp decrease of effectiveness. From 2010 to 2015, the effectiveness of China’s scientific production was below the world average. The total number of highly cited papers across all countries, except the United States and China, is equivalent to the number of United States; China’s number was approximately 65% of that of the United States. Solar energy research has resulted in limited international cooperation within a small scope. The next step is to improve the output of high-quality results and strengthen international cooperation with high-quality outcomes’ researchers and teams.
The four perspectives above suggest that China has achieved a leadership position in scientific development and has invested great effort in solar energy. This is worthy of recognition, as China participates in global solar energy basic research with an open mind that helps to increase productivity. However, the sharp decreasing trend in the impact and effectiveness is inconsistent with the rapid rise in scientific production. Further, the gap between China and high-impact countries continues to grow. This leads us to conclude that China’s solar energy research leads in development, but falls behind in impact and effectiveness. There are opportunities to improve impact and effectiveness: China should focus on improving the quality of research.
The limitation and the boundaries of the research is limited from the perspective of basic research. From the perspective of basic research, this study highlights the need for a systematic evaluation of the scientific production, impact, and efficiency with respect to the growing body of literature related to solar energy in China. This paper offers two improvements to reflect the imbalance in the development of solar research in China. First, future research should consider the order of different country’s authors, or just separately count a country’s number of publications and citations where the first author or corresponding author belongs to the county. This is because of the different order of authors representing different contributions and influence. For example, one article is written and cooperated on by authors “A, B, C*, D” belonging to four different countries “E, F, G, H.” The order of contribution is A, C > B > D and the count of the number may be E = G = 1, and F, H < 1. In addition, with respect to data extraction we could, in terms of a wider analysis, take into account the patents (noticed) and publishers, using patent data to explore the contribution and influence of technology innovation in solar energy for China. Patent data may better reflect the intensity of technological innovation and technological progress from the perspective of applied research.


