Towards a Fair and More Transparent Rule-Based Valuation of Travel Time Savings


Abstract
:1. Introduction
2. Theoretical Background
2.1. Value of Travel Time Savings (VOTTS) from Discrete Choice Model
2.2. Fuzzy Logic and Fuzzy Inference System (FIS)
2.2.1. Fuzzy Sets
2.2.2. Fuzzy Rules
2.2.3. FIS
- A fuzzification unit: this transforms the crisp value into the interval [0 1] using a specified membership function.
- A rule-base: this contains IF-THEN rules used to represent a link between the input and output variables.
- A database: this contains the membership functions of the linguistic variables used in the fuzzy rules.
- Decision unit: this is where an inference is made by using the specified rules to get a fuzzy output.
- Defuzzification unit: In this unit, the fuzzy output from the decision unit is converted to a final crisp output.
3. Methodology
3.1. Proposed Conceptual Model
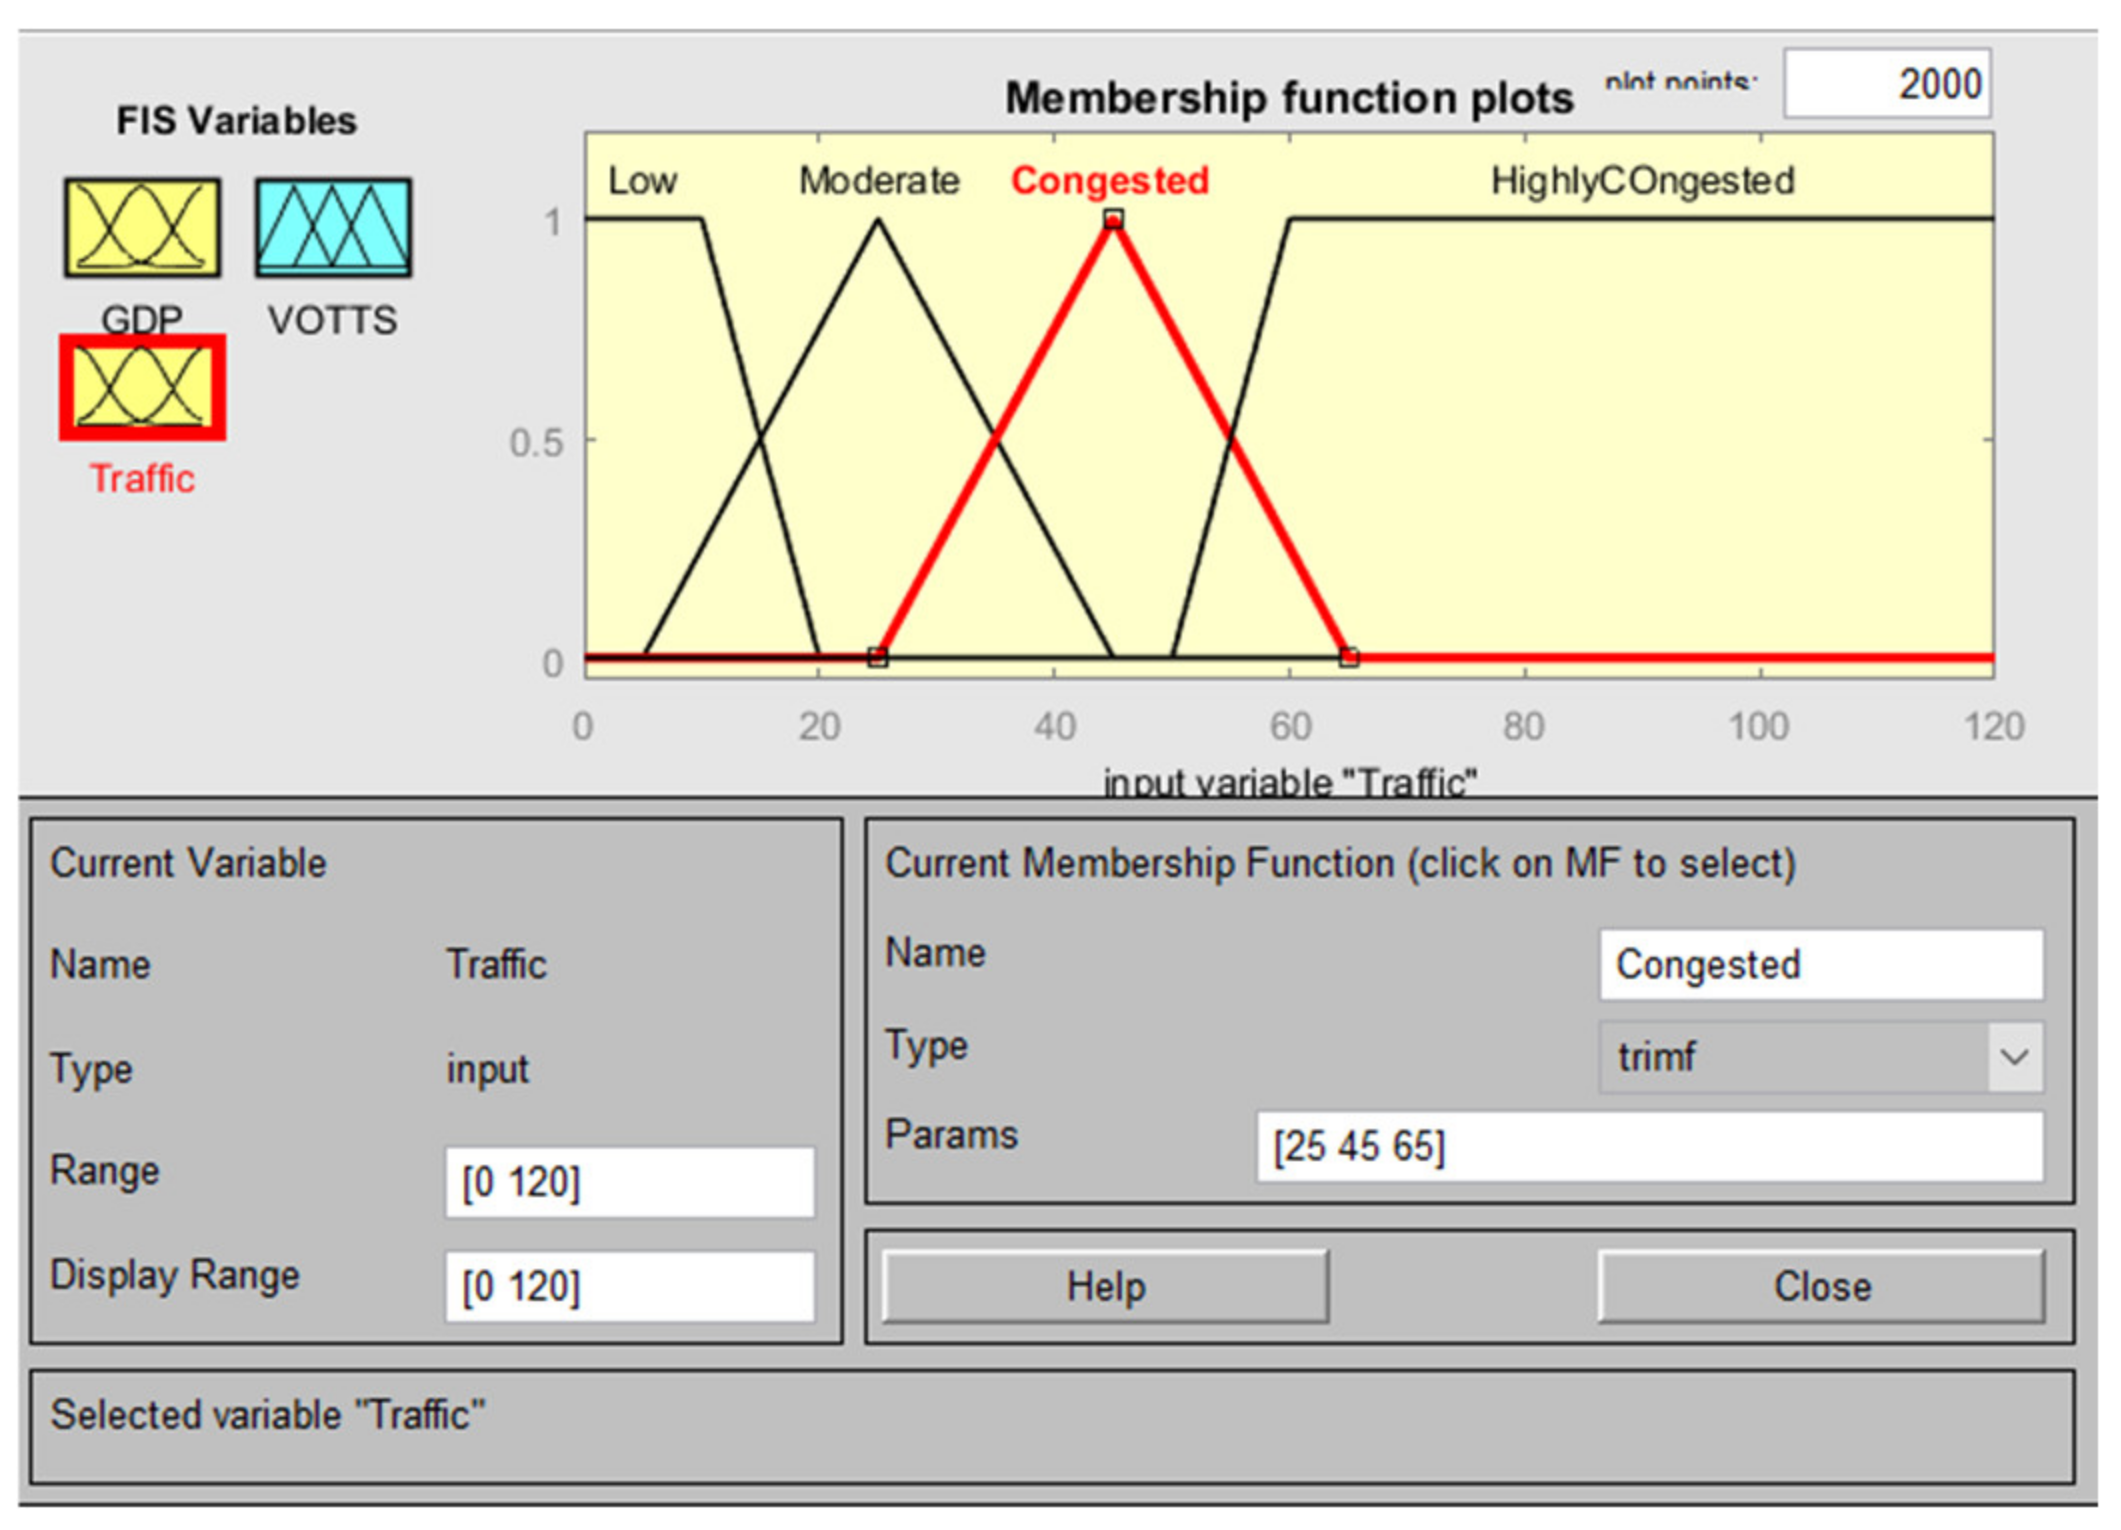
3.1.1. Input Variables
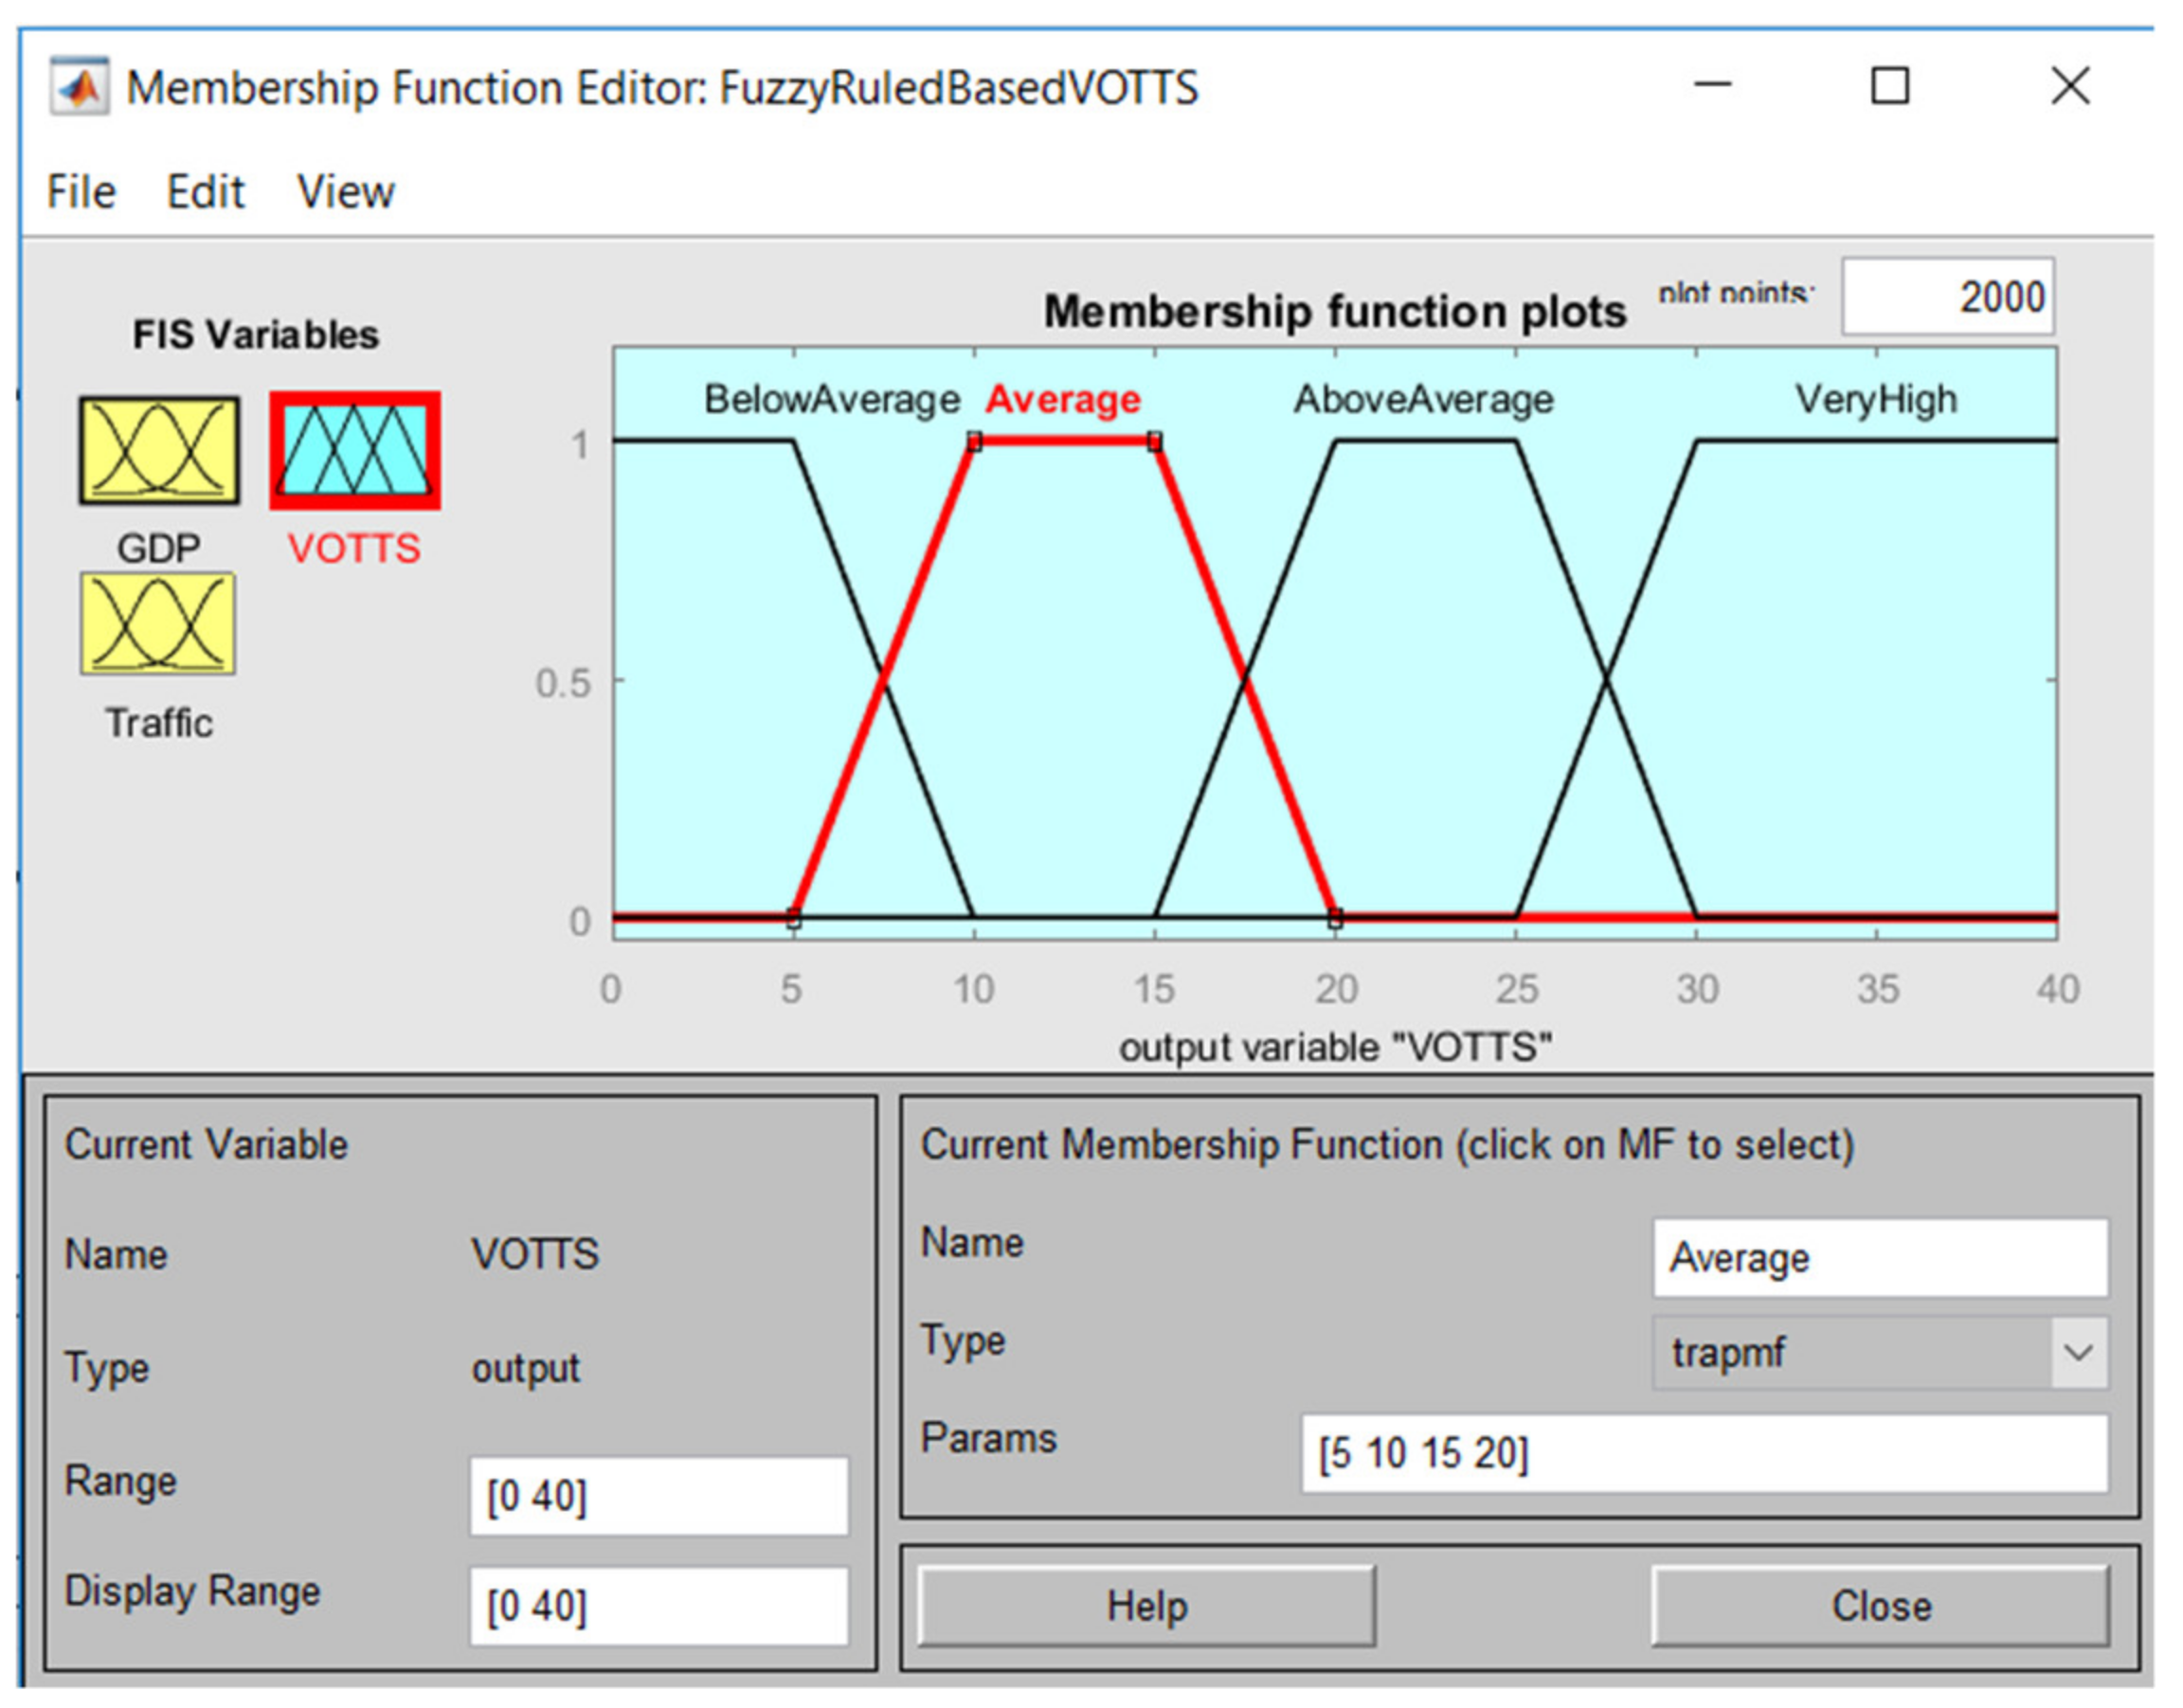
3.1.2. Membership Functions
3.1.3. Rule Base
3.1.4. Output Variable
3.1.5. Feedback Loop
3.2. Numerical Example
Linguistic Variables
3.3. Rules
4. Results and Discussion
4.1. Sensitivity Analysis (Membership Function type)
4.2. Sensitivity Analysis of Fairness Rules
5. Conclusions
Author Contributions
Funding
Conflicts of Interest
Appendix A


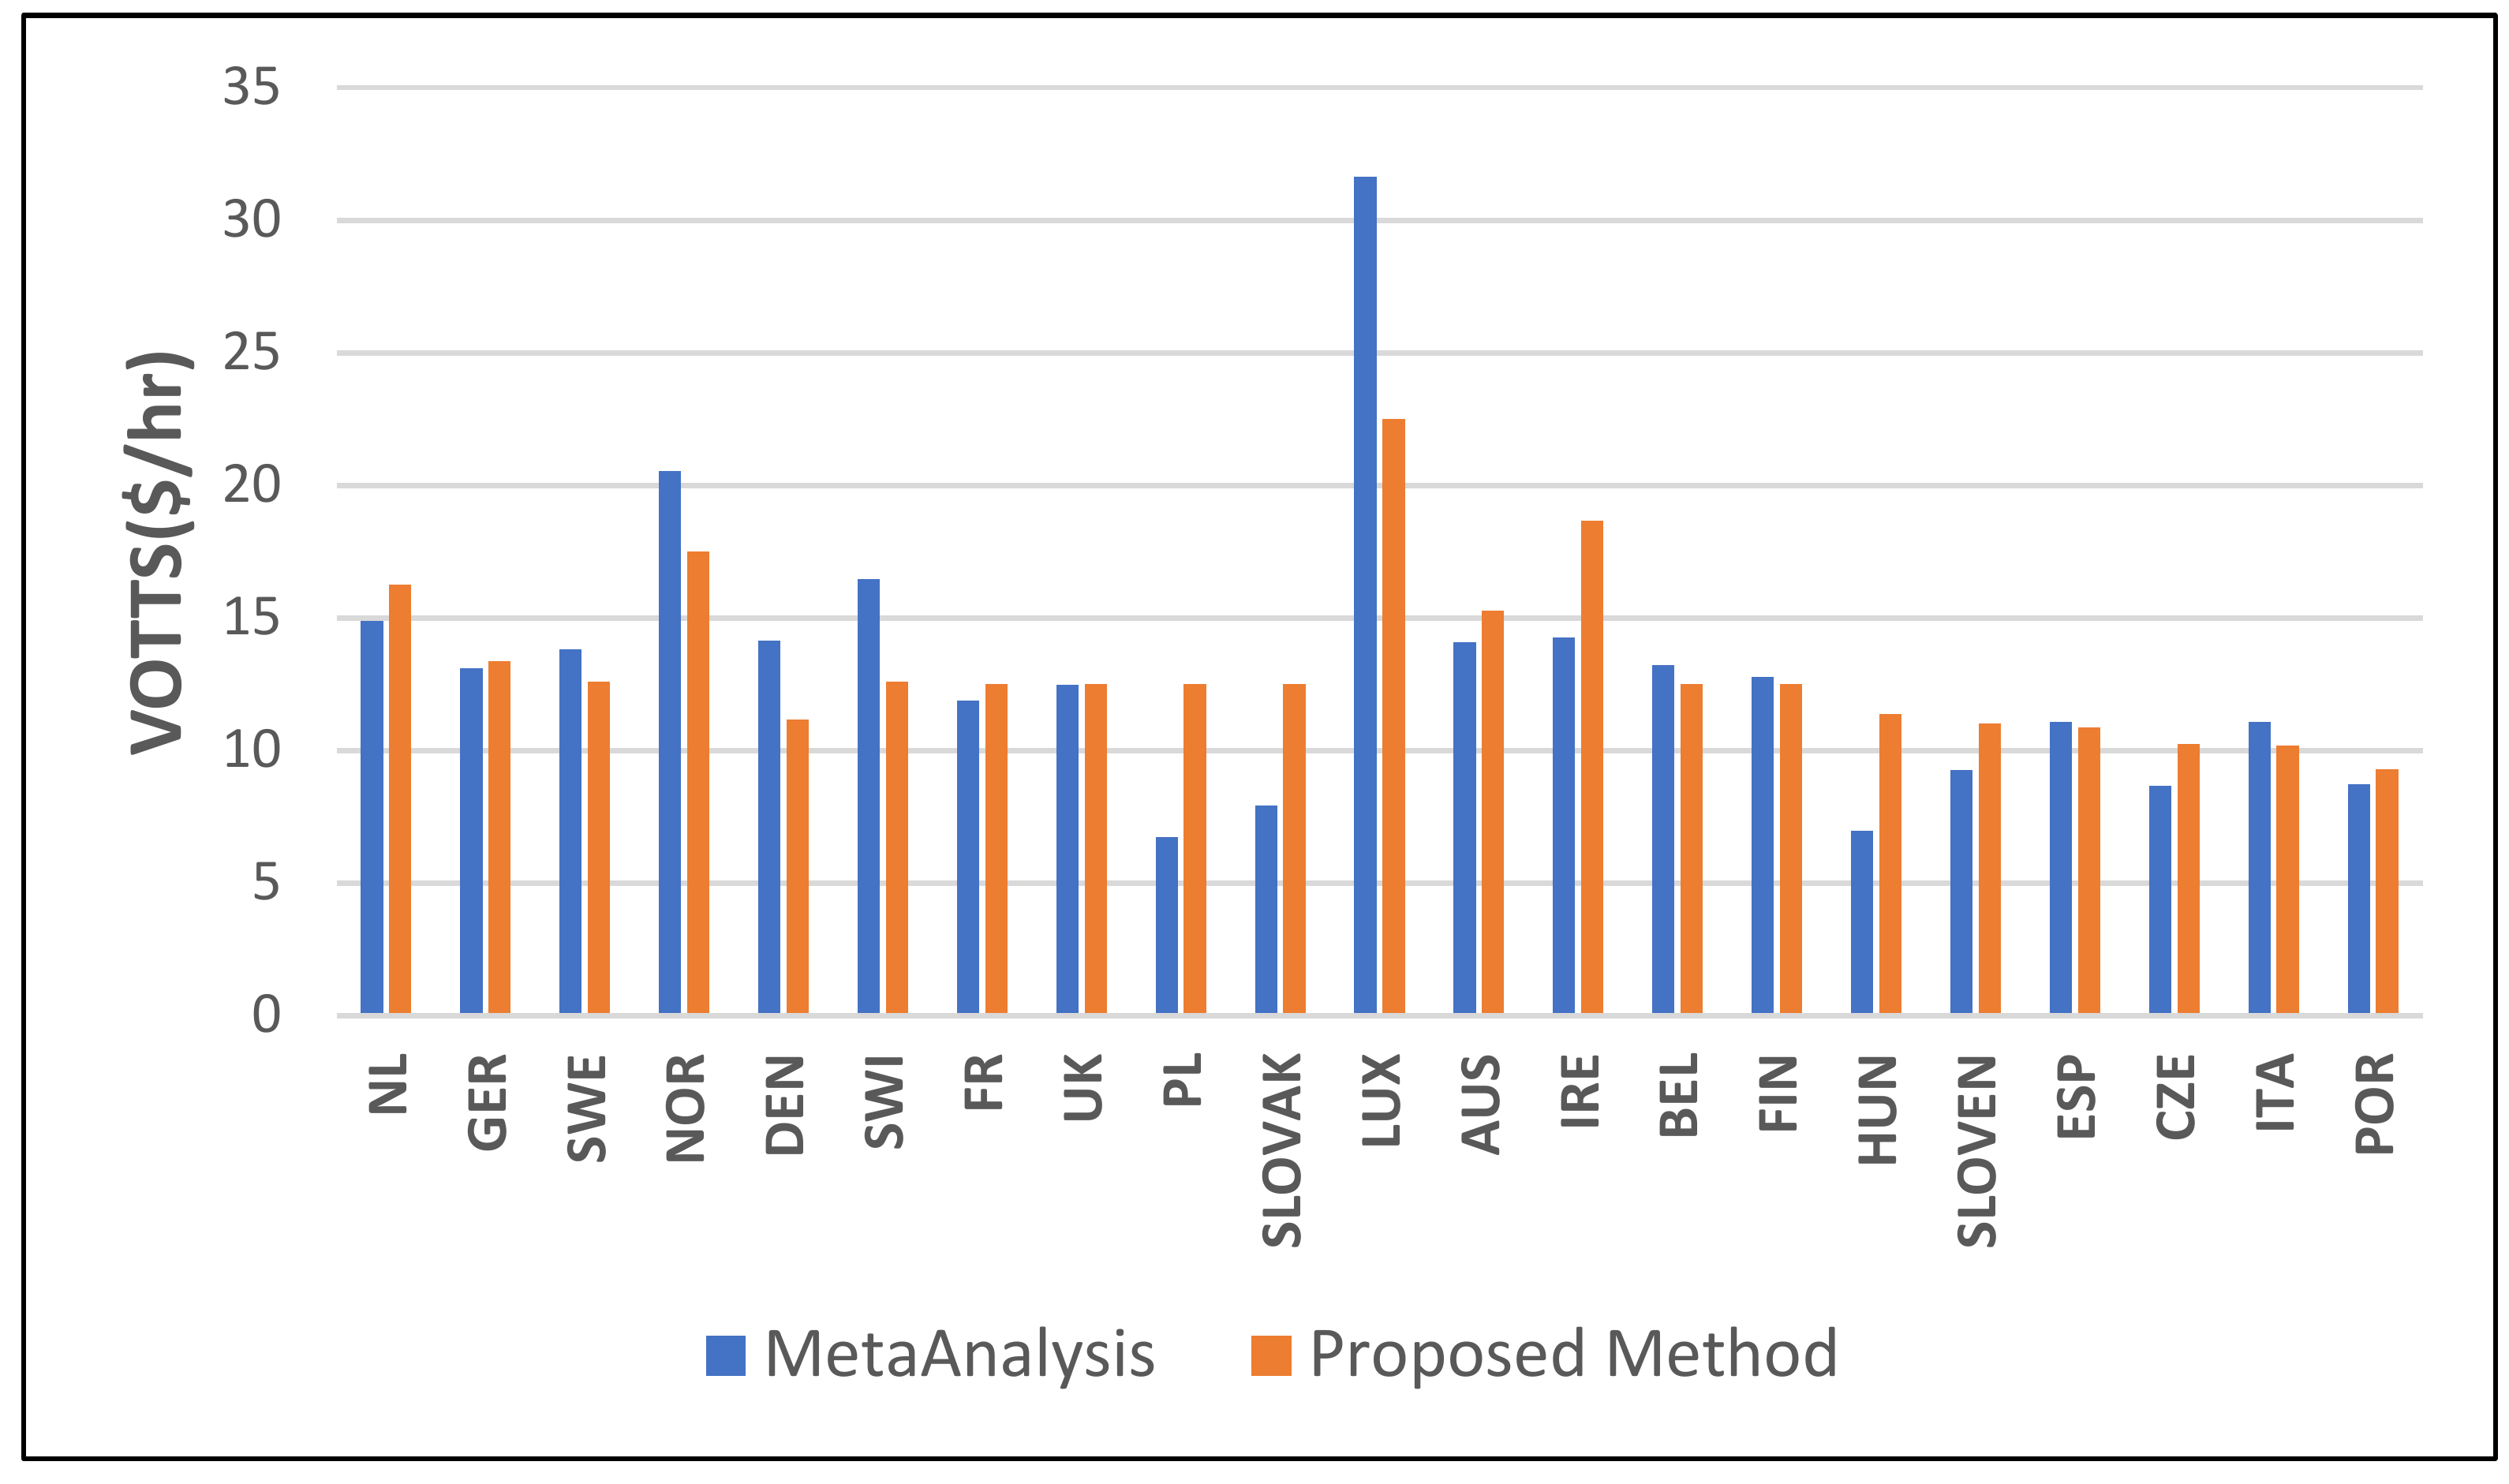
| Country | Estimated ($/h) | Meta-Analysis ($/h) | Difference (×100%) | Abs (×100%) |
|---|---|---|---|---|
| LUX | 22.50 | 31.62 | −0.41 | 0.41 |
| SWI | 12.58 | 16.45 | −0.31 | 0.31 |
| DEN | 11.16 | 14.12 | −0.27 | 0.27 |
| NOR | 17.50 | 20.54 | −0.17 | 0.17 |
| SWE | 12.58 | 13.81 | −0.10 | 0.10 |
| ITA | 10.18 | 11.07 | −0.09 | 0.09 |
| BEL | 12.50 | 13.20 | −0.06 | 0.06 |
| FIN | 12.50 | 12.76 | −0.02 | 0.02 |
| ESP | 10.87 | 11.07 | −0.02 | 0.02 |
| UK | 12.50 | 12.47 | 0.00 | 0.00 |
| GER | 13.35 | 13.10 | 0.02 | 0.02 |
| FR | 12.50 | 11.88 | 0.05 | 0.05 |
| POR | 9.29 | 8.72 | 0.06 | 0.06 |
| AUS | 15.27 | 14.07 | 0.08 | 0.08 |
| NL | 16.24 | 14.87 | 0.08 | 0.08 |
| CZE | 10.23 | 8.65 | 0.15 | 0.15 |
| SLOVEN | 11.02 | 9.26 | 0.16 | 0.16 |
| IRE | 18.66 | 14.25 | 0.24 | 0.24 |
| SLOVAK | 12.50 | 7.93 | 0.37 | 0.37 |
| HUN | 11.37 | 6.96 | 0.39 | 0.39 |
| PL | 12.50 | 6.73 | 0.46 | 0.46 |
| MEAN | 13.23 | 13.03 | 0.03 | 0.17 |
| Country | Estimated ($/h) | Meta-Analysis ($/h) | Official ($/h) |
|---|---|---|---|
| UK | 12.50 | 10.62 | 16.38 |
| Germany | 13.35 | 11.16 | 9.02 |
| Netherlands | 15.63 | 12.66 | 12.11 |
| Sweden | 12.58 | 11.76 | 11.56 |
| Norway | 17.50 | 17.49 | 15.32 |
| Denmark | 11.16 | 12.03 | 15.54 |
| France | 12.50 | 10.12 | 13.09 |
| AVG | 13.60 | 12.26 | 13.29 |
| Country | GDP ($×1000) | Hours Lost in Traffic (h) | Estimated VOTTS ($/h) |
|---|---|---|---|
| Thailand | 17.871 | 56 | 16.24 |
| Indonesia | 12.284 | 51 | 10.21 |
| Colombia | 14.552 | 49 | 10.03 |
| Venezuela | 12.400 | 42 | 9.36 |
| Russia | 25.533 | 41 | 12.50 |
| USA | 59.532 | 41 | 17.43 |
| Brazil | 15.484 | 36 | 9.80 |
| South Africa | 13.498 | 36 | 8.99 |
| Turkey | 27.916 | 32 | 12.50 |
| UK | 43.877 | 31 | 12.50 |
| Puerto Rico | 37.895 | 31 | 12.50 |
| Germany | 50.715 | 30 | 13.35 |
| Poland | 29.291 | 29 | 12.50 |
| Slovakia | 32.111 | 29 | 12.50 |
| Luxembourg | 103.662 | 28 | 22.50 |
| Canada | 46.378 | 27 | 12.50 |
| Switzerland | 65.006 | 27 | 17.50 |
| Norway | 60.978 | 26 | 17.50 |
| Sweden | 50.07 | 26 | 12.58 |
| Austria | 52.558 | 25 | 15.27 |
| U.A.E. | 73.879 | 24 | 17.50 |
| Ecuador | 11.617 | 23 | 5.99 |
| Ireland | 76.305 | 23 | 18.66 |
| Mexico | 18.149 | 23 | 11.46 |
| France | 42.779 | 22 | 12.50 |
| Kuwait | 71.943 | 22 | 17.50 |
| Netherlands | 52.941 | 22 | 15.63 |
| Belgium | 47.561 | 21 | 12.50 |
| Finland | 45.192 | 21 | 12.50 |
| Hungary | 28.375 | 18 | 11.37 |
| Saudi Arabia | 53.845 | 18 | 15.19 |
| Slovenia | 34.802 | 18 | 11.02 |
| Spain | 38.091 | 17 | 10.87 |
| Czech Republic | 36.916 | 16 | 10.23 |
| Denmark | 50.541 | 16 | 11.16 |
| Italy | 39.817 | 15 | 10.18 |
| Portugal | 32.199 | 15 | 9.29 |
| Singapore | 93.905 | 10 | 22.50 |
References
- Mackie, P.J.; Jara-Diaz, S.; Fowkes, A.S. The value of travel time savings in evaluation. Transp. Res. Part E Logist. Transp. Rev. 2001, 37, 91–106. [Google Scholar] [CrossRef]
- Kouwenhoven, M.; de Jong, G.C.; Koster, P.; van den Berg, V.A.C.; Verhoef, E.T.; Bates, J.; Warffemius, P.M.J. New values of time and reliability in passenger transport in The Netherlands. Res. Transp. Econ. 2014, 47, 37–49. [Google Scholar] [CrossRef]
- Börjesson, M.; Eliasson, J. Experiences from the Swedish Value of Time study. Transp. Res. Part A Policy Pract. 2014, 59, 144–158. [Google Scholar] [CrossRef]
- Abrantes, P.A.L.; Wardman, M. Meta-analysis of the UK values of time: An update. Transp. Res. Part A Policy Pract. 2011, 45, 1–17. [Google Scholar] [CrossRef]
- Hess, S.; Daly, A.; Dekker, T.; Cabral, M.O.; Batley, R. A framework for capturing heterogeneity, heteroskedasticity, non-linearity, reference dependence and design artefacts in value of time research. Transp. Res. Part B Methodol. 2017, 96, 126–149. [Google Scholar] [CrossRef]
- Hess, S.; Hensher, D.A.; Daly, A. Not bored yet—Revisiting respondent fatigue in stated choice experiments. Transp. Res. Part A Policy Pract. 2012, 46, 626–644. [Google Scholar] [CrossRef]
- Ramos, G.M.; Daamen, W.; Hoogendoorn, S. A state-of-the-art review: Developments in utility theory, prospect theory and regret theory to investigate travellers’ behaviour in situations involving travel time uncertainty. Transp. Rev. 2014, 34, 46–67. [Google Scholar] [CrossRef]
- Haghani, M.; Sarvi, M. Hypothetical bias and decision-rule effect in modelling discrete directional choices. Transp. Res. Part A Policy Pract. 2018, 116, 361–388. [Google Scholar]
- Bliemer, M.C.; Rose, J.M.; Hensher, D.A. Efficient stated choice experiments for estimating nested logit models. Transp. Res. Part B Methodol. 2009, 43, 19–35. [Google Scholar] [CrossRef]
- Ojeda-Cabral, M.; Hess, S.; Batley, R. Understanding valuation of travel time changes: Are preferences different under different stated choice design settings? Transportation 2018, 45, 1–21. [Google Scholar] [CrossRef]
- De Borger, B.; Fosgerau, M. The trade-off between money and travel time: A test of the theory of reference dependent preferences. J. Urban Econ. 2008, 64, 101–115. [Google Scholar] [CrossRef]
- Fowkes, T.; Wardman, M. The design of stated preference travel choice experiments. J. Transp. Econ. Policy 1988, 22, 27–44. [Google Scholar]
- Fosgerau, M. Using non-parametrics to specify a model to measure the value of travel time. Transp. Res. Part A Policy Pract. 2007, 41, 842–856. [Google Scholar] [CrossRef]
- Fosgerau, M. Investigating the distribution of the value of travel time savings. Transp. Res. Part B Methodol. 2006, 40, 688–707. [Google Scholar] [CrossRef]
- Shires, J.D.; de Jong, G.C. An international meta analysis of values of travel time savings. Eval. Prog. Plan. 2009, 32, 315–325. [Google Scholar] [CrossRef] [PubMed]
- Wardman, M.; Chintakayala, V.P.K.; de Jong, G. Values of travel time in Europe: Review and meta-analysis. Transp. Res. Part A Policy Pract. 2016, 94, 93–111. [Google Scholar] [CrossRef]
- Zadeh, L. Outline of a new approach to the analysis of complex systems and decision processes. IEEE Trans. Syst. Man Cybern. 1973, 3, 28–44. [Google Scholar] [CrossRef]
- Teodorovic, D. Fuzzy logic systems for transportation engineering: The state of the art. Transp. Res. Part A Policy Pract. 1999, 33, 337–364. [Google Scholar] [CrossRef]
- Vythoulkas, P.; Koutsopoulos, H. Modeling discrete choice behavior using concepts from fuzzy set theory, approximate reasoning and neural networks. Transp. Res. Part C Emerg. Technol. 2003, 11, 51–73. [Google Scholar] [CrossRef]
- Kedia, S.; Bhuneshwar, K.; Katti, B. Fuzzy logic approach in mode choice modelling for education trips: A case study of Indian metropolitan city. Transport 2015, 30, 286–293. [Google Scholar] [CrossRef]
- Olaru, D.; Smith, B. Modelling Daily Activity Scheduleswith Fuzzy Logic. In Proceedings of the 10th International Conference on Travel Behaviour Research, Lucerne, Switzerland, 10–15 August 2003. [Google Scholar]
- Ming LU, IVT, BAUG, ETHZ, Exploring discrete choice model with fuzzy control theory. In Proceedings of the Conference STRC, Monte Verità, Ascona, Switzerland, 2–4 May 2012.
- Train, K. Discrete Choice Methods with Simulation; Cambridge University Press: Cambridge, UK, 2003. [Google Scholar]
- Mendel, J. Fuzzy logic systems for engineering, A tutorial. Proc. IEEE 1995, 83, 345–377. [Google Scholar] [CrossRef]
- Zimmermann, H. Fuzzy Set Theory and Its Applications; Kluwer-Nijhoff: Boston, MA, USA, 1991. [Google Scholar]
- Klir, G.J.; Yuan, B. Fuzzy Sets and Fuzzy Logic: Theory and Applications; Prentice Hall: Upper Saddle River, NJ, USA, 1995. [Google Scholar]
- Dubois, D.; Prade, H. What are fuzzy rules and how to use them. Fuzzy Sets Syst. 1996, 84, 169–185. [Google Scholar] [CrossRef]
- Fosgerau, M.; Hjorth, K.; Lyk-Jensen, S.V. Between-mode-differences in the value of travel time: Self-selection or strategic behaviour? Transp. Res. Part D Transp. Environ. 2010, 15, 370–381. [Google Scholar] [CrossRef]
- Axhausen, K.W.; Hess, S.; König, A.; Abay, G.; Bates, J.J.; Bierlaire, M. Income and distance elasticities of values of travel time savings: New Swiss results. Transp. Policy 2008, 15, 173–185. [Google Scholar] [CrossRef]
- Börjesson, M. Inter-temporal variation in the marginal utility of travel time and travel cost. Transportation 2014, 41, 377–396. [Google Scholar] [CrossRef]
- Börjesson, M.; Cherchi, E.; Bierlaire, M. Within-individual variation in preferences. Transp. Res. Rec. J. Transp. Res. Board 2013, 2382, 92–101. [Google Scholar] [CrossRef]
- Börjesson, M.; Eliasson, J. Should values of time be differentiated? Transp. Rev. 2018. [Google Scholar] [CrossRef]
- OECD. International Transport Forum: Valuing Convenience in Public Transport; Roundtable Report 156; OECD: Paris, France, 2015. [Google Scholar]
- Wardman, M.; Nicolás, J. The congestion multiplier: Variations in motorists’ valuations of travel time with traffic conditions. Transp. Res. Part A Policy Pract. 2012, 46, 213–225. [Google Scholar] [CrossRef]
- Homaifar, A.; McCormick, E. Simultaneous design of membership functions and rule sets for fuzzy controllers using genetic algorithms. IEEE Trans. Fuzzy Syst. 1995, 3, 129–139. [Google Scholar] [CrossRef]
- Gourdazi, P.; Hassanzadeh, R. A GA-Based Fuzzy Rate Allocation Algorithm. In Proceedings of the IEEE International Conference on Communications, Instabul, Turkey, 11–15 June 2006. [Google Scholar]
- Permana, K.; Hashim, S. Fuzzy Mem-bership Function Generation using Particle Swarm Optimization. Int. J. Open Probl. Compt. Math. 2010, 3, 27–41. [Google Scholar]
- Omizegba, E.; Adebayo, G. Optimizing fuzzy membership functions using particle swarm algorithm. In Proceedings of the IEEE International Conference on Systems, Man and Cybernetics, San Antonio, TX, USA, 11–14 October 2009; pp. 3866–3870. [Google Scholar]
- Worldbank GDP PPP Report. Available online: https://data.worldbank.org/indicator/NY.GDP.PCAP.PP.CD?view=chart%2C&year_high_desc=true (accessed on 14 January 2019).
- INRIX Traffic Report. Available online: http://inrix.com/scorecard/ (accessed on 14 January 2019).
- Medasani, S.; Kim, J.; Krishnapuram, R. An overview of membership function generation techniques for pattern recognition. Int. J. Approx. Reason. 1998, 19, 391–417. [Google Scholar] [CrossRef]
- Wijayasekara, D.; Manic, M. Data Driven Fuzzy Membership Function Generation for Increased Understandability. In Proceedings of the IEEE International Conference on Fuzzy Systems (FUZZ-IEEE), Beijing, China, 6–11 July 2014. [Google Scholar]
- Barua, A.; Mudunuri, L.S.; Kosheleva, O. Why Trapezoidal and Triangular Membership Functions Work So Well: Towards a Theoretical Explanation, Departmental Technical Reports (CS), Paper 783. 2013. Available online: http://digitalcommons.utep.edu/cs_techrep/783 (accessed on 4 February 2019).
- Inflation Website. Available online: http://www.in2013dollars.com/2010-euro-in-2017?amount=100 (accessed on 14 January 2019).
- Euro to Dollar Exchange. Available online: https://www.statista.com/statistics/412794/euro-to-u-s-dollar-annual-average-exchange-rate/ (accessed on 14 January 2019).
- Pedrycz, W. Why Triangular Membership Functions? Fuzzy Sets Syst. 1994, 64, 21–30. [Google Scholar] [CrossRef]


| Linguistic Variables | |||||
|---|---|---|---|---|---|
| Gross domestic product (GDP) ($k) | Low [0 20] | Lower Middle [10 40] | Middle [30 60] | Upper Middle [50 80] | High [60 130] |
| Traffic (h) | Low [0 20] | Moderate [10 40] | Congested [30 60] | Highly Congested [50 120] | |
| Value of travel time savings (VOTTS) ($/h) | Below Average [0 10] | Average [5 20] | Above average [15 30] | Very High [25 40] | |
| No | Rule |
|---|---|
| 3 | IF GDP is Low AND Traffic is Congested THEN VOTTS is Average |
| 10 | IF Traffic is Highly Congested then VOTTS is Above Average |
| 11 | IF GDP is Lower Middle AND Traffic is Low THEN VOTTS is Below Average |
| 17 | IF GDP is Middle AND Traffic is Congested THEN VOTTS is Average |
| 18 | IF GDP is Middle AND Traffic is Highly Congested THEN VOTTS is Above Average |
| 20 | IF GDP is Upper Middle AND Traffic is Moderate THEN VOTTS is Average |
| 26 | IF GDP is High AND Traffic is Highly Congested THEN VOTTS is Very High |
© 2019 by the authors. Licensee MDPI, Basel, Switzerland. This article is an open access article distributed under the terms and conditions of the Creative Commons Attribution (CC BY) license (http://creativecommons.org/licenses/by/4.0/).
Share and Cite
Adjenughwure, K.; Papadopoulos, B. Towards a Fair and More Transparent Rule-Based Valuation of Travel Time Savings. Sustainability 2019, 11, 962. https://doi.org/10.3390/su11040962
Adjenughwure K, Papadopoulos B. Towards a Fair and More Transparent Rule-Based Valuation of Travel Time Savings. Sustainability. 2019; 11(4):962. https://doi.org/10.3390/su11040962
Chicago/Turabian StyleAdjenughwure, Kingsley, and Basil Papadopoulos. 2019. "Towards a Fair and More Transparent Rule-Based Valuation of Travel Time Savings" Sustainability 11, no. 4: 962. https://doi.org/10.3390/su11040962
APA StyleAdjenughwure, K., & Papadopoulos, B. (2019). Towards a Fair and More Transparent Rule-Based Valuation of Travel Time Savings. Sustainability, 11(4), 962. https://doi.org/10.3390/su11040962