Abstract
The paper examined the willingness of smallholder cassava processors to pay for value-added solid wastes management solutions in Nigeria. We employed a multistage sampling procedure to obtain primary data from 403 cassava processors from the forest and Guinea savannah zones of Nigeria. Contingent valuation and logistic regression were used to determine the willingness of the processors to pay for improved waste management options and the factors influencing their decision on the type of waste management system adopted and willingness to pay for a value-added solid-waste management system option. Women constituted the largest population of smallholder cassava processors, and the processors generated a lot of solid waste (605–878 kg/processor/season). Waste was usually dumped (59.6%), given to others (58.1%), or sold in wet (27.8%) or dry (35.5%) forms. The factors influencing the processors’ decision on the type of waste management system to adopt included sex of processors, membership of an association, quantity of cassava processed and ownership structure. Whereas the processors were willing to pay for new training on improved waste management technologies, they were not willing to pay more than US$3. However, US$3 may be paid for training in mushroom production. It is expected that public expenditure on training to empower processors to use solid-waste conversion technologies for generating value-added products will lead to such social benefits as lower exposure to environmental toxins from the air, rivers and underground water, among others, and additional income for the smallholder processors. The output of the study can serve as the basis for developing usable and affordable solid-waste management systems for community cassava processing units in African countries involved in cassava production.
1. Introduction
Annual cassava production in Africa is about 84 million tonnes, of which Nigeria produces over 30 million tonnes, as the world’s largest cassava producer [1,2,3]. However, cassava processing is considered to contribute significantly to environmental pollution globally by depleting water resource quality through natural toxic cyanogen and the production of unpleasant odour [4]. Over 55.0% of the waste produced from cassava processing is disposed of in dumping sites, creating both environmental pollution and negative health impacts on the population in the neighbourhood of cassava processing facilities [5].
In Nigeria, cassava is mostly produced and processed by small-scale farmers at the family or village level [6]. Cassava farming provides livelihood opportunities for both men and women involved in its production and consumption cycle. Both males and females make significant labour contributions to the cassava industry, with each sex specialising in different tasks. Women are, however, the backbone of the agricultural sector, in that they account for 60% to 80% of farm labour [7].
Within the cassava industry, processing is a major contributor to environmental pollution [4]. This is so due to the massive waste generated during the processing stages. The available technology of processing cassava roots primarily involves peeling, washing, grating, fermenting, dewatering, frying, drying, and milling. Waste is often produced at each of these processing stages. The type and composition of the waste depend on the processing method and type of technology used [8].
Solid waste is unwanted solid material generated from residential, industrial or commercial activities in a given area [9]. It may be categorised according to its origin (domestic, industrial, commercial, construction, or institutional), its content (organic or inorganic), or its hazard potential (toxic, non-toxic, flammable, radioactive, infectious) [10]. Cassava waste is organic and exists in both solid and liquid forms. Peel is the first type of solid waste generated by cassava root-processing activities. Subsequently, when the peeled cassava roots are grated and dewatered, wastewater is obtained. After dewatering, the resultant semi-solid mass is sieved, and the ungrated fibre (chaff) is discarded as the final solid waste [11]. Cassava peel is the primary solid cassava waste that constitutes 20 to 25.0% of the weight of the roots [12,13]. The proportion of waste can be higher, especially during hand peeling [14].
Disposal of waste products resulting from cassava processing is often inadequate. This led to varying environmental and health hazards, causes a foul smell and an unattractive sight, and produces widespread environmental pollution at cassava processing sites [15]. Cassava waste from processing centres has contributed significantly to environmental contamination. About 75.0% of the cassava roots harvested in Africa are fermented, causing the release of cyanogenic compounds and other pollutants into farmlands, rivers, streams, and groundwater [16]. In Nigeria, cassava effluent is directed to streams, resulting in a reduction in water quality and loss of aquatic life owing to its toxic nature [16], while stagnant streams of effluent produce a strong offensive odour [17]. Dumpsites for solid waste and liquid effluent also breed insects and other organisms that lead to disease outbreak [18].
More than 60.0% of the rural population in Nigeria is engaged in cassava-based cottage industries, and millions of tonnes of cassava waste are produced [19]. Waste management has been a major challenge to processors, as wastes need to be managed and, if possible, re-utilized without causing any harm to the environment. Over 55.0% of the waste produced from cassava processing is dumped at tips near the processing sites, becomes landfill, and/or is burnt, thereby, posing a serious threat to the environment and constituting a health hazard to the processors [5]. Few cassava processors derive any financial benefit from cassava waste [5], while most of them lack either awareness or expertise regarding the conversion of waste to any form of useful resource. However, studies [13,20] have shown that agricultural waste can be profitably utilized and recycled without attendant externalities.
Against this background, we conducted a study to examine the waste management approaches used by smallholder cassava processors, their willingness to pay for value-added solid-waste management solutions, and the factors that may influence their behaviour.
The next section gives details of the theoretical framework of willingness to pay, including estimation methods. This is followed by a section on materials and methods, the study results and discussion, and finally conclusion.
2. Theoretical Framework
An essential component of every business transaction is willingness-to-pay (WTP) computation, in which buyers assess the maximum amount of financial resources they are willing to expend in exchange for the item being sold [21]. Willingness to pay is the maximum amount of money that a consumer would pay to enjoy an improvement in product quality [22]. Rodríguez et al. [23], defined it as “the difference between consumers’ surplus before and after adding or improving a given product attribute” in monetary terms. In WTP surveys, a respondent is asked a series of structured questions that are designed to determine the maximum amount of money he or she is willing to pay for a product or service. Various tools are employed in measuring WTP. The three most common are the hedonic pricing method, the contingent valuation method (CVM), and the travel cost method [24,25].
Notwithstanding the debate regarding its underlying economic theory, the contingent valuation method (CVM) is considered superior and preferred to other methods because it deals with both use and non-use values [26]. It is a simple, flexible and non-market valuation method popular for cost-benefit analysis and environmental impact assessment [27,28]. The CVM involves asking sampled respondents directly whether they would be willing to pay or accept compensation for the change in preferences. The method has been adjudged to conform to the theoretical core of economics [28]. In general, we assume that person ‘i’ is willing to pay Y*i for training on improved cassava waste management, and that this payment is related to a set of the person’s characteristics (Xi), so that:
Although Y*i is unobserved, it is assumed to lie within the bound of such person’s willingness to pay, which is (Yi1, Yi2). This interval is based on responses to a series of questions asked in the contingent valuation interview [29]. The likelihood of the person paying is, therefore, stated as:
This equation is the basis for the use of discrete choice models for estimating the contingency valuation method.
3. Materials and Methods
3.1. Study Area and Sampling Procedure
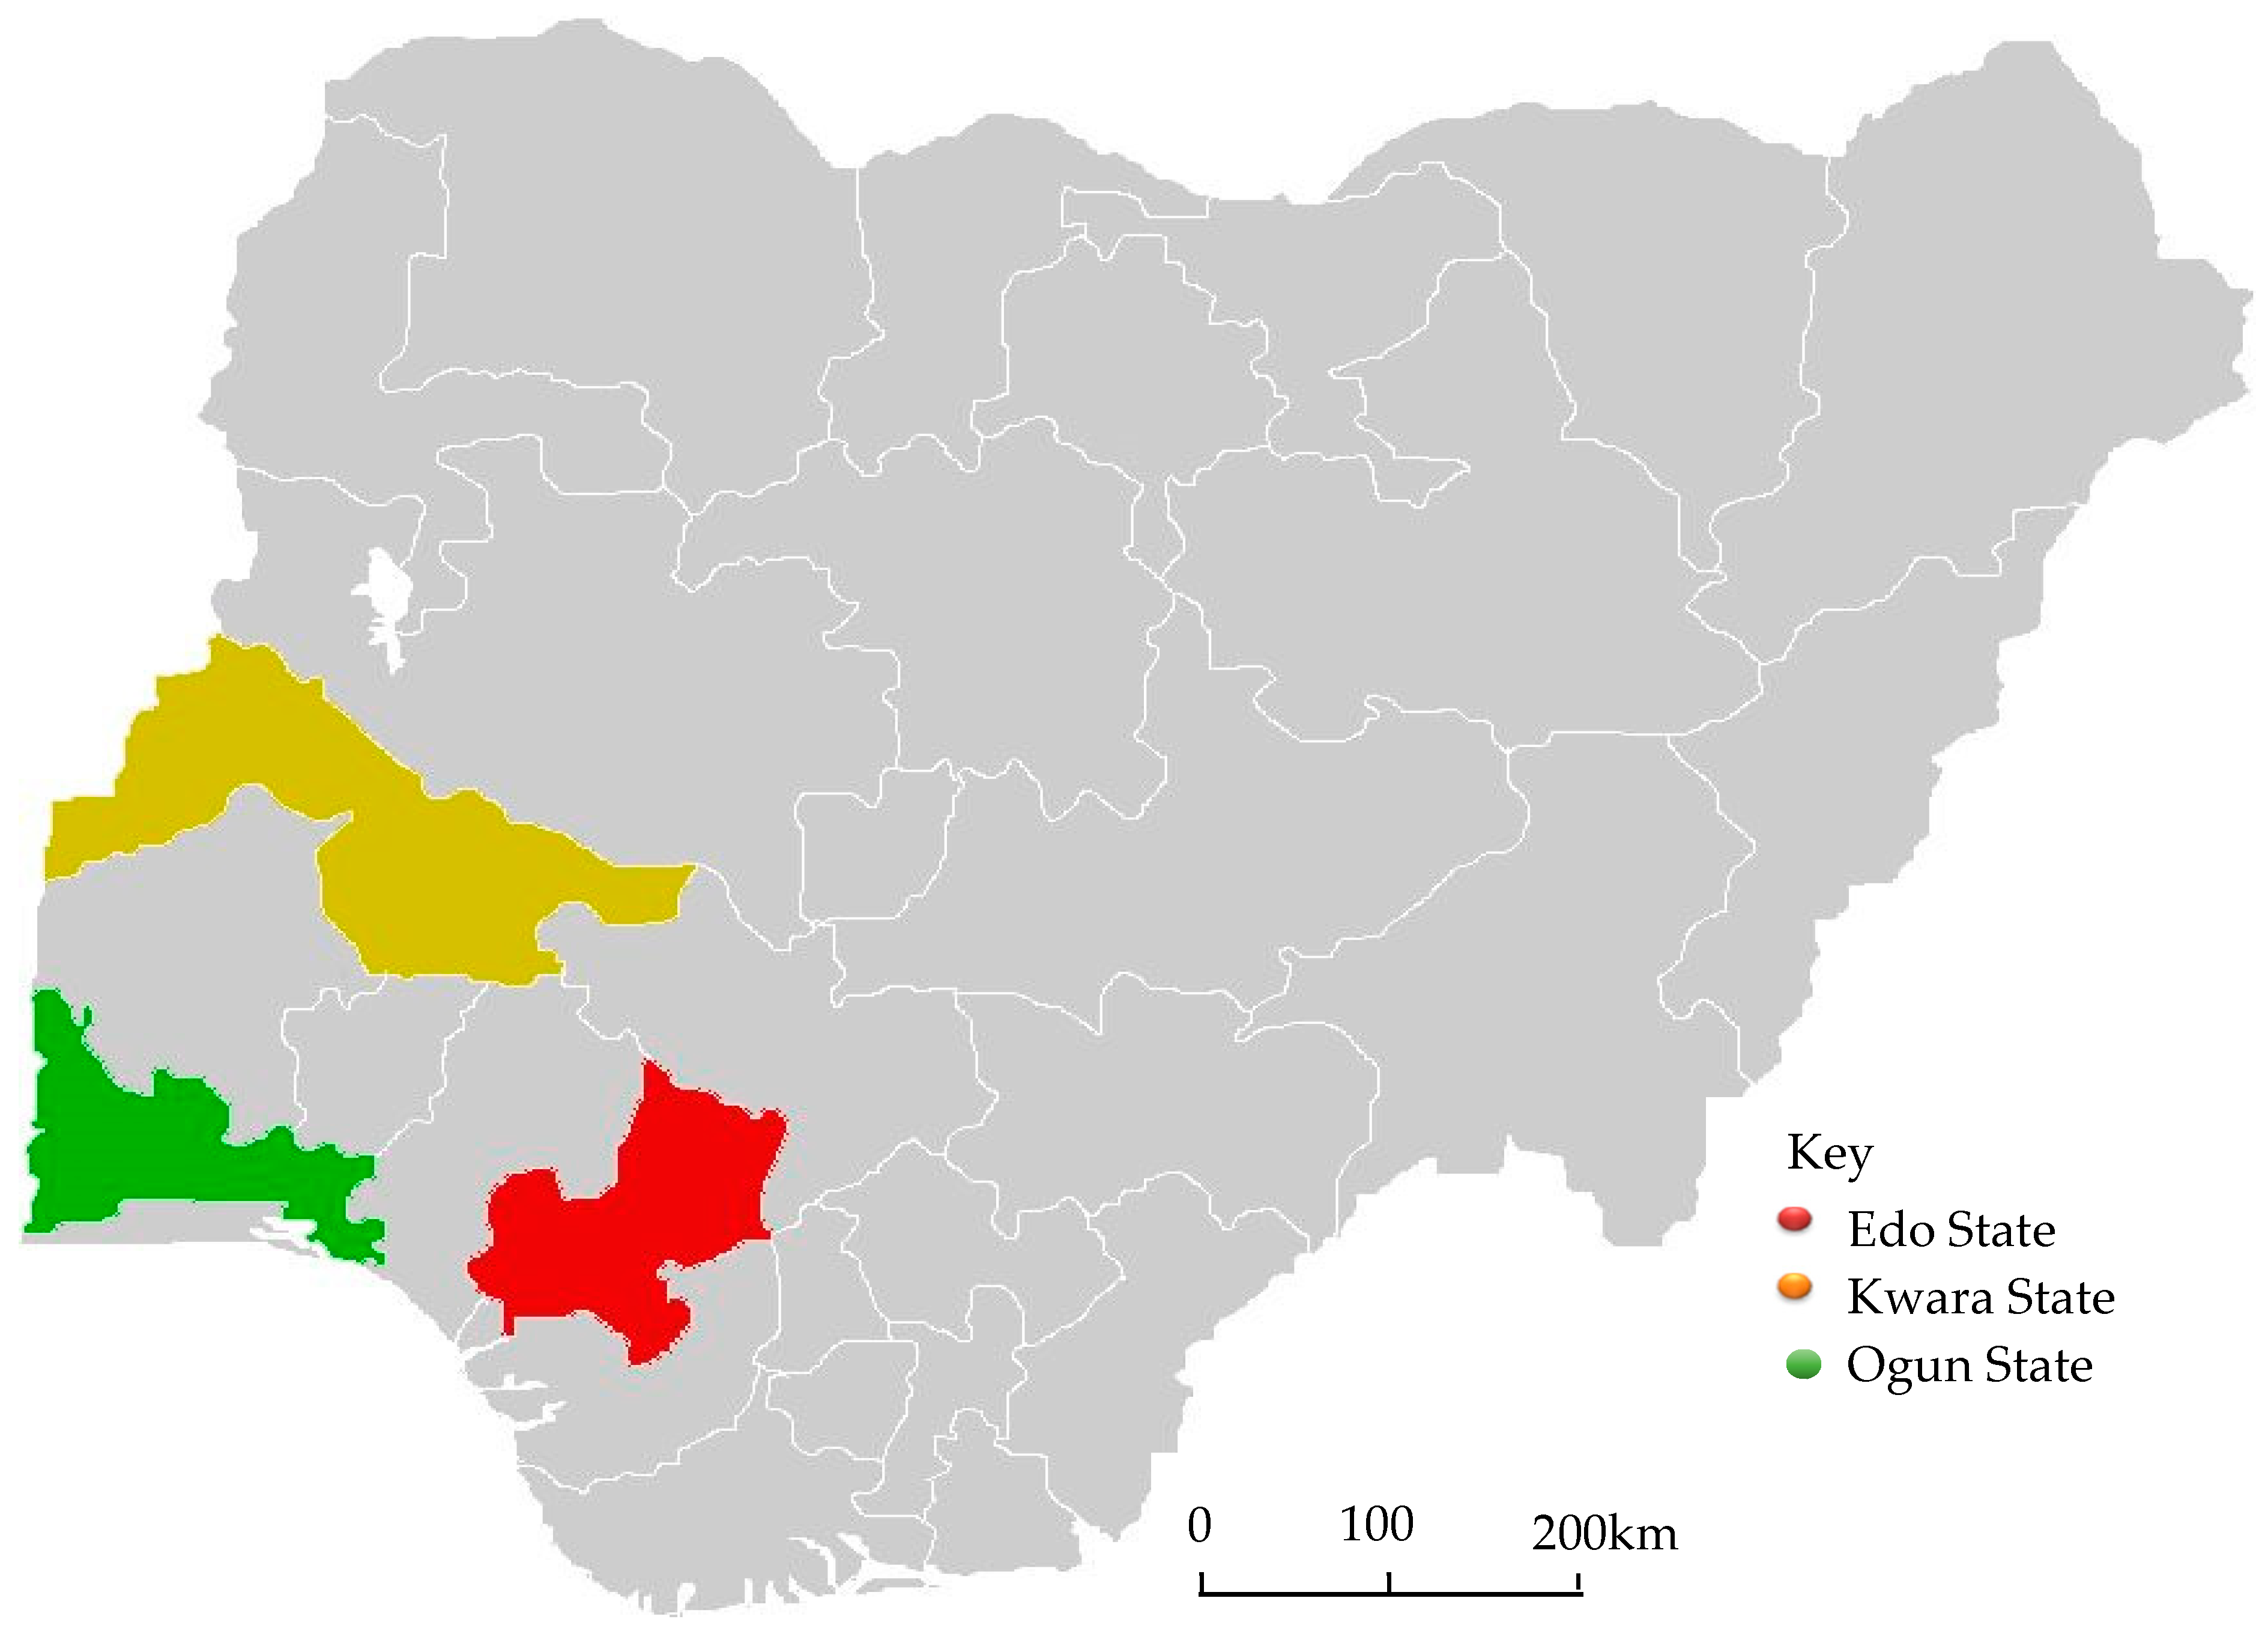
This WTP study was carried out in three states (Edo, Kwara, and Ogun) within the humid forest and savannah zones of Nigeria (see Figure 1). A multi-stage sampling technique was used to select respondents for the research. The first stage was a purposive selection of the three states based on their high level of cassava production and processing [30]. The second stage was a random selection of two agricultural zones in each state. In the last stage, 75 respondents were randomly selected from each agricultural zone. A total of 450 copies of a questionnaire were administered to obtain information on demographic and socioeconomic characteristics of cassava processors, the quantity of waste produced, the waste management methods used, and the willingness of the processors to adopt and pay for financially-rewarding solid-waste management methods. Four hundred and three (403) copies of the questionnaire were used in the final analysis, while 47 were discarded because they contained incomplete information. Furthermore, three major technology research and extension institutions with waste management research mandate within the survey zones (humid and savannah) were purposively selected. Interviews were conducted with key informants in these institutions to identify the improved waste management technologies developed and available in the zones and Nigeria.
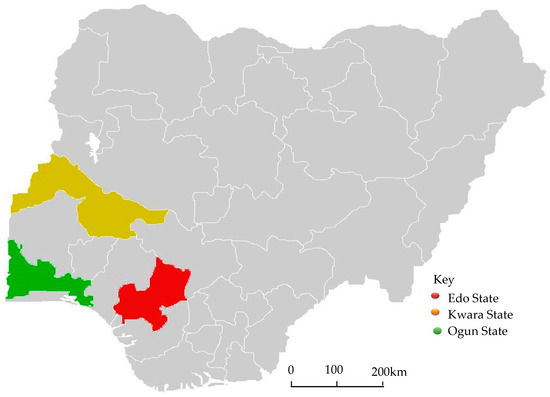
Figure 1.
Map of Nigeria showing study areas.
3.2. Estimation Methods
The selected variables for this study comprised age, sex, marital status, education level, household size, years of experience, source of credit, and scale of operation. A complete description of these variables is presented in Table 1.

Table 1.
Descriptive Statistics of the Respondents.
A logit model based on the cumulative probability function was adopted to determine the factors that influence current solid-waste management systems as well as the mean willingness to pay for a value-added solid-waste management system and the factors influencing processors’ willingness to pay. This was because the model could deal with a dichotomous dependent variable. The approach for this model follows the one adopted by Yusuf et al. [31].
The logit model is specified as follows:
where yi represents the response of ith processor’s willingness to pay for a value-added solid-waste management system, which is either 1 if yes or 0 if no.
For the model to estimate the factors influencing current use of solid-waste management system; yi is the ‘yes or no’ response of the smallholder processor to each of the four systems (dumping, giving out free, selling wet and selling dry). Β0 is a constant; β1 is the coefficient of the independent variables; while Xi is the price that the ith processor stated for a value-added solid-waste management system.
The mean willingness to pay of the smallholder cassava starch processors for improved solid-waste management was calculated using the formula adopted by [32] and is given by:
To assess the factors influencing processors’ willingness to pay for an improved solid-waste management system, the processor’s responses to the WTP question—1 if yes and 0 if no—were then regressed against the socioeconomic characteristics of each processor. The regression logit model is specified as:
where Y represents the processor’s response to the WTP question, which is either 1 if yes or 0 if no; and Zi is equal to β0 + β1Xi. Transformed into a linearized form, the model is expressed as:
where Y is willingness to pay for improved waste management training, X1 is sex (male = 0; female = 1), X2 is household size (number), X3 is quantity of cassava processed (kg), X4 is processing experience in years, X5 is years of education, X6 is member of association (yes = 1, no = 0), and X7 is awareness of value-added solid-waste management systems (yes = 1, no = 0).
Y = β0 + β1X1 + β2X2 + … + βnXn.
4. Results and Discussion
4.1. Summary of Description of Cassava Processors
Table 1 presents the descriptive statistics of the respondents. The table shows that the majority (68.7%) of the interviewees were female. This result is similar to the results of [32,33], who revealed that female processors are in the majority in global cassava processing. This suggests that female processors would be predominant in the sector in the study areas. More than half of the processors fell within the age range of 46 to 65 years. The mean age of the respondents in the study was 48 years, which is similar to the mean age of cassava processors found by [34] in Ogun State. This shows that the majority of the respondents were of an active working age and may appreciate the opportunity to use value-added solid-waste management.
On average, the processors had received approximately 7 years of education. Education is expected to increase awareness of the negative impact of solid waste on humans and the environment. The mean household size of the respondents was about six persons. This is in line with the findings of [34], where the average household size for a cassava farmer in Ogun State is seven. Most (83.3%) of the respondents owned their processing centres and over half (57.0%) had used their own funds to establish their enterprises. In terms of the scale of operation, the study showed that 62.3% of the respondents’ processed 1 to 10 tonnes of cassava roots monthly. In addition, liquid waste consisting of suspensions of starch, solid materials, and cyanogenic cassava compounds was produced and released into the surrounding channels, streams, and rivers, thereby, causing major environmental pollution [35,36,37].
4.2. Summary of Solid Waste Produced by Cassava Processors
This section presents the summary of the two main solid wastes—peel and chaff—identified in the study. The result presented in Table 2 revealed that an average of 737 ± 954 kg and 511 ± 561 kg of peel was generated per processor during the high and low processing seasons, respectively; while an average of 141 ± 131 kg and 94 ± 92 kg of chaff was produced per processor during the same respective periods. About half (50.4%) of the processors generated up to 500 kg of cassava peel per month during the peak season; while almost 45.0% of them produced 500 to 1500 kg per month during this period. During the low season, nearly 64.0% produced up to 500 kg of cassava peel per month and about 35.0% generated 500 to 1500 kg per month. Similarly, 84.0% and 69.8% of the cassava processors produced up to 150 kg of cassava chaff per month during the high and low seasons, respectively. In addition, 21.4% and 14.8% of the processors generated 300 kg and 151 kg of chaff during the high and low processing seasons, respectively. The low processing season was from October to March, while the high processing season was from April to September.
Table 2.
Quantity of Solid Wastes Produced.
4.3. Current Solid-Waste Management Systems Used by Cassava Processors
In this section, we present the summary of different cassava solid-waste management systems currently in use by the cassava processors (Table 3). We also isolate the factors that determined the use of each of the systems identified (Table 4).
Table 3.
Solid-Waste Management Options Used.
Table 4.
Estimates of Determinants of the Current Cassava Solid-Waste Management System Used by the Cassava Processors.
4.3.1. Summary of Current Cassava Solid-Waste Management Systems Used
Waste management practices varied across the processing centres, and the processors utilised one or more waste management practices. Four management practices were identified as commonly used by the processors (see Table 3). These were dumping, gifting, selling wet waste, and selling dry waste. The processors could adopt one or more of these options, but a greater percentage of them (59.6%) dumped their waste or passed it on as a gift (58.1%).
In most community cassava-processing centres, cassava waste dumps are often a source of environmental pollution and a danger to aquatic animals, plants, and humans. A study conducted by Anikwe and Nwobodo [38] in southeastern Nigeria revealed that there were differences in soil particle size distribution between municipal dump and non-dump sites used for urban agriculture. Soil bulk density was lower, by 9 to 13.0%, while total porosity and hydraulic conductivity were higher, by 9 to 14.0% and 240 to 463.0%, respectively, at the dump sites compared with the non-dump sites. Similarly, the study by Arimoro et al. [39] on the effect of cassava effluents on macroinvertebrates downstream showed that cassava effluents caused a decrease in dissolved oxygen and pH and an increase in biochemical demand (BOD) and nitrates from the samples taken from three stations along the Orogodo River course (upstream of the cassava-impacted site, at the cassava-impacted site, and downstream of the cassava-impacted site) in the Niger Delta. In addition, another study by Izugbara and Umoh [40] on indigenous waste management practices in urban Nigeria, revealed careful waste segregation and sorting, selective burning and burying, composting and conversion as some of the common indigenous waste management practices used by the sampled respondents. In addition, a small percentage of the respondents sold the solid waste in fresh (27.8%) or dry (35.5%) form.
4.3.2. Estimates of the Determinants of Current Cassava Solid-Waste Management Systems
After identifying the current waste management systems in use by smallholder cassava processors, the study examined the factors that determined the use of these systems. The results for each management system in use by the cassava processors are presented in Table 4. The likelihood ratios were significant at 1% across the four waste management systems in use. The result also indicated that the likelihood of using dumping as a waste management system increased significantly with the quantity of cassava processed (marginal scale) and the processors who produced fufu (27.8%) and garri (36.7%). However, an increase in cooperative/partnership ownership structure rather than sole ownership and being resident in Kwara State reduced the likelihood of dumping. This implies that processors of a large quantity of cassava and those engaged in the production of fufu and garri may have found the dumping system more useful than any other waste management system for getting rid of their solid waste. However, this may not be true for processors residing in Kwara state who had a lower preference for the use of dumping as indicated by the negative sign associated with Kwara state location variable. The information obtained from the respondents in Kwara State [41] revealed that over 54.0% of the processors dispose of solid waste through the three other forms of waste management systems (giving out free, selling dry and selling wet) particular to those who rear animals, while only 13.0% used the dumping waste management system. The processors in cooperative/partnership ownership may also not have sole decision-making power in determining the use to which solid waste is put in the processing concern. This finding is in contrast with Olukanni and Olatunji [13], that found dumping as the most common waste management system used by over 90.0% of the cassava processors in Ogun State, Nigeria.
The likelihood of giving solid waste out free increased significantly with being female (1.3%), cooperative/partnership ownership structure rather than sole producer (1.1%), residency in Ogun State (27.3%), production of garri (50.0%) and lafun (15.6%). Furthermore, the likelihood of selling cassava solid waste in a wet form significantly increased with years of experience (0.6%), membership of association (10.0%), cooperative/partnership ownership structure (32.7%) and residency in Kwara State (13.8%). However, it reduced significantly for the processors resident in Ogun State (14.3%). Similar results were obtained by Ekere et al. [42] who found that gender, peer influence, land size, location of household and membership of environmental organisations explain household waste utilisation and separation behaviour. In addition, a study conducted by Sackey and Bani [5] found that three-quarters of the cassava processors in the selected districts of Ghana gave cassava peels out freely to feed ruminants, while the rest one-quarter disposed of it by dumping in open areas.
The likelihood of selling of cassava solid waste in dry form increased with the quantity of cassava produced, albeit on a very small scale (4.45 × 10⁻⁶) and with residency in Kwara State (11.4%). However, it reduced with being resident in Ogun State (11.0%) and producing fufu (20.8%).
4.4. Willingness to Pay for Improved Waste Management Systems
There are improved waste management systems that enable processors to make such value-added products as mushrooms, feed, ethanol, biofuel, and organic manure from cassava waste. The products generated from improved waste hold promise for environmental preservation and income generation for the cassava processors. As captured in Table 5, 61.8% of the processors indicated a willingness to pay for training in converting cassava waste into organic manure, while 56.3% indicated a willingness to pay for training in mushroom production. Similar results were obtained by Odediran and Ojebiyi [32], who found that most of the cassava processors at a technology demonstration in Ogun State were willing to adopt the technology to produce mushrooms from cassava waste.
Table 5.
Responses of the Cassava Processors on Willingness to Pay for Improved Waste Management Systems.
In addition, following [31], the coefficient of the price of processors willing to pay for value-added solid-waste management (β1) was found to be positive for both types of training, thus, suggesting that the processors were willing to pay (see Table 6). The estimated mean value of WTP was ₦504.63 ($3.00) for training on production of mushrooms from cassava waste and ₦159.15 ($1.00) for training on converting cassava waste into organic manure. Organic manure from cassava peel is not often used by the farmers in the study areas. Thus, the processors are not motivated to invest in producing manure since they believe the product will be difficult to sell. Furthermore, the use of cassava waste to produce mushrooms has limitations in the study area because mushrooms are not a staple food in Nigeria but more of a luxury food item [43].
Table 6.
Mean Willingness to Pay for Training in Organic Manure and Mushroom Production from Cassava Waste.
Moreover, most of the processors interviewed believed that additional production activity around cassava peel would be time-consuming and distract them from their main processing activities. In many study areas, wild-mushroom hunting is common among women, youths, and children [44,45]. This decreases the importance of mushroom production from cassava waste for the processors. Therefore, it could be inferred that the considerable low WTP estimates for training on conversion of waste to economic use via manure and mushroom production can be attributed to the lack of awareness of the benefits of these two products within the study communities.
4.5. Determinants of Willingness to Pay for Improved Solid-Waste Management System
Table 7 presents the results of factors affecting WTP for the above-mentioned two types of training. Concerning training on mushroom production, the results revealed that the model was significant at 1%, while the McFadden’s R squared (pseudo R2) equalled 18.8%. The model coefficients revealed that processor’s sex had a positive and significant relationship on WTP for the training, suggesting that the female gender increases the likelihood of WTP for the training by about 0.14. Similarly, the significance of household size, large scale of operation and awareness of new management system at 5% suggest that these variables are likely to increase the WTP for mushroom cultivation training by about 0.03, 0.15 and 0.32, respectively. The significance of the variable on awareness of new management systems is contrary to the conclusion of Odediran and Ojebiyi [32], who reported that there was no significant relationship between their respondents’ awareness of cassava waste utilisation technologies and the WTP for them. The indication is that awareness of new management systems would likely increase the WTP for mushroom production training by a probability of about 0.32. Conversely, the quantity of cassava processed, though significant at 1%, had an opposing sign, thus, suggesting the variable’s likelihood to decrease WTP by not too obvious a margin. However, the decrease in WTP associated with the quantity of cassava produced may be restricted to small-scale cassava processors. The positive significance of the variable on large-scale operation processor seems to suggest that this group of processors will be more disposed to participating in mushroom training than their small-scale operation counterparts.
Table 7.
Factors Influencing the Willingness to Pay for Training in New Solid-Waste Management Options.
The model on processors’ willingness to pay for training on organic manure was significant at 1%, while the McFadden’s R squared (pseudo R2) equalled 13.9%. Concerning the individual variables, the sex of processors had a positive relationship, with the WTP for organic manure training and was highly significant. This suggests that female respondents were more likely to be willing to pay for organic manure production training than their male counterparts. A unit increase in the household size equally increased the probability of WTP for the training by 0.03.
The significance of both awareness of new waste management systems and years of processors’ education seems to indicate their importance in increasing the likelihood of WTP for this training by about 0.43 and 0.01, with the former likely to have more effect. Despite the marginal effect associated with years of education, its relevance cannot be sidelined. This is because processors with higher level/increased years of education are better exposed/accommodative to new technologies and, hence, are more likely to better appreciate the benefits to be derived from the use of organic manure, particularly on environmental and health grounds. This result is consistent with that of [45,46,47], who found persons with a higher level of education more willing to pay for solid waste disposal management services.
However, the relationship between the quantity of cassava processed and WTP for training in organic manure production was found to be negatively significant and with lesser effect. This indicates that any increase in the amount of cassava processed is likely to decrease the WTP for training in organic manure production. This is contrary to expectation, given the fact that those with a larger quantity of cassava to process should be the ones with more interest in finding alternative ways of disposing of solid waste, particularly if such processes will bring additional income. The observed result may arise if the processors do not find organic manure training an attractive/relevant measure for addressing their large solid waste concern. Moreover, as earlier stated, most processors believed that the additional production activities around cassava peel are time-consuming and would distract them from their main processing activities.
5. Conclusions
The study examined the willingness to pay for value-added solid-waste management systems among 403 cassava processors in the humid forest and Guinea savannah zones of Nigeria. The study showed that the solid-waste management practices currently in use by the cassava processors are dumping, gifting, and selling solid waste in wet and dry forms. The factors influencing the processor’s decision on the type of waste management system were observed to include gender, membership of association, quantity of cassava processed and ownership structure. Two value-added solid-waste management options (organic manure and mushroom production) were introduced to the cassava processors, and more than half of them were willing to pay for acquiring the knowledge to use them. The factors positively influencing the WTP for expertise on conversion of solid waste to organic manure were female gender, household size, years of education, and awareness of the new options, while a possible increase in the quantity of cassava processed negatively influenced the WTP.
Similarly, while gender, household size and awareness of the new options positively influenced the willingness to pay for training in mushroom production, a possible increase in the quantity of cassava processed negatively influenced the WTP. While large quantities of waste are generated during both the high and low processing seasons, which can create significant environmental and human health hazards in the short run and in the long run, processors were willing to pay only a small amount of money to learn new methods of profitably disposing of the waste. This finding could be due to insufficient hygiene regulations and enforcement by the local authorities at cassava processing centres, which means that the processors had never been made to pay for waste disposal. Such circumstances decrease the processors’ willingness to pay adequate amounts for training in new waste conversion or disposal methods.
Therefore, based on the findings of this study, it is recommended that sensitisation and subsidised training of processors in the benefits of safe waste conversion and disposal and in various new options for value-added management of solid waste should be intensified to encourage and enable cassava processors to manage agro-based waste safely. The large amount of waste generated by each processor shows the need for environmental hygiene protocols to be developed and enforced at community cassava processing centres. At the same time, the market for value-added agro-based waste products should be vigorously expanded.
Author Contributions
V.O.O. and A.B.A. conceived the idea, while V.O.O. and O.O. designed the study; O.O. collected and analysed the data; while the three authors wrote the paper.
Funding
This research was funded by the German Federal Ministry of Education and Research (BMBF) and Ministry of Economic Cooperation and Research (BMZ), grant number FKZ 031 A258 A
Acknowledgments
We also acknowledge the International Institute for Tropical Agriculture (IITA) for providing technical support for carrying out the field survey.
Conflicts of Interest
The authors declare no conflict of interest in this study.
References
- Nhassico, D.; Muquingue, H.; Cliff, J.; Cumbana, A.; Bradbury, J.H. Rising African cassava production, diseases due to high cyanide intake and control measures. J. Sci. Food Agric. 2008, 88, 2043–2049. [Google Scholar] [CrossRef]
- Manyong, V.; Dixon, A.; Makinde, K.; Bokanga, M.; Whyte, J. The Contribution of IITA-Improved Cassava to Food Security in Sub-Saharan Africa: An Impact Study; International Inst. of Tropical Agriculture IITA: Ibadan, Nigeria; Modern Design & Associates Ltd.: Lagos, Nigeria, 2000. [Google Scholar]
- Ayinla, O.A. Analysis of Feeds and Fertilizers for Sustainable Aquaculture Development in Nigeria. FAO Fish. Tech. Paper 2007, 497, 453. [Google Scholar]
- Ubalua, A.O. Cassava wastes: Treatment options and value addition alternatives. Afr. J. Biotechnol. 2007, 6, 2065–2073. [Google Scholar]
- Sackey, I.S.; Bani, R.J. Survey of waste management practices in cassava processing to gari in selected districts of Ghana. J. Food Agric. Environ. 2007, 5, 325–328. [Google Scholar]
- Okoya, A.A.; Oyawale, F.E.; Ofoezie, I.E.; Akinyele, A.B. Impact of industrial cassava effluent discharge on the water quality of Ogbese river, Ayede-Ogbese, Ondo state, Nigeria. Ethiop. J. Environ. Stud. Manag. 2016, 9, 339–353. [Google Scholar] [CrossRef]
- Raney, T.; Anríquez, G.; Croppenstedt, A.; Gerosa, S.; Lowder, S.; Matuscke, I.; Skoet, J.; Doss, C. The Role of Women in Agriculture. Agricultural Development Economics Division (ESA) of the Economic and Social Development Department of the United Nations Food and Agriculture Organization (FAO). ESA Working Paper No. 11-02. 2011. Available online: http://www.fao.org/docrep/013/am307e/am307e00.pdf (accessed on 30 August 2017).
- Osunbitan, J.A. Short term effects of Cassava processing waste water on some chemical properties of loamy sand soil in Nigeria. J. Soil Sci. Environ. Manag. 2012, 3, 164–171. [Google Scholar]
- Aliu, I.R.; Adeyemi, O.E.; Adebayo, A. Municipal household solid waste collection strategies in an African megacity: Analysis of public private partnership performance in Lagos. Waste Manag. Res. 2014, 3, 67–78. [Google Scholar] [CrossRef] [PubMed]
- Gilpin, A. Dictionary of Environmental and Sustainable Development; John Wiley and Sons: Sussex, UK, 1996; p. 201. [Google Scholar]
- Olanbiwoninu, A.; Odunfa, S.A. Production of fermentable sugars from organosolv pretreated cassava peels. Adv. Microbiol. 2015, 5, 117–122. [Google Scholar] [CrossRef]
- Abass, A.B.; Onabolu, A.O.; Bokanga, M. Impact of the high-quality cassava flour technology in Nigeria. In Root Crops in the 21st Century, Proceedings of the 7th Triennial Symposium of the International Society for Tropical Root Crops-Africa Branch (ISTRC-AB), Centre International des Conferences, Cotonou, Benin, 11–17 October 1998; Akoroda, M.O., Ngeve, J.M., Eds.; International Society of Tropical Root Crops: Cotonou, Republic of Benin, 1998. [Google Scholar]
- Olukanni, D.O.; Olatunji, T.O. Cassava waste management and biogas generation potential in selected local government areas in Ogun State, Nigeria. Recycling 2018, 3, 58. [Google Scholar] [CrossRef]
- Salau, M.A.; Ikponmwosa, E.E.; Olonode, K.A. Structural strength characteristics of cement-cassava peel ash blended concrete. Civ. Environ. Res. 2012, 2, 68–77. [Google Scholar]
- Oviasogie, P.O.; Ndiokwere, C.L. Fractionation of lead and cadmium in refuse dump soil treated with cassava mill effluent. J. Agric. Environ. 2008, 9, 10–15. [Google Scholar]
- Omotosho, O.; Amori, A. Caustic hydrogen peroxide treatment of effluent from cassava processing industry: Prospects and limitations. Int. J. Eng. Technol. Innov. 2015, 5, 121–131. [Google Scholar]
- Onifade, T.; Adeniran, K.; Ojo, O. Assessment of cassava waste effluent effect on some water sources in Ilorin, Nigeria. Afr. J. Eng. Res. 2015, 3, 56–68. [Google Scholar]
- Oyegbami, A.; Oboh, G.; Omueti, O. Cassava prrocessors’ awareness of occupational and environmental hazards associated with cassava processing in southwestern Nigeria. Afr. J. Food Agric. Nutr. Dev. 2010, 10, 2176–2186. [Google Scholar]
- Uhuegbu, C.C.; Onuorah, L.O.; Ayara, W.A.; Ugonabo, O. Organic kerosene production from a mixture of cassava (Manihotesculentia), maize (Zea mays) and Akintola leaves (Chrollaenaodorata). J. Int. Acad. Res. Multidiscip. 2015, 3, 54–60. [Google Scholar]
- Sabiiti, E.N. Utilising agricultural waste to enhance food security and conserve the environment. Afr. J. Food Agric. Nutr. Dev. 2011, 11, 1–9. [Google Scholar]
- Plassmann, H.; O’Doherty, J.; Rangel, A. Orbitofrontal cortex encodes willingness to pay in everyday economic transactions. J. Neurosci. 2007, 27, 9984–9988. [Google Scholar] [CrossRef] [PubMed]
- Haq, M.; Mustaa, U.; Ahmad, I. Household’s willingness-to-pay for safe drinking water: A case study of Abbottabad district. Pak. Dev. Rev. 2007, 46, 1137–1153. [Google Scholar] [CrossRef]
- Rodríguez, E.; Lacaze, V.; Lupín, B. Contingent valuation of consumers’ willingness-to-pay for organic food in Argentina. In Proceedings of the 12th Congress of the European Association of Agricultural Economists (EAAE), Ghent, Belgium, 1–10 August 2008. [Google Scholar]
- Mitchell, R.C.; Carson, R.T. Using Surveys to Value Public Goods: The Contingent Valuation Method; Resources for the Future: Washington, DC, USA, 1989. [Google Scholar]
- Venkatachalam, L. The contingent valuation method: A review. Environ. Impact Assess. Rev. 2004, 24, 89–124. [Google Scholar] [CrossRef]
- Perman, R.; Ma, Y.; McGilvray, J.; Common, M. Natural Resource and Environmental Economics, 3rd ed.; Addison-Wesley: Boston, MA, USA, 2003. [Google Scholar]
- Boxall, P.C.; Adamowicz, W.L.; Swait, J.; Williams, M.; Louviere, J. A comparison of stated preference methods for environmental valuation. Ecol. Econ. 1996, 18, 243–253. [Google Scholar] [CrossRef]
- Veisten, K. Contingent valuation controversies: Philosophic debates about economic theory. J. Socio-Econ. 2007, 36, 204–232. [Google Scholar] [CrossRef]
- Cawley, J. Contingent Valuation Analysis of Willingness to Pay to Reduce Childhood Obesity; Working Paper 12510; National Bureau of Economic Research (NBER): Cambridge, MA, USA, 2006; pp. 1–39. [Google Scholar]
- Ezedinma, C.; Lemchi, J.; Okechukwu, R.; Ogbe, F.; Akoroda, M.; Sanni, L.; Okoro, E.; Okarter, C.; Dixon, A.G.O. Status of Cassava Production in South East and South South Nigeria—A Baseline Report; International Institute of Tropical Agriculture (IITA): Ibadan, Nigeria, 2007. [Google Scholar]
- Yusuf, S.A.; Ojo, O.T.; Salimonu, K.K. Households’ willingness to pay for improved solid waste management in Ibadan North local government area of Oyo state, Nigeria. J. Environ. Ext. 2007, 6, 57–63. [Google Scholar] [CrossRef]
- Odediran, O.F.; Ojebiyi, W.G. Cassava processors’ willingness to utilise cassava peel for mushroom production in Southwest, Nigeria. Int. J. Agric. Policy Res. 2017, 5, 86–93. [Google Scholar]
- Davies, R.M.; Olatunji, M.O.; Burubai, W. A survey of cassava processing machinery in Oyo State. World J. Agric. Sci. 2008, 4, 337–340. [Google Scholar]
- Obayelu, O.A.; Akintunde, O.O.; Obayelu, A.E. Determinants of on-farm cassava biodiversity in Ogun State, Nigeria. Int. J. Biodivers. Sci. Ecosyst. Serv. Manag. 2015, 11, 298–308. [Google Scholar] [CrossRef]
- Zhang, M.; Xie, L.; Yin, Z.; Khanal, S.K.; Zhou, Q. Biorefinery approach for cassava-based industrial wastes: Current status and opportunities. Bioresour. Technol. 2016, 215, 50–62. [Google Scholar] [CrossRef] [PubMed]
- Okunade, D.A.; Adekalu, K.O. Physico-chemical analysis of contaminated water resources due to cassava wastewater effluent disposal. Eur. Int. J. Sci. Technol. 2013, 2, 75–85. [Google Scholar]
- Idah, P.A.; Mopah, E.J. Comparative assessment of energy values of briquettes from some agricultural by-products with different binders. IOSR J. Eng. 2013, 3, 36–42. [Google Scholar]
- Anikwe, M.A.N.; Nwobodo, K.C.A. Long term effect of municipal waste disposal on soil properties and productivity of sites used for urban agriculture in Abakaliki, Nigeria. Bioresour. Tech. 2002, 83, 241–250. [Google Scholar] [CrossRef]
- Arimoro, F.O.; Iwegbue, C.M.; Enemudo, B.O. Effects of cassava effluent on benthic macroinvertebrate assemblages in a tropical stream in southern Nigeria. Acta Zool. Litu. 2008, 18, 147–156. [Google Scholar] [CrossRef]
- Izugbara, C.O.; Umoh, J.O. Indigenous waste management practices among the Ngwa of Southeastern Nigeria: some lessons and policy implications. Environmentalist 2004, 24, 87–92. [Google Scholar] [CrossRef]
- Omilani, O. Economics of Solid Waste Management Technology among Cassava Processors in Forest and Savannah Zones of Nigeria. Unpublished Master’s Dissertation, Department of Agricultural Economics, University of Ibadan, Ibadan, Nigeria, 2015; pp. 1–67. [Google Scholar]
- Ekere, W.; Mugisha, J.; Drake, L. Factors influencing waste separation and utilization among households in the Lake Victoria crescent, Uganda. Waste Manag. 2009, 29, 3047–3051. [Google Scholar] [CrossRef] [PubMed]
- Osarenkhoe, O.O.; John, O.A.; Theophilus, D.A. Ethnomycological conspectus of West African mushrooms: An awareness document. Adv. Microbiol. 2014, 4, 39–54. [Google Scholar] [CrossRef]
- Beck, T.; Nesmith, C. Building on poor people’s capacities: the case of common property resources in India and West Africa. World Dev. 2001, 29, 119–133. [Google Scholar] [CrossRef]
- Chuen-khee, P.; Othman, J. Household demand for solid waste disposal options in Malaysia. World Acad. Sci. Eng. Technol. 2002, 66, 1153–1158. [Google Scholar]
- Boateng, S.; Amoaka, P.; Poku, A.A.; Appiah, D.O.; Garsonu, E.K. Household willingness to pay for solid waste disposal services in urban Ghana: The Kumasi metropolis situation. Ghana J. Geogr. 2016, 8, 1–17. [Google Scholar]
- Ini-mfon, V.P.; Ubokudom, E.O.; Ubong, U.S. Households’ willingness to pay for improved solid waste management in Uyo metropolis, Akwa Ibom State, Nigeria. Am. J. Environ. Prot. 2017, 5, 68–72. [Google Scholar] [CrossRef]
© 2019 by the authors. Licensee MDPI, Basel, Switzerland. This article is an open access article distributed under the terms and conditions of the Creative Commons Attribution (CC BY) license (http://creativecommons.org/licenses/by/4.0/).