Abstract
The paradigm shift from value chains to value webs in the emerging bioeconomy has necessitated a review on how agricultural systems transit to value web production systems. This study examines how smallholders in the cassava system in Nigeria have been able to increase utilization of biomass in their production systems. Using a sample of 541 households, the study employed cluster analysis and ordered probit regression to examine the intensity of cassava utilization and the determinants of the intensity of utilization. The study found that over 50% of the respondents were classified as low-intensity utilization households, while ~13% were high-intensity utilization households. Land, social capital, farming experience, and asset ownership increased the probability of intensifying cassava utilization among smallholders. The study recommends strengthening assets acquisition, improving land quality and encouraging social capital development among smallholders.
1. Introduction
The global quest for a sustainable bioeconomy has brought to the fore the importance of engaging agricultural systems in the development of high value-added products in a sustainable way [1]. This has evolved in the need to supply both food and nonfood products from agricultural biomass, while sustaining the income and livelihood of agricultural actors and the economy as a whole [2]. The potential this has for biomass-rich developing countries is enormous [3]. In this regards, consideration for the bioeconomy is thus expected to form the core of processes in many biomass-rich economies around the world. To this end, the move is geared towards a bioeconomy such that agricultural production is no longer solely for food needs, but for many other nonfood (industrial, pharmaceutical, and energy) needs. Consequently, there have been different initiatives (projects, programs, and conceptual designs) to develop technologies and practices that ensure full utilization of agricultural biomass for food and nonfood uses. One example of this is the adaptation of the value web concept as a business model for agricultural production systems and using this concept in agriculture/biomass-based value webs [3,4,5].
These value webs can be viewed as the linkages between and among agricultural value chains, increased utilization of biomass and/or cascading uses of resources within an agricultural system [4,5]. Value webs suggest higher levels of value addition starting from the smallholder farmer’s enclave. It implies perceiving agriculture as a business with the different income generating options linked and under the control of a single entity and basket of resources for efficiency [6]. Figure 1 is an illustration of cascading uses of cassava biomass utilization in the form of a value web production concept. Economies that currently show a tendency towards agricultural value webs include the sugarcane industry in Brazil, rice industries in China, and the oil palm waste industry in Ghana [7,8,9]. In these economies, full utilization of agricultural biomass predominates such that waste is minimized and maximum returns are derived from the agricultural biomass. For example, in Brazil sugarcane production is geared towards the production of sugar and molasses; while the waste from the processing as well as the farm waste during harvesting are channeled into the production of biogas [10]. This provides opportunities for employment and income generation at different value chains within the sugarcane system. On this premise, the present study thus explores how biomass-based value webs are developed in the smallholder dominated cassava system in Nigeria.
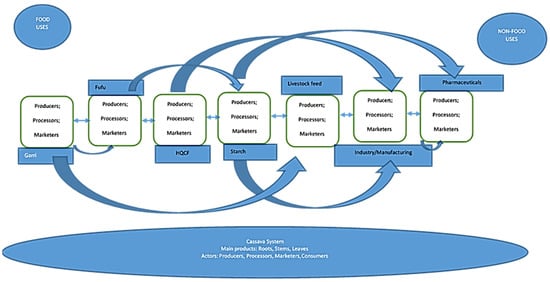
Figure 1.
Illustration of cascading uses of cassava and cross cutting roles of actors in the Nigerian cassava system. Source: Author’s conceptualization.
Cassava is regarded as a food security crop in many developing countries, with a potential to provide off-season calories even on low-nutrient soils [11]. The crop is native to tropical regions of South America; but is now a staple crop in many African countries [12]. With the desire to sustainably increase production to improve food security, while also providing nonfood products from cassava, many countries have begun to explore innovative processes within their agricultural systems. Countries like Ghana and Mozambique have developed innovative uses for industrial raw materials such as starch, sweeteners, beer (Mozambique and Ghana), and, in recent times, industrial bioethanol from cassava [13]. It has been reported that cassava is used to make bioethanol on a small scale and is replacing paraffin in cooking stoves in South Africa [14]. Breweries in Zambia and Mozambique currently use cassava chips at commercial scale while there is growing interest by the brewing industry in Tanzania to use cassava flour. The requirement of cassava within the emerging bioeconomy is premised on value-added production and processing stages that generate more food and nonfood products within farming systems. This in effect has led to higher levels of intensity in utilization of cassava with consequences for waste reduction, diversity of product bases, and higher income for participating farmers and overall market-led production systems. In Nigeria, cassava features prominently in the production of staple food for the teeming population and Nigeria has been reported as the largest producer of cassava in the world followed by Thailand and Indonesia [15]. Cassava makes up the bulk of dietary energy supply for many households in developing countries [16]. Its versatility in the production of food and nonfood commodities has been documented; from the production of staple foods such as fermented cassava flakes, to starch used for domestic and industrial purposes [2,11]. However, its emergence as a producer of nonfood biomass and industrial raw material is still limited in Nigeria. This is because cassava is seen by many smallholders as a reserve crop and a crop for producing some of the most consumed staples across the countries [11,15]. With the increasing population and hence demand, cassava production in the country is not sufficient to meet the food needs of its populace. This also stems from the fact that low technology adoption by the cassava smallholders leads to low productivity. In addition, the low technology of processing has been the bane of processing cassava into high valued industrial commodities [17,18].
The limitation in value addition in smallholder agriculture in Nigeria is a factor that has continually reduced the potential of the agricultural system to be a major player in the global cassava bioeconomy. The limitation is a result of many interwoven and sequential variables. Perhaps the main challenge is lack of access to market by smallholder farmers in general and cassava farmers in particular [19]. This has also been attributed to a lack of standardization of products and, hence, low competitiveness within the commodity market, which is also linked to inadequate infrastructure and technology. This has resulted in the continued classification of the Nigerian smallholder as subsistence with low production capacity and income. Hence, a cassava smallholder is mainly interested in selling his roots as fast as possible, while processing just enough for the subsistence of the farm family.
The Federal Government of Nigeria has made efforts to commercialize cassava as in the cases of cocoa and maize [20]. One such initiative was the development of the Cassava Bread Development Fund (CBDF) in 2008, which aimed to include 20% High Quality Cassava Flour (HQCF) in bread and up to 40% HQCF in other confectionery products [21]. Following the CBDF were the Agricultural Transformation Agenda (ATA) in 2011 and the present Agricultural Promotion Policy (APP) in 2015. Despite some success stories with cassava commercialization in pockets of large-scale farms, there is still a need to increase cassava utilization in view of its potential to develop the economy [22]. Since smallholders make up the majority of actors in the cassava value chain [23], there is a need to engage them in renewed efforts to increase utilization of cassava within their farming systems. We propose, in this study, that intensifying the utilization of cassava through improved production and diversified processing is a major step in value web development among cassava smallholders. On the basis of the above this study set out to establish evidence of value webs as a function of intensity of utilization in the Nigerian cassava system. The objectives are to examine the extent to which smallholders utilize cassava within their farming systems in Nigeria, classify the households into groups based on intensity of cassava utilization, and identify the determinants of the extent of cassava utilization among smallholders in Nigeria.
2. Materials and Methods
2.1. Study Area and Sampling
The study was carried out in three states representing the forest (Edo and Ogun states) and Guinea savannah (Kwara State) ecological zones in Nigeria. The Federal Republic of Nigeria is on the southern coast of West Africa, bordered by Cameroon to the East, Chad to the North East, Niger to the North, Benin to the West, and the Atlantic Ocean to the South. The ecology of Nigeria varies from the tropical rainforest in the south to the dry savanna in the North, with varying fauna and flora. The low lying coastal regions are characterized by mangroves, while the fresh water regions produce the swamp forest. Inland, the vegetation gives way to the tropical hardwood forest.
The rural population makes up over 50% of the Nigerian population [24]. In the rural areas, farming is the predominant occupation, with smallholder farming dominating. Cassava is produced in almost all states of the federation. In Northern Nigeria, cassava is produced mainly in the Guinea savannah belt—Kogi, Kwara, Benue, Taraba, and Kaduna states—while all the states in the southern Nigeria produce cassava at various capacities.
A multistage sampling procedure was used in collecting data for this study. In the first stage, three states were purposively selected from the sampling frame of cassava producing states in Nigeria. The second stage involves the random selection of two Agricultural Development Program (ADP) zones from the sampling frame of ADP zones within each selected state. Each state is divided into ADP zones and monitored by ADP officers. The third stage involves random selection of agricultural extension blocks from the zones proportionate to the size of the ADP zones earlier selected. In the fourth stage, cells were selected from each block proportionate to the size of the block. The selection of blocks and cells proportionate to the size of the ADPs and blocks, respectively, was based on the formula
where si = sample size of reference state; yi = location population frame, and Hi = required total sample size.
In the final stage, smallholder households were randomly selected from the cell classification of the ADP. Structured questionnaires were administered to 600 smallholder cassava households; however, 541 responses were used for the analysis, while 59 responses were discarded due to inconsistencies or incompleteness.
2.2. Source and Type of Data
The main database for this study was from the household survey of cassava smallholders in the study areas. Primary data were collected for this study from a cross-section of smallholder households, since most crop farmers in Nigeria engage in mixed cropping. Determination of a cassava-based household was based on the proportion of household income that accrues to the household from cassava versus that from other crops. Data for the study was collected on household socioeconomic and demographic characteristics as well as activities carried out within the cassava holdings of the smallholder households.
2.3. Analytical Techniques
2.3.1. Intensity of Cassava Utilization among Smallholders—Cluster Analysis
A cluster analysis was used to segregate cassava smallholders into classes based on intensity of cassava utilization. The variables used in the cluster analysis were responses of the smallholder households to a list of items that correlate to utilization activities in the cassava value web system in Nigeria (see Appendix A). The study used a hierarchical cluster model to group respondents based on the activities selected so that respondents in each group were as close to each other in characterization as possible. The use of Ward’s linkage method minimizes within group deviations among the respondents [25]. The Jaccard similarity measure was used because the responses to the factors used for the cluster analysis were binary in nature. With this method, the smallholder households were classified into low-level, middle-level, and high-level intensity.
2.3.2. Determinants of Intensity of Cassava Utilization—Ordered Probit Model
The ordered probit model was used to identify and compare the probabilities of smallholder households being in any of the three-ordered groups of cassava utilization intensity. The justification for using the ordered probit is that the intensity use of cassava is monotonically ordered [26,27], hence the need to examine the factors that determine inclusion in ordered outcomes. Let the ordered utilization intensity of cassava y and assume discrete values ranging from 0, …, j. The ordered probit model can be determined from a latent variable, y*, subject to explanatory variables and specified as follows
y* is the unobserved discrete random variable with values ranging between 1 and 3, as shown by the categories of intensity of cassava utilization. xi is the vector of independent variables including socioeconomic and enterprise characteristics of the smallholder households, βi is the vector of parameters of the regression to be estimated, and εi is the vector of error term, which is assumed to be normally distributed and with positive probabilities.
Therefore, given the observed intensity of cassava utilization, the dependent variable takes on the following values.
where, 1, 2, and 3 represent low, middle, and high intensity cassava utilization groups, respectively.
The explanatory variables in the model are described as
- X1 = Age of household head
- X2 = Age squared
- X3 = Gender of household head (Male = 1; Female = 0)
- X4 = Proportion of land allocated to cassava
- X5 = Educational level of household head (Nonformal = 0; Formal = 1)
- X6 = Household size
- X7 = Access to agricultural credit (Yes = 1; No = 0)
- X8 = Membership in social group (Yes = 1; No = 0)
- X9 = Asset
- X10 = Nonfarm activities (Yes = 1; No = 0)
- X11 = number of years of farming experience
- X12 = Access to improved cassava variety (Yes = 1; No = 0)
The ordered probit model was analyzed by a maximum likelihood method as follows
The log likelihood specification for this function is thus
Supplementary Analysis: Classification of Smallholder by Asset Ownership
The classification of farming households based on asset ownership was done through a Principal Component Analysis (PCA). The equation is given as follows:
where, Cij = asset index value for the jth household participating in the series of ‘í’ activities; Fi is the weight of the ith variable from the PCA; Xji is the jth household value for the ith variable; Xi and Si are the mean and standard deviations of the values of the ith variables.). The resulting indices were thereafter used to categorise the cassava smallholders into ‘Quintile’ wealth categories as ‘Poorest, Poor, Middle Class, Rich and Richest’.
3. Results and Discussion
This section presents results of the decision process of smallholders in utilizing cassava within the farming household decision matrix. Specifically, it shows the grouping of the smallholders based on their intensity of cassava utilization, a description of the smallholder households by their levels of participation in the cassava value web, as well as the determinants of the levels of participation in the cassava value web in the study area.
3.1. Classification of Smallholders Based on Intensity of Cassava Utilization
The result of the cluster analysis to classify the smallholders based on their intensity of cassava utilization is presented in Figure 2 and Figure 3 and Table 1. Figure 2 is the dendrogram derived from the cluster analysis showing the classification of smallholder cassava-based households. The dendrogram shows the three distinct clusters from the observational data of households. For the purpose of initial explanation, the clusters are named A, B, and C. Cluster A is made up of 273 observations; cluster B, 195 observations; and cluster C, 73 observations.
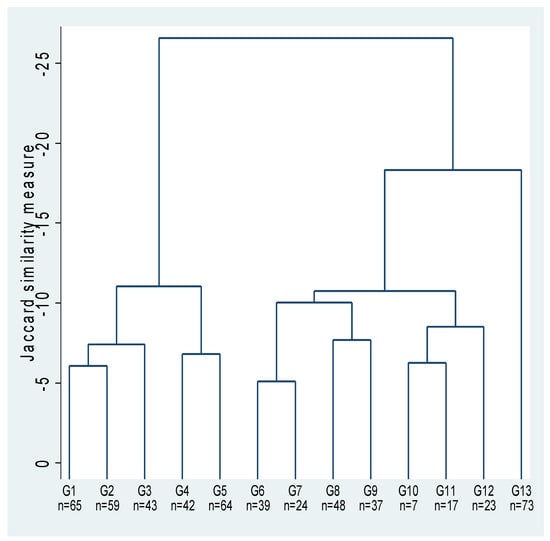
Figure 2.
Dendrogram showing natural groupings of cassava-based smallholder households based on intensity of cassava utilization. Source: Author’s computation using STATA statistical software.
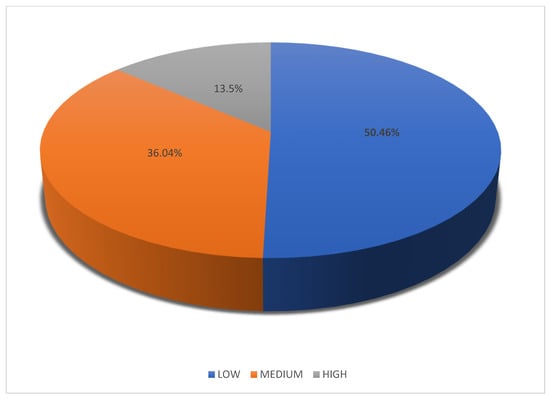
Figure 3.
Percentage distribution of smallholders by intensity of cassava utilization.

Table 1.
Distribution of selected variables for defining cluster groups.
The dendrogram does not however show which of the three clusters is higher up the hierarchy than the other in terms of the cluster groupings [28]. Hence, we do not have a clear idea of the intensity of cassava utilization among each group. The best way to make a meaningful inference from the dendrogram is to profile the groups [29]. The profiling was done by comparing values of three variables that correspond to a priori expectation of the desired groups (low, medium, and high intensity cassava utilization) across the three clusters. The results from these variables were used to score each cluster and then determine which cluster belonged to each desired group.
In this study, the profiling variables used were the number of activities carried out within the cassava system, resources (land) allocated to cassava and income from cassava-based activities. The expectation is that increased utilization of cassava suggests a higher number of activities within the cassava system. Also, increased utilization may imply more resources allocated to cassava within the smallholder’s enterprise combination [30]. Finally, it is expected that, with increased cassava utilization, there would be a more diversified livelihood portfolio and hence an increase in household income [31]. The results of the profiling are shown in Table 1.
The results presented in Table 1 show that cluster C had a rank of 1 with respect to number of activities and income but scored 2 in terms of land allocated to cassava. Cluster B, on the other hand, had a rank of 1 with respect to land allocated to cassava but a rank of 2 with respect to the other variables. However, for all three indicators, cluster A had a consistently lower rank of 3, corresponding to the lowest values for each of the indicators. We can therefore infer that by a priori expectations, cluster A corresponds to the low intensity (LI), while clusters B and C are consistent with medium intensity (MI) and high intensity (HI) cassava utilization groups, respectively. The distribution of the smallholders based on intensity of cassava utilization is shown in Figure 3. The result revealed that approximately half (50.46%) of the smallholders was LI, 36.04% was MI, and only 13.5% was HI cassava utilization groups. The results corroborate the subsistence characteristic that has been associated with the cassava industry in Nigeria [32]. This suggests that most of the policies and interventions towards commercialization of cassava as an earner of foreign revenue has not led to a significant change in the production practices of the majority of smallholders. There may be a need to justify these interventions by appraising their effects on the extent of value addition at smallholding levels.
3.2. Description of Farming Household Characteristics by Intensity of Cassava Biomass Utilization
The distribution of farming household socioeconomic and enterprise characteristics by their intensity of cassava utilization is presented in Table 2. The summary statistics shows no statistical difference in distribution of gender of household heads across the three groups, with overall male dominance of ~70% of the sampled household heads. The average age of the respondents was also not significantly different across the groups with mean age given as 51 years. Average household size was approximately seven across the groups, with number of dependents and income earners being four and three, respectively. A situation in which there were more dependents than income earners suggests an economic burden on the household’s welfare [33]. Years of farming experience was on average estimated at 23 years, with the least being 21.64 years from the LI group and the highest being 28.12 years from the HI groups. This shows that intensity of agricultural utilization thrives not just on cassava production or educational attainment, but on the different linkages within and outside the cassava system that can be obtained from years of experience in a system [34]. The average income from cassava-based activities (₦ 60,662.98) was significantly different across the three groups; with the HI having the highest income of ₦ 69,368.97, while the MI and LI had incomes of ₦ 62,021.81 and ₦ 57,364.42, respectively.
Table 2.
Distribution of cassava farming households by intensity of cassava utilization.
Educational attainment showed that most household heads had primary education (31.42%), followed by secondary education (30.68%). However it is surprising that the proportion of household heads with nonformal education was highest among the HI group (42.47%), while the highest educational attainment for tertiary education was found among the MI group (11.79%). This implies that higher formal education may not be a necessary condition for smallholder households’ decision to increase investment in the cassava value web [35]; rather on-farm experience and training may be more important [36]. Also, while there was a general affinity for social group membership, it was highest among the HI group (93.15%); this supports studies where social capital is hypothesized to encourage adoption of sustainable agricultural practices [37]. Access to credit was observed to be below average in the pooled observation; however, up to 67% of the HI group had access to credit for their productive activities, suggesting that access to credit encourages investment in utilizing capacity of cassava [38].
Classification of land area cultivated showed that there was a higher proportion of farming households cultivating 1.5–3 ha (57.12%); while only 15.09% cultivated <0.5 ha. This suggests an increase in land area cultivated to cassava, probably because of various governmental interventions with regards to the agricultural sector in recent years [12,14]. However, land area allocated to cassava was found to be up to 0.67 across the groups, with LI, MI, and HI allocated 0.60, 0.70, and 00.65, respectively, of their total land area to cassava. This is indicative of the renewed interest of farming households in the cassava industry and increased awareness of the potential for cassava to raise income and livelihoods of farmers and the Nigerian economy at large.
We also found that access to improved cassava variety for planting and processing was above average but increased with intensity of utilization of cassava. The results revealed that up to 77% of HI cassava households planted improved cassava varieties and 69% processed cassava varieties. This is significantly different from the LI group where ~80% planted and ~34% processed improved varieties of cassava. Approximately 65% of MI groups planted and 55% processed improved varieties of cassava in the study area. This may be suggestive of the fact that higher utilization of cassava involves some form of value addition, which entails the use of good quality seed/raw materials for maximizing utility.
3.3. Determinants of Intensity of Cassava Utilization among Smallholders
This section presents the estimates of the ordered probit regression that sought to identify the factors that determine intensity at which the smallholder households utilize cassava within their farming systems. The result is presented in Table 3. The ordered probit regression is premised on the parallel assumption [39]. Hence, we present a joint regression from the ordered probit model. However, estimates of individual determinants of intensity of utilization are obtained by predicting the marginal effect for each group.
Table 3.
Determinants of level of participation in the cassava value web.
The ordered probit model returned a likelihood ratio of −497.39, significant at 1%; implying that the overall model fit. Eight of the variables significantly explained the intensity of utilization of cassava by the smallholders. The coefficient of proportion of land allocated to cassava was positive and significant, implying that the probability of being in the high intensity cassava utilization group increased with proportion of land allocated to cassava. This is intuitively acceptable, since an expansion of land area planted to cassava may indicate an increase in the productive capacity of the smallholder and, hence, an expansion of the value adding opportunity for cassava. This is corroborated by the study of [40], where a preponderance of former smallholders had become medium-scale farmers through land expansion in Ghana and Zambia due to an increase in investment and biomass utilization. However, the effect of land on biomass utilization may be more sustainable with land intensification through investment in improved technologies of production and processing [41].
More experienced farmers were also more likely to increase utilization of cassava. The many contacts made and practices they may have learnt over the years are likely to influence the probability of taking up sustainable innovations [42]. Social capital was also found to significantly increase the probability of utilizing cassava by the smallholders. The effect of social capital is usually evident in the effect of group action in encouraging farmers to adopt sustainable practices and innovations such as proposed in our study [43].
Our results also showed that the probability of intensity of the utilization of cassava increases with income from the smallholder’s present holding. This may be due in part to the theory of ‘homo economy’, where farmers are assumed to be rational in decision making based on expected utility. However, it has been shown that farmers are not always rational and sociodemographic factors determine most investment decisions in the farm family [44]. Asset ownership was found to increase the probability of intensity of cassava utilization in the study area. Assets are wealth that can be converted into capital outlay, as corroborated by literature showing that asset ownership increased farmers’ investment decisions in expanding production processes [45]. Engaging in nonfarm activities was, however, found to reduce the probability of utilizing cassava. This may be because nonfarm activities move labor away from the farm, thereby reducing the capacity of the farm to add value and utilize cassava. This resonates with the findings of studies where nonfarm income activities may also reduce the capacity of the farm family in managing their whole farm holdings [46]. On the other hand, income from nonfarm activities have been found to be a source of funding capital for future investment in family farms’ productive activities [47].
Estimates of the marginal effects show the probability of being in any of the three cassava utilization groups for a unit change in exogenous variables. The results reveal that a unit increase in the land allocated to cassava significantly (5%) reduced the probability of households being in the LI group by up to 29%. However, a unit increase in land area allotted to cassava significantly (5%) increased the probability of participating in the MI and HI groups within the cassava biomass system by 15% and 14%, respectively. Increasing land resource allocations to cassava may imply expansion of the productive capacity of households’ holdings. Smallholders have been shown to have a smaller cultivated land area than large holders; consequently, their productivities, in terms of economies of scale, are reduced. Policies that make land easily accessible in rural areas and for longer periods encourage higher investments agricultural activities. Also, this may translate to increased output, for which the smallholders are consequently able to leverage on the different value addition options inherent in the cassava industry and hence increase revenue from cassava biomass [48].
Furthermore, a unit increase in the number of years of farming experience of the household head significantly (1%) reduced the probability of the household head being in the LI by 0.1%, while it significantly increased the probability of being in the MI and HI groups by 0.5%, respectively. The more experienced the entrepreneur, the more the household can leverage on established contacts, markets, trade routes, and information to increase revenue from the cassava system level of participation within the web. This follows the results of empirical studies which reveals that elderly farmers who intended to continue faming had higher outputs than younger farmers [49]. This suggests the importance of on-field training and lessons learnt in the course of the farmer’s years of experience coming in to play.
An increase in the asset index of households increased the probability of being in the HI group. The results show that a unit increase in the asset index of smallholders significantly increased the probability of being in the LI, MI, and HI groups by 18.6%, 9.6%, and 9.0%, respectively. Thus, asset ownership is probably a prerequisite for increased leverage in investing in agricultural activities with prospects of higher returns, especially with regards to accessing credit for expansion [50]. These assets are also important in the day to day activities of the smallholders, which if absent may reduce productive capacities. A unit increase in the income that accrues to the smallholders from their cassava-based activity also significantly (5%) reduced the probability of being in the LI group by 10.5%. However it increases the probability of being in MI by 1.6% and LI by 1.5%. This implies that present income may be an indicator of the extent of future income and thus economically rational actors will increase their production levels with the expectation of increased income [51].
The marginal effect for nonfarm activities revealed that employment in nonfarm activities increased the probability of being in the LI group, while it reduced the probability of being in the MI and HI groups. The implication of this is that nonfarm employment removes labor from the farm, thereby reducing the capacity of farming households to increase productive activities within the cassava system. However, low returns to agricultural activities is a factor that shifts labor away from agriculture, thereby encouraging participation in nonfarm activities to the detriment of increased participation in the agricultural system—which is evidence of structural change [52]. Social group membership was shown to reduce the probability of being in the LI by 0.9% and increase the probability of being in the MI by 0.5% and HI by 0.4%. This further shows the effect of social capital in increasing the probability of adopting best practices and innovation. This could be through availing credit facilities or supporting collective farmer decisions to invest and intensify productive activities on their holdings [53]. The coefficient of agroecological zone dummy (forest zone/Guinea savannah zone) showed that cassava smallholders in the Guinea savannah zone were more likely to be in the LI group, while those in the forest zone were more likely to be in the MI and HI groups. This may be because most processing activities in the cassava value chain in Nigeria are concentrated in the southern, forest zones of the country [54].
4. Conclusions and Policy Implications
The study examined the extent and determinants of cassava utilization as a precursor to increased value addition among smallholders in Nigeria. Findings revealed three distinct groups of cassava smallholders on the basis of utilization of cassava in low-level (LI), medium-level (MI), and high-level (HI) utilization groups. However, LI groups had the highest representation indicating a higher level of subsistence and low utilization of cassava among the farming households sampled. Households with higher levels of utilization (MI and HI) of cassava for food and nonfood products allocated more resources to cassava and obtained higher income from the cassava sector.
Overall, social capital, income, assets, land area cultivated, and farming experience were found to significantly determine the decision of the farming households for higher order cassava utilization. The probability of smallholders being in the LI increased by low land area cultivated, low level of asset ownership, nonmembership in social groups, and lack of access to improved cassava varieties as well as nonfarm income employment. The findings also revealed that variables that determined the probability of smallholders being in the MI and HI were similar in signs but different only in magnitude. Hence, the likelihood of being in the MI and HI increased with land area cultivated, farmer’s experience, asset ownership, and income and membership of social groups, while it reduced with uptake of nonfarm employment.
Our findings placed asset ownership and land area cultivated as factors that positively influenced the extent of utilization of cassava in value addition processes. This brings to the fore recommendations for institutions and enabling environment that would stimulate access to productive and physical assets needed by the farmers to be involved in value additions. Enabling land rights is also important in farmers’ decision to commit resources to greater utilization of cassava. Moreover, farmers that were members of social groups had a higher likelihood of higher utilization of cassava. We therefore recommend that positive group actions be encouraged among smallholder farmers through facilitating cooperatives, farmer associations, and providing interventions on a group basis, rather than creating policies that engender competitions and rural divisions.
Author Contributions
Conceptualization, T.A., P.A., A.A., V.O., and V.A.; Data Curation, T.A.; Formal Analysis, T.A.; Funding Acquisition, A.A.; Methodology, T.A. and V.A.; Project Administration, A.A. and V.O.; Resources, P.A. and A.A.; Supervision, P.A., A.A., V.O., V.A., and K.S.; Validation, P.A., A.A., V.O., V.A., and K.S.; Writing—Original Draft, T.A. and V.A.; Writing—Review & Editing, A.A., P.A., V.O., and V.A.
Funding
This research was funded by the German Federal Ministry of Education and Research (BMBF) and Ministry of Economic Cooperation and Research (BMZ), grant number FKZ 031 A258 A.
Acknowledgments
The authors acknowledge the contribution of the Federal Ministry of Education and Research (BMBF) and the German Federal Ministry for Economic Cooperation and Development (BMZ) “GlobE2-Global Food Security, Germany for providing the funding for this survey (through Contract number 8111240) to the International Institute of Tropical Agriculture (IITA) through the BiomassWeb Project. We also acknowledge the International Institute for Tropical Agriculture (IITA) for providing a research fellowship to Temitayo Adeyemo.
Conflicts of Interest
The authors declare no conflicts of interest.
Appendix A
Table A1.
Activities used to define intensity of utilization of cassava in the Nigerian cassava system.
Table A1.
Activities used to define intensity of utilization of cassava in the Nigerian cassava system.
| S/N | ITEM |
|---|---|
| 1 | Produce cassava for home consumption alone |
| 2 | Produce cassava both for home consumption and sale of cassava roots to processors |
| 3 | Process my cassava roots both for home consumption and market sales |
| 4 | Process cassava into garri |
| 5 | Process cassava into fufu |
| 6 | Process cassava into lafun |
| 7 | Process cassava into garri and fufu (or a mix of other products) |
| 8 | Process cassava into starch |
| 9 | Process cassava into high quality cassava flour |
| 10 | Sell cassava roots alone |
| 11 | Sell cassava roots and process for home consumption and market |
| 12 | Use cassava leaves and residue as manure and mulch on my farm |
| 13 | Have access to ready market for my high-quality cassava products |
References
- Devaney, L.A.; Henchion, M. If Opportunity Doesn’t Knock, Build a Door: Reflecting on a Bio-economy Policy Agenda for Ireland. Econ. Soc. Rev. 2017, 48, 207–229. [Google Scholar]
- Poku, A.; Birner, R.; Gupta, S. Is Africa Ready to Develop a Competitive Bioeconomy? The Case of the Cassava Value Web in Ghana. J. Clean. Prod. 2018, 200, 134–147. [Google Scholar] [CrossRef]
- Virchow, D.; Beuchelt, T.; Denich, M.; Loos, T.K.; Hoppe, M.; Kuhn, A. The Value Web Approach. Rural Focus 2014, 3, 16–18. [Google Scholar]
- Batidzirai, B.; Valk, M.; Wicke, B.; Junginger, M.; Daioglou, V.; Euler, W.; Faaij, A.P.C. Current and future technical, economic and environmental feasibility of maize and wheat residues supply for biomass energy application: Illustrated for South Africa. Biomass Bioenergy 2016, 92, 106–129. [Google Scholar] [CrossRef]
- Virchow, D.; Beuchelt, T.D.; Kuhn, A.; Denich, M. Biomass-Based Value Webs: A Novel Perspectives for Emerging Bio-economies in Sub-Saharan Africa. In Technological and Institutional Innovations for Marginalized Smallholders in Agricultural Development; Gatzweiker, F.W., von Braun, J., Eds.; Springer: Berlin/Heidelberg, Germany, 2016. [Google Scholar] [CrossRef]
- Loos, T.; Hoppe, M.; Dzomeku, B.; Scheiterle, L. The Potential of Plantain Residues for the Ghanaian Bioeconomy—Assessing the Current Fiber Value Web. Sustainability 2018, 10, 4825. [Google Scholar] [CrossRef]
- Rípoli, T.C.C.; Molina, W.F., Jr.; Rípoli, M.L.C. Energy potential of sugar cane biomass in Brazil. Sci. Agric. 2000, 57, 677–681. [Google Scholar] [CrossRef]
- Asibey, M.O.; Yeboah, V.; Adabor, E.K. Palm biomass waste as supplementary source of electricity generation in Ghana: Case of the Juaben Oil Mills. Energy Environ. 2018, 29, 165–183. [Google Scholar] [CrossRef]
- Liu, Z.; Xu, A.; Long, B. Energy from combustion of rice straw: Status and challenges to China. Energy Power Eng. 2011, 3, 325–331. [Google Scholar] [CrossRef]
- Scheiterle, L.; Ulmer, A.; Birner, R.; Pyka, A. From Value Chains to Biomass-Based Value Webs: The Case of Sugarcane in Brazil’s Economy. J. Clean. Prod. 2018, 172, 3851–3863. [Google Scholar] [CrossRef]
- Nweke, F.; Haggblade, S.; Zulu, B. Building on Successes in African Agriculture Recent Growth in African Cassava; International Food Policy Research Institute (IFPRI): Washington, DC, USA, 2004. [Google Scholar]
- Allem, A.C. The origins and taxonomy of cassava. In Cassava: Biology, Production and Utilization; Hillocks, R.J., Thresh, J.M., Belloti, A.C., Eds.; CAB international: Wallingford, UK, 2002; Volume 1, pp. 1–16. [Google Scholar]
- Zvinavashe, E.; Elbersen, H.W.; Slingerland, M.; Kolijn, S.; Sanders, J.P. Cassava for food and energy: Exploring potential benefits of processing of cassava into cassava flour and bioenergy at farmstead and community levels in rural Mozambique. Biofuels Bioprod. Biorefin. 2011, 5, 151–164. [Google Scholar] [CrossRef]
- Marx, S.; Nquma, T.Y. Cassava as feedstock for ethanol production in South Africa. Afr. J. Biotechnol. 2013, 12, 4975–4983. [Google Scholar]
- Food and Agricultural Orgnization (FAO). Cassava Outlook in Nigeria. 2018. Available online: http://www.fao.org (accessed on 4 September 2018).
- Montagnac, J.; Davis, C.; Tanumihardjo, S. Nutritional value of cassava for use as a staple food and recent advances for improvement. Compr. Rev. Food Sci. Food Saf. 2009, 8, 181–194. [Google Scholar] [CrossRef]
- Ehinmowo, O.; Ojo, S. Analysis of Technical Efficiency of Cassava Processing Methods among Small Scale Processors in South-West Nigeria. Am. J. Rural Dev. 2014, 2, 20–23. [Google Scholar]
- Aminu, F.; Rosulu, H.; Toku, A.; Dinyo, O.; Akhigbe, E. Technical Efficiency in Value Addition to Cassava: A Case of Cassava-Garri Processing in Lagos State, Nigeria. J. Agric. Sustain. 2017, 10, 97–115. [Google Scholar]
- Poole, N. Smallholder Agriculture and Market Participation; Practical Action Publishing: Warwickshire, UK, 2017. [Google Scholar] [CrossRef]
- Federal Ministry of Agriculture and Rural Development (FMARD). Agricultural Promotion Policy (2016–2020): Building on the Successes of the ATA, Closing Key Gaps; Federal Ministry of Agriculture and Rural Development Policy and Strategy Document: Abuja, Nigeria, 2016.
- Bank of Industry (BOI). Cassava Bread Fund. Available online: https://www.boi.ng/cassava-bread-fund/ (accessed on 24 September 2018.).
- Rahman, S.; Awerije, B.O. Exploring the potential of cassava in promoting agricultural growth in Nigeria. J. Agric. Rural Dev. Trop. Subtrop. (JARTS) 2016, 117, 149–163. [Google Scholar]
- Jerumeh, T.R.; Omonona, B.T. Determinants of transition in farm size among cassava-based farmers in Nigeria. Kasetsart J. Soc. Sci. 2018, in press. [Google Scholar] [CrossRef]
- World Bank 2017. Rural Population. World Development Indicators (WDI). Available online: http://www.worldbank.org (accessed on 30 May 2017).
- StataCorp. Stata: Release 13. Statistical Software; StataCorp LP: College Station, TX, USA, 2013. [Google Scholar]
- Jackman, S. Models for ordered outcomes. Political Sci. C 2000, 200, 1–20. [Google Scholar]
- Greene, W.H.; Hensher, D.A. Modeling Ordered Choices: A Primer; Cambridge University Press: Cambridge, UK, 2010. [Google Scholar]
- Zmuk, B. Quality of life indicators in selected European countries Hierarchical Cluster Analysis Approach. Croat. Rev. Econ. Bus. Soc. Stat. (CREBSS) 2015, 1, 42–54. [Google Scholar] [CrossRef]
- Yim, O.; Randeem, K. Hierarchical Cluster Analysis: Comparison of three linkage measure and application to psychological data. Quant. Methods Psychol. 2015, 11, 8–21. [Google Scholar] [CrossRef]
- Restuccia, D. Resource Allocation and Productivity in Agriculture. Plenary Panel on ‘Agricultural Policy in Africa’ at the Centre for the Study of African Economics (CSAE). Available online: https://www. economics. utoronto. ca/diegor/research/Restuccia_ResAlloc_Oxford. Pdf (accessed on 11 December 2017).
- Akaakohol, M.A.; Aye, G.C. Diversification and farm household welfare in Makurdi, Benue State, Nigeria. Dev. Stud. Res. Open Access J. 2014, 1, 168–175. [Google Scholar] [CrossRef]
- Onyenwonke, C.; Simonya, K.J. Cassava Post-harvest Processing and Storage in Nigeria: A Review. Afr. J. Agric. Res. 2014, 9, 3853–3863. [Google Scholar]
- Ojogho, O. Determinants of Food Security among Arable Farmers in Edo State, Nigeria. Medwell Agric. J. 2010, 5, 151–156. [Google Scholar]
- Gyau, A.; Franzel, S.; Chiatoh, M.; Nimino, G.; Owusu, K. Collective action to improve market access for smallholder producers of agroforestry products: Key lessons learned with insights from Cameroon’s experience. Cur. Opin. Environ. Sustain. 2014, 6, 68–72. [Google Scholar] [CrossRef]
- Huffman, W.E. Human capital: Education and agriculture. In Handbook of Agricultural Economics, 1st ed.; Bruce, L.G., Gordon, C.R., Eds.; Elsevier Science: Amsterdam, The Nertherlands, 2001. [Google Scholar]
- Awotide, B.A.; Diagne, A.; Omonona, B.T. Impact of Improved Agricultural Technology Adoption on Sustainable Rice Productivity and Rural Farmers’ Welfare in Nigeria: A Local Average Treatment Effect (LATE) Technique’. In Proceedings of the African Economic Conference, Kigali, Rwanda, 30 October–2 November 2012. [Google Scholar]
- Liverpool-Tasie, L.S.; Kuku, O.; Ajibola, A. Review of literature on agricultural productivity, social capital and food security in Nigeria. In NSSP Working Paper; International Food Policy Research Institute (IFPRI): Washington, DC, USA, 2011; Available online: http://ebrary.ifpri.org/cdm/ref/collection/p15738coll2/id/126846 (accessed on 9 July 2018).
- Iddrisu, A.; Ansah, I.G.K.; Nkegbe, P.K. Effect of input credit on smallholder farmers’ output and income: Evidence from Northern Ghana. Agric. Financ. Rev. 2018, 78, 98–115. [Google Scholar] [CrossRef]
- Williams, R. Ordinal Regression Models: Problems, Solutions and Problems with Solutions’. In Proceedings of the German Stata User Group Meeting, Notre-Dame Sociology, South Bay, IL, USA, 20 June 2008. [Google Scholar]
- Jayne, T.S.; Chapoto, A.; Sitko, N.; Nkonde, C.; Muyanga, M.; Chamberlin, J. Is the scramble for land in Africa foreclosing a smallholder agricultural expansion strategy? J. Int. Aff. 2014, 67, 35–53. [Google Scholar]
- Chapoto, A.; Mabiso, A.; Bonsu, A. Agricultural Commercialization, Land Expansion, and Home-Grown Large-Scale Farmers: Insights from Ghana; International Food Policy Reseach Institute: Washington, DC, USA, 2013. [Google Scholar]
- Ainembabazi, J.; Mugisha, J. The Role of Farming Experience on the Adoption of Agricultural Technologies: Evidence from Smallholder Farmers in Uganda. J. Dev. Stud. 2014, 50, 666–679. [Google Scholar] [CrossRef]
- Munasib, A.B.; Jordan, J.L. The effect of social capital on the choice to use sustainable agricultural practices. J. Agric. Appl. Econ. 2011, 43, 213–227. [Google Scholar] [CrossRef]
- Schwarze, J.; Holst, G.S.; Mußhoff, O. Do farmers act like perfectly rational profit maximisers? Results of an extra-laboratory experiment. Int. J. Agric. Manag. 2014, 4, 11–20. [Google Scholar]
- Quisumbing, A.R.; Rubin, D.; Manfre, C.; Waithanji, E.; van den Bold, M.; Olney, D.; Meinzen-Dick, R. Gender, assets, and market-oriented agriculture: Learning from high-value crop and livestock projects in Africa and Asia. Agric. Hum. Values 2015, 32, 705–725. [Google Scholar] [CrossRef]
- Nasir, M.; Hundie, B. The Effect of Off Farm Employment on Agricultural Production and Productivity: Evidence from Gurage Zone of Southern Ethiopia. J. Econ. Sust. Dev. 2014, 5, 85–98. [Google Scholar]
- Lanjouw, J.; Lanjouw, P. The Rural Non-Farm Sector: Issues and Evidence from Developing Countries. Agric. Econ. 2001, 26, 1–23. [Google Scholar] [CrossRef]
- Hichaambwa, M.; Chamberlain, J.; Sitko, N. Determinants and Welfare Effects of Smallholder Participation in Horticultural Markets in Zambia. Afr. J. Agric. Resour. Econ. 2015, 10, 279–296. [Google Scholar]
- Guo, G.; Wen, Q.; Zhu, J. The Impact of Aging Agricultural Labor Population on Farmland Output: From the Perspectives of Farmer Preferences. Math. Probl. Eng. 2015, 2015, 7. [Google Scholar] [CrossRef]
- Johnson, N.L.; Kovarik, C.; Meinzen-Dick, R.; Njuki, J.; Quisumbing, A. Gender, assets, and agricultural development: Lessons from eight projects. World Dev. 2016, 83, 295–311. [Google Scholar] [CrossRef] [PubMed]
- Samson, G.S.; Gardebroek, C.; Jongeneel, R.A. Explaining production expansion decisions of Dutch dairy farmers. NJAS Wagening. J. Life Sci. 2016, 76, 87–98. [Google Scholar] [CrossRef]
- McCullough, E.B. Labor productivity and employment gaps in Sub-Saharan Africa. Food Policy 2015, 67, 133–152. [Google Scholar] [CrossRef]
- Michelini, J.J. Small farmers and social capital in development projects: Lessons from failures in Argentina’s rural periphery. J. Rural Stud. 2013, 30, 99–109. [Google Scholar] [CrossRef]
- Echebiri, R.N.; Edaba, M.E.I. Production and Utilization of Cassava in Nigeria: Prospect for Food Security and Infant Nutrition. Prod. Agric. Technol. 2008, 4, 38–52. [Google Scholar]
© 2019 by the authors. Licensee MDPI, Basel, Switzerland. This article is an open access article distributed under the terms and conditions of the Creative Commons Attribution (CC BY) license (http://creativecommons.org/licenses/by/4.0/).