Article

Comprehensive Assessment of Water Footprints and Water Scarcity Pressure for Main Crops in Shandong Province, China

1
College of Geomatics, Shandong University of Science and Technology, Qingdao 266590, China
2
College of Science and Information, Qingdao Agricultural University, Qingdao 266109, China
3
Hebei Institute of Water Science, Shijiazhuang 050057, China
4
College of Agronomy, Qingdao Agricultural University, Qingdao 266109, China
*
Authors to whom correspondence should be addressed.
These authors contributed equally to this work.
Sustainability 2019, 11(7), 1856; https://doi.org/10.3390/su11071856
Submission received: 31 January 2019 / Revised: 21 March 2019 / Accepted: 23 March 2019 / Published: 28 March 2019

Abstract

:
Rapid economic development has posed pressure on water resources, and the potential for a water crisis has become an important obstacle to the sustainable development of society. Water footprint theory and its applications in agriculture provide an important strategic basis for the rational utilization and sustainable development of water resources. Based on the monthly meteorological observations and agricultural data of Shandong Province, CROPWAT 8.0 and Geographic Information System (GIS) technology, the green, blue and grey water footprints of wheat, maize, cotton and groundnut from 1989 to 2016 were calculated and the spatial variations of water footprints for crops in different rainfall years were analyzed. Additionally, assessment of water stress for agricultural productions was conducted in this study. The results showed that the average water footprints of wheat, maize, cotton and groundnut were 2.02 m3/kg, 1.24 m3/kg, 7.29 m3/kg and 1.75 m3/kg, respectively in Shandong Province. A large amount of the average total water footprint was calculated for wheat (420.59 × 10⁸ m3/yr), maize (222.16 × 10⁸ m3/yr), cotton (72.70 × 10⁸ m3/yr) and groundnut (50.07 × 10⁸ m3/yr). The average total water footprint of the four crops was 765.52 × 10⁸ m3/yr (29.98% blue) and exhibited a gradual decreasing trend over time. Specifically, the total water footprint of wheat was the highest among four main crops in Shandong Province and exhibited a decreasing trend during 1989–2016. The maize was ranked in the second place, and was the only crop still increasing rapidly. The spatial and temporal changes of water footprints for crops were obvious in different rainfall years. Additionally, agricultural productions in most regions were facing the threat of water scarcity. Therefore, the scientific planning of crop planting structures and rational control of sown areas of crops with large water footprints should be implemented in severely water-scarce regions. This study can give some suggestions on the adjustment of planting structure for the sustainable development of agriculture and the realization of efficient utilization of water resources.

1. Introduction

Water is a key element to human sustenance and socioeconomic activities [1]. However, water scarcity is one of the major problems facing many societies across the world [2]. More than 2.3 billion people will live in severely water-stressed environment by the year 2050 [3]. In order to alleviate the shortage of water resources, the concept of water footprint (WF) [4] was proposed to quantify water resources used. The water footprint founded on the concept of “virtual water, VW” [2] is recognized as a suitable indicator of human occupying freshwater resources and is becoming widely applied to get better awareness of sustainable water use [5,6]. The WF of crop production is the total amount of freshwater that is consumed and used for diluting pollutants during the crop growing process, and it includes green, blue and grey WFs [2,7,8].
WFs within the agricultural sector have been extensively studied. Most studies were mainly focusing on the WF of crop production, at scales from an irrigation district [9,10,11], a city level region [11,12,13,14,15,16,17], a river basin [12,18,19,20,21,22], and a country [23,24,25,26,27,28,29,30], to the global perspective [31,32,33,34,35]. Among previous studies, Gobin et al. [36] conducted a calibrated model on wheat, barley, grain maize, oilseed rape, potato and sugar beet. They found that the WF of cereals could be up to 20 times larger than the WF of tuber and root crops; the largest share was attributed to the green WF. Chapagain et al. [37] assessed the water footprint of worldwide cotton consumption. The worldwide consumption of cotton products demanded 256 Gm3 water per year, out of which about 42% was blue WF, 39% green WF and 19% dilution WF. Chen et al. [38] utilized an interregional input-output model to estimate the WF of each province in China and to quantify the inter-provincial transfer of virtual water. The results showed that provinces with larger populations and greater Gross Domestic Product (GDP) had larger WFs, and developed regions had higher proportions of external WFs. Landon and Megan [39] analyzed drought impacts on the WF from pre-drought conditions (2011) through three years of exceptional drought (2012–2014). The results indicated that drought may strengthen the telecoupling between groundwater withdrawals and distant consumers of agricultural commodities. WF is now mostly being studied at country-level and calculated using average annual climate data provided by FAO’s CLIMWAT database.
Agricultural water use varies widely from country to country. At the global scale, it is responsible for about 70% of the human water use [40]. In China, agricultural water use is about 3770 × 108 m3, accounting for 62.32% of the total water consumption [41]. Shandong Province is one of the major agricultural provinces in China. However, water scarcity is a long-standing and widespread problem in this region, and available water resources per capita volume in Shandong are only 334 m3, which is less than 1/6 of China’s average [42]. At the same time, rapid population growth and increasing agricultural activities have greatly increased water demand for agricultural productions recently. Therefore, it makes Shandong Province a good test-bed for comprehensive assessment of water footprint and water scarcity pressure for main crops.
In this study, we adopted the monthly climate data for each year from 22 meteorological stations during 1989–2016 in Shandong Province to accurately calculate WFs of crops and to analyze the spatiotemporal variation characteristics of WFs for wheat, maize, cotton and groundnut in different rainfall years. Therefore, the primary objectives of this study are: (1) to comprehensively assess the green, blue, grey and total WFs in the period of 1989–2016; and (2) to estimate the pressure of water scarcity on agriculture productions by combining with blue water pressure index (WPIblue), then to provide valuable suggestions for adjustment of production layout to reduce agricultural water use in Shandong Province. The results of this present study will provide a baseline for the sustainable use of water resources in this typical water scarce region.

2. Materials and Methods
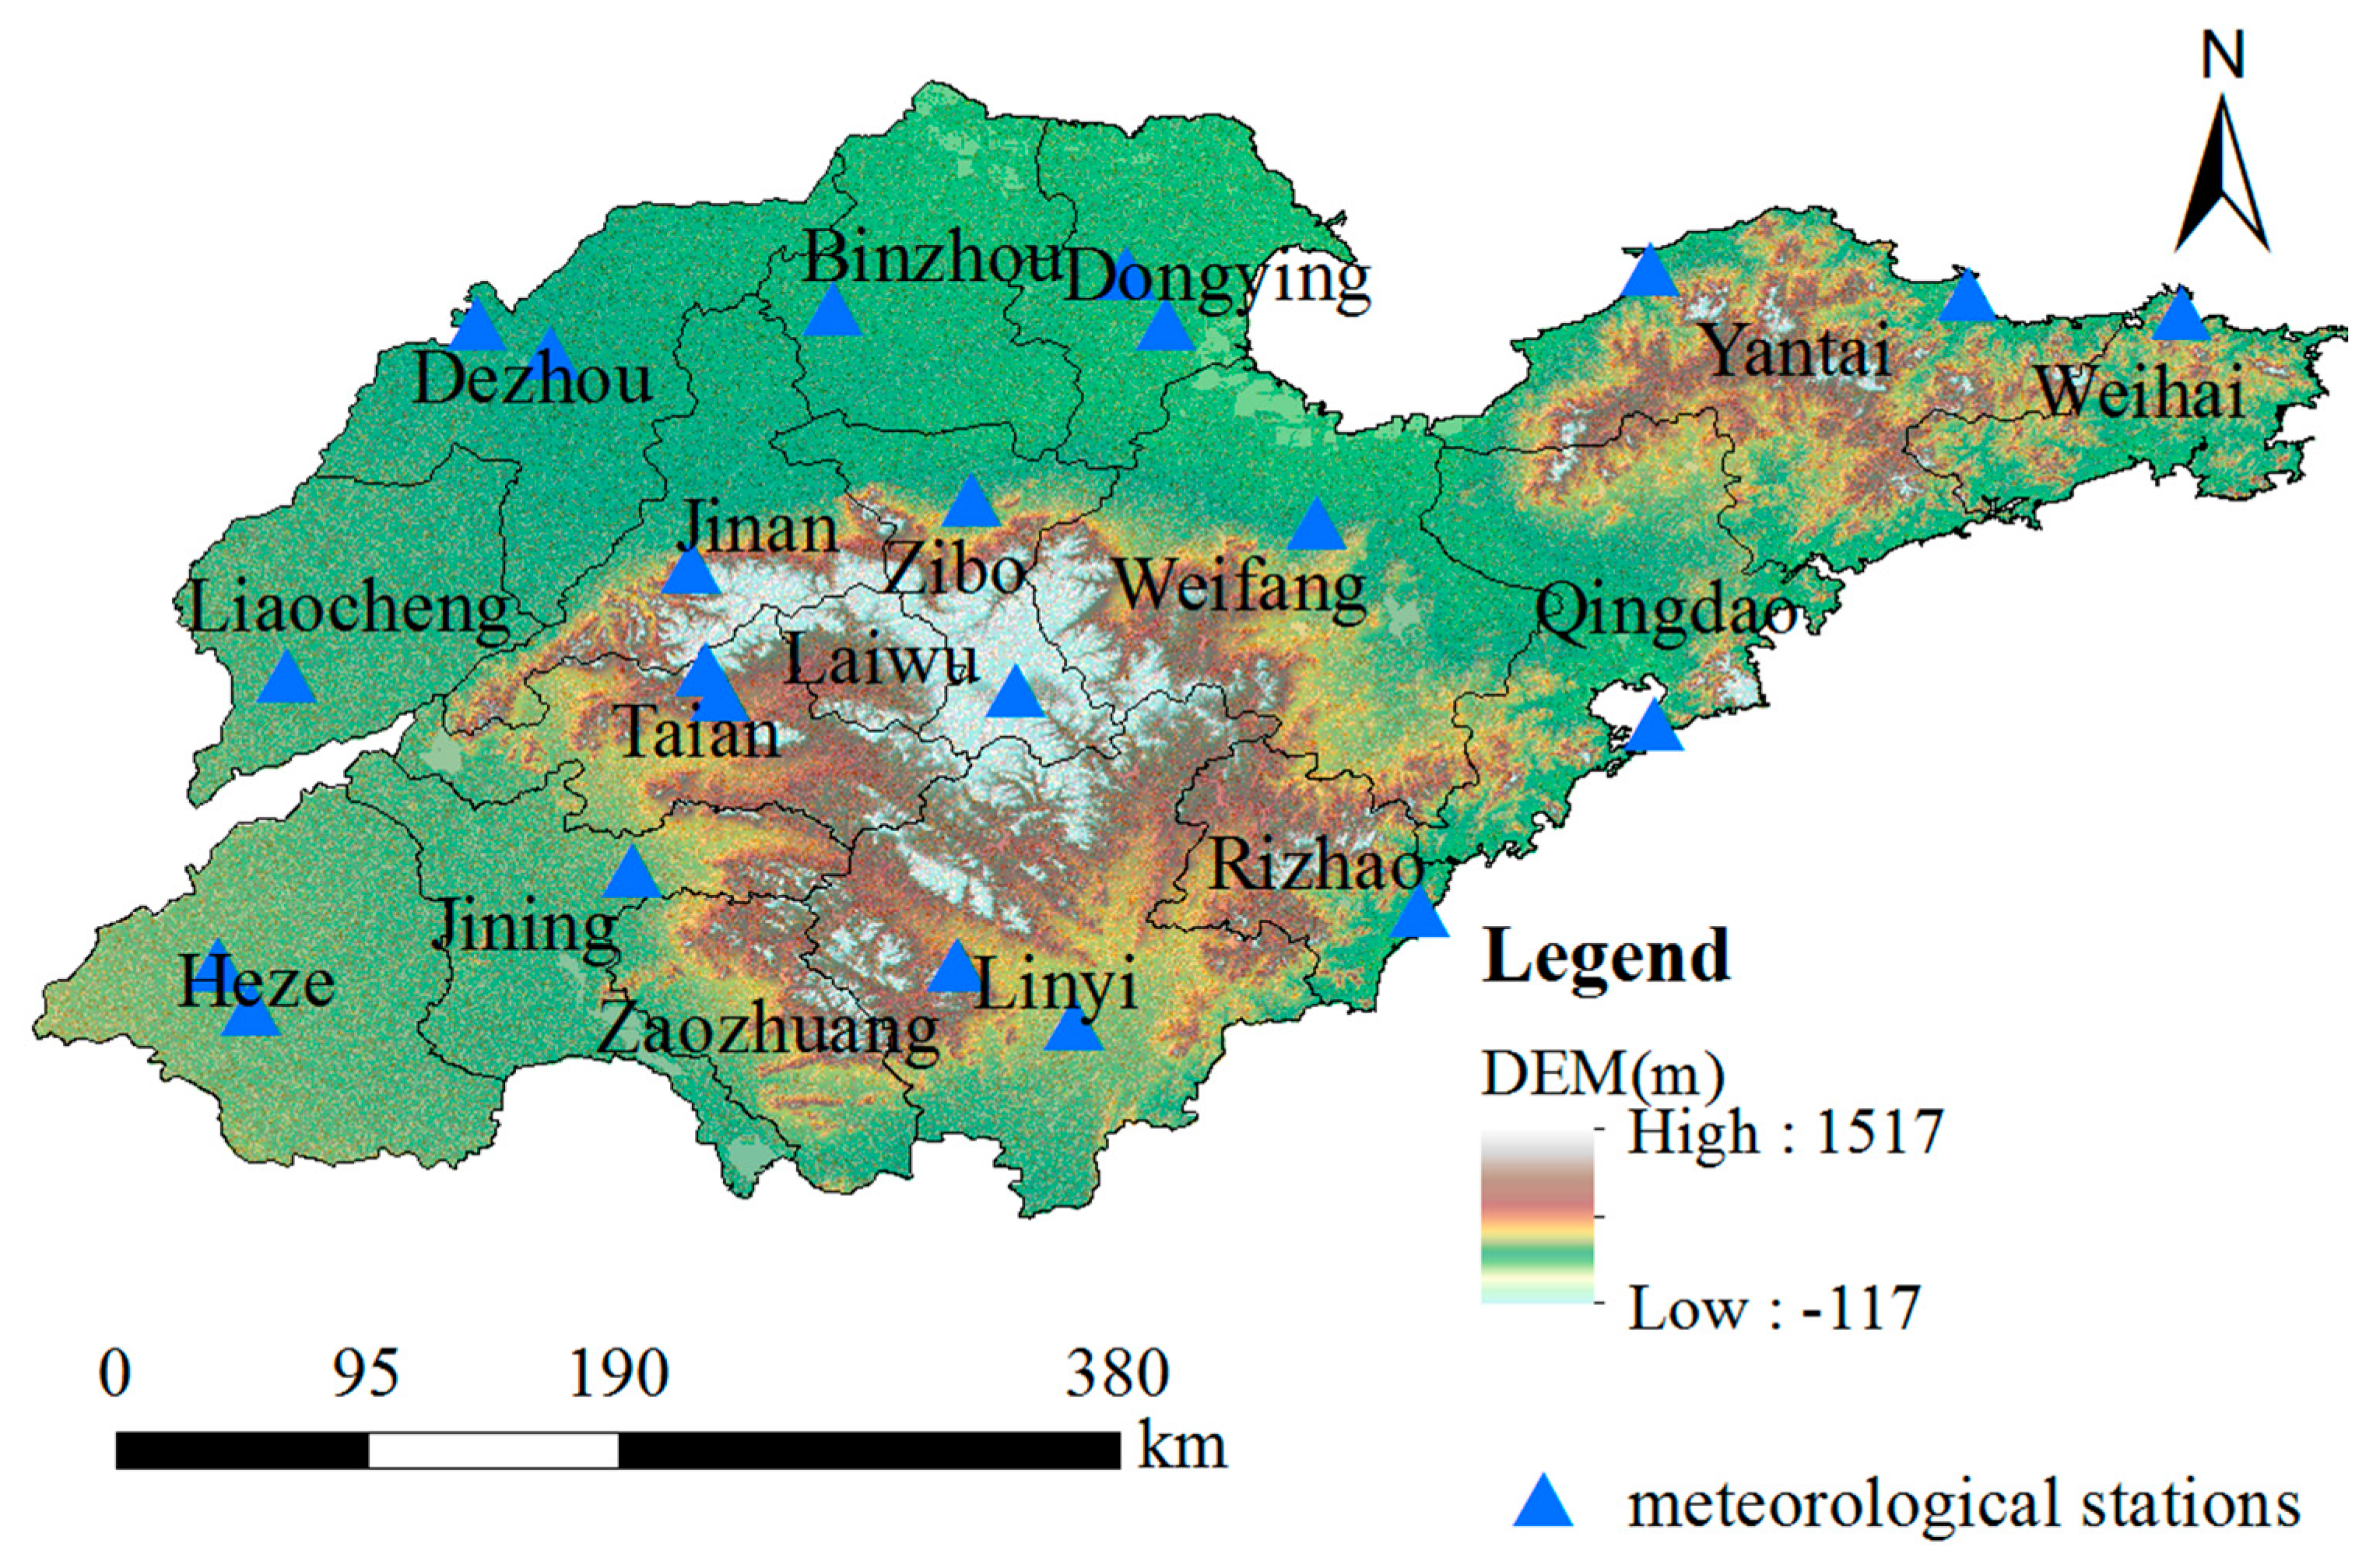
2.1. Study Area

Shandong Province is located in eastern China (34°22.9′–38°24.01′ N, 114°47.5′–122°42.3′ E) and is divided into 17 prefecture-level regions (Figure 1). This province has a warm temperate monsoon climate. The annual mean temperature is 11.2–14.4 °C [43]. The average annual precipitation is 550–950 mm, of which summer rain contributes more, and decreases gradually from southeast to northwest across the province [44]. In this study, the WFs of four kinds of main crops which were the most widely planted crops in Shandong Province, namely, wheat, maize, cotton and groundnut, were analyzed.
Using the average annual precipitation of 679.5 mm in Shandong Province as a baseline [45], years in which precipitation was >20% higher were humid years, years in which precipitation was >20% lower were drought years, and years in which precipitation was higher or lower within 10% were normal years [46]. According to the precipitation characteristics and the available data sources for WF calculation, years 1990 (934.9 mm), 2002 (417.4 mm), and 2016 (693.9 mm) were categorized as humid, drought and normal years respectively (Figure 2).

2.2. Data

The data used to calculate the WF values for crops growth included meteorological observations and agricultural data. The meteorological observations of different regions during 1989–2016 were obtained from the National Meteorological Information Center of China Meteorological Administration [47], including the monthly average max and min temperature, relative humidity, wind speed, sun hours and precipitation. We selected data from 22 meteorological stations to calculate WF, and selected one for each region. When the meteorological data was incomplete in a region, it was supplemented by the observations of nearby meteorological station. If there was no meteorological station in one region, the meteorological data from a nearby region was selected for calculation. The sown areas, yields and consumption of chemical fertilizers for four main crops were obtained from field investigations, literatures, and Shandong Statistical Yearbook (1990–2017) [48]. Crops growth periods were derived from FAO’s crops database [49]. Water resources data obtained from Shandong Province Water Resources Bulletin were also used to estimate the pressure of water scarcity on agriculture productions [45].

2.3. Methods

WF of a crop production, defined as the ratio of the crop water requirement to crop yield, was calculated based on the framework from Chapagain and Hoekstra (Figure 3) [8]. The yield considers an average quantity of crop produced over the full life span of the crop. WF consists of three components: green (WFgreen, rainwater), blue (WFblue, irrigation water) and grey (WFgrey, freshwater pollution in the production process) [23,37]. The value of WF is the sum of WFgreen, WFblue and WFgrey [46]:
WF = WFgreen + WFblue + WFgrey
where WF is the water footprint of crop production (m3/kg); WFgreen is the green water footprint (m3/kg); WFblue is the blue water footprint (m3/kg) and WFgrey is the grey water footprint (m3/kg).
WFgreen and WFblue are computed as follows:
WFgreen = 10 × ETgreen/Y
WFblue = 10 × ETblue/Y
where ETgreen is WFgreen evapotranspiration (mm); ETblue is WFblue evapotranspiration (mm); Y is the crop yield (kg/ha) and the factor of 10 converts water depth (mm) into water volume per area (m3/ha).
WFgrey is calculated as follows [7]:
WFgrey = [(α × AR)/(cmax − cnat)]/Y
where AR is the rate of chemical application to the field per hectare (kg/ha); α is the leaching run-off fraction; cmax is the maximum acceptable concentration (10 mg/L) and cnat is the concentration in natural water, assumed to be 0 mg/L [7,50].
The volume of polluted water depends on both the pollutant load and the adopted permissible limit [46]. Considering the availability of local data, this study selected nitrogen as a representative pollutant, and it was assumed that the nitrogen fraction that reached free flowing water bodies through leaching or runoff equaled 25% of the application rate [51].
Subsequently, green and blue ETs are calculated as follows:
ETgreen = min (ETc, Peff)
ETblue = max (0, ETc − Peff)
where ETc is daily crop evapotranspiration (mm); Peff is the effective precipitation over the crop growing period (mm), which is estimated by USDA S.C. Method [49].
Next, daily reference evapotranspiration (ET0) is multiplied by the crop coefficient (Kc) during the corresponding periods which are obtained from CROPWAT 8.0 to calculate the daily evapotranspiration of crop (ETc) [46]:
ETc = Kc × ET
Finally, daily reference evapotranspiration is calculated by using the software CROPWAT 8.0 [49] based on the Penman–Monteith model [52]:
ET0 = [0.408∆ (Rn − G) + γ900(ea − ed)]/(T + 273)}/[∆ + γ (1 + 0.34U2)]
where ET0 is reference crop evapotranspiration (mm/d); Rn is the daily net radiation (MJ/m2/d); G is the daily soil heat flux (MJ/m2/d); T is the daily mean temperature (°C); U2 is the daily wind speed at 2 m height (m/s); ea is the saturation vapor pressure per day (kPa); ed is the actual vapor pressure per day (kPa); Δ is the slope of the saturation vapor pressure versus air temperature curve (kPa/°C) and γ is the hygrometer constant (kPa/°C).

3. Results

3.1. Temporal Changes of WF for Main Crops

3.1.1. Temporal Change of WF for Wheat

Wheat is the main crop in Shandong Province. The sown area was about 35% of the total area of crops in 2016 [48]. Over the period of 1989–2016, the average WF for wheat production was 2.02 m3/kg in Shandong Province, and WFgreen, WFblue and WFgrey contributed 14.85%, 36.14% and 49.01%, respectively. In the humid year of 1990, the WF was 2.58 m3/kg, which was the highest during the study period, with the WFgreen, WFblue and WFgrey accounting for 20.40%, 29.10% and 50.50%, respectively. In the drought year of 2002, the WF was 2.50 m3/kg, comprising 12.92% WFgreen, 37.64% WFblue, and 49.44% WFgrey. Finally, in the normal year of 2016, the WF was 1.50 m3/kg, consisting of 17.56% WFgreen, 39.91% WFblue and 42.53% WFgrey.
Less rainfall resulted in more irrigation (WFblue), while more rainfall resulted in more WFgreen. Therefore, the WFblue and WFgreen were the highest in the drought year of 1989 and the humid year of 1990, repectively. The WFblue and WFgreen were the lowest in 2003 and 2010. Besides, the WFgrey was the lowest in 2015 and highest in 1993. The WFblue and WFgrey reduced obviously, while WFgreen decreased slowly (Figure 4a). The WFblue and WFgrey of wheat decreased from 1.14 m3/kg and 1.29 m3/kg in 1989 to 0.60 m3/kg and 0.64 m3/kg in 2016, respectively. The sharp reduction of the WFs was a result of improved wheat yields. Meanwhile, the WFgrey of wheat fell due to the efficient use of fertilizers.

3.1.2. Temporal Change of WF for Maize

Maize, with a sown area of about 29% of the total area of crops in 2016, is the second major crop in Shandong Province [48]. In the period of 1989–2016, the average WF for maize production was 1.24 m3/kg in Shandong Province, and WFgreen, WFblue and WFgrey contributed 28.22%, 20.91% and 50.87%, respectively. In the humid year of 1990, the WF was 1.38 m3/kg, with the WFgreen, WFblue and WFgrey accounting for 35.77%, 20.81% and 43.42% respectively. In the drought year of 2002, the WF was 1.54 m3/kg, comprising 17.26% WFgreen, 31.96% WFblue and 50.78% WFgrey. Finally, in the normal year of 2016, the WF was 1.13 m3/kg, consisting of 30.11% WFgreen, 19.36% WFblue and 50.53% WFgrey.
The WFgreen was the highest in 1990. The WFblue and WFgrey were the highest in 1997 during the 28 years. The WFblue and WFgreen were the lowest in 2003 and 2013. In addition, the WFgrey was the lowest in 2011. There was a clear decreasing tendency in the WFblue over time while the WFgreen and WFgrey were reducing gradually in the study period (Figure 4b). The WFblue of maize decreased from 0.50 m3/kg in 1989 to 0.22 m3/kg in 2016.

3.1.3. Temporal Change of WF for Cotton

Cotton is a major economic crop in Shandong Province. The sown area was about 4% of the total area of crops in 2016 [48]. In general, cotton needs a lot of water during the growing season. Therefore, the adjustment of planting structure and improvement of irrigation technology are helpful to save water. During the period of 1989–2016, the average WF for cotton production was 7.29 m3/kg in Shandong Province, and WFgreen, WFblue and WFgrey contributed 50.00%, 35.48% and 14.52%, respectively. In the humid year of 1990, the WF was 9.68 m3/kg, with the WFgreen, WFblue and WFgrey accounting for 56.50%, 25.23% and 18.27%, respectively. In the drought year of 2002, the WF was 6.79 m3/kg, comprising 31.60% WFgreen, 55.16% WFblue and 13.24% WFgrey. Finally, in the normal year of 2016, the WF was 4.49 m3/kg, consisting of 61.76% WFgreen, 31.00% WFblue and 7.24% WFgrey.
The overall results indicated that the highest WFgreen was 6.13 m3/kg in 1994. The highest WFblue was 7.26 m3/kg and WFgrey was 3.58 m3/kg in 1992. The trends of WFgreen, WFblue and WFgrey all decreased from 1989 to 2016 due to the increase in yields (Figure 4c). The WFgreen and WFblue of cotton decreased from 2.92 m3/kg and 5.14 m3/kg in 1989 to 2.77 m3/kg and 1.39 m3/kg in 2016, respectively.

3.1.4. Temporal Change of WF for Groundnut

Groundnut is one of the main economic crops in Shandong Province. And the sown area was about 7% of the total area of crops in 2016 [48]. Over the period of 1989–2016, the average WF for groundnut production was 1.75 m3/kg in Shandong Province, and WFgreen, WFblue and WFgrey contributed 54.47%, 31.21% and 14.32%, respectively. If the 28 years were divided into three periods: period I (1989–1998), period II (1999–2008) and period III (2009–2016), the average WFgreen was approximately 1.13 m3/kg, 0.90 m3/kg and 0.79 m3/kg, respectively, for the three periods. Due to the higher effective rainfall in period I, the average WFgreen in period I was greater than that in period III. The average WFblue of groundnut was 0.75 m3/kg, 0.46 m3/kg and 0.40 m3/kg in period I, period II and period III, respectively. And WFblue in period I was 1.88 times greater than that in period III. The average WFgrey of groundnut was 0.26 m3/kg, 0.31 m3/kg and 0.17 m3/kg in period I, period II and period III, respectively. The WFgrey in period I was 1.53 times greater than that of period III. Figure 4d showed that the decline in the value of WFgreen and WFblue was greater than that of WFgrey. The WFgreen and WFblue of groundnut decreased from 1.12 m3/kg and 1.60 m3/kg in 1989 to 0.87 m3/kg and 0.33 m3/kg in 2016 respectively.

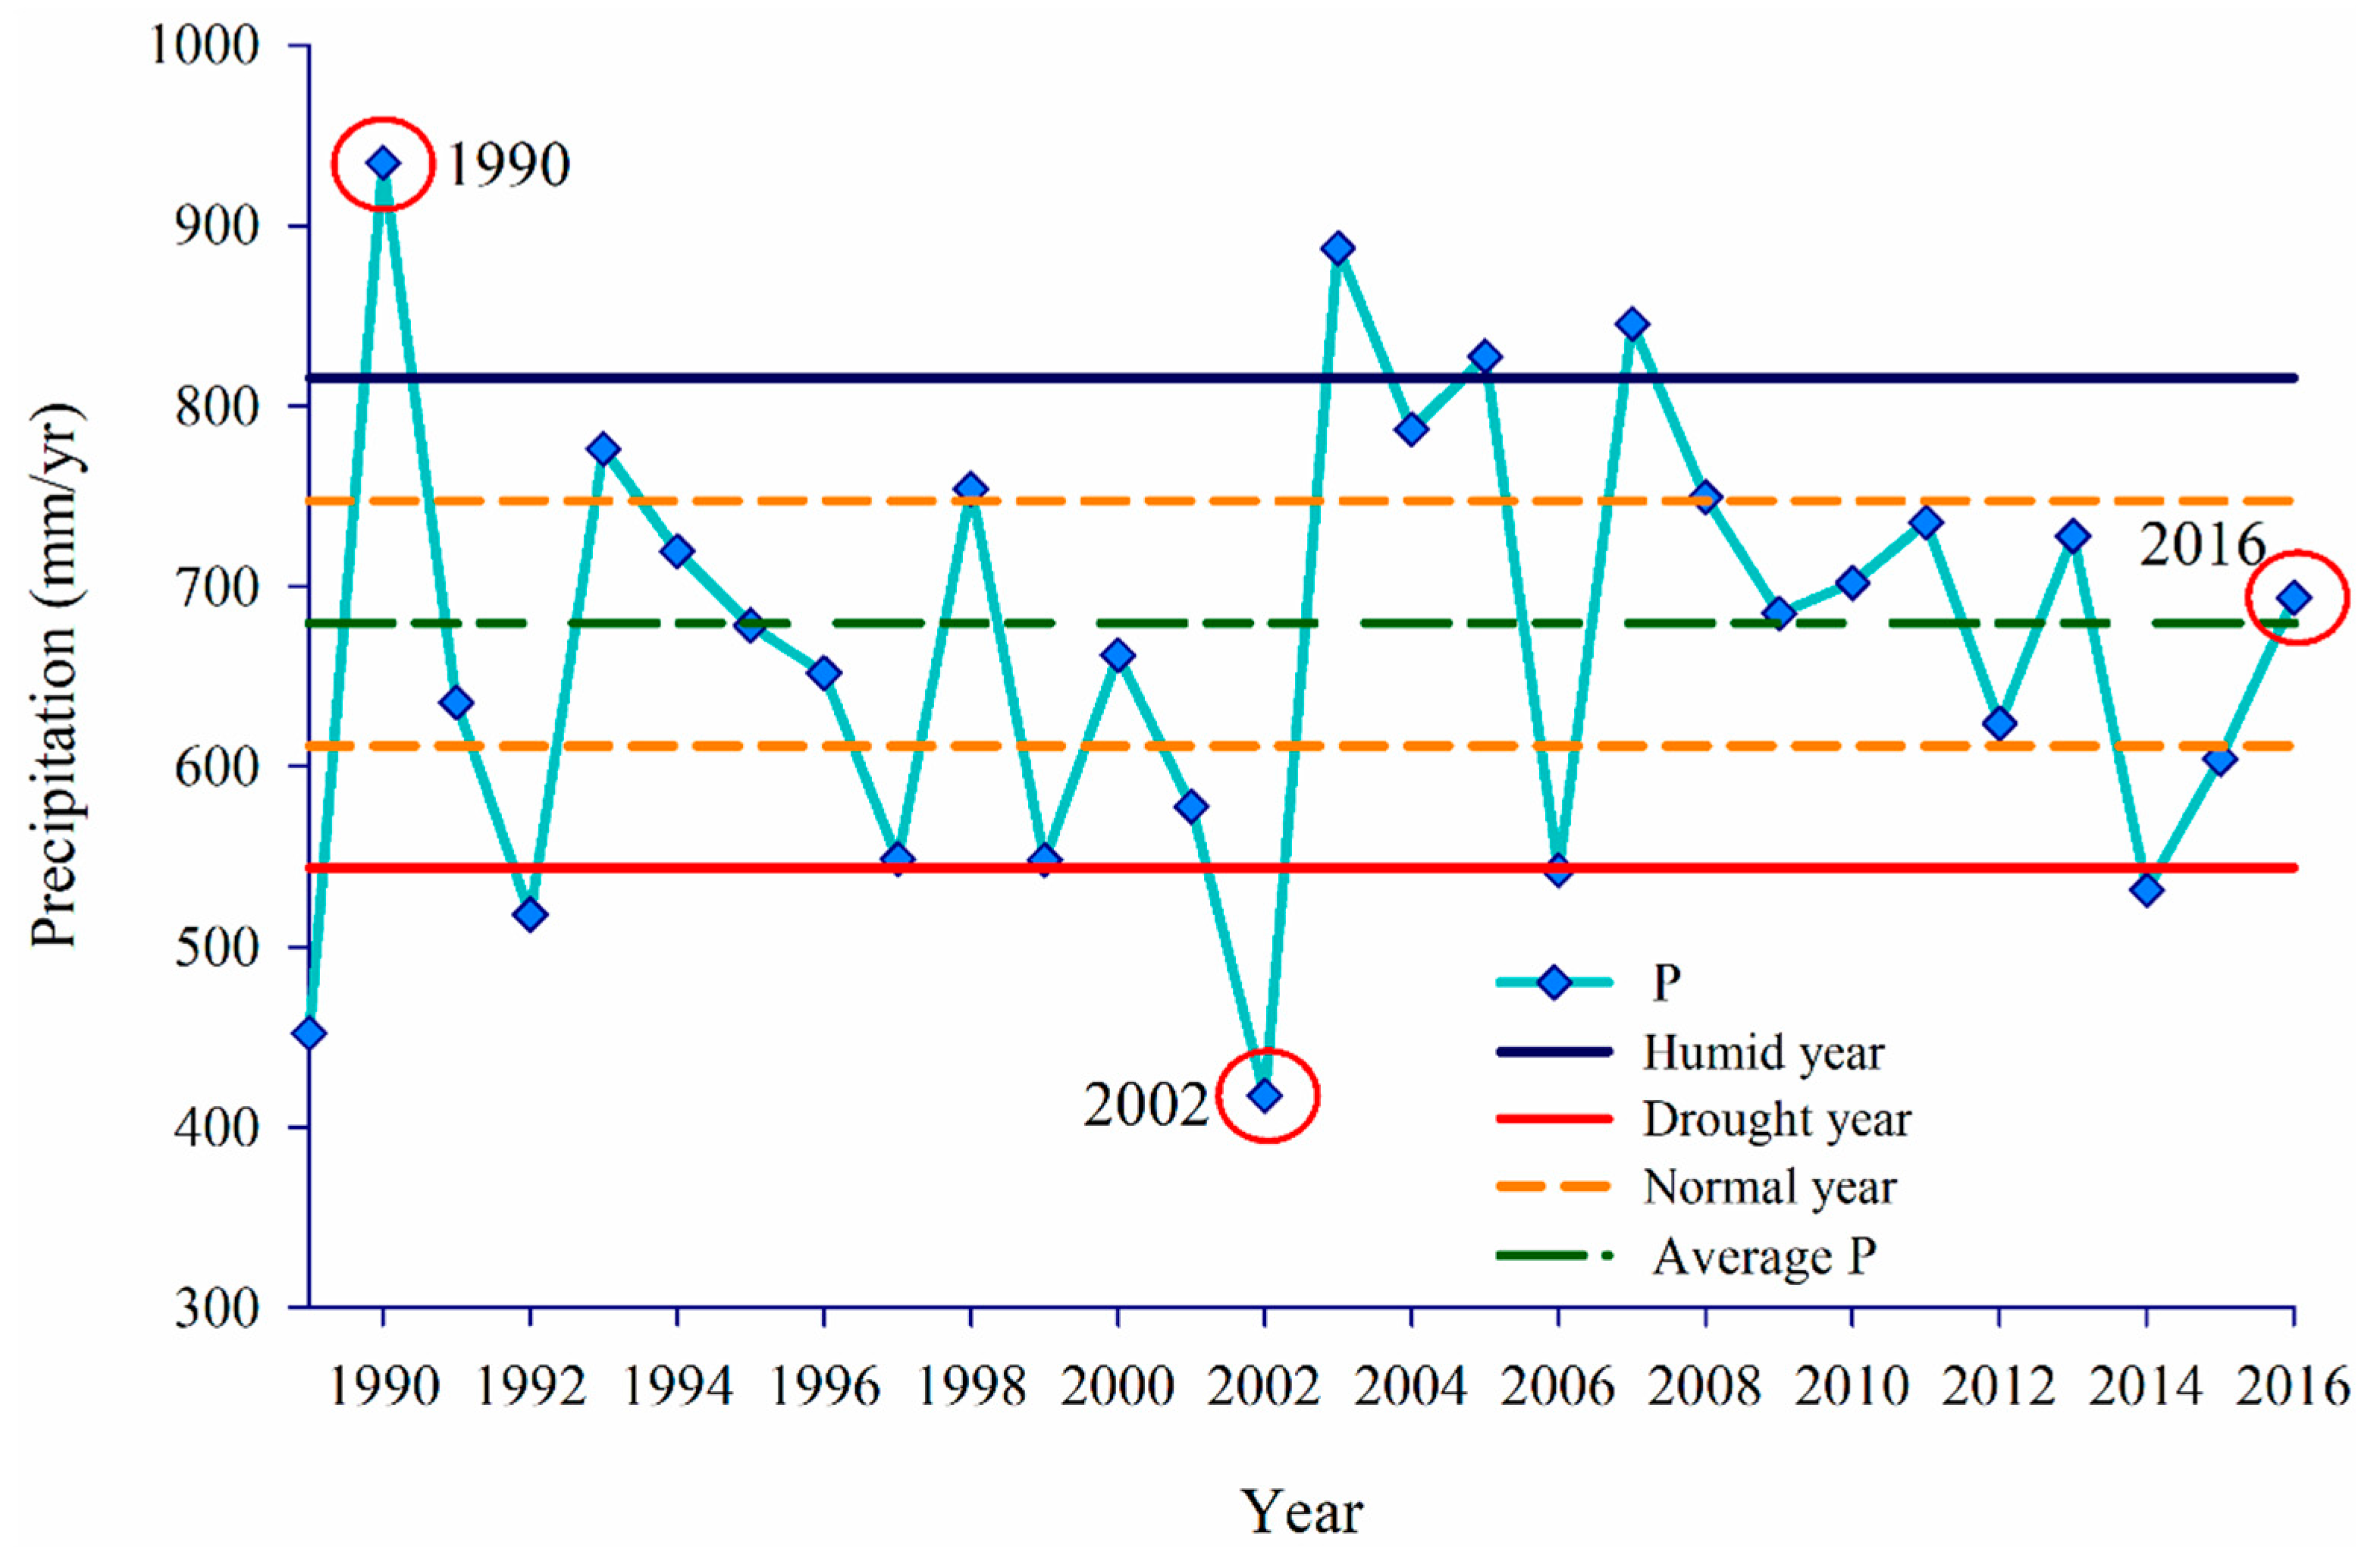
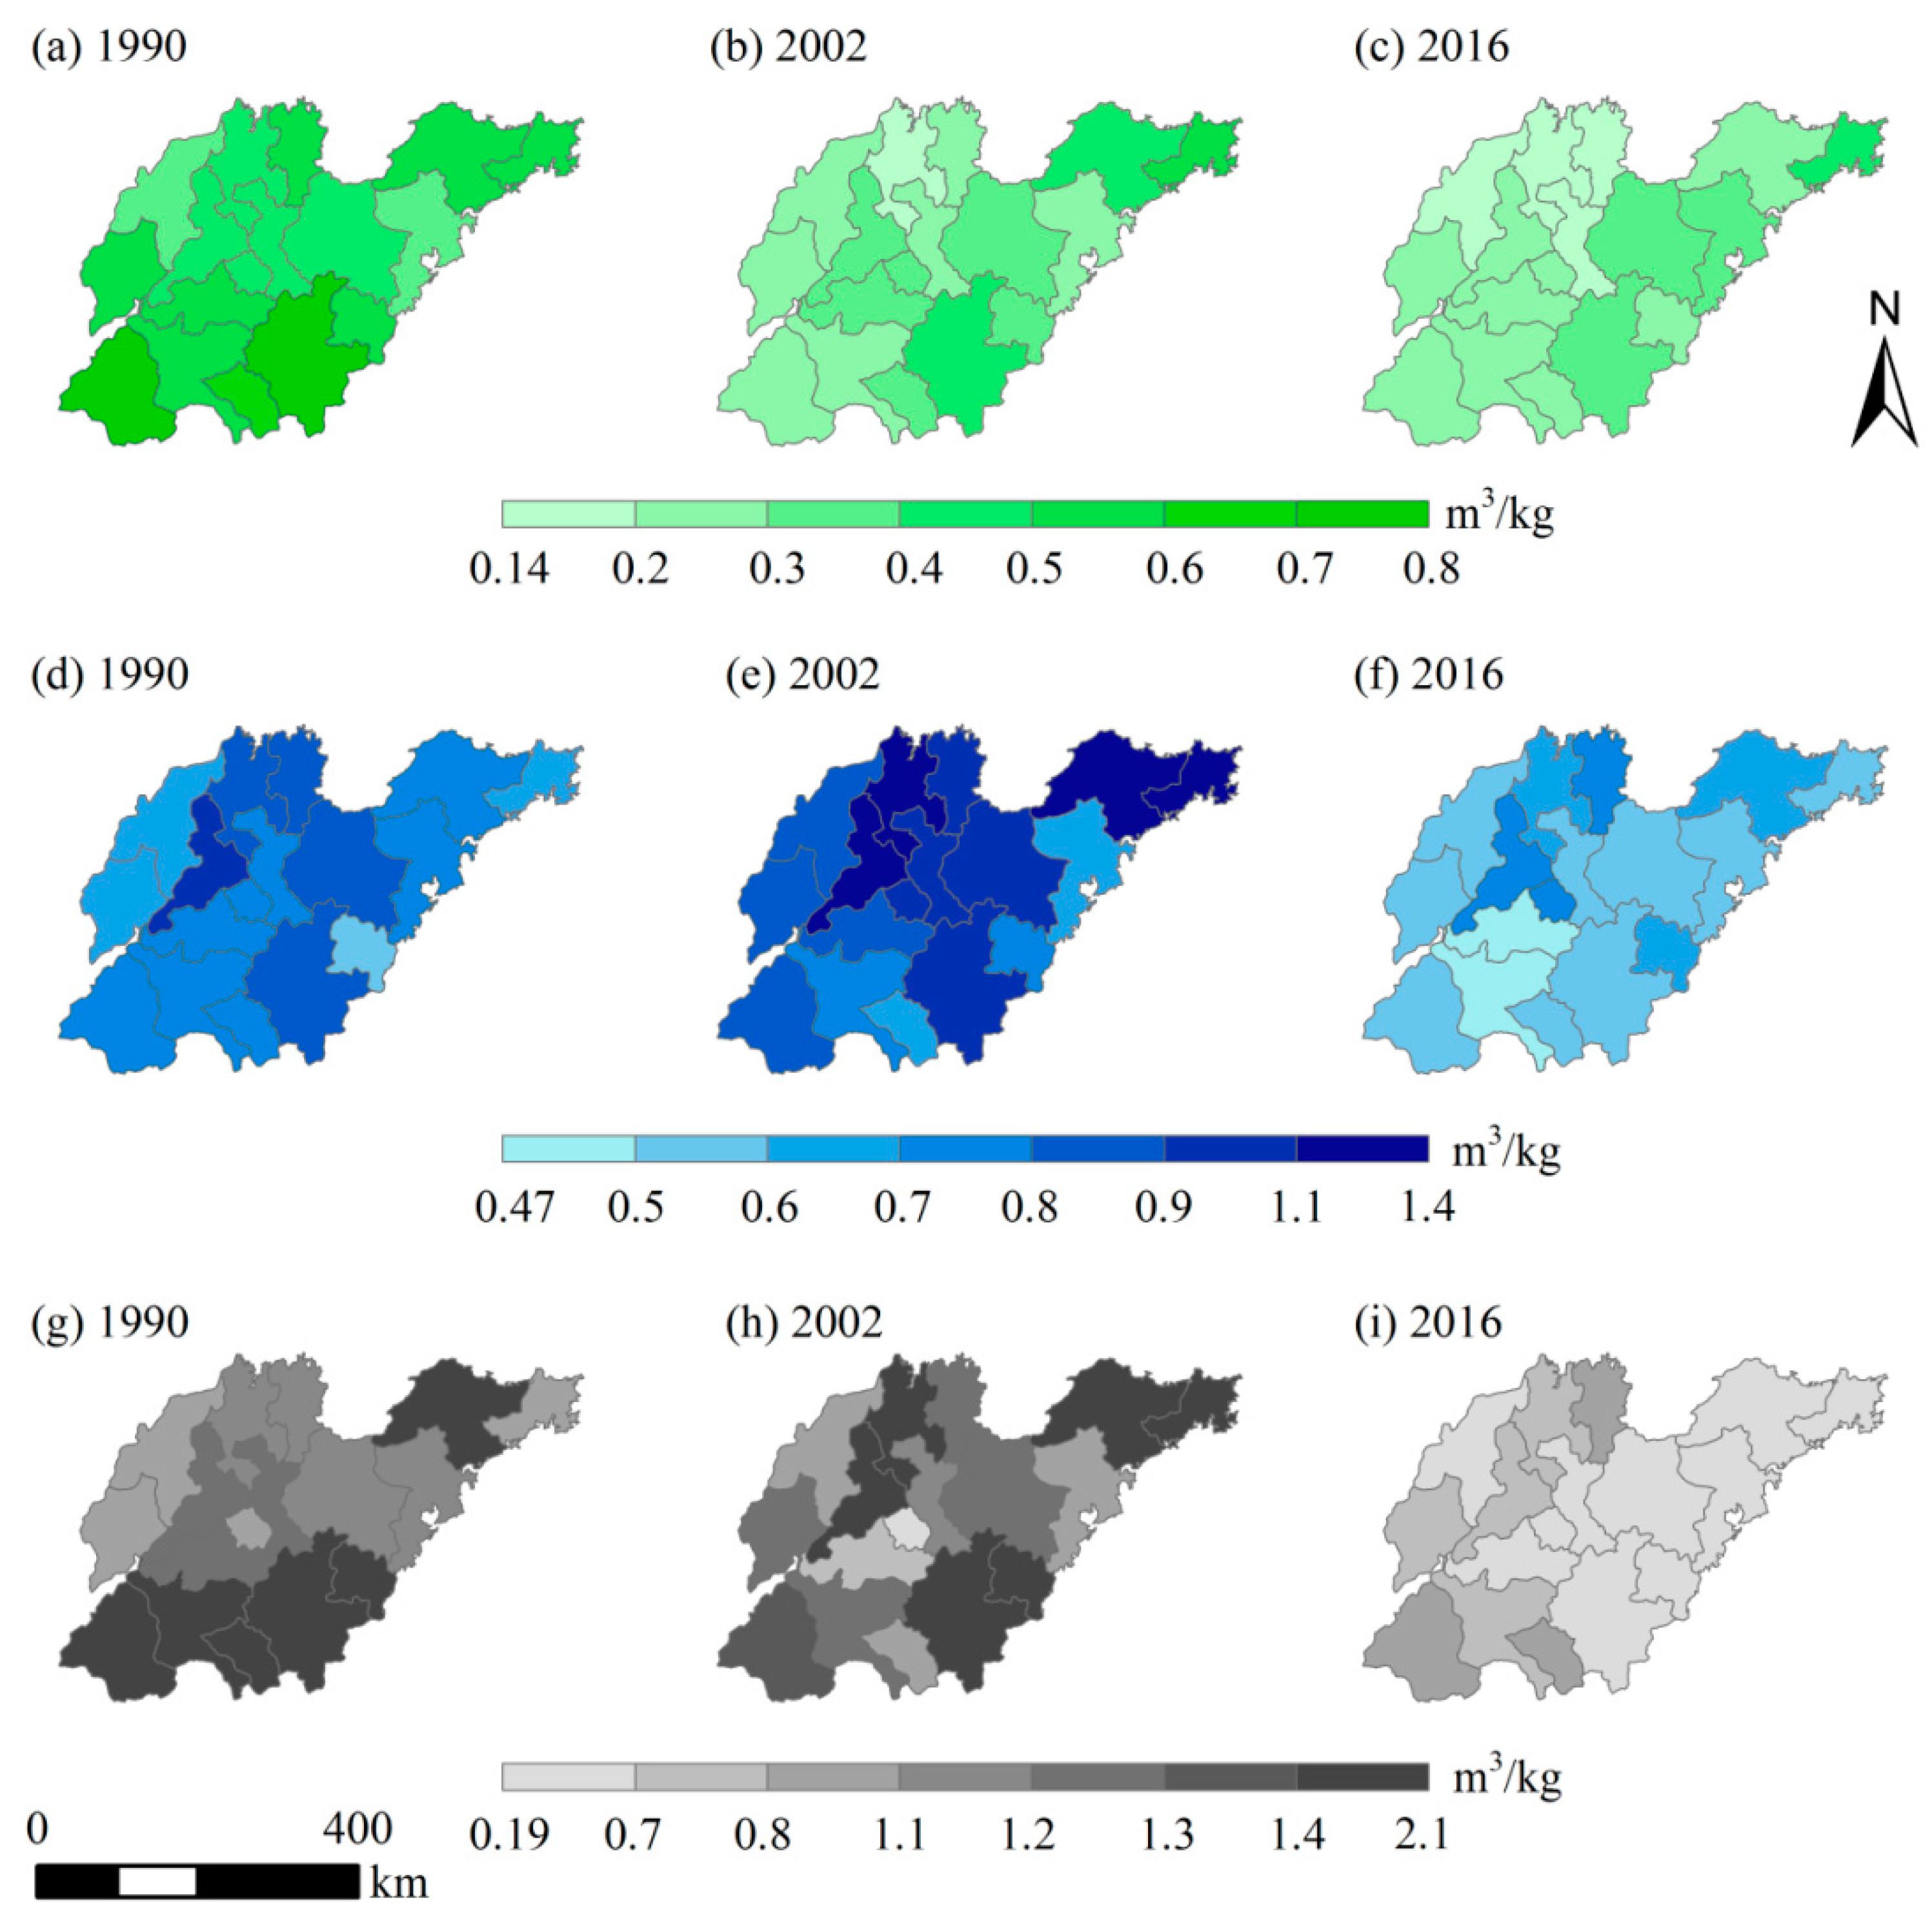
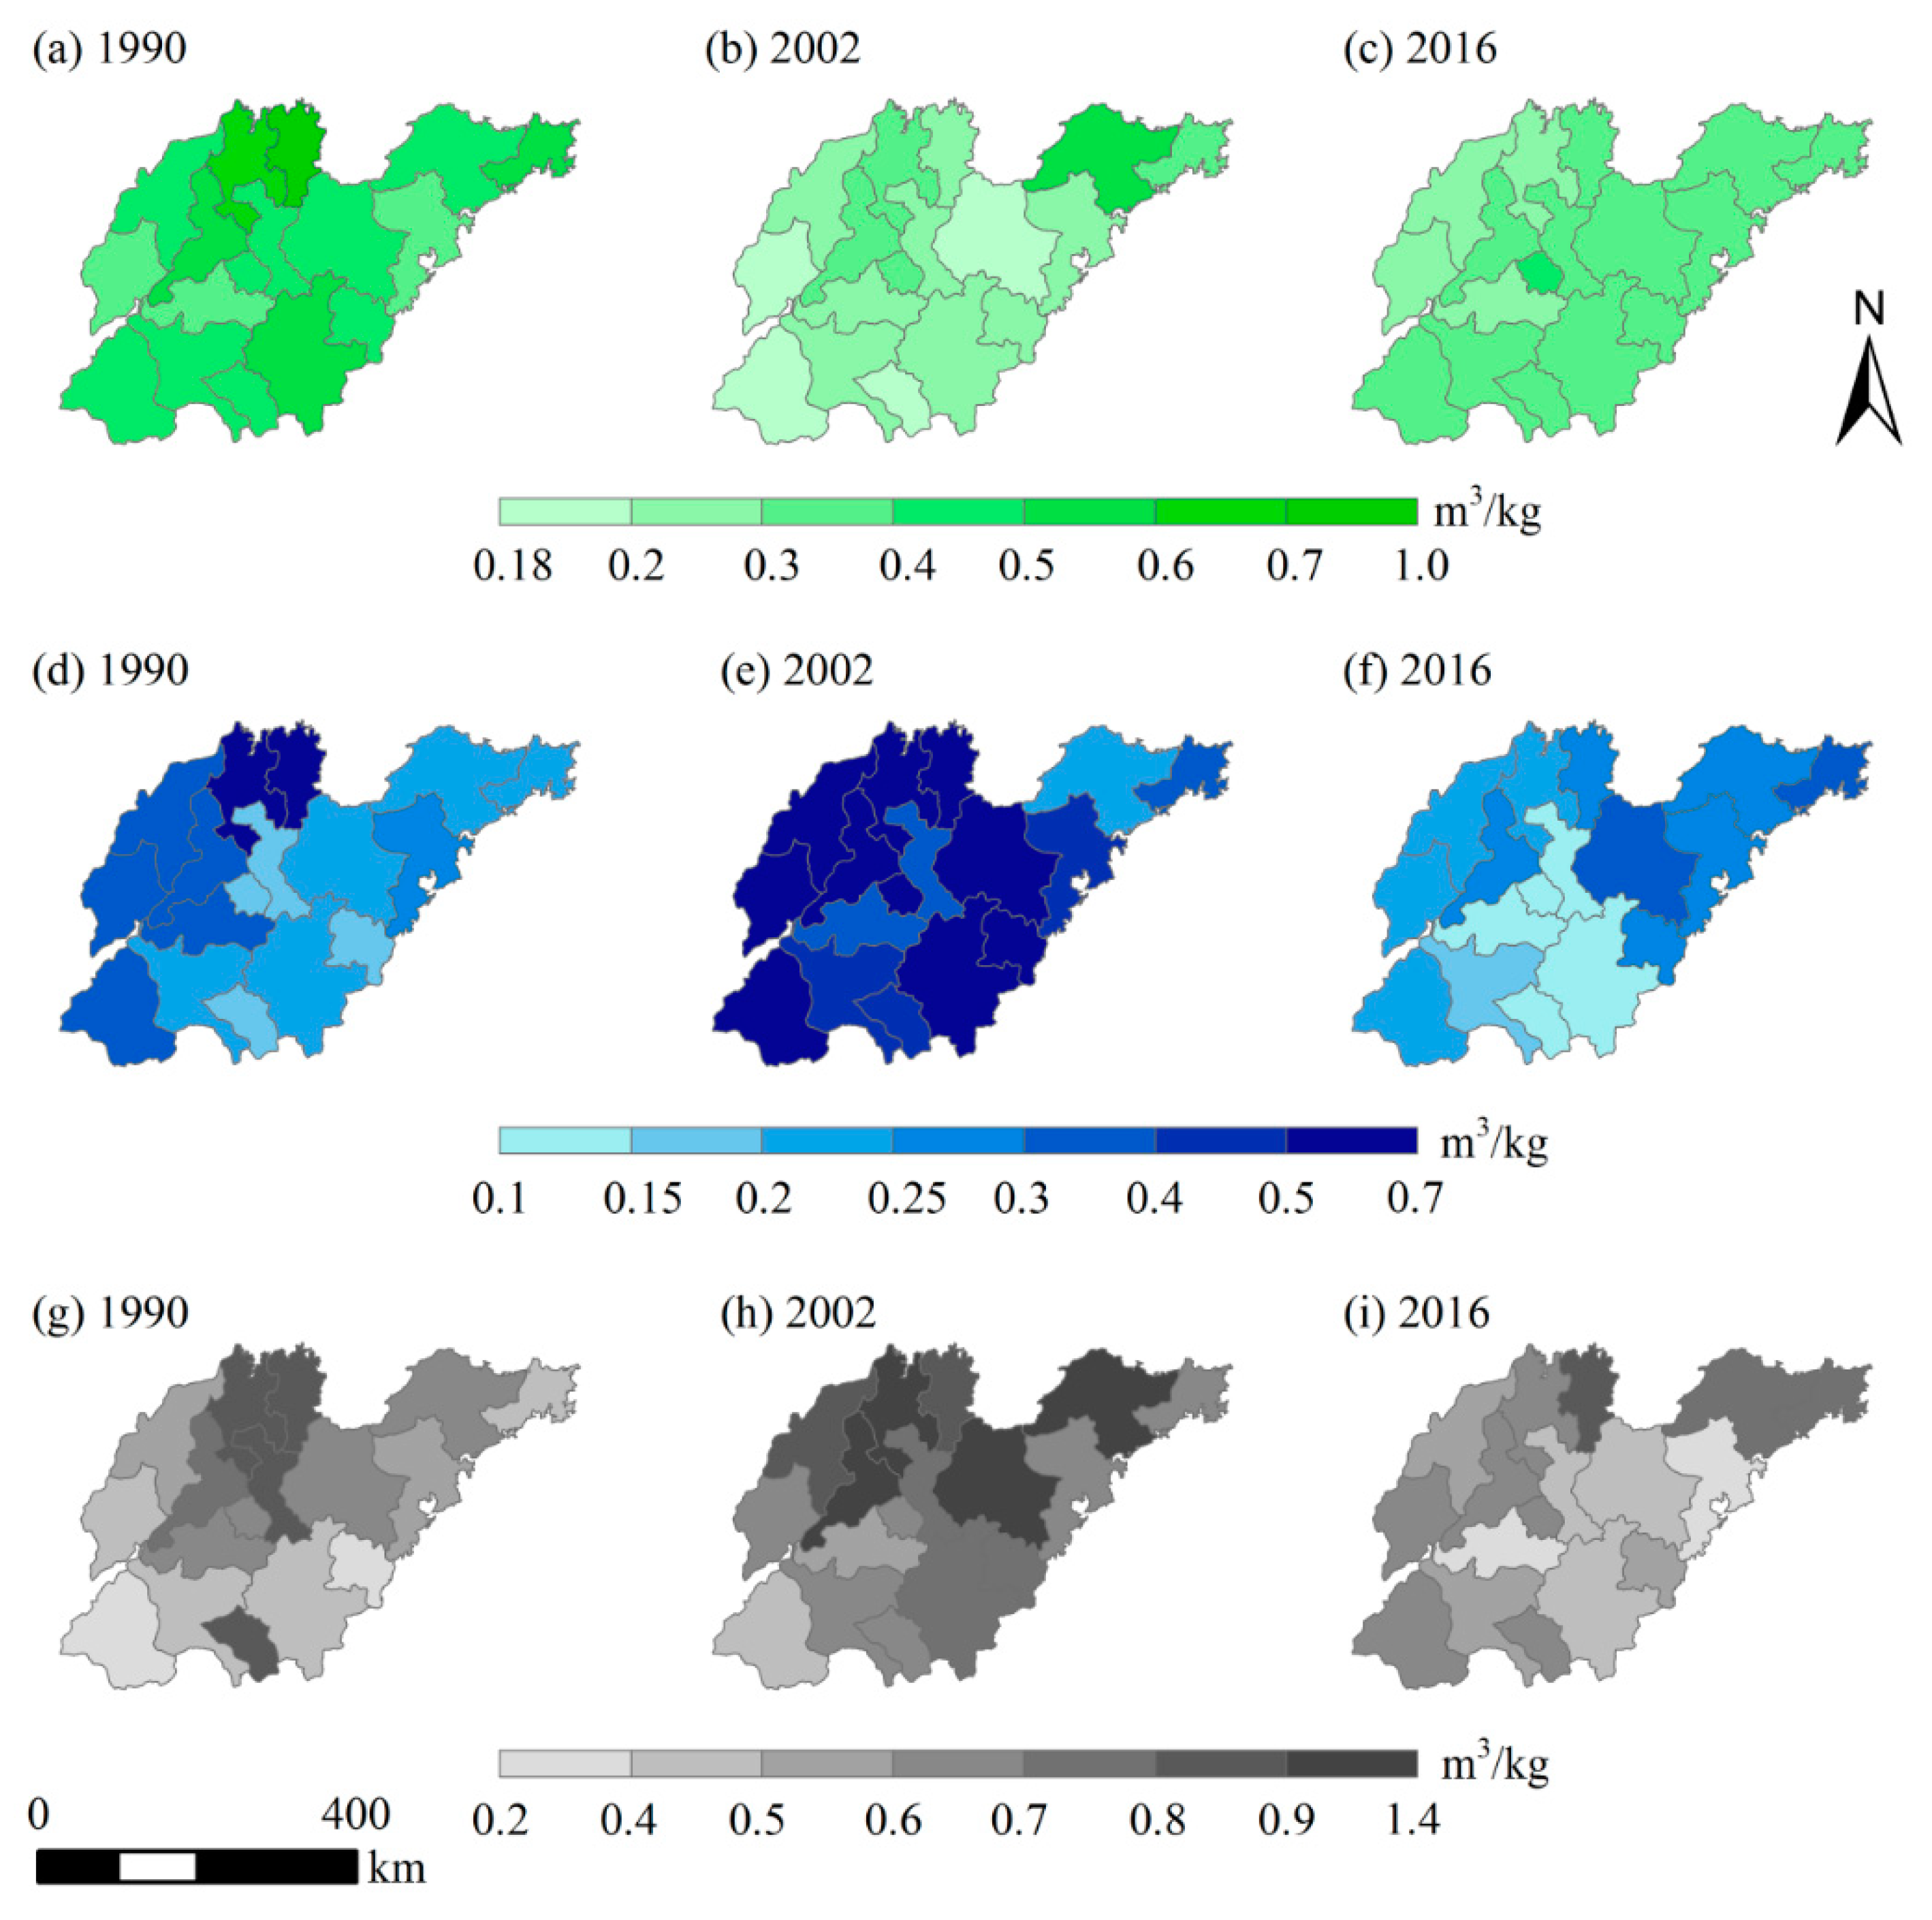
3.2. Spatial Distribution of WF for Main Crops in Different Rainfall Years

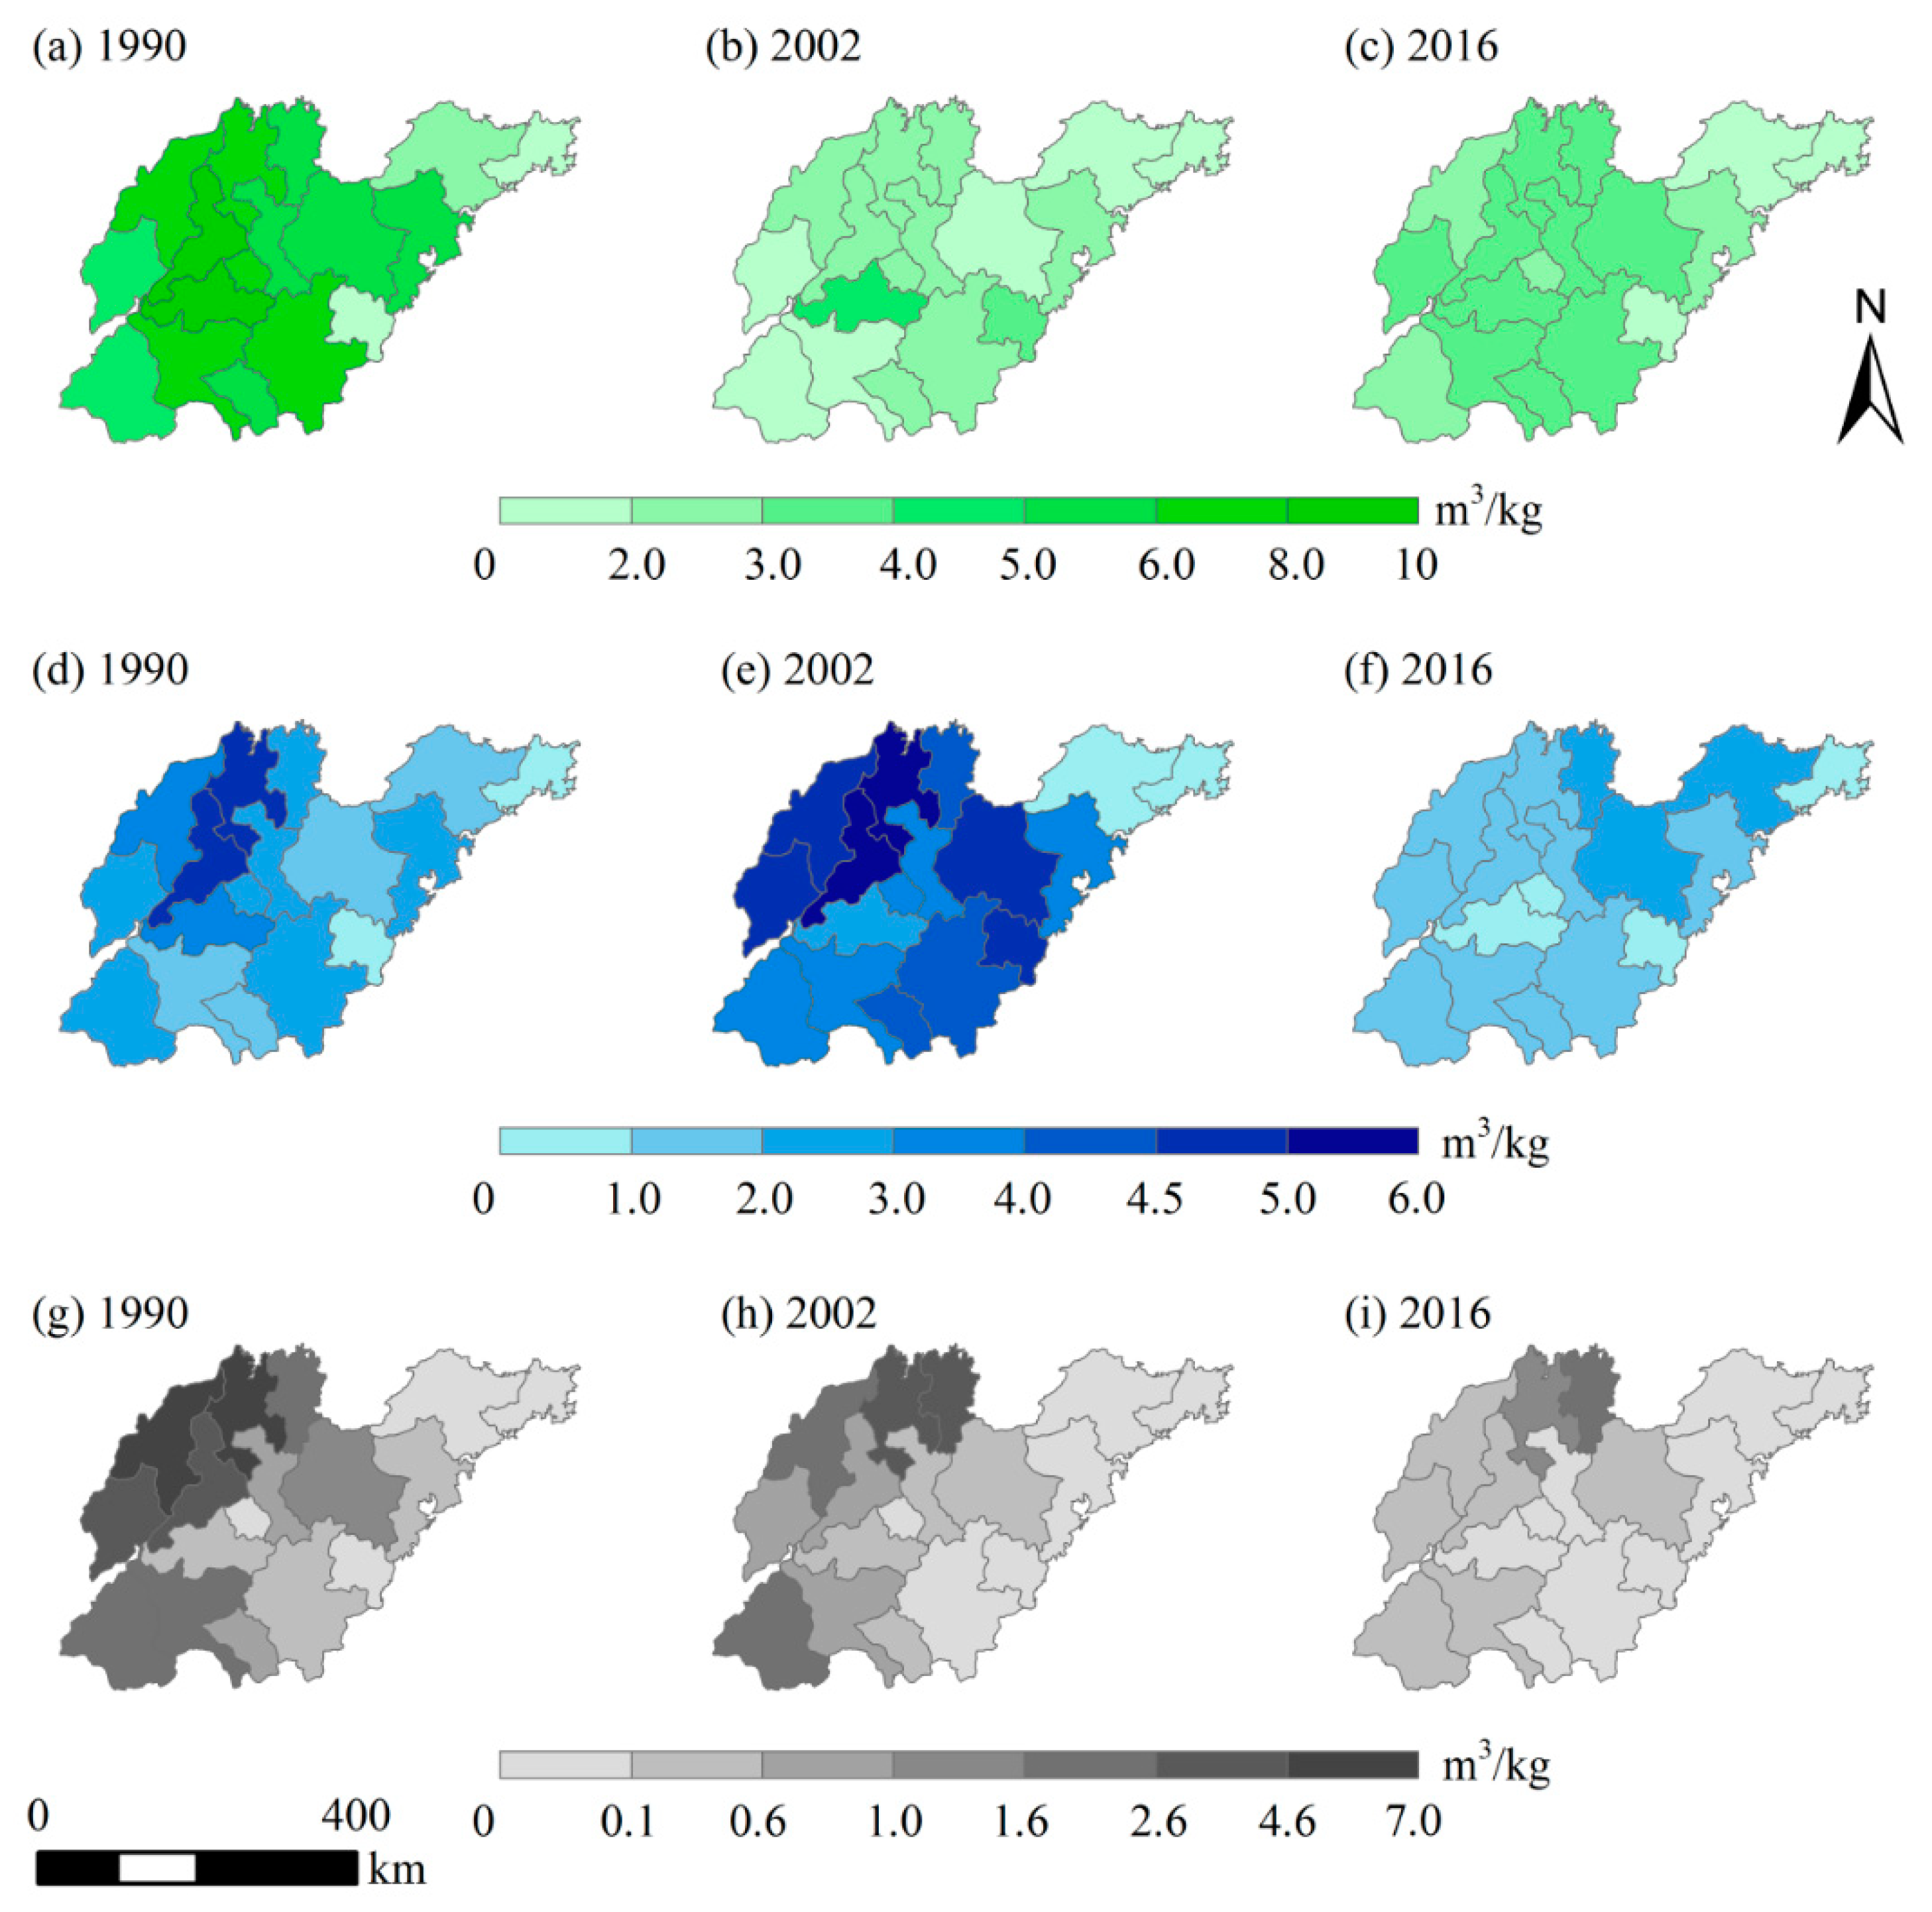
3.2.1. Spatial Distribution of WF for Wheat

Figure 5 showed the spatial distribution of WFgreen, WFblue and WFgrey for wheat in different rainfall years in Shandong Province. It could be seen that the WFgreen of wheat displayed a spatial aggregation pattern (Figure 5a–c). The WFgreen was the highest in eastern Shandong while it was the lowest in western Shandong because the local precipitation in the east region was more than that in the west region. In the different rainfall years, the responses of WFgreen varied in different regions [46]. In the humid year of 1990, which had the highest precipitation among the three years, the WFgreen was the highest. The areas with higher values were mainly distributed in Heze, Linyi and Zaozhuang. The region with lower WFgreen mainly distributed in Dezhou, with the value of 0.35 m3/kg. In the drought year of 2002, which had the lowest precipitation among the three years, the WFgreen of all regions displayed decreasing trends compared with that in 1990. The regions with higher values mainly included Weihai and Linyi. The lowest WFgreen was 0.16 m3/kg, which was found in Binzhou. Compared with 2002, the precipitation increased in the normal year of 2016, but the WFgreen was the lowest among the three years. The area with high value was concentrated in Weihai. However, Dezhou showed the lowest WFgreen level in 2016.
The spatial distribution of WFblue was also assumed to be influenced by the rainfall pattern. It mainly showed dynamic changes among the three years (Figure 5d–f). In the humid year of 1990, due to low yield in the north central region, the areas with high values were mainly distributed in Jinan, Dongying and Weifang. In the drought year of 2002, the WFblue was the highest of the three years. In the normal year of 2016, the areas with high values decreased compared with those in 2002 and distributed in all regions.
The spatial distribution of the WFgrey followed the pattern of the planting area. In different rainfall years, the high values areas appeared in different regions (Figure 5g–i). Specially, low WFgrey was found in the middle part of Laiwu. The reason was that the wheat planting area was less in this region. Meanwhile, the WFgrey was lower in the east region in 2016 because of the higher wheat yield and the efficient utilization of fertilizers. The spatial variation of WFgrey in 2002 was more obvious than that in 1990 and 2016. In summary, the WF of wheat was higher in Weihai, Yantai and Linyi while it was the lowest in Laiwu.

3.2.2. Spatial Distribution of WF for Maize

The spatial distribution of WFgreen, WFblue and WFgrey for maize in 1990, 2002 and 2016 in Shandong Province was shown in Figure 6. In general, the WFgreen of maize displayed a spatial aggregation pattern, with highest in the east regions and lowest in the west regions (Figure 6a–c). The areas with higher values included Dongying, Binzhou, Yantai, Laiwu and Linyi. The regions with lower WFgreen mainly distributed in the west inland areas, such as Taian, Liaocheng and Dezhou. The average WFgreen of Shandong Province was 0.50 m3/kg in 1990, which was higher than 0.27 m3/kg in 2002 and 0.34 m3/kg in 2016.
WFblue of maize mainly showed obvious changes among the three years (Figure 6d–f). In the humid year of 1990, larger WFblue was found in Binzhou, Dongying and Jinan. This was due to low yields in the north regions. The WFblue in the drought year of 2002 was the highest among the three years in most regions except Dongying and Yantai. In the normal year of 2016, the WFblue was the lowest among the three years, though the WFblue in the east regions was relatively high.
The spatial distribution of the WFgrey of maize decreased from north to south (Figure 6g–i). In the humid year of 1990, regions with larger WFgrey were located, for example, in Zibo, Binzhou and Dongying. In 2002, the highest values areas were concentrated in the north part of Shandong. The areas with high values were different in 2002 and 2016. In summary, the WF of maize was higher in Qingdao, Binzhou and Jinan while Taian had the lowest WF.

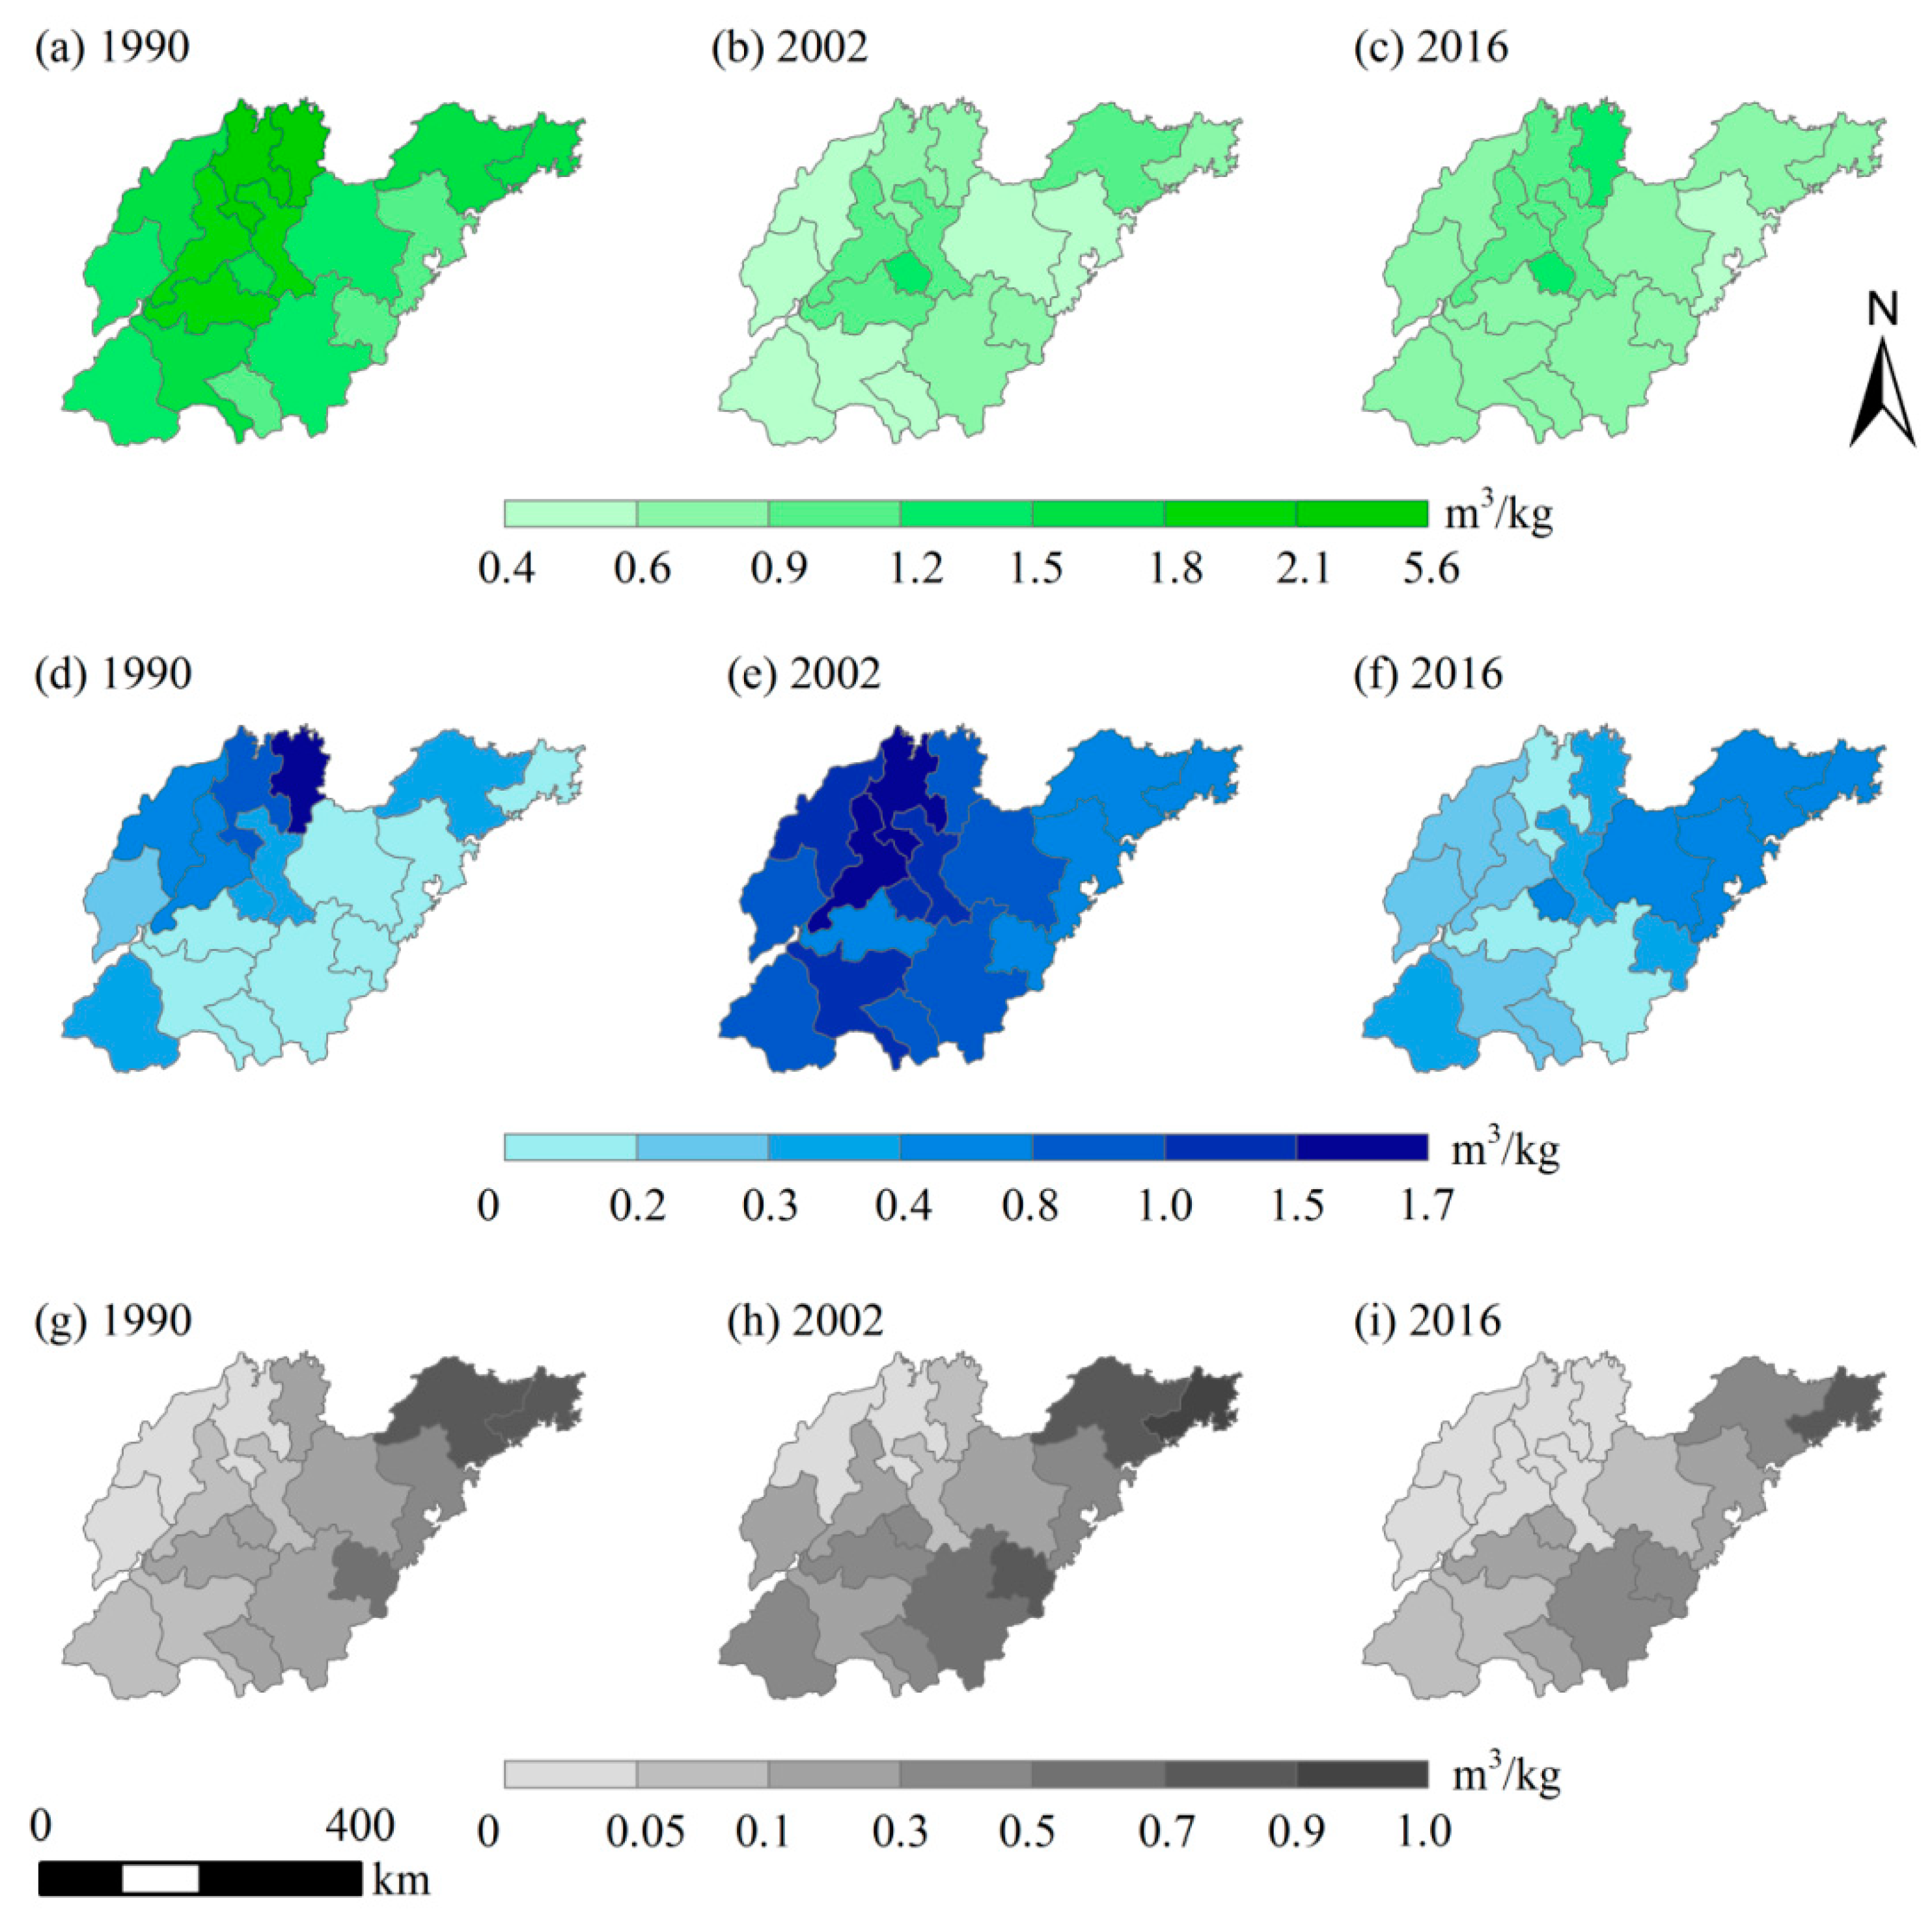
3.2.3. Spatial Distribution of WF for Cotton

For cotton, the results showed that the WFgreen was highest in the middle regions and lowest in the eastern regions (Figure 7a–c). In the humid year of 1990, the WFgreen was the highest among the three years. The areas with higher values were mainly distributed in Taian, Jinan and Linyi. However, Rizhao and Weihai had the lowest WFgreen, which was 0 m3/kg. The reason was that there were no plantings in these regions. In the drought year of 2002, the WFgreen of all regions displayed decreasing trends except Rizhao. Compared with 2002, WFgreen increased in most regions in 2016 and the areas with higher values were concentrated in the middle regions.
The WFblue was highest in Binzhou and Dongying, where cotton was mainly grown. That was because agriculture was a high-water-consuming sector, with high water consumption in areas with large crop production [53]. In 1990 and 2002, the areas with higher values of WFblue were mainly distributed in Binzhou and Jinan. This was due to low yields in the two regions. Compared with 1990 and 2002, the spatial discrepancy of WFblue was relatively small in 2016 (Figure 7d–f).
Obviously, the WFgrey of cotton was low in eastern Shandong due to the limited planting area of cotton (Figure 7g–i). However, it was relatively larger in Dongying and Binzhou in different rainfall years. In summary, the WF of cotton was higher in Dongying, Binzhou and Dezhou while Yantai had the lowest WF.

3.2.4. Spatial Distribution of WF for Groundnut

We also calculated the WFgreen, WFblue and WFgrey of groundnut in each region of Shandong Province in 1990, 2002 and 2016. The results showed that WFgreen was higher in the north and central regions, while it was lower in the east regions (Figure 8a–c). In the humid year of 1990, WFgreen was the highest among the three years. The areas with higher values were mainly distributed in Dongying and Binzhou. However, Rizhao and Qingdao had the lowest WFgreen, with the values of 0.99 m3/kg and 1.02 m3/kg, respectively. The reason was that there were higher yields in these regions. In the drought year of 2002, WFgreen was the lowest and the areas with higher values were concentrated in the middle regions. Compared with 2002, WFgreen of all regions showed an upward tendency in 2016.
WFblue of groundnut presented obvious spatial changes among the three years (Figure 8d–f). In the humid year of 1990, WFblue was lower in northeast regions than that in southwest regions. In the drought year of 2002, WFblue was the highest among the three years. In the normal year of 2016, the highest WFblue was mainly distributed in east regions while Taian had the lowest WFblue.
The spatial distribution of the WFgrey of groundnut decreased from east to west in different rainfall years (Figure 8g–i). It was consistent with the planting structure of groundnut in Shandong Province. As can be seen from the figure, there were obvious differences in WFgrey of groundnut between regions in Shandong. In general, the WF of groundnut was higher in Dongying, Yantai and Weihai while Qingdao had the lowest WF.

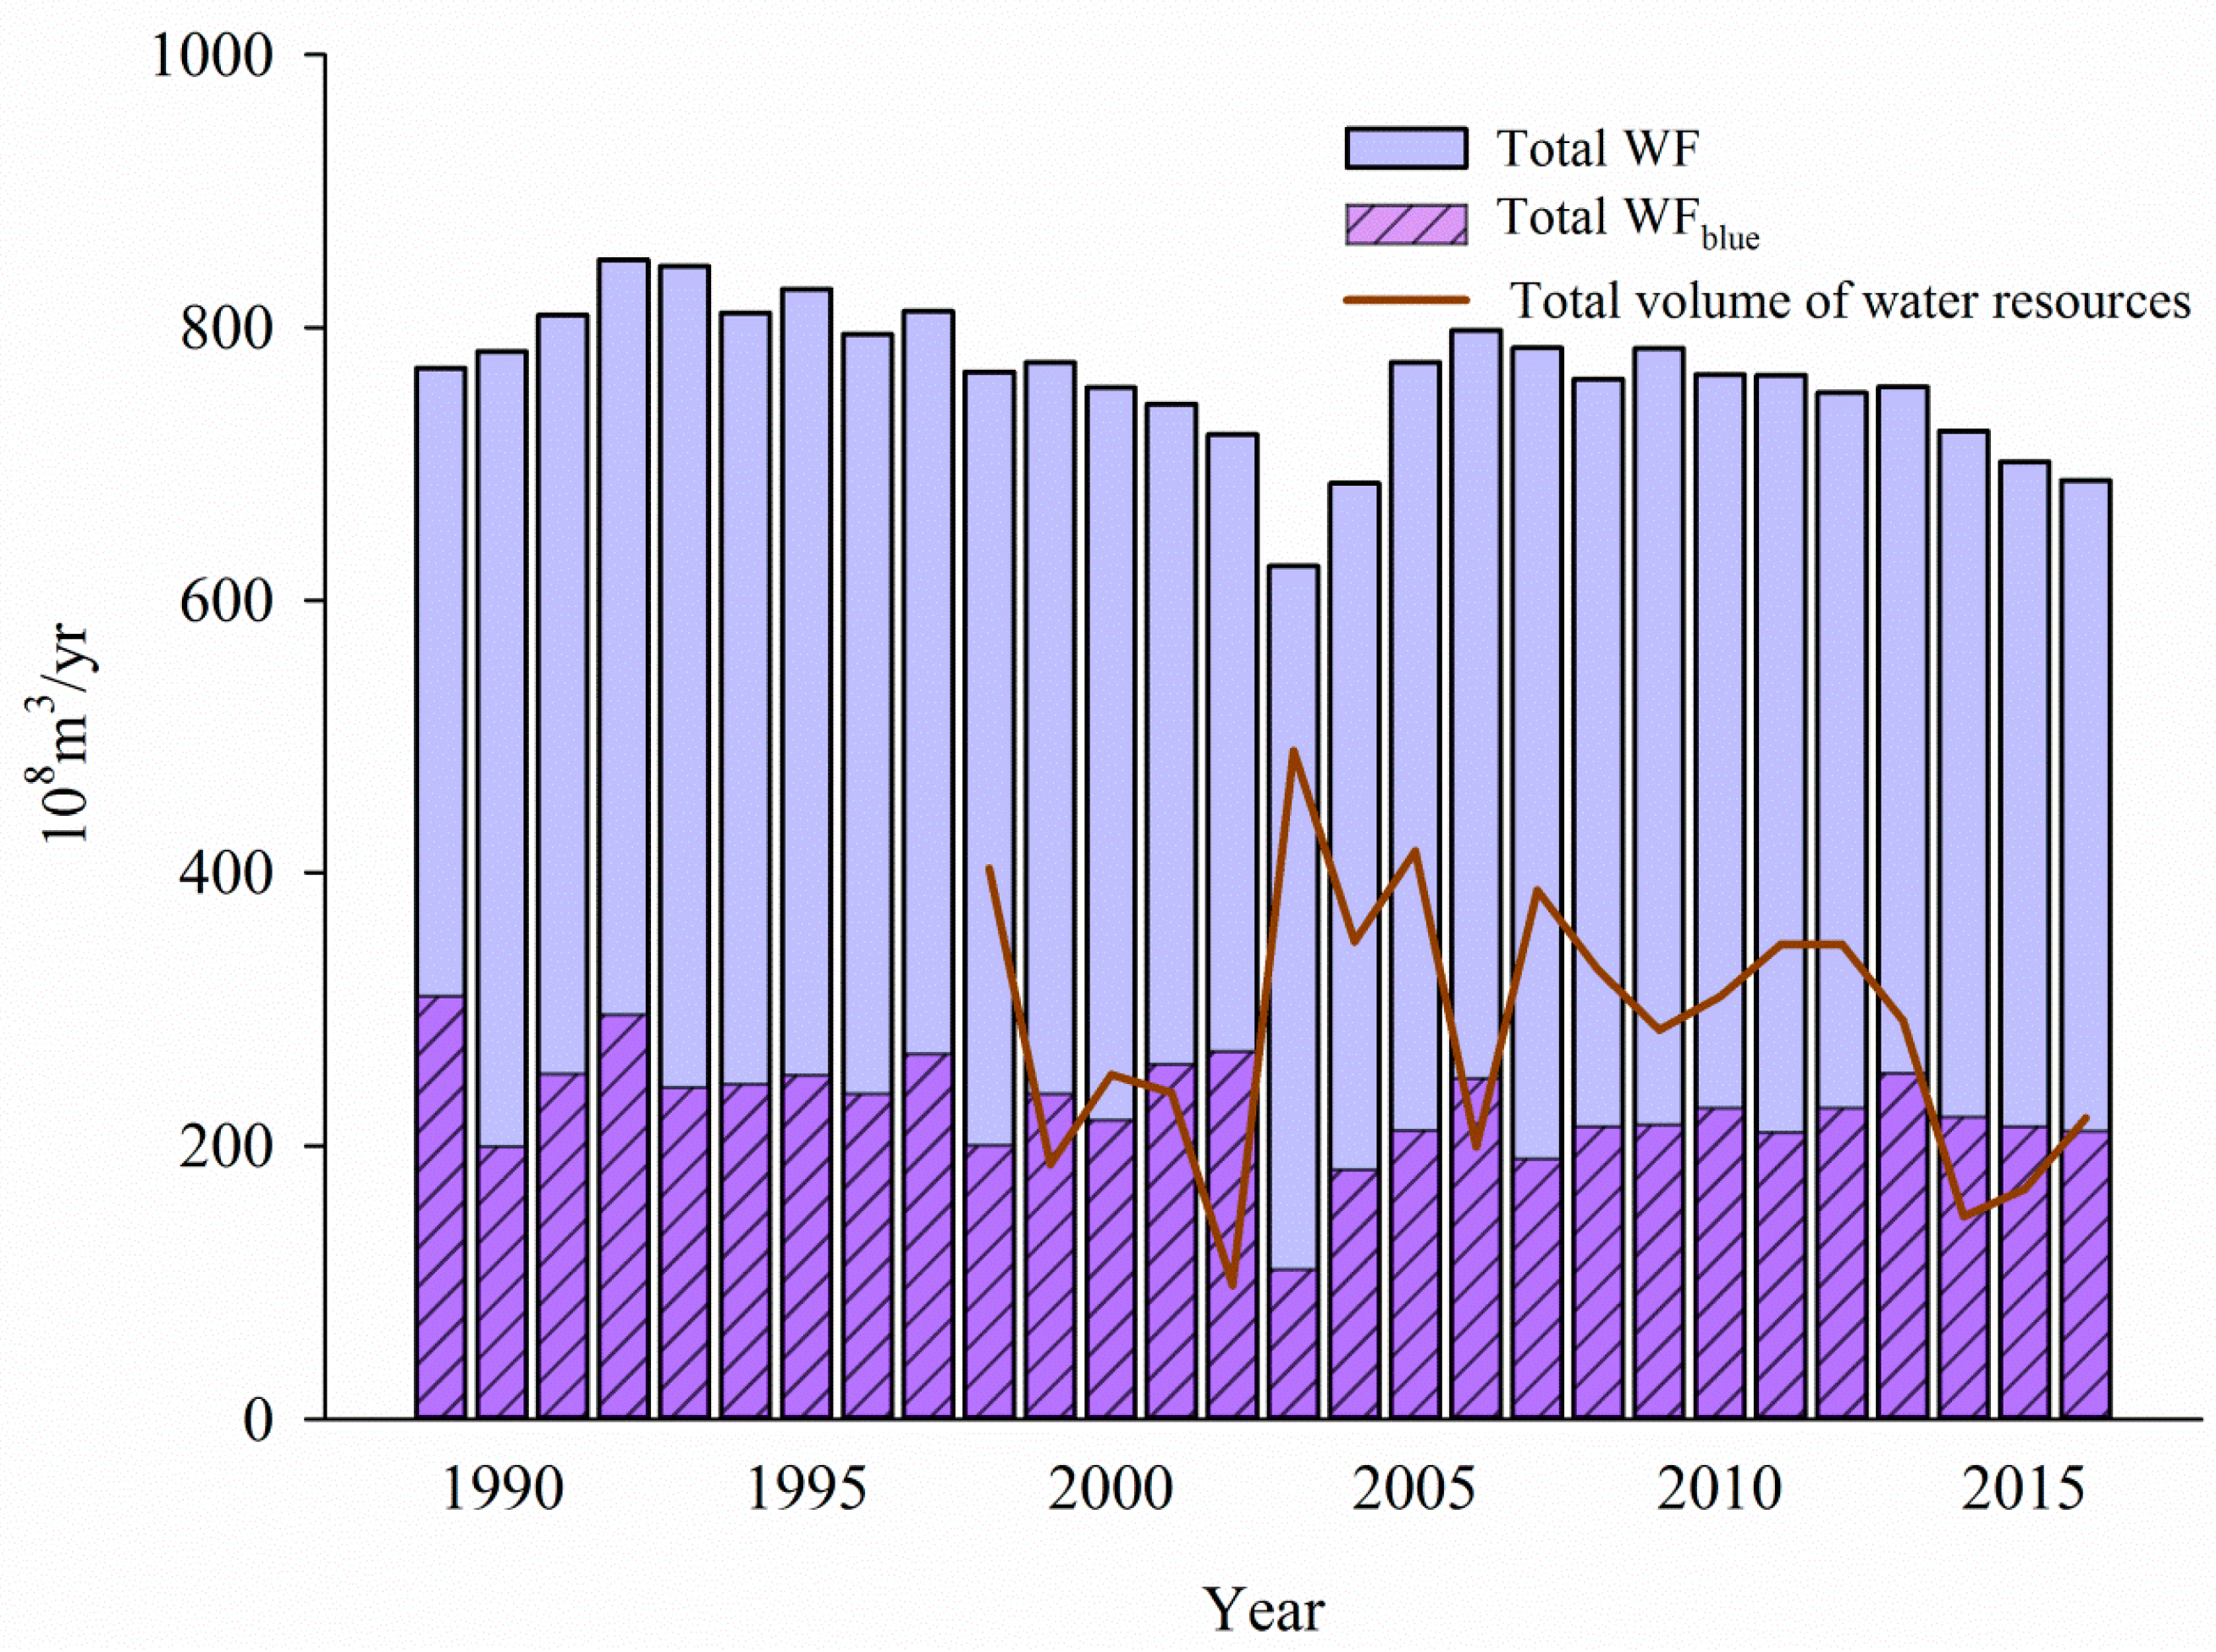
3.3. Trends of Annual Total WF and WFblue for Main Crops

The total WF can reflect types and quantities of water needed for crops growth. During the study period, the average annual total WF was 420.59 × 10⁸ m3/yr required for wheat production in Shandong Province, of which 14.38% was WFgreen (60.48 × 10⁸ m3/yr), 35.34% was WFblue (148.64 × 10⁸ m3/yr), 50.28% was WFgrey (211.47 × 10⁸ m3/yr), respectively. The total WF and WFblue showed downward trends over the years (Figure 9a). The average annual total WF was 222.16 × 08 m3/yr required for maize production in Shandong Province, and WFgreen (61.54 × 10⁸ m3/yr), WFblue (44.52 × 10⁸ m3/yr) and WFgrey (116.10 × 10⁸ m3/yr) contributed 27.70%, 20.04% and 52.26%, respectively. The total WF showed an increasing trend and the WFblue appeared a fluctuating trend over the years (Figure 9b). The average annual total WF for cotton was 72.70 × 10⁸ m3/yr in Shandong Province, with the green (30.44 × 10⁸ m3/yr), blue (23.79 × 10⁸ m3/yr) and grey (18.47 × 10⁸ m3/yr) WF accounting for 41.87%, 32.72% and 25.41%, respectively. The total WF and WFblue showed decreasing trends over the years (Figure 9c). Obviously, there was a sharp descending trend because of the reduction in cotton sown area during 1993–1999. The average annual total WF was 50.07 × 10⁸ m3/yr required for groundnut production in Shandong Province, comprising 51.23% WFgreen (25.65 × 10⁸ m3/yr), 25.60% WFblue (12.82 × 10⁸ m3/yr) and 23.17% WFgrey (11.60 × 10⁸ m3/yr), respectively. The total WF and WFblue showed decreasing trends in volatility (Figure 9d).

3.4. Pressure of Water Scarcity on Agriculture Productions

Figure 10 showed the trends of the total annual WF, WFblue for four main crops and total blue water resources in Shandong Province. From 1989 to 2016, the average annual total water footprint consumption for four crops in Shandong Province was 765.52 × 10⁸ m3/yr, of which WFblue (229.53 × 10⁸ m3/yr) accounted for 29.98%. In addition, the total annual WF and WFblue for four crops presented decreasing trends over the years. The decreasing trends were due to the improvement of irrigation management and fertilizer use efficiency in Shandong Province in recent years. Furthermore, a reasonable planting structure could also result in the decreasing of total annual WF and WFbule. In some drought years, the total volume of water resources was obviously less than the total annual WFblue for four main crops, indicating that blue water crisis existed in these years in Shandong.
The blue water pressure index (WPIblue), namely the ratio of total WFblue to total blue water resources, was used to evaluate the degree of blue water scarcity, which could reflect the status of water resources in the region. When WPIblue is greater than 0.4, the region is recognized as severe water scarce region [54]. And if WPIblue is greater than 1, this region is facing very serious water scarcity. Based on the results of the total WFblue for four main crops in Shandong Province and combined with the total blue water resources in different regions, we calculated the WPIblue and analyzed the spatial variations of the blue water risk of the main crops in Shandong Province. The data of total water resources for each region was only available in 2015 and 2016, so we analyzed the spatial distribution of WPIblue in these two years.
As is shown in Figure 11, the WPIblue presented obvious spatial differences in Shandong Province. In 2015, the areas with higher values were mainly distributed in Liaocheng and Qingdao which were 5.17 and 3.05. Because of the severe drought in these two areas in 2015, water resources could not meet the needs of agricultural production. The WPIblue was greater than one, which accounted for 58.82% of the whole province, indicating that most regions in the province were facing the threat of water resources shortage. And Laiwu had the lowest value of 0.51, which was also higher than the warning line of 0.4. In 2016, WPIblue was higher in the northeast than that in other areas. The areas with high values of more than 1.5 were mainly distributed in Dezhou, Liaocheng and Qingdao. Obviously, the drought was still serious in the three regions in 2016. The WPIblue of all regions was greater than 0.4 except Laiwu and Linyi.
In summary, judging from the distribution of the WPIblue in Shandong Province in 2015 and 2016, agricultural productions were facing the threat of water scarcity in most regions of Shandong Province. Especially in the last two years, the drought in Qingdao had been very serious. And the Chanzhi Reservoir, which was the second largest reservoir of Shandong Province, had nearly dried up. Therefore, it was urgent to adjust the planting structure of agriculture reasonably according to the local water resources. In case of insufficient of water, the cotton planting area should be properly controlled in water scarce regions since it needs a lot of water during the growing season.

4. Discussion

The main water resources for crops growth are rainfall and irrigation. Rainfall impacts the amount of water footprint and has both annual and inter-annual variations. Therefore, study on the temporal variation trends of crops water footprints and exploration of the distinctions of water footprints between different rainfall years are very important to take advantage of rainfall and to adjust irrigation accordingly. This present study provided more accurate assessment of water consumption and laid a foundation for the adjustment of crop planting structure and the determination of reasonable irrigation quotas.
In the past, several studies had estimated WFs of wheat, maize, cotton and groundnut in Shandong Province. Three previous studies were selected for comparison (Figure 12). Comparing the WFgreen-blue of wheat in the present study with those from previous studies, the WFgreen-blue in our estimation was smaller than that of Cheng et al. [55], while it was larger than that of Li [56] and Gao [44]. The WFgreen-blue of maize in our study was slightly smaller than that of Gao [44] and Cheng et al. [55] while it was almost the same as Li [56]. Additionally, the WFgreen-blue of cotton in this study was much larger than that of Cheng et al. [55]. The WFgreen-blue of groundnut in current study was extremely close to that of Cheng et al. [55] while it was much smaller than that of Gao [44]. Compared with previous studies, this current study also estimated WFgrey of main crops in Shandong Province. At the same time, the results showed that the WFgrey of wheat and maize was larger than WFblue and WFgreen, which was the most important part of water use during crop production. In addition, monthly meteorological observations for each year from 1989–2016 were adopted in this study instead of the multi-year monthly average data.
These discrepancies of WFs were resulted from the differences in calculation models, study periods and the various environments including climatic conditions and soil texture, etc. The main objective of this study is to evaluate water scarcity pressure adopting the widely used method in Shandong Province. However, the results of WFgreen and WFblue calculated by CROPWAT 8.0 may have led to underestimation or overestimation of WF due to the lack of Kc values and accurate dates of growing stages for crops. Additionally, the WFgrey may also be underestimated or overestimated in this study due to the wide variety of fertilizers applied in farmland throughout Shandong Province, the difference in maximum allowable concentrations and the difficulty in collecting accurate data on the amount of fertilizer used. Therefore, it is not enough to give a single value of WF without providing an uncertainty range [5]. Furthermore, sensitivities and uncertainties in the assessment of WF were not provided in this present study. Despite these uncertainties, the results are helpful to assess the problem of water scarcity and to develop wise water management strategies in Shandong Province [57].
Three suggestions are put forward based on the results of this present study. First of all, the government should strengthen macro-control and policy guidance on crop production. Total WF is closely related to sown area which is influenced by macro-control. And reasonable prediction of prices of crops can control the sown area, and then total WF will be reduced under the condition of food security. The second, drought and water scarcity cause losses in the agricultural sector, and insurance is a possible instrument to recovery the losses. Therefore, the government ought to encourage farmers to take agricultural insurance [58,59]. The third, agricultural planting structure and distribution are urgent to be optimized. According to the regional differences in pressure of water scarcity, the scientific planning of crop planting structure and rational control of sown area of crops with large water footprints should be implemented in severely water-scarce regions of Shandong. For example, Weihai and Yantai are not suitable for planting wheat, because the WF of wheat in the regions is greater than that of other regions. Qingdao is not suitable for planting maize due to the higher WF of maize in this region. The WFs of crops can provide an important guidance for the adjustment of agricultural structure in water scarce areas. Some other influential factors should also be considered in deciding the planting structures besides water factor, like planting conditions, farmers’ habits, cultural and climatic change [60,61,62]. Therefore, the above suggestions from the perspective of the water footprint strategy may be limited.
At the same time, the pressure of water scarcity on agriculture productions should be evaluated more accurately [63]. However, in this current study, we only calculated annual WPIblue at prefecture level due to the lack of data. In our future work, we will adopt remote sensing technology to assess monthly WPIblue at a higher spatial resolution.

5. Conclusions

Wheat, maize, cotton and groundnut are the main crops in Shandong Province, and the growth of these four crops consumes a great deal of freshwater. This study calculated the WFs of four crops from 1989 to 2016 in Shandong Province and analyzed the spatial distribution of WFs in different rainfall years. The results showed that cotton had the highest WF among the selected crops in 1989–2016. The total annual WF of four crops exhibited a slight decrease over time. Different types of rainfall year had great influences on WFs. During the three years, the areas with higher WF for wheat were found in Weihai, Yantai and Linyi. Therefore, the planting area of wheat should be reduced in these regions. The WF of maize was higher in Qingdao, Binzhou and Jinan. Similarly, the planting area of maize in these regions should also be controlled. The areas with higher WF for cotton were distributed in Dongying, Binzhou and Dezhou. In addition, Dongying, Yantai and Weihai were higher value areas of groundnut WF. Finally, the spatial distribution of WPIblue indicated that agricultural productions were facing the threat of water scarcity in most regions of Shandong Province. Therefore, in order to realize efficient utilization of water resources, it was urgent to reasonably adjust the planting structure of agriculture according to the local water resources. However, it should be noted that several uncertainties remain in this current study, which may be resulted from the calculation models, study periods, climatic conditions and soil texture, etc. Despite these uncertainties, the results will help to assess the problem of water scarcity and to provide valuable suggestions for sustainable utilization of water resources in Shandong Province. In our future study, we will adopt remote sensing technology and develop a comprehensive evaluation method to estimate water footprint more accurately on a large scale and study the flow of water footprint among different regions.

Author Contributions

M.F., B.G., W.W. and J.W. carried out the calculation, result analysis and drafted the manuscript, which was revised by all authors. All authors gave their approval of the version submitted for publication.

Funding

This work was supported by National Natural Science Foundation of China (41807170, 31371574), Natural Science Foundation of Shandong Province (ZR2017BD021), SDUST Research Fund (2014TDJH101) and the Doctor Star-up Foundation of Qingdao Agricultural University (663/1117012).

Acknowledgments

We appreciate the editors and the reviewers for their constructive suggestions and insightful comments, which helped us greatly to improve this manuscript.

Conflicts of Interest

The authors declare no conflict of interest.

References

  1. Guo, B.; Chen, Y.N.; Shen, Y.J.; Li, W.H.; Wu, C.B. Spatially explicit estimation of domestic water use in the arid region of northwestern China: 1985–2009. Hydrol. Sci. J. 2013, 58, 162–176. [Google Scholar] [CrossRef] [Green Version]
  2. Shrestha, S.; Pandey, V.P.; Chanamai, C.; Ghosh, D.K. Green, Blue and Grey Water Footprints of Primary Crops Production in Nepal. Water Resour. Manag. 2013, 27, 5223–5243. [Google Scholar] [CrossRef]
  3. OECD. OECD Environmental Outlook to 2050: The Consequences of Inaction; OECD: Paris, France, 2012. [Google Scholar]
  4. Chapagain, A.K.; Hoekstra, A.Y. Water Footprints of Nations; Value of Water Research Report Series No. 16; UNESCO-IHE: Delft, The Netherlands, 2004. [Google Scholar]
  5. Zhuo, L.; Mekonnen, M.M.; Hoekstra, A.Y. Sensitivity and uncertainty in crop water footprint accounting: A case study for the Yellow River basin. Hydrol. Earth Syst. Sci. 2014, 18, 2219–2234. [Google Scholar] [CrossRef]
  6. Miglietta, P.P.; Leo, F.D.; Toma, P. Environmental Kuznets curve and the water footprint: An empirical analysis. Water Environ. J. 2016, 31, 20–30. [Google Scholar] [CrossRef]
  7. Hoekstra, A.Y.; Chapagain, A.K.; Aldaya, M.M.; Mekonnen, M.M. The Water Footprint Assessment Manual: Setting the Global Standard; Earthscan: London, UK, 2011. [Google Scholar]
  8. Hoekstra, A.Y.; Chapagain, A.K. The blue, green and grey water footprint of rice from production and consumption perspectives. Ecol. Econ. 2011, 70, 749–758. [Google Scholar]
  9. Sun, S.K.; Wu, P.T.; Wang, Y.B.; Zhao, X.N. The virtual water content of major grain crops and virtual water flows between regions in China. J. Sci. Food Agric. 2013, 93, 1427–1437. [Google Scholar] [CrossRef]
  10. Cao, X.C.; Wu, P.T.; Wang, Y.B.; Zhao, X.N. Assessing blue and green water utilisation in wheat production of China from the perspectives of water footprint and total water use. Hydrol. Earth Syst. Sci. 2014, 18, 3165–3178. [Google Scholar] [CrossRef] [Green Version]
  11. Suttayakul, P.; Aran, H.; Suksaroj, C.; Mungkalasiri, J.; Wisansuwannakorn, R.; Musikavong, C. Water footprints of products of oil palm plantations and palm oil mills in Thailand. Sci. Total Environ. 2016, 542, 521–529. [Google Scholar] [CrossRef] [PubMed]
  12. Sun, S.; Wu, P.; Wang, Y.; Zhao, X.; Liu, J.; Zhang, X. The impacts of interannual climate variability and agricultural inputs on water footprint of crop production in an irrigation district of China. Sci. Total Environ. 2013, 444, 498–507. [Google Scholar] [CrossRef]
  13. Xu, Y.; Huang, K.; Yu, Y.; Wang, X. Changes in water footprint of crop production in Beijing from 1978 to 2012: A logarithmic mean Divisia index decomposition analysis. J. Clean. Prod. 2015, 87, 180–187. [Google Scholar] [CrossRef]
  14. Marano, P.R.; Filippi, A.R. Water Footprint in paddy rice systems. Its determination in the provinces of Santa Fe and Entre Rios, Argentina. Ecol. Indic. 2015, 56, 229–236. [Google Scholar] [CrossRef]
  15. Su, M.H.; Huang, C.H.; Li, W.Y.; Tso, C.T.; Lur, H.S. Water footprint analysis of bioethanol energy crops in Taiwan. J. Clean. Prod. 2015, 88, 132–138. [Google Scholar] [CrossRef]
  16. Lu, Y.; Zhang, X.; Chen, S.; Shao, L.; Sun, H. Changes in water use efficiency and water footprint in grain production over the past 35 years: A case study in the North China Plain. J. Clean. Prod. 2016, 116, 71–79. [Google Scholar] [CrossRef]
  17. Chu, Y.M.; Shen, Y.J.; Yuan, Z.J. Water footprint of crop production for different crop structures in the Hebei southern plain, North China. Hydrol. Earth Syst. Sci. 2017, 21, 3061–3069. [Google Scholar] [CrossRef] [Green Version]
  18. Martinezaldaya, M.; Llamas, M.R. Water Footprint Analysis (Hydrologic and Economic) of the Guadiana River Basin; Value of Water Research Report 35, No. 3; UNESCO-IHE Institute for Water Education: Delft, The Netherlands, 2009. [Google Scholar]
  19. Zeng, Z.; Liu, J.; Koeneman, P.H.; Zarate, E.; Hoekstra, A.Y. Assessing water footprint at river basin level: A case study for the Heihe River Basin in northwest China. Hydrol. Earth Syst. Sci. 2012, 16, 2771–2781. [Google Scholar] [CrossRef]
  20. Bocchiola, D.; Nana, E.; Soncini, A. Impact of climate change scenarios on crop yield and water footprint of maize in the Po valley of Italy. Agric. Water Manag. 2013, 116, 50–61. [Google Scholar] [CrossRef]
  21. Denis, D.M.; Kumar, M.; Srivastava, S.; Suryavanshi, S.; Denis, A.F.; Singh, R.; Yadav, A.; Mishra, H. A High Resolution Assessment of Water Footprint of Wheat to Understand Yield and Water Use Heterogeneity. Water Resour. Manag. 2016, 30, 2641–2649. [Google Scholar] [CrossRef]
  22. Roux, B.L.; Laan, M.V.D.; Vahrmeijer, T.; Bristow, K.L.; Annandale, J.G. Establishing and testing a catchment water footprint framework to inform sustainable irrigation water use for an aquifer under stress. Sci. Total Environ. 2017, 599–600, 1119–1129. [Google Scholar] [CrossRef]
  23. Jing, M.; Hoekstra, A.Y.; Hao, W.; Chapagain, A.K.; Dangxian, W. Virtual versus real water transfers within China. Philos. Trans. R. Soc. B-Biol. Sci. 2006, 361, 835–842. [Google Scholar]
  24. Bulsink, F.; Hoekstra, A.Y.; Booij, M.J. The water footprint of Indonesian provinces related to the consumption of crop products. Hydrol. Earth Syst. Sci. 2010, 14, 119–128. [Google Scholar] [CrossRef] [Green Version]
  25. Wang, W.; Yu, Z.; Zhang, W.; Shao, Q.; Zhang, Y.; Luo, Y.; Jiao, X.; Xu, J. Responses of rice yield, irrigation water requirement and water use efficiency to climate change in China: Historical simulation and future projections. Agric. Water Manag. 2014, 146, 249–261. [Google Scholar] [CrossRef]
  26. Wang, Y.B.; Wu, P.T.; Engel, B.A.; Sun, S.K. Application of water footprint combined with a unified virtual crop pattern to evaluate crop water productivity in grain production in China. Sci. Total Environ. 2014, 497–498, 1–9. [Google Scholar] [CrossRef] [PubMed]
  27. Cao, X.; Pute, W.U.; Wang, Y.; Zhao, X. Water Footprint of Grain Product in Irrigated Farmland of China. Water Resour. Manag. 2014, 28, 2213–2227. [Google Scholar] [CrossRef]
  28. Wang, Y.B.; Wu, P.T.; Engel, B.A.; Sun, S.K. Comparison of volumetric and stress-weighted water footprint of grain products in China. Ecol. Indic. 2015, 48, 324–333. [Google Scholar] [CrossRef]
  29. Zhuo, L.; Mekonnen, M.M.; Hoekstra, A.Y.; Wada, Y. Inter- and intra-annual variation of water footprint of crops and blue water scarcity in the Yellow River basin (1961–2009). Adv. Water Resour. 2016, 87, 29–41. [Google Scholar] [CrossRef]
  30. Lamastra, L.; Miglietta, P.P.; Toma, P.; Leo, F.D.; Massari, S. Virtual water trade of agri-food products: Evidence from italian-chinese relations. Sci. Total Environ. 2017, 599–600, 474–482. [Google Scholar] [CrossRef]
  31. Doll, P.; Siebert, S. Quantifying blue and green virtual water contents in global crop production as well as potential production losses without irrigation. J. Hydrol. 2010, 384, 198–217. [Google Scholar]
  32. Mekonnen, M.M.; Hoekstra, A.Y. The green, blue and grey water footprint of crops and derived crop products. Hydrol. Earth Syst. Sci. 2011, 15, 1577–1600. [Google Scholar] [CrossRef] [Green Version]
  33. Mekonnen, M.M.; Hoekstra, A.Y. Water footprint benchmarks for crop production: A first global assessment. Ecol. Indic. 2014, 46, 214–223. [Google Scholar] [CrossRef] [Green Version]
  34. Hoekstra, A.Y.; Mekonnen, M.M. The water footprint of humanity. Proc. Natl. Acad. Sci. USA 2012, 109, 3232–3237. [Google Scholar] [CrossRef] [Green Version]
  35. Lovarelli, D.; Bacenetti, J.; Fiala, M. Water Footprint of crop productions: A review. Sci. Total Environ. 2016, 548–549, 236–251. [Google Scholar] [CrossRef]
  36. Gobin, A.; Kersebaum, K.C.; Eitzinger, J.; Trnka, M.; Hlavinka, P.; Takáč, J.; Kroes, J.; Ventrella, D.; Marta, A.D.; Deelstra, J.; et al. Variability in the water footprint of arable crop production across European regions. Water 2017, 9, 93. [Google Scholar] [CrossRef]
  37. Chapagain, A.K.; Hoekstra, A.Y.; Savenije, H.H.G.; Gautam, R. The water footprint of cotton consumption: An assessment of the impact of worldwide consumption of cotton products on the water resources in the cotton producing countries. Ecol. Econ. 2006, 60, 186–203. [Google Scholar] [CrossRef]
  38. Chen, W.; Wu, S.; Lei, Y.; Li, S. China’s water footprint by province, and inter-provincial transfer of virtual water. Ecol. Indic. 2017, 74, 321–333. [Google Scholar] [CrossRef]
  39. Marston, L.; Konar, M. Drought impacts to water footprints and virtual water transfers of the Central Valley of California. Water Resour. Res. 2017, 53, 5756–5773. [Google Scholar] [CrossRef]
  40. Shen, Y.J.; Oki, T.; Utsumi, N.; Kanae, S.; Hanasaki, N. Projection of future world water resources under SRES scenarios: Water withdrawal. Hydrolog. Sci. J. 2008, 53, 11–33. [Google Scholar] [CrossRef]
  41. Ministry of Water Resources of the People’s Republic of China. Available online: http://www.mwr.gov.cn/sj/tjgb/szygb/201811/t20181116_1055003.html (accessed on 10 March 2019).
  42. Chinese Government Network. Available online: http://www.gov.cn/guoqing/2018-01/17/content_5257529.htm (accessed on 10 March 2019).
  43. Yu, C. Study on Regional Difference of Production Water Footprint of Main Crop Based on Cropwat in Shandong Province. Master’s Thesis, Shandong Normal University, Jinan, China, 2014. [Google Scholar]
  44. Gao, T. Industrial Structure Adjustment of Agriculture in Shandong Province Based on Virtual Water Theory. Master’s Thesis, Nanjing Agricultural University, Nanjing, China, 2010. [Google Scholar]
  45. Water Resources Department of Shandong Province. Available online: http://www.sdwr.gov.cn/zwgk/ggsjkf/sjkfml/szygb/ (accessed on 10 March 2019).
  46. Li, H.; Qin, L.; He, H. Characteristics of the water footprint of rice production under different rainfall years in Jilin Province, China. J. Sci. Food Agric. 2018, 98, 3001–3013. [Google Scholar] [CrossRef] [PubMed]
  47. National Meteorological Information Center of China Meteorological Administration. Available online: http://data.cma.cn/ (accessed on 10 March 2019).
  48. Shandong Provincial Bureau of Statistics. Shandong Statistical Yearbook (1990–2017); China Statistics Press: Beijing, China, 2017. [Google Scholar]
  49. FAO Database. Available online: http://www.fao.org/nr/water/infores_databases_cropwat.html (accessed on 10 March 2019).
  50. EPA. List of Drinking Water Contaminants: Ground Water and Drinking Water; US Environmental Protection Agency: Washington, DC, USA, 2005.
  51. Zhao, R.; Chen, X.; Zhang, F. Nitrogen cycling and balance of winter wheat-summer maize rotation system in North China. Acta Pedol. Sin. 2009, 46, 684–697. [Google Scholar]
  52. Allen, R.G.; Pereira, L.S.; Raes, D.; Smith, M. Crop Evapotranspiration: Guidelines for Computing Crop Water Requirements; FAO Irrigation and Drainage Paper No. 56; FAO: Rome, Italy, 1998. [Google Scholar]
  53. Ma, X.; Ma, Y. The spatiotemporal variation analysis of virtual water for agriculture and livestock husbandry: A study for Jilin Province in China. Sci. Total Environ. 2017, 586, 1150–1161. [Google Scholar] [CrossRef] [PubMed]
  54. Hoekstra, A.Y.; Mekonnen, M.M.; Chapagain, A.K.; Mathews, R.E.; Richter, B.D. Global Monthly Water Scarcity: Blue Water Footprints versus Blue Water Availability. PLoS ONE 2012, 7, e32688. [Google Scholar] [CrossRef]
  55. Cheng, Y.; Cao, S.; Yang, Y.; Li, X. Analysis of agricultural water footprint cycle and trend change in Shandong Province. South-to-North Water Transf. Water Sci. Technol. 2018, 16, 169–175. [Google Scholar]
  56. Li, S. Virtual Water and the Optimization of Industrial Structure of Agriculture in Shandong Province. Master’s Thesis, Shandong Agricultural University, Tai’an, China, 2007. [Google Scholar]
  57. Pietrucha-Urbanik, K.; Tchórzewska-Cieslak, B. Water supply system operation regarding consumer safety using kohonen neural network. In Safety, Reliability and Risk Analysis: Beyond the Horizon; Steenbergen, R.D.J.M., van Gelder, P.H.A.J.M., Miraglia, S., Vrouwenvelder, A.C.W.M., Eds.; Taylor & Francis Group: London, UK, 2014; pp. 1115–1120. [Google Scholar]
  58. Fusco, G.; Miglietta, P.P.; Porrini, D. How Drought Affects Agricultural Insurance Policies: The Case of Italy. J. Sustain. Dev. 2018, 11, 1. [Google Scholar] [CrossRef]
  59. Pietrucha-Urbanik, K.; Żelazko, A. Approaches to Assess Water Distribution Failure. Period. Polytech. Civ. 2017, 61, 632–639. [Google Scholar] [CrossRef]
  60. Cai, Y.L. Vulnerability and adaptation of Chinese agriculture to global climate change. Chin. Geogr. Sci. 1997, 7, 289–301. [Google Scholar] [CrossRef]
  61. Ye, Y.; Fang, X.Q. Boundary shift of potential suitable agricultural area in farming-grazing transitional zone in northeastern China under background of climate change during 20th century. Chin. Geogr. Sci. 2013, 23, 655–665. [Google Scholar] [CrossRef]
  62. Guo, B.; Li, W.H.; Guo, J.Y.; Chen, C.F. Risk assessment of regional irrigation water demand and supply in an arid inland river basin of northwestern China. Sustainability 2015, 7, 12958–12973. [Google Scholar] [CrossRef]
  63. Mekonnen, M.M.; Hoekstra, A.Y. Four billion people facing severe water scarcity. Sci. Adv. 2016, 2, e1500323. [Google Scholar] [CrossRef] [Green Version]
Figure 1. Digital Elevation Model (DEM) and locations of meteorological stations and prefecture-level regions in Shandong Province.
Sustainability 11 01856 g001
Figure 2. Selection of typical years in this study.
Sustainability 11 01856 g002
Figure 3. Framework to calculate the water footprint (WF) of crop production in this study.
Sustainability 11 01856 g003
Figure 4. Temporal changes of the WFgreen, WFblue, WFgrey and yields for (a) wheat, (b) maize, (c) cotton and (d) groundnut during 1989–2016 in Shandong Province.
Sustainability 11 01856 g004
Figure 5. Spatial distribution of (ac) WFgreen, (df) WFblue and (gi) WFgrey for wheat in 1990, 2002 and 2016 in Shandong Province.
Sustainability 11 01856 g005
Figure 6. Spatial distribution of (ac) WFgreen, (df) WFblue and (gi) WFgrey for maize in 1990, 2002 and 2016 in Shandong Province.
Sustainability 11 01856 g006
Figure 7. Spatial distribution of (ac) WFgreen, (df) WFblue and (gi) WFgrey for cotton in 1990, 2002 and 2016 in Shandong Province.
Sustainability 11 01856 g007
Figure 8. Spatial distribution of (ac) WFgreen, (df) WFblue and (gi) WFgrey for groundnut in 1990, 2002 and 2016 in Shandong Province.
Sustainability 11 01856 g008
Figure 9. Temporal changes of the annual total WF and WFblue for (a) wheat, (b) maize, (c) cotton and (d) groundnut during 1989–2016 in Shandong Province.
Sustainability 11 01856 g009
Figure 10. Temporal changes of the total annual WF, WFblue for four main crops and total water resources in Shandong Province.
Sustainability 11 01856 g010
Figure 11. Spatial distribution of the blue water pressure index (WPIblue) in (a) 2015 and (b) 2016 in Shandong Province.
Sustainability 11 01856 g011
Figure 12. Comparison of estimated WFs of crops with the results from previous studies in Shandong Province. Each data point refers to the WF of a crop. Period: 1995–2008 for Gao, 2005 for Li and 1978–2014 for Cheng et al.
Sustainability 11 01856 g012

