Article

Evaluation of the Development Capability of the New Energy Vehicle Industry: An Empirical Study from China

School of Economics and Management, Harbin Engineering University, Harbin 150001, China
*
Author to whom correspondence should be addressed.
Sustainability 2019, 11(9), 2635; https://doi.org/10.3390/su11092635
Submission received: 12 April 2019 / Revised: 28 April 2019 / Accepted: 1 May 2019 / Published: 8 May 2019

Abstract

:
In order to alleviate the pressures of environmental pollution and the energy crisis, and to lay out and capture huge emerging markets as soon as possible, all countries in the world are vigorously developing new energy vehicles (NEVs). This paper analyzes the factors influencing the development capability of the NEV industry from the aspects of autonomy, controllability, and stability, and constructs an evaluation index system. Based on the improved entropy method and the catastrophe progression method, we establish an evaluation model for the development capability of China’s NEV industry and comprehensively evaluate the development capability of 15 new energy auto companies. An empirical analysis finds that the outlook for the overall development capability of China’s NEV industry is not optimistic, and there is a big gap in the industry, lacking core technology and independent innovation capability. We propose countermeasures such as increasing research and development (R&D) investment and innovation, and improving policy support.

1. Introduction

With increasing environmental pollution, especially increases in the urban air pollution index and hazy weather, environmental pollution and the energy crisis have become worldwide problems. Low-carbon environmental protection has gradually become the focus of attention in all countries. The continuous increase of traditional fuel vehicles has led to excessive consumption of nonrenewable energy and emission of pollutants, and severely damaged the living environment [1]. As a result, more countries are developing and using sustainable energy as an alternative in order to protect the environment [2]. The rapid development of new energy vehicles (NEVs) can largely alleviate the pressure on energy and the environment. Promoting technological innovation and transformation and upgrading the NEV industry have become important strategic moves in all countries [3]. In 2017, European countries announced that they would stop selling traditional fuel vehicles between 2025 and 2050 [4]. In 2018, automobile manufacturers such as China Chang’an Automobile, Beiqi Group, and Haima Automobile also indicated that they would eliminate traditional fuel vehicles by 2025 [5]. While reducing energy consumption and pollution emissions, transforming and upgrading the NEV industry will also be accomplished [6].
In order to alleviate the increasingly prominent contradiction between environmental pollution and energy supply, China is vigorously developing and popularizing NEVs [
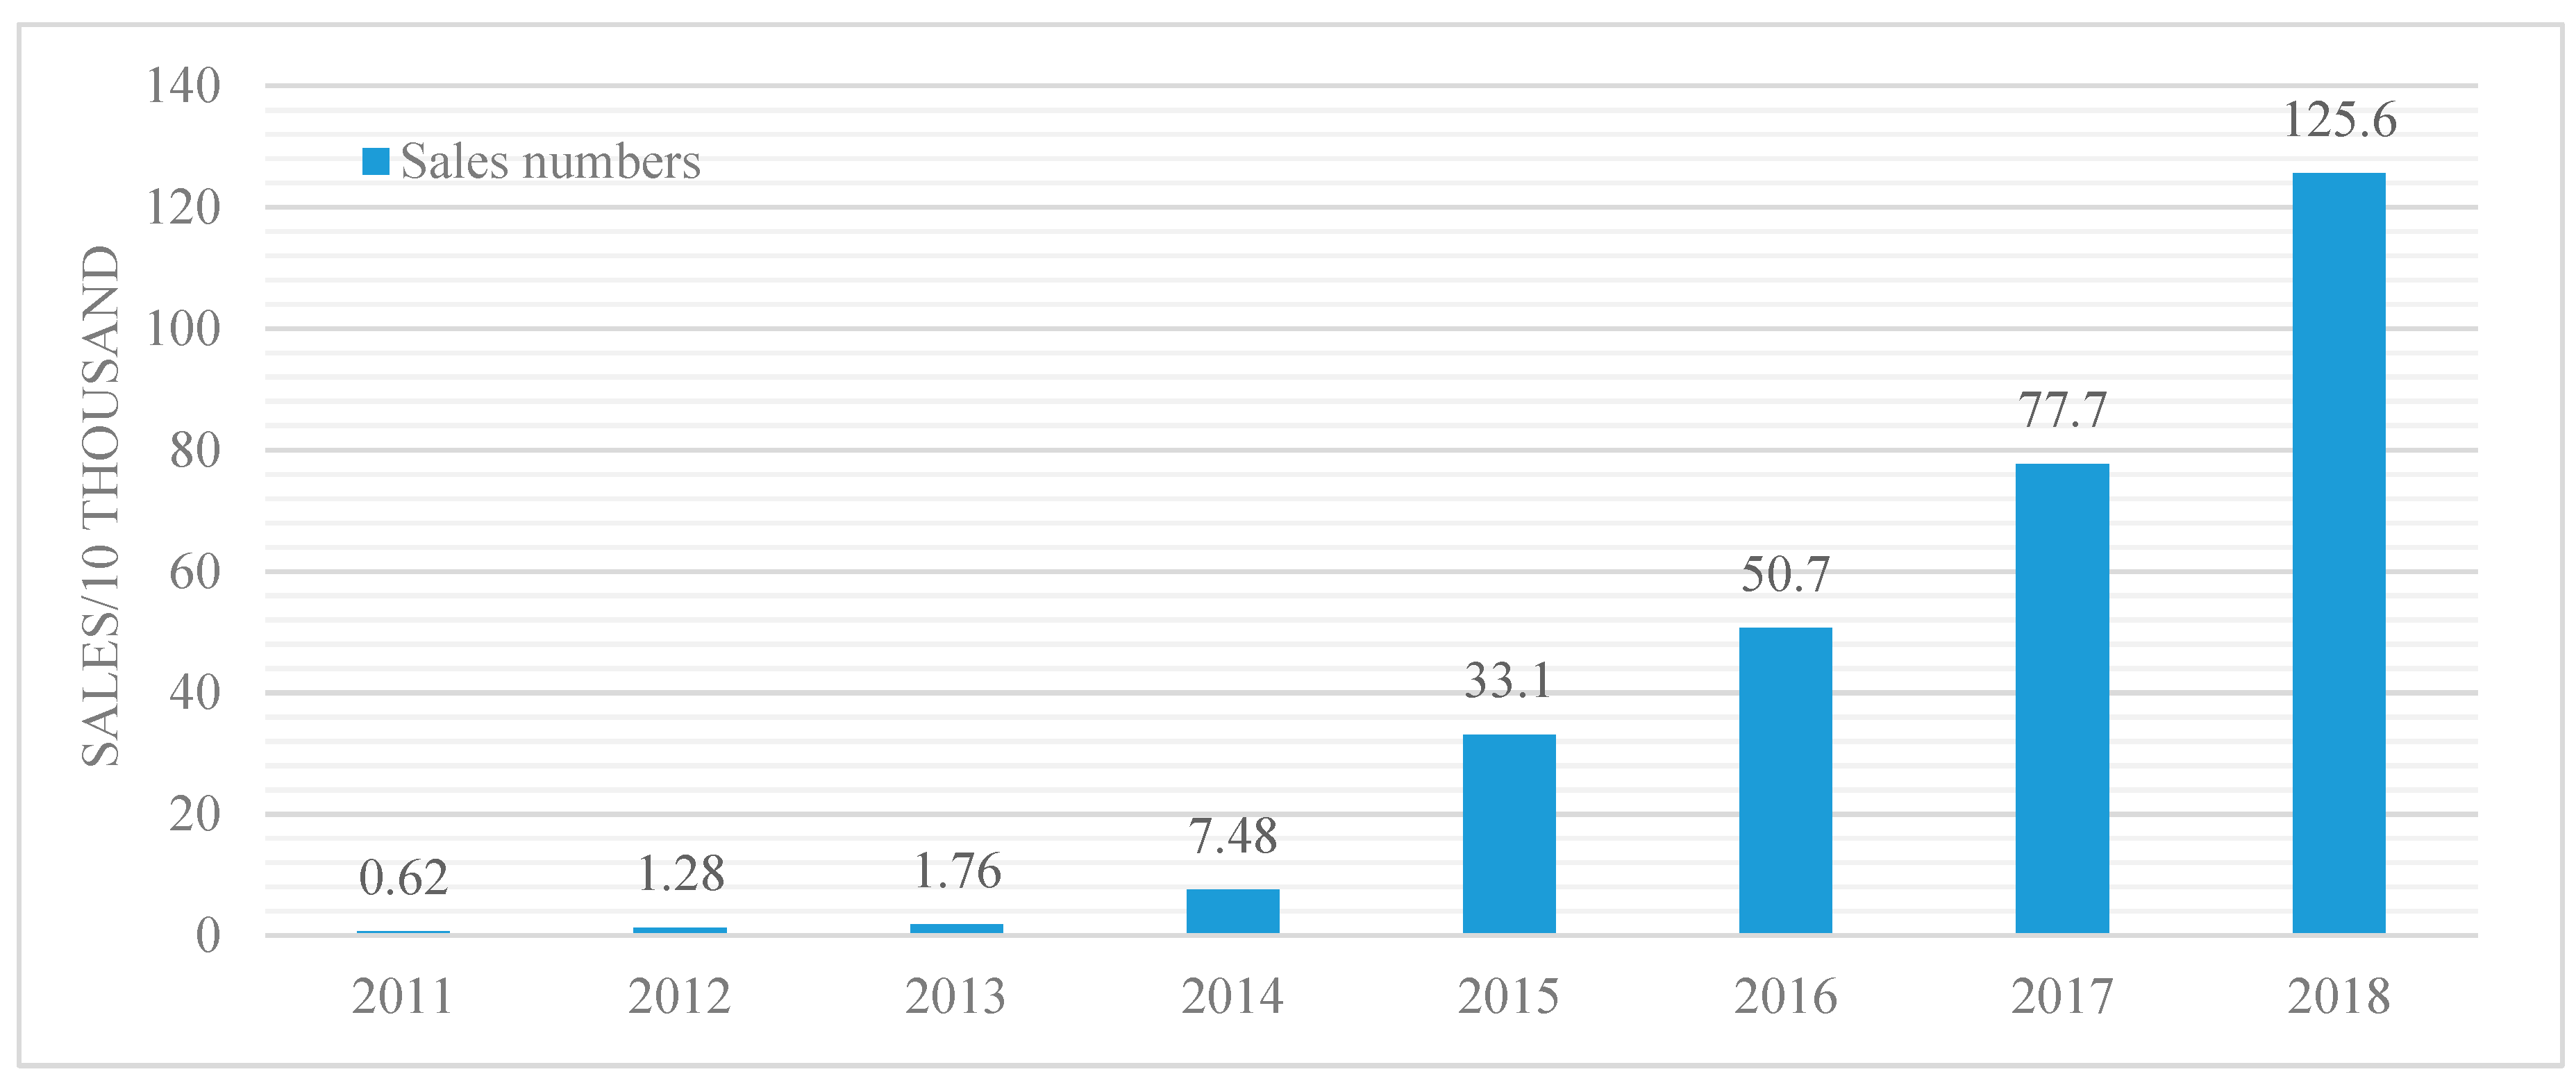
7]. In recent years, China’s NEV industry has shown a rapid development trend (Figure 1). The data show that in 2018, the sales volume of NEVs in China was 1.256 million units, an increase of 61.7% year-on-year [8]. The sales volume ranks first in the world, as the world’s largest NEV market [8]. However, there is still a problem in that the proportion of NEVs among total vehicle sales is not very high. The core technologies for the manufacture of NEVs have not yet fully addressed the outstanding problems that need to be solved, such as autonomy and control [9]. With the proposed concept of “Made in China 2025,” the comprehensive strength of intelligent manufacturing of China’s new energy equipment has been significantly improved, especially in the rapid rise of NEVs, which is gradually catching up with the pace of developed countries [10]. At present, the level of development of China’s high-tech industry is still far from that of developed countries, so the development of NEVs has also encountered bottlenecks [11]. This also reveals that China is insufficient in terms of independent innovation, and it lacks autonomous and controllable core products. The core technologies are still subject to human malpractice.
Traditional cars will still dominate consumption in the next 30 years (see the technical roadmap of the key areas of “Made in China 2025” for details). The rapid spread of NEVs can greatly alleviate the pressure brought by energy and the environment. Therefore, NEVs will have a broad market and will become a key industry in the world [12]. The energy revolution, consumption upgrades, market competition, and other factors have prompted the rapid development of NEVs to become a strategic emerging industry worldwide [13]. In order to alleviate the energy and environmental crises and seize market dividends, all countries consider self-determination, controllability, safety, and stability as the basic principles for the development of NEVs [14]. Many countries have had outstanding achievements in innovation and exploration, independent key technology research and development, and enhancement of core competitiveness [15]. Although China temporarily ranks first in the sales of NEVs, its core technology lacks independent controllability, which is big but not strong. At any time, it may lose its rapidly developing and huge NEV market without the support of other countries. A comprehensive evaluation of the development capability of the NEV industry can objectively describe its current status, determine the current problems, and then propose targeted countermeasures to promote innovation and development.
The remainder of the paper is arranged as follows: the second section provides a literature review and research framework. The third section introduces research methods and data resources. We conduct an empirical analysis of the development capabilities of China’s NEV industry in the fourth section. The fifth section discusses the influencing factors and conducts a robustness test. In the last part, we summarize the conclusions and propose new measures to adopt.

2. Literature Review

NEVs are different from traditional fuel-powered vehicles, in that they use unconventional fuel as their power source [16]. “Made in China 2025” defines the concept of NEVs [17]. According to the concept, NEVs include hybrid electric vehicles (HEVs), especially plug-in hybrid electric vehicles (PHEVs), battery electric vehicles (BEVs), and fuel cell vehicles (FCVs) [15]. This concept sometimes leads to a wider range of vehicle technologies, such as alternative fuel vehicles (AFVs) [18].
NEVs started earlier in countries in Europe and in the United States. The US Department of Energy began funding research and development of electric vehicles in 1993, providing financial support for the research and development (R&D) of advanced rechargeable batteries and fuel cells [19]. The most important thing for emerging economies in terms of NEVs is innovation. We should increase our focus on technological innovation to increase our degree of autonomy and control [20]. The government playing a role in developing alternatives to traditional fuel vehicles, the effectiveness of government programs, and the flexibility of technology in government support programs are also essential [21]. NEVs are becoming increasingly intelligent, driving new developments in the field of intelligent transportation systems and improving the ability of independent control to ensure market competitiveness [22,23]. In addition, a high degree of autonomous control can shorten the cycle of results conversion in the new energy sector and reduce the initial cost of discovery [24]. Studies have shown that the electric vehicle market grew by 40% year-on-year in 2018, and manufacturing is possible with core components such as traction motors that are independently developed and safe [25].
As one of the major countries in the development of NEVs, China faces many difficulties and challenges [26]. It must accelerate the industrialization of energy-saving and independent innovations of NEVs [27]. The most important obstacle in China at present is the lack of skilled scientists, while legal and institutional barriers have also hindered further development of the new energy industry [28,29]. China’s NEV manufacturing enterprises have not broken through the key technologies of complete vehicles and some core components, and the cost of products is high [30]. It is necessary to focus on solving the autonomy of key components and gradually build an intelligent networked automobile industry chain to realize the strategic goal of being an automobile manufacturing powerhouse [31]. Under the new economic normal, NEV manufacturers need to support government subsidies, encourage innovation and other policies [32], improve the industrial chain, and attract social capital to promote the expansion and technological progress of NEV manufacturing [33]. In view of the many problems that exist in the independent innovation of NEV manufacturing enterprises, some scholars have proposed increasing government support [34], establishing their own technology systems [35], developing leading enterprises [36], unifying common standards [37], and formulating roadmaps for technological development [38]. Improving the independent innovation capability of China’s NEV manufacturing enterprises needs to start from the three levels of enterprises, industries, and countries [39].
From a global perspective, many countries have given policy support to the development of NEVs [10]. The United States and Germany have clearly defined the goal of developing NEVs [40]. In recent years, China has also formulated a number of policies to support the development of NEVs [41]. In fact, as early as 2009, China’s industry adjustment plan has had incentive policies for NEVs [42]. However, the original policy did not take into account the classification of NEVs [43]. With the development of NEVs, HEVs, FCVs, and pure electric vehicles have gradually become the focus of attention [44]. The policies developed by countries have also changed with changes of NEV types [45]. In the last decade, NEVs have undergone a process of shifting from the laboratory to the market [46]. With the gradual development of the industry, the NEV industry achieved rapid growth in 2018, so this is also known as the first year of NEVs [47]. In recent years, China’s NEV industry has achieved rapid development and has become the world’s largest NEV market, thanks to the diversification of government policies [48].
Most studies have analyzed the necessity and influencing factors of developing NEVs, and proposed countermeasures from different angles. However, most of the research is limited to one or several influencing factors, and few of these factors are combined to comprehensively evaluate the development capabilities of the NEV industry. In addition, qualitative research methods are mostly used, and quantitative empirical analysis is used less. Based on previous research of experts and scholars [49,50] and various research methods such as improved entropy and catastrophe progression methods, this paper constructs an industry development capability evaluation index system and empirically analyzes 15 Chinese NEV manufacturers as samples, makes a relatively objective and comprehensive evaluation of the development capacity of China’s NEV industry, and performs cluster analysis of the comprehensive evaluation results to provide a certain theoretical basis for the upgrading of China’s NEV industry and policy formulation.

3. Research Methods

3.1. Research Design

Since the Energy Conservation and New Energy Vehicle Industry Development Plan (2012–2020) was issued by the State Council in 2012 [51], the number of NEV manufacturing companies in China has continued to grow. Most of these companies invest in a lot of R&D to research and produce key components of new energy vehicles to obtain government subsidies [52]. Only 15 companies have met the qualifications for NEV production [53]. Therefore, we selected these 15 companies as samples, and collected data on each indicator according to the evaluation index system of the NEV industry development capability. Since the ranges of values and unit dimensions between the various indicators are different, direct calculation will cause large deviations in the results [54], so we first standardized the raw data before analysis. The weights of the indices in our development capability evaluation index system are different. We used the improved entropy method to calculate the weight of each index, and then constructed a mutation system model [55]. The advantages and development direction of each new energy vehicle manufacturing company are different. It is difficult to comprehensively measure a company by relying on one indicator. Therefore, we used the catastrophe progression method to quantify the indicators of each layer of China’s NEV industry development capability mutation system model, and comprehensively evaluated the indicators to obtain a ranking of each company. In order to understand the development capability of China’s NEV industry from a macro perspective, we used cluster analysis to further cluster the 15 companies based on the evaluation results [56] and obtain more intuitive analysis results.

3.2. Deviation Standardization Method

This paper uses the standardization of dispersion to deal with the raw data of the evaluation index of NEV industry development capability: x i j represents the raw data of index j of enterprise i , max ( x i j ) represents the maximum value of the indicator, max ( x i j ) represents the minimum value of the indicator, and x i j represents the standardized data, x i j [ 0 , 1 ]
x i j = x i j min ( x i j ) max ( x i j ) min ( x i j )

3.3. Improved Entropy Method

The entropy method is an objective method of weighting the index based on the information size of indicator data. The traditional entropy method introduces the concept of a logarithm and entropy in the calculation. Negative and extremum will have a certain influence on the operation result. In order to make the empowerment more objective and precise, this paper makes some improvements to the entropy method with reference to other scholars’ research; first of all, the raw data is dimensionless [57].
Assume that there are n enterprises in the evaluation model of the development capability of the NEV industry, m evaluation indicators, and the original indicator data matrix is
A = ( x i j ) n × m
After the dispersion is normalized, the raw data is in the range of (0, 1), eliminating the influence of negative and extreme values, and the normalized data is represented by x i j .
Calculate the proportion of indicator x i j
p i j = x i j i = 1 m x i j
Calculate the entropy of the m indicator
e j = ( 1 ln m ) i = 1 m p i j ln p i j
Calculate the weight of the m indicator
w j = 1 e j j = 1 n ( 1 e j )
Define d j = 1 e j as the information utility value for the j indicator. For the evaluation system of the multilayer structure, the additivity of entropy can be used to calculate the weight of the corresponding upper structure according to the index information utility value of the lower structure, summing the information utility value of each type of indicator of the underlying structure. Defined as D k (k = 1, 2, … k), the sum of all indicator utility values is
D = k D k = j = 1 n d j
The weight of the k th subsystem is
w k = D k / D

3.4. Catastrophe Progression Method

The catastrophe progression method combines qualitative and quantitative methods, which not only reduces subjectivity, but also loses scientificity and rationality. The calculation is relatively simple, the evaluation results are reliable, and it is often used for multiobjective evaluation and decision-making [58].
  • Construct a mutant system model—According to the intrinsic mechanism of the system, the general indicators are decomposed into multilevel primary and secondary contradictions, and the first and second columns are arranged into inverted tree structures until they are decomposed into measurable indicators. On the basis of determining the weight of each index, the indicators are arranged from left to right according to weight. The commonly used mutation models are spire type, dovetail type, and butterfly type, and their potential functions are as follows.
    Point mutation system model:
    f ( x ) = x 4 + a x 2 + b x
    Swallowtail mutation system model:
    f ( x ) = 1 5 x 5 + 1 3 a x 3 + b x 2 + c x
    Butterfly mutation system model:
    f ( x ) = 1 6 x 6 + 1 4 a x 4 + 1 3 b x 3 + 1 2 c x 2 + d x
    where f ( x ) denotes the potential function of the state variable x of the mutation system, and the coefficients a , b , c , d of the state variable x denote the control variables of the state variable.
  • Derive a normalized formula from the divergence equation of the catastrophe system model—Assuming that the equilibrium surface formed by all critical points of the potential function f ( x ) of the mutant system is Q , find the first derivative f ( x ) = 0 and the second derivative f ( x ) = 0 for f ( x ) that can obtain the equilibrium surface equation and the corresponding singular point set. The combination of f ( x ) = 0 and f ( x ) = 0 can be used to obtain the divergence point set equation. The three commonly used catastrophe model bifurcation point set equations are as follows.
    Point mutation system model bifurcation point set equation:
    a = - 6 x 2 , b = 8 x 3
    Dovetail mutation system model bifurcation point set equation:
    a = - 6 x 2 , b = 8 x 3 ,   c = - 3 x 4
    Butterfly mutation system model bifurcation point set equation:
    a = - 6 x 2 , b = 8 x 3 ,   c = - 3 x 4 ,   d = 5 x 5
    Thus, the normalization formula of three kinds of mutation system models can be obtained.
    Canonical formula of point mutation system model:
    x a = a 1 2 ,   x b = b 1 3
    Canonical formula of swallowtail mutation system model:
    x a = a 1 2 ,   x b = b 1 3 ,   x c = c 1 4
    Canonical formula of butterfly mutation system model:
    x a = a 1 2 ,   x b = b 1 3 ,   x c = c 1 4 ,   x d = d 1 5
  • Calculate and evaluate using the normalized formula—According to the determined number of control variables, the corresponding mutation model is selected, and the normalization formula of different models and the dimensionless data of the lowest level evaluation index are used to calculate the mutation level of the control variable. According to multiobjective fuzzy decision theory, if the indicators are not significantly correlated in the calculation process, the principle of noncomplementarity should be adopted, that is, ‘large and medium take small’. If there is a significant correlation between the indicators, the principle of complementarity should be adopted, that is, ‘average’. The catastrophe progression is calculated step-by-step from the bottom level, and finally the total is obtained for comprehensive evaluation.

3.5. Cluster Analysis

In this paper, we use the K-means algorithm to cluster the comprehensive evaluation results. The idea of the clustering method is to aggregate samples into their nearest mean class, which can optimally cluster one-dimensional data [59]. The key to the K-means algorithm is to choose the criteria for the center of gravity or the sum of squares within the cluster:
J = n = 1 N k = 1 K r n k x n μ k 2
where r n k is 1 when data point n is classified to c l u s t e r k , otherwise it is 0. Since it is difficult to minimize J by looking up r n k and μ k , an iterative method can be used to fix μ k first, find the optimal r n k , then fix r n k and calculate the optimal μ k . Calculate by J to μ k to calculate the condition of μ k when J is minimum
μ k = n r n k x n n r n k
That is to say, μ k should be the mean of the data points in all c l u s t e r k . Because the minimum value is obtained for each iteration, the reduction will not increase, thus ensuring that the algorithm results will eventually get a minimum value. The K-means algorithm can be mainly divided into the following three steps:
  • Roughly divide the sample into K initial classes.
  • Classify each sample into the class represented by the closest center point and calculate the new center point for each class:
    μ k = 1 N k j c l u s t e r k x j
  • Repeat the above steps until the maximum number of steps is iterated or the difference between J values before and after is less than a threshold to get the optimal solution.

4. Empirical Analysis

4.1. Construction of Evaluation Index System for NEV Industry Development Capability

4.1.1. Criteria-Level Indicator

The rapid development of NEVs has effectively alleviated China’s energy and environmental pressures, but there are still shortcomings in terms of a lack of core technologies. The development of the NEV industry chain is not mature enough to restrict the in-depth development of industrialization and marketization. It has not yet fully realized self-control, and it is imperative to promote technological innovation and transformation and upgrading of the automobile industry. Over the years, the ‘four industry bases’—basic raw materials, basic components, advanced basic processes, and industrial technology foundations—have been the bottleneck restricting the development and upgrading of China’s equipment manufacturing industry [60]. The automobile industry has a long chain and wide coverage. As a new industry, NEVs have a long period of R&D and production, and based on long-term demand for capacity supply, it is especially necessary for enterprises to maintain stable and healthy development. We chose autonomy, controllability, and stability as indicators.

4.1.2. Subcriteria-Level Indicator

One of the advantages of developing NEV enterprises is core manufacturing capability with independent innovation. Countries with industry leadership often demonstrate extraordinary adventurism and significant technological innovation to maintain their competitiveness and influence in this area [61]. The quality structure of people is a condition and assumption of a company’s performance and success in the market. In order to ensure competitiveness, the quality, management, and related investment of human resources are the most important interests of the company [62]. Under the global market economy system, competition between countries and industries is becoming more fierce. Having good economic benefits will undoubtedly enable the healthy and sustainable development of enterprises, thus promoting high-quality development of the economy [63]. In terms of policy orientation, national policies can greatly promote and encourage the rapid development of related industries, carry out localization and substitution, create an independent and controllable system, and gradually realize the ambitious goal of manufacturing and building a strong country [64]. Autonomy mainly selects four indicators: independent innovation ability, personnel quality structure, economic benefit level, and policy support.
With the globalization of the market economy, the cruelty of market competition has become more important, and the quality of products has become the key to determining the outcome. Enterprises engaging in production and operation that blindly pursue production and income while neglecting the control of product performance will only gain short-term benefits and lose long-term development [65]. The safety and control of employees are very important in the development of a company. The safety of production is the foundation of a company’s vitality [66]. With the rapid development of network and information technology, information security has become an important factor affecting the economic security and production security of enterprises. The success of information security depends on the information security behavior adopted by enterprises [67]. The controllability mainly includes three indicators: product safety evaluation, personnel controllability, and information security level.
An enterprise’s sustainable development ability determines the vitality of the enterprise. The factors affecting the survival and growth of the enterprise are mainly from three aspects: the business leaders, the enterprise institutions, and the external environment [68]. With the continuous transformation of China’s economic structure and the optimization and upgrading of its industrial structure, the market environment faced by enterprises is becoming more complex, and emergencies are occurring one after another. Enterprises need to have good organizational management capability to cope with unknown risks and maintain a competitive advantage in complex environments in order to win market competition [69]. Stability mainly selects two indicators, sustainable development ability and organizational management ability.

4.1.3. NEV Industry Development Capability Evaluation Index System

In summary, an evaluation index system for the development capability of the NEV industry consists of four levels: target, criteria, subcriteria, and index layers, as shown in Table 1.

4.2. Data Resource

Based on the list of new energy passenger vehicle companies disclosed by China’s NEV Manufacturers Association, this paper selected 15 major NEV manufacturers as samples based on factors such as production scale and geographical location. The basic data contained both quantitative and qualitative parts.
The quantitative indicator data were obtained by querying the China Association of Automobile Manufacturers Statistical Information Network, the China NEV Network, the China Statistical Yearbook, and the Enterprise Annual Report. The qualitative indicator data were obtained by issuing questionnaires and asking experts in the industry to evaluate the scores. The raw data of quantitative indicators are shown in Table 2 (some of the data relate to trade secrets, so the company names are not used here).
Qualitative indicator data were obtained by means of expert evaluation and scoring. The key informant method was used to issue questionnaires in a targeted manner. We took the following two measures during the investigation: First, we selected large cities with a high penetration rate of NEVs (such as provincial capital cities) for research; second, we selected a representative group of specific people (such as automobile manufacturing engineers, scientific researchers, car testers, new energy car owners, etc.) to issue questionnaires. A total of 150 questionnaires were sent out and 102 valid questionnaires were collected, with an effective recovery rate of 68%. Although we have done our best to collect data and surveys, there are data limitations, especially in terms of the number and coverage of questionnaires. The qualitative data of the indicators are shown in Table 3.

4.3. Reliability and Validity Test

In this paper, we use the commonly used Cronbach’s alpha method to test the reliability of the raw data. SPSS 22.0 software was used to analyze the reliability of the scale data. The test results are shown in Table 4. The Cronbach’s alpha coefficient of each index is greater than 0.9, indicating that the data reliability is very high.
In this paper, we used SPSS 22.0 software to verify the validity of the scale data by performing the Kaiser–Meyer–Olkin (KMO) and Bartlett spherical tests on the raw data. The test results are shown in Table 5. The value of KMO is 0.917, indicating that the validity is very good. The Bartlett spherical test corresponds to a Sig value of 0, less than 0.05, and we can do further analysis.

4.4. Standardized Processing

Since the dimensions of the various indicators in the evaluation system are different, if the raw data were used for analysis directly, the higher-value indicators would play a prominent role in the comprehensive analysis results, affecting the reliability of the results. Before the analysis, we first normalized the raw data, and the data after standardization are shown in Table 6.

4.5. Evaluation of China’s NEV Industry Development Capability

The raw data after the standardization process were converted into dimensionless values. The weights of the indicators were calculated according to calculation steps (2)–(7), and each level of the indicators was sorted according to weight from high to low, as shown in Table 7.
After calculating the weight of each indicator, we arranged each level of indicators from left to right according to the weight, and constructed a mutual index system for the development capability of China’s NEV industry [70], as shown in Figure 2. According to mutation fuzzy theory, there are nine cusp-type mutation systems, three swallowtail mutation systems, and one butterfly-type mutation system.
Substituting the standardized data into the NEV industry development capability mutation index system, we obtained the fuzzy membership value of the index, as shown in Table 8.
Using formulas (14)–(16), the comprehensive evaluation results were calculated based on the correlation between the indicators. Taking NEV1 as an example:
First calculate the correlation coefficient of each indicator and determine the correlation. The correlations between indicators of autonomy are shown in Table 9.
Then, calculate the value of each layer of the indicator according to the mutation theory. A32 and A31 constitute a cusp-type mutation system model, showing significant correlation. We should adopt the principle of complementarity, that is, the method of taking the average
A 3 = ( A 32 1 / 2 + A 31 1 / 3 ) / 2 = ( 0.2212 + 0.3149 ) / 2 = 0.2681
A42 and A41 constitute a cusp-type mutation system model, showing nonsignificant correlation. We should adopt the principle of noncomplementarity, that is, the method of choosing small from big
A 4 = min ( A 42 1 / 2 , A 41 1 / 3 ) = min ( 0 , 0.4435 ) = 0
In the same way, the calculation is carried out step-by-step from the bottom, and finally the total number of catastrophe progressions is obtained, and the evaluation results of the development capability of China’s NEV industry are further obtained, as shown in Table 10.

5. Discussion

5.1. Analysis of Influencing Factors

Based on the above analysis, China’s NEV industry development capability (S) is affected by many factors, such as autonomy (A), controllability (B), and stability (C). This paper further analyzes the influence of various factors on the development capability of China’s NEV industry by constructing multiple regression models.
S is assumed to be a dependent variable, and the independent variables are A, B, and C, assuming that each one has a linear effect on the dependent variable. Based on this, we built a multivariate population regression model
S = β 0 + β 1 A + β 2 B + β 3 C + ε
where β 0 ,   β 1 ,   β 2 ,   β 3 are the regression parameters and ε is the random error term.
The following is an estimate of the model parameters using the results of China’s NEV industry development capability evaluation and a hypothesis test, and a regression model to predict the dependent variable S. Substituting the evaluation results of China’s NEV industry development capability into (20), using the ordinary least squares (OLS) method for multiple regression analysis, the calculation results are shown in Table 11.
The adjusted R2 value in Table 11 is 1, indicating that the independent variable can fully explain the change of the dependent variable, which means the multivariate regression model has a very high degree of fit and a small error.
According to the output of Table 12, S i g = 0 < 0.05 , we can explain the constructed multiple regression equation. In addition, the value of F represents the significance test result of the regression equation, indicating whether the linear relationship between the dependent variable S and all the independent variables A, B, and C in the model is generally significant. If F > F a ( k , n k 1 ) , where k is the number of independent variables, n is the sample size, and n k 1 is the degree of freedom, then the null hypothesis is rejected and it can be considered that the individual independent variables in the model have a significant impact on the dependent variable; otherwise, there is no significant impact. In this paper, the number of independent variables is k = 3 , the sample capacity is n = 15 , and a indicates the significance level, which is generally 0.05, corresponding to F a ( 3 , 11 ) = 3.5874 . In Table 12, F is much larger than 3.5874, indicating that the independent variables A, B, and C have a significant influence on the dependent variable S.
However, the result of the analysis of variance is an overall test of multiple independent variables, and cannot explain the effect of each independent variable on the dependent variable alone. Therefore, we continued to perform a one-sample test for each independent variable. The analysis results are shown in Table 13.
According to the output results listed in Table 13, it can be seen that the independent variables A, B, and C all have a significant positive effect on the dependent variable S, and the degree of influence is B (0.548), A (0.544), and C (0.415). That is to say, autonomy, controllability, and stability have a significant positive impact on the development capability of China’s new energy auto industry, and the degree of control has the greatest impact, followed by autonomy and weaker stability.

5.2. Robustness Test

In order to ensure the validity of the regression analysis, the heteroscedasticity of the regression equation needs to be tested. In this paper, we use the White test of no cross terms and use EViews 10 software to calculate the results, shown in Table 14.
Obs*R2 represents the value of the statistic of the White test, and the accompanying probability of the corresponding heteroscedasticity test is P r o b . = 0.0926 > 0.05 . In the case of significance level α = 0.05 , it is shown that there is no heteroscedasticity in the regression model, and the regression analysis is effective.

5.3. Cluster Analysis of Evaluation Results

We used MATLAB 2016a to perform K-means cluster analysis on the comprehensive evaluation results of China’s NEV industry development capabilities. The results are shown in Figure 3. From the results of the cluster analysis, it can be seen that the comprehensive evaluation of China’s NEV industry development capabilities can be divided into three categories.
The first category is companies with strong development capability. The comprehensive evaluation results of these enterprises are above 0.6, the scores are relatively high, and the development ability is relatively strong, including NEV2, NEV7, NEV9, NEV10, NEV12, and NEV14.
The second category is enterprises with general development capability. The comprehensive evaluation results of these enterprises are between 0.4 and 0.6, the scores are relatively centered, and the development ability is relatively general, including NEV1, NEV3, NEV4, NEV5, NEV8, and NEV13.
The third category is manufacturing enterprises with poor development capability. The comprehensive evaluation results of these enterprises are less than 0.35, the scores are relatively low, and the development ability is relatively poor, including NEV5, NEV6, and NEV11.
It can be seen from the cluster analysis results that the overall level of China’s NEV industry development capability is not high, and the gap between individuals is large. The average scores of the comprehensive evaluation results of the development capability of the three types of NEV enterprises are 0.6966, 0.4912, and 0.2420. The average score of the first category is higher than the second category by 0.2054, which is higher than the third category by 0.4546, and the gap is very obvious.

6. Conclusions and Policy Implications

6.1. Conclusions

This paper took 15 representative NEV manufacturing enterprises in China as a sample, and analyzed and evaluated their development capability by constructing a development capability evaluation system and applying various theories and evaluation methods. The study found that autonomy, controllability, and stability have significant positive impacts on the development capability of the NEV industry, and the degree of control has the greatest impact, followed by autonomy and weaker stability.
Overall, the outlook for the development capability of China’s new energy auto industry is not optimistic. The analysis shows that the development capacity of most sample enterprises is at a medium or low level, and the industry development is still in its infancy. Especially in terms of product autonomy, stability and reliability, and cost control, there is still a big gap compared with other countries.
From the perspective of individuals, the gap in development capability among NEV manufacturers is more obvious. The analysis shows that there are many leading enterprises with strong development capability in China, such as NEV7 (0.7992) and NEV12 (0.7513), but enterprises with weaker development capability account for the majority. In particular, the development of enterprises in the same industry is very uneven, and it is difficult to form a benign pattern for competition and promotion of coordinated development.
From the perspective of indicators, the current outstanding problem that restricts the development of China’s NEV industry is a lack of core technologies and insufficient capacity for independent innovation. The analysis results show that more than 40% of the sample enterprises have very low autonomy. Based on the results, it is found that the core technologies and operating systems required by China’s new energy auto companies rely heavily on imports, and the localization level of key components such as engines, sensors, and chips is not high. Although China has been vigorously developing the NEV industry, there are still no complete domestic alternatives, and it is impossible for the country to completely rid itself of its dependence on imports.

6.2. Policy Implications

In response to the status quo of China’s NEV industry development capability, we propose the following countermeasures:
  • Increase R&D investment and improve the industrial chain—National and NEV manufacturing enterprises should value the power of knowledge and technology, strengthen R&D investment, fully carry forward the spirit of artisans, establish basic technology research institutions, focus on research on core components and key technologies, and strengthen internal cooperation within the industry, sharing common technologies and creating a complete chain of independent and controllable technologies.
  • Intensify innovation and build independent brands—The Technical Roadmap for Key Areas of Made in China 2025 puts forward clear requirements for China’s NEV industry. This requires relying on market power, taking NEV manufacturing enterprises as the leading factor, taking development as the orientation, combining the advantages of production, education, and research, driving innovation, improving the level of localization, forming independent and controllable innovative products, maintaining long-term stable development, and getting rid of dependence on imports.
  • Improve policy protection and encourage industrial upgrading—Developing the industry is inseparable from providing policy support. At the national level, the leading role of the government should be fully exploited, and the development of enterprises should be free from worries. On the basis of existing policies, the state can further increase R&D subsidies, car purchase discounts, tax reductions, and other efforts, and provide policy support for NEVs from production to sales, create a good market environment, narrow the gap in the industry, and comprehensively improve the development capability of China’s NEV industry.

Author Contributions

Conceptualization, F.M. and X.J.; Methodology, F.M. and X.J.; Formal Analysis, X.J.; Investigation, X.J.; Data Curation, X.J.; Writing—Original Draft Preparation, X.J.; Writing—Review & Editing, F.M.

Funding

This research was funded by the National Social Science Fund of China (grant number 16BJY078) and the Heilongjiang Soft Science Project (grant number GC16D102).

Conflicts of Interest

We declare that we have no conflict of interest.

References

  1. Jayakumar, A.; Chalmers, A.; Lie, T.T. Review of prospects for adoption of fuel cell electric vehicles in New Zealand. IET Electr. Syst. Transp. 2017, 7, 259–266. [Google Scholar] [CrossRef]
  2. Omer, A.M. Energy, environment and sustainable development. Renew. Sustain. Energy Rev. 2008, 12, 2265–2300. [Google Scholar] [CrossRef]
  3. Lei, Z.; Qin, Q. Practice, China’s new energy vehicle policies: Evolution, comparison and recommendation. Transp. Res. Part A Policy Pract. 2018, 110, 57–72. [Google Scholar]
  4. Zhu, Y.Z.; Tian, Z.Y.; Liu, J.G. The Enlightenment and Reference of the Prohibition of Fuel Vehicles in Many European Countries. China Econ. Trade Her. 2018, 7, 65–67. (In Chinese) [Google Scholar]
  5. Zheng, J. When does the fuel car say goodbye? Automot. Obs. 2018, 1, 41. (In Chinese) [Google Scholar]
  6. Wan, G. New Thoughts on Promoting the Development of China’s New Energy Vehicles in the New Era. Chin. J. Automot. Eng. 2018, 8, 235–238. [Google Scholar]
  7. Lin, S. Development and Policies of New Energy Vehicles in China. Asian Social Science. 2012, 8, 86. [Google Scholar]
  8. Zhao, L. 2018 China Auto Market Inventory. Auto Rev. 2019, 2, 35–37. (In Chinese) [Google Scholar]
  9. Fan, G.L. Analysis of the Status Quo, Problems and Countermeasures of the Development of New Energy Vehicles in China. Auto Time 2019, 3, 82–83. (In Chinese) [Google Scholar]
  10. Zhang, X.; Rao, R.; Xie, J.; Liang, Y. The current dilemma and future path of China’s electric vehicles. Sustainability 2014, 6, 1567–1593. [Google Scholar] [CrossRef]
  11. Lin, L. Analysis on the Status Quo, Bottlenecks and Countermeasures of the Development of New Energy Vehicles in China. Scientific and Technological Innovation 2011, 3, 102–128. (In Chinese) [Google Scholar]
  12. Chalk, S.G.; Patil, P.G.; Venkateswaran, S.R. The new generation of vehicles: Market opportunities for fuel cells. J. Power Sources 1996, 61, 7–13. [Google Scholar] [CrossRef]
  13. Wu, J.; Yang, Z.; Hu, X.; Wang, H.; Huang, J. Exploring Driving Forces of Sustainable Development of China’s New Energy Vehicle Industry: An Analysis from the Perspective of an Innovation Ecosystem. Sustainability 2018, 10, 4827. [Google Scholar] [CrossRef]
  14. Lin, B.Q.; Wu, W. Why people want to buy electric vehicle: An empirical study in first-tier cities of China. Energy Policy 2018, 112, 223–241. [Google Scholar] [CrossRef]
  15. Gong, H.M.; Wang, M.Q.; Wang, H.W. New energy vehicles in China: Policies, demonstration, and progress. Mitigation and Adaptation Strategies for Global. 2013, 18, 207–228. [Google Scholar] [CrossRef]
  16. Yu, P.; Zhang, J.; Yang, D.; Lin, X.; Xu, T. The Evolution of China’s New Energy Vehicle Industry from the Perspective of a Technology–Market–Policy Framework. Sustainability 2019, 11, 1711. [Google Scholar] [CrossRef]
  17. Notice of the State Council on Printing and Distributing “Made in China 2025”. Available online: http://www.gov.cn/zhengce/content/2015-05/19/content_9784.htm (accessed on 23 April 2019).
  18. Oliveira, G.D.; Dias, L.C. Influence of Demographics on Consumer Preferences for Alternative Fuel Vehicles: A Review of Choice Modelling Studies and a Study in Portugal. Energies 2019, 12, 318. [Google Scholar] [CrossRef]
  19. Kinoshita, K. Exploratory Technology Research Program for Electrochemical Energy Storage, Annual Report for 1995; Lawrence Berkeley National Lab.: Berkeley, CA, USA, 1996; Volume 95, pp. 323–365. [Google Scholar]
  20. Kimble, C.; Wang, H. China’s new energy vehicles: Value and innovation. J. Bus. Strategy 2013, 34, 13–20. [Google Scholar] [CrossRef]
  21. Åhman, M. Government policy and the development of electric vehicles in Japan. Energy Policy 2006, 34, 433–443. [Google Scholar] [CrossRef]
  22. Martinez, C.M.; Hu, X.; Cao, D.; Velenis, E.; Gao, B.; Wellers, M. Energy management in plug-in hybrid electric vehicles: Recent progress and a connected vehicles perspective. IEEE Trans. Veh. Technol. 2017, 66, 4534–4549. [Google Scholar] [CrossRef]
  23. Mwasilu, F.; Justo, J.J.; Kim, E.K.; Do, T.D.; Jung, J.W. Electric vehicles and smart grid interaction: A review on vehicle to grid and renewable energy sources integration. Renew. Sustain. Energy Rev. 2014, 34, 501–516. [Google Scholar] [CrossRef]
  24. Lv, W.D.; Tian, D.; Wei, Y.; Xi, R.X. Innovation Resilience: A New Approach for Managing Uncertainties Concerned with Sustainable Innovation. Sustainability 2018, 10, 3641. [Google Scholar] [CrossRef]
  25. Kassen, A.G.; White, E.M.; Hu, L.; Tang, W.; Zhou, L.; Kramer, M.J.; Anderson, I.E. Novel mechanisms for solid-state processing and grain growth with microstructure alignment in alnico-8 based permanent magnets. AIP Adv. 2018, 8, 056206. [Google Scholar] [CrossRef] [Green Version]
  26. Zhang, L.; Fenga, Z.; Teng, W. Challenges of the New Energy Vehicle Industry in China. J. Sustain. Mobil. 2014, 1, 53–64. [Google Scholar] [CrossRef]
  27. Liu, Y.; Kokko, A. Who does what in China’s new energy vehicle industry? Energy Policy 2013, 57, 21–29. [Google Scholar] [CrossRef]
  28. Wang, Q.; Tang, L.; Li, H. Return migration of the highly skilled in higher education institutions: A Chinese university case. Popul. Space Place 2015, 21, 771–787. [Google Scholar] [CrossRef]
  29. Gaoyan, Q.; Mccauley, D.; Konina, N. Barriers to Constructing New Energy Vehicles According to Chinese SMEs. Preprints 2017, 2017110156. [Google Scholar] [CrossRef]
  30. Du, J.; Ouyang, M.; Chen, J. Prospects for Chinese electric vehicle technologies in 2016–2020: Ambition and rationality. Energy 2017, 120, 584–596. [Google Scholar] [CrossRef]
  31. Child, J.; Rodrigues, S.B. The Internationalization of Chinese Firms: A Case for Theoretical Extension? Manag. Organ. Rev. 2005, 1, 381–410. [Google Scholar] [CrossRef]
  32. Luo, R.J. Policy is still the main force driving the development of new energy automobile industry. Mod. Commer. Bank. 2018, 9, 48–55. [Google Scholar]
  33. Sierzchula, W.; Bakker, S.; Maat, K.; van Wee, B. The influence of financial incentives and other socio-economic factors on electric vehicle adoption. Energy Policy 2014, 68, 183–194. [Google Scholar] [CrossRef]
  34. Su, W.J. Policy Analysis of China’s New Energy Automobile Industry. Constr. Mach. Technol. Manag. 2018, 31, 73–77. [Google Scholar]
  35. Xie, Z.M.; Zhang, Y.; He, Z.C.; Zhang, M. Research on Patent Trend of New Energy Vehicles Industry. China Soft Sci. 2015, 9, 127–141. [Google Scholar]
  36. Wang, C.W. Research on the key problems of new energy vehicle design innovation in China. Environ. Dev. 2017, 29, 246–247. [Google Scholar]
  37. Li, L.; Guo, Y.Q. The Study on the Innovation Ecosystem Construction of China’s New Energy Automotive Industry. Sci. Technol. Manag. Res. 2014, 34, 59–63. [Google Scholar]
  38. Zhang, H.W.; Zhi, J. The Development Problems and Countermeasures of Chinese New Energy Industry. Adv. Mater. Res. 2014, 962–965, 1799–1805. [Google Scholar] [CrossRef]
  39. Yuan, X.; Liu, X.; Zuo, J. The development of new energy vehicles for a sustainable future: A review. Renew. Sustain. Energy Rev. 2015, 42, 298–305. [Google Scholar] [CrossRef]
  40. Strupeit, L.; Palm, A. Overcoming barriers to renewable energy diffusion: Business models for customer-sited solar photovoltaics in Japan, Germany and the United States. J. Clean. Prod. 2016, 123, 124–136. [Google Scholar] [CrossRef]
  41. Li, S.X.; Liu, Y.Q.; Wang, J.Y.; Zhang, L. China’s new energy vehicle industry development policy: Based on the market performance. China Popul. Resour. Environ. 2016, 26, 158–166. [Google Scholar]
  42. Xu, L.; Su, J. From government to market and from producer to consumer: Transition of policy mix towards clean mobility in China. Energy Policy 2016, 96, 328–340. [Google Scholar] [CrossRef]
  43. Zhang, X.; Bai, X. Incentive policies from 2006 to 2016 and new energy vehicle adoption in 2010–2020 in China. Renew. Sustain. Energy Rev. 2017, 70, 24–43. [Google Scholar] [CrossRef]
  44. Wang, E.C.; Jiao, Z.; Nie, Y. Environmental and economic implications of the conventional, hybrid, electric and hydrogen fuel cell vehicles in China. Civ. Eng. Urban Plan 2017, 1021–1034. [Google Scholar] [CrossRef]
  45. Kong, T.Y. New Energy Vehicles Industry in China: Developments and Challenges. East Asian Policy 2016, 8, 87–99. [Google Scholar] [CrossRef]
  46. Wang, X.; Li, C.; Shang, J.; Yang, C.; Zhang, B.; Ke, X. Strategic Choices of China’s New Energy Vehicle Industry: An Analysis Based on ANP and SWOT. Energies 2017, 10, 537. [Google Scholar] [CrossRef]
  47. Luo, D. New energy vehicle first year. 21st Century Bus. Rev. 2018, Z1, 53–55. (In Chinese) [Google Scholar]
  48. Li, W.; Long, R.; Chen, H. Consumers’ evaluation of national new energy vehicle policy in China: An analysis based on a four paradigm model. Energy Policy 2016, 99, 33–41. [Google Scholar] [CrossRef]
  49. Rosenau-Tornow, D.; Buchholz, P.; Riemann, A. Assessing the long-term supply risks for mineral raw materials-a combined evaluation of past and future trends. Resour. Policy 2009, 34, 161–175. [Google Scholar] [CrossRef]
  50. Krishnan, V.; Ulrich, K.T. Product development decisions: A review of the literature. Manag. Sci. 2001, 47, 1–21. [Google Scholar] [CrossRef]
  51. Notice of the State Council on Printing and Distributing the Development Plan for Energy-Saving and New Energy Vehicle Industry (2012–2020). Available online: http://www.gov.cn/zwgk/2012-07/09/content_2179032.htm (accessed on 22 April 2019).
  52. Feng, X.Q.; Wan, J. Growth and Challenges of China’s Strategic Emerging Industries: Taking New Energy Vehicles as an Example. Overseas Invest. Export Credit. 2018, 5, 40–44. [Google Scholar]
  53. 15 Car Companies that Have Obtained the Qualification of New Energy Production, Who Is in Troubled Fish? Available online: http://www.evpartner.com/news/7/detail-35347.html (accessed on 22 April 2019).
  54. Sinha, P.; Kumar, L.; Reid, N. Rank-Based Methods for Selection of Landscape Metrics for Land Cover Pattern Change Detection. Remote Sens 2016, 8, 107. [Google Scholar] [CrossRef]
  55. Zhang, Y.; Lu, H.; Luo, S.; Sun, Z.; Qu, W. Human-Scale Sustainability Assessment of Urban Intersections Based upon Multi-Source Big Data. Sustainability 2017, 9, 1148. [Google Scholar] [CrossRef]
  56. Wang, S.; Yang, P.; Sun, H. Fingerprinting Acoustic Localization Indoor Based on Cluster Analysis and Iterative Interpolation. Appl. Sci. 2018, 8, 1862. [Google Scholar] [CrossRef]
  57. Beruvides, G.; Quiza, R.; Haber, R.E.J.I.S. Multi-objective optimization based on an improved cross-entropy method. A case study of a micro-scale manufacturing process. Inf. Sci. 2016, 334–335, 161–173. [Google Scholar] [CrossRef]
  58. Chen, X.; Yang, L. Obstacle diagnosis model based on the catastrophe progression method and its applications for the small and medium-sized enterprises. Syst. Eng. Theory Pract. 2013, 33, 1479–1485. [Google Scholar]
  59. Liu, L.; Peng, Z.; Wu, H.; Jiao, H.; Yu, Y.; Zhao, J. Fast identification of urban sprawl based on K-means clustering with population density and local spatial entropy. Sustainability 2018, 10, 2683. [Google Scholar] [CrossRef]
  60. Li, J.; Li, M.; Gao, Y. Corporate Level: New Driving Forces and Models for Enhancing the Competitiveness of Chinese Enterprises. In China’s Provincial Economic Competitiveness and Policy Outlook for the 13th Five-Year Plan Period (2016–2020); Springer: Singapore, 2018; pp. 203–235. [Google Scholar]
  61. Ammons, A.A. Competition among States: Case Studies in the Political Role of Remote Sensing Capabilities. Ph.D. Thesis, The Catholic University of America, Washington, DC, USA, 2010. [Google Scholar]
  62. Szabó, P.; Mĺkva, M.; Vaňová, J.; Marková, P. Employee Performance in the Context of the Problems of Measurement and Evaluation in Practice. Res. Pap. Fac. Mater. Sci. Technol. Slovak Univ. Technol. 2017, 25, 63–70. [Google Scholar] [CrossRef] [Green Version]
  63. Ouyang, P.; Fu, S. Economic growth, local industrial development and inter-regional spillovers from foreign direct investment: Evidence from China. China Econ. Rev. 2009, 23, 445–460. [Google Scholar] [CrossRef]
  64. Jiang, C.; Zhang, Y.; Bu, M.; Liu, W. The effectiveness of government subsidies on manufacturing innovation: Evidence from the new energy vehicle industry in China. Sustainability 2018, 10, 1692. [Google Scholar] [CrossRef]
  65. Reeves, C.A.; Bednar, D. Defining quality: Alternatives and implications. Acad. Manag. Rev. 1994, 19, 419–445. [Google Scholar] [CrossRef]
  66. Kanda, A.; Deshmukh, S.G. Supply chain coordination: Perspectives, empirical studies and research directions. Int. J. Prod. Econ. 2008, 115, 316–335. [Google Scholar]
  67. Rhee, H.S.; Kim, C.; Ryu, Y.U. Self-efficacy in information security: Its influence on end users’ information security practice behavior. Comput. Secur. 2009, 28, 816–826. [Google Scholar] [CrossRef]
  68. Chen, S.H. The influencing factors of enterprise sustainable innovation: An empirical study. Sustainability 2016, 8, 425. [Google Scholar] [CrossRef]
  69. Davies, A.; Brady, T. Organizational capabilities and learning in complex product systems: Towards repeatable solutions. Res. Policy 2000, 29, 931–953. [Google Scholar] [CrossRef]
  70. Cao, W.; Zhou, S.; Wu, S. Land-use regionalization based on landscape pattern indices using rough set theory and catastrophe progression method. Environ. Earth Sci. 2015, 73, 1611–1620. [Google Scholar] [CrossRef]
Figure 1. China’s new energy vehicle (NEV) sales, 2013–2018.
Sustainability 11 02635 g001
Figure 2. NEV development capability mutation index system. S is a swallowtail mutant system, A is a butterfly-type mutant system, B is a swallowtail mutant system, and C is a cusp-type mutant system; A3, A4, A1, A2, B2, B3, B1, and C2 are cusp-type mutation systems; C1 is a swallowtail mutant system.
Sustainability 11 02635 g002
Figure 3. Cluster analysis of evaluation results of China’s NEV development capability.
Sustainability 11 02635 g003
Table 1. NEV industry development capability evaluation index system. R&D, research, and development.
Target LayerCriteria LayerSubcriteria LayerIndicator LayerIndicator Attribute
NEV industry development capability evaluation index system (S)Autonomy (A)Self-driving creation ability (A1)Technology R&D expenses as a percentage of sales revenue (A11)Quantitative
Number of invention patents (A12)Quantitative
Staff quality structure (A2)Proportion of employees above bachelor’s degree (A21)Quantitative
R&D ratio (A22)Quantitative
Economic efficiency level (A3)Total annual profit of the enterprise (A31)Quantitative
Total output value accounts for proportion of the industry’s output value (A32)Quantitative
Policy support (A4)NEV subsidy income (A41)Quantitative
Tax incentives (A42)Quantitative
Controllability (B)Product safety evaluation (B1)New car failure rate (B11)Quantitative
Vehicle safety performance (B12)Quantitative
Personnel controllability (B2)Employee training time (B21)Quantitative
Confidential education penetration rate (B22)Qualitative
Information security level (B3)Information security expenses amount (B31)Quantitative
Enterprise information security level (B32)Qualitative
Stability (C)Stable development capability (C1)Enterprise equipment intelligence creation level (C11)Qualitative
Degree of collaboration between departments (C12)Qualitative
Supply chain system construction (C13)Qualitative
Organizational management ability (C2)Business management level (C21)Qualitative
Emergency response capability (C22)Qualitative
Table 2. Raw data of development capability evaluation indicators (quantitative part) for 15 sample enterprises.
CompanyA11A12A21A22A31A32A41A42B11B12B21B31
NEV14.6229,79035.2611.011.121.533.130.00225147.17561,730153.85
NEV26.56626627.4613.946.910.332.171.68259168.1794,321171.69
NEV36.02790622.107.211.170.370.640.01264173.5917,781176.62
NEV45.9222,26211.2113.6840.661.6812.7511.99348231.13110,214217.57
NEV56.86690839.0019.72−9.940.283.700.01263170.9920,866176.17
NEV64.5412,23833.8718.3471.372.372.950.45328204.1920,919188.22
NEV74.20271933.0614.44107.862.121.260.82389241.00468,000218.13
NEV84.0611,24433.3616.924.321.4621.330.2310871.7919,71390.93
NEV93.70841120.3815.147.252.351.251.1814390.2362,910108.95
NEV103.35718327.5126.1550.273.0012.874.60170103.6912,163116.04
NEV112.82147316.7111.5711.360.627.872.29279183.847488186.16
NEV121.43978545.4310.69140.630.5429.207.58142187.3491,400129.66
NEV131.4215,52343.839.732.810.8327.087.24294203.0420,530194.31
NEV141.27555677.6810.90344.1025.8226.8420.04374218.0518,000169.82
NEV150.3614,17247.4024.00106.342.679.0525.01325208.7514,734187.21
Note: For the meaning of A11, A12, A21, A22, A31, A32, A41, A42, B11, B12, B21, B31, please refer to descriptions in Table 1.
Table 3. Raw data of development capability evaluation indicators (qualitative part) of 15 sample enterprises.
CompanyB22B32C11C12C13C21C22
NEV1354350353340343322329
NEV2327319301308300263294
NEV3321302286299279248277
NEV4365378396374380384360
NEV5316321305310302277289
NEV6346344346338336320325
NEV7358355369353355346333
NEV8336332318322306294300
NEV9315305288291273248272
NEV10349353345347349327330
NEV11325315312306304276280
NEV12347343340337330313313
NEV13373367378368367355352
NEV14376364378375375386362
NEV15356358373370366366354
Note: For the meaning of B22, B32, C11, C12, C13, C21, C22, please refer to descriptions in Table 1.
Table 4. Reliability test.
Indicator NameCronbach’s Alpha Coefficient
Confidential education penetration rate (B22)0.969
Enterprise information security level (B32)0.964
Enterprise equipment intelligence creation level (C11)0.948
Degree of collaboration between departments (C12)0.959
Supply chain system construction (C13)0.945
Business management level (C21)0.930
Emergency response capability (C22)0.954
Note: According to most scholars, it is generally believed that when Cronbach’s alpha coefficient is greater than or equal to 0.9, it is very reliable; between 0.8 and 0.9 it is good; and between 0.7 and 0.8 it is acceptable. Preferably, it is above 0.7.
Table 5. Validity test.
KMO Measurement Sampling Suitability 0.917
Bartlett spherical testApprox. chi-square243.523
df21
Sig.0.000
Note: In general, the validity is very good when the Kaiser–Meyer–Olkin (KMO) value is greater than or equal to 0.9, good when the value is between 0.8 and 0.9, general when the value is between 0.7 and 0.8, acceptable when the value is between 0.6 and 0.7, and poor when the value is lower than 0.6.
Table 6. Standardized data of development capability evaluation indicators of 15 sample enterprises.
CompanyA11A12A21A22A31A32A41A42B11B12B21B22B31B32C11C12C13C21C22
NEV10.661.000.360.200.030.050.090.000.420.451.000.340.490.390.290.370.310.330.31
NEV20.950.170.240.360.050.000.050.070.540.570.160.640.630.630.610.580.650.540.63
NEV30.870.230.160.000.030.000.000.000.550.600.020.510.670.550.550.560.590.520.59
NEV40.860.730.000.340.140.050.420.480.850.940.190.701.000.700.750.740.770.710.68
NEV51.000.190.420.660.000.000.110.000.550.590.020.820.671.001.000.991.000.990.98
NEV60.640.380.340.590.230.080.080.020.780.780.020.000.760.040.020.000.000.000.00
NEV70.590.040.330.380.330.070.020.031.001.000.830.561.000.670.540.670.710.570.64
NEV80.570.350.330.510.040.050.720.010.000.000.020.160.000.170.240.180.290.200.09
NEV90.510.250.140.420.050.080.020.050.120.110.100.520.140.540.490.550.530.470.46
NEV100.460.200.251.000.170.110.430.180.220.190.010.950.200.860.840.920.880.780.89
NEV110.380.000.080.230.060.010.250.090.610.660.001.000.750.820.841.000.951.001.00
NEV120.160.290.510.180.430.011.000.300.120.680.150.670.300.740.790.940.870.860.91
NEV130.160.500.490.130.040.020.930.290.660.780.020.020.810.250.170.230.270.210.19
NEV140.140.141.000.191.001.000.920.800.950.860.020.200.620.220.140.200.250.110.24
NEV150.000.450.540.890.330.090.291.000.770.810.010.100.760.000.000.100.060.000.06
Note: For the meaning of A11, A12, A21, A22, A31, A32, A41, A42, B11, B12, B21, B22, B31, B32, C11, C12, C13, C21, C22, please refer to descriptions in Table 1.
Table 7. Weights of China’s new energy auto industry development capability evaluation indicators.
Criteria LayerWeightsSubcriteria LayerIndicator LayerWeights
A0.5483A1A110.0278
A120.0392
A2A210.0311
A220.032
A3A310.0852
A320.1549
A4A410.0695
A420.1084
B0.2799B1B110.0271
B120.0221
B2B210.1398
B220.0377
B3B310.0226
B320.0306
C0.1718C1C110.036
C120.0319
C130.0292
C2C210.0386
C220.0361
Table 8. China’s NEV industry development capability mutation fuzzy membership values.
CompanyA32A31A42A41A12A11A22A21B21B22B32B31B11B12C11C12C13C21C22
NEV10.050.030.000.091.000.660.200.361.000.340.390.490.420.450.290.370.310.330.31
NEV20.000.050.070.050.170.950.360.240.160.640.630.630.540.570.610.580.650.540.63
NEV30.000.030.000.000.230.870.000.160.020.510.550.670.550.600.550.560.590.520.59
NEV40.050.140.480.420.730.860.340.000.190.700.701.000.850.940.750.740.770.710.68
NEV50.000.000.000.110.191.000.660.420.020.821.000.670.550.591.000.991.000.990.98
NEV60.080.230.020.080.380.640.590.340.020.000.040.760.780.780.020.000.000.000.00
NEV70.070.330.030.020.040.590.380.330.830.560.671.001.001.000.540.670.710.570.64
NEV80.050.040.010.720.350.570.510.330.020.160.170.000.000.000.240.180.290.200.09
NEV90.080.050.050.020.250.510.420.140.100.520.540.140.120.110.490.550.530.470.46
NEV100.110.170.180.430.200.461.000.250.010.950.860.200.220.190.840.920.880.780.89
NEV110.010.060.090.250.000.380.230.080.001.000.820.750.610.660.841.000.951.001.00
NEV120.010.430.301.000.290.160.180.510.150.670.740.300.120.680.790.940.870.860.91
NEV130.020.040.290.930.500.160.130.490.020.020.250.810.660.780.170.230.270.210.19
NEV141.001.000.800.920.140.140.191.000.020.200.220.620.950.860.140.200.250.110.24
NEV150.090.331.000.290.450.000.890.540.010.100.000.760.770.810.000.100.060.000.06
Note: For the meaning of A11, A12, A21, A22, A31, A32, A41, A42, B11, B12, B21, B22, B31, B32, C11, C12, C13, C21, C22, please refer to descriptions in Table 1.
Table 9. Pearson correlation analysis of autonomy indicators.
IndicatorrpCorrelation
A32 A310.8750.000Significant
A42 A410.4580.086Nonsignificant
A12 A110.0550.846Nonsignificant
A22 A21−0.0220.939Nonsignificant
Table 10. China’s new energy auto industry development capability evaluation results.
CompanySABCRank
NEV10.55790.00000.83720.83657
NEV20.66710.45090.62910.92114
NEV30.42680.00000.36920.911111
NEV40.53560.00000.65610.95069
NEV50.46420.00000.39420.998410
NEV60.20600.51190.00000.106014
NEV70.79920.56570.90720.92471
NEV80.40860.45770.00000.768212
NEV90.67560.56990.56230.89453
NEV100.64690.66350.30310.97425
NEV110.33060.00000.00000.991813
NEV120.75130.65300.62380.97702
NEV130.55420.48840.39170.78268
NEV140.63980.78500.37110.76336
NEV150.18940.00000.00000.568215
Note: For the meaning of S, A, B, C, please refer to descriptions in Table 1.
Table 11. Multivariate regression model analysis summary.
ModelRR2Adjusted R2Standard Estimated Error
11.0001.0001.0000.0000301
Predicted value: (constant) C, A, B. Note: R represents goodness of fit, which is used to measure the degree to which the estimated model fits the observation. The closer the value of R is to 1, the better the model is, and the adjusted R2 is more precise than the R2 before adjustment.
Table 12. Multivariate regression model ANOVA analysis.
ModelQuadratic SumDfAverage SquaredF1Sig
Regression0.47830.159176,445,828.80.000 *
Residual0.000110.000
Total0.47814
Note: Dependent variable: S; predicted value: (constant), C, A, B; * p < 0.05 . The value of F is the result of the analysis of variance and is the overall test of the entire regression equation. The regression equation is considered useful when the S i g value corresponding to the F value is less than 0.05.
Table 13. Multiple regression model coefficients.
ModelNonstandardized CoefficientStandardized CoefficientTSig
BStandard ErrorBeta
1 (Constant)2.91 × 10−050.000 0.8760.400 *
A0.3330.0000.54412,184.7740.000 *
B0.3330.0000.54810,750.0170.000 *
C0.3330.0000.4158118.9250.000 *
Note: Dependent variable: S; * p < 0.05 . The corresponding values of T are less than 0.05, indicating that the independent variable has a significant influence on the dependent variable. The larger the value of the normalization coefficient beta, the greater the influence on the independent variable.
Table 14. Heteroscedasticity test: White.
F-statistic140.5372Prob. F (9, 5)0.0000
Obs*R214.94094Prob. chi-square (9)0.0926 *
* p > 0.05 .

