Risk Identification and Evaluation of the Long-term Supply of Manganese Mines in China Based on the VW-BGR Method


 ,
, 
Abstract
:1. Introduction
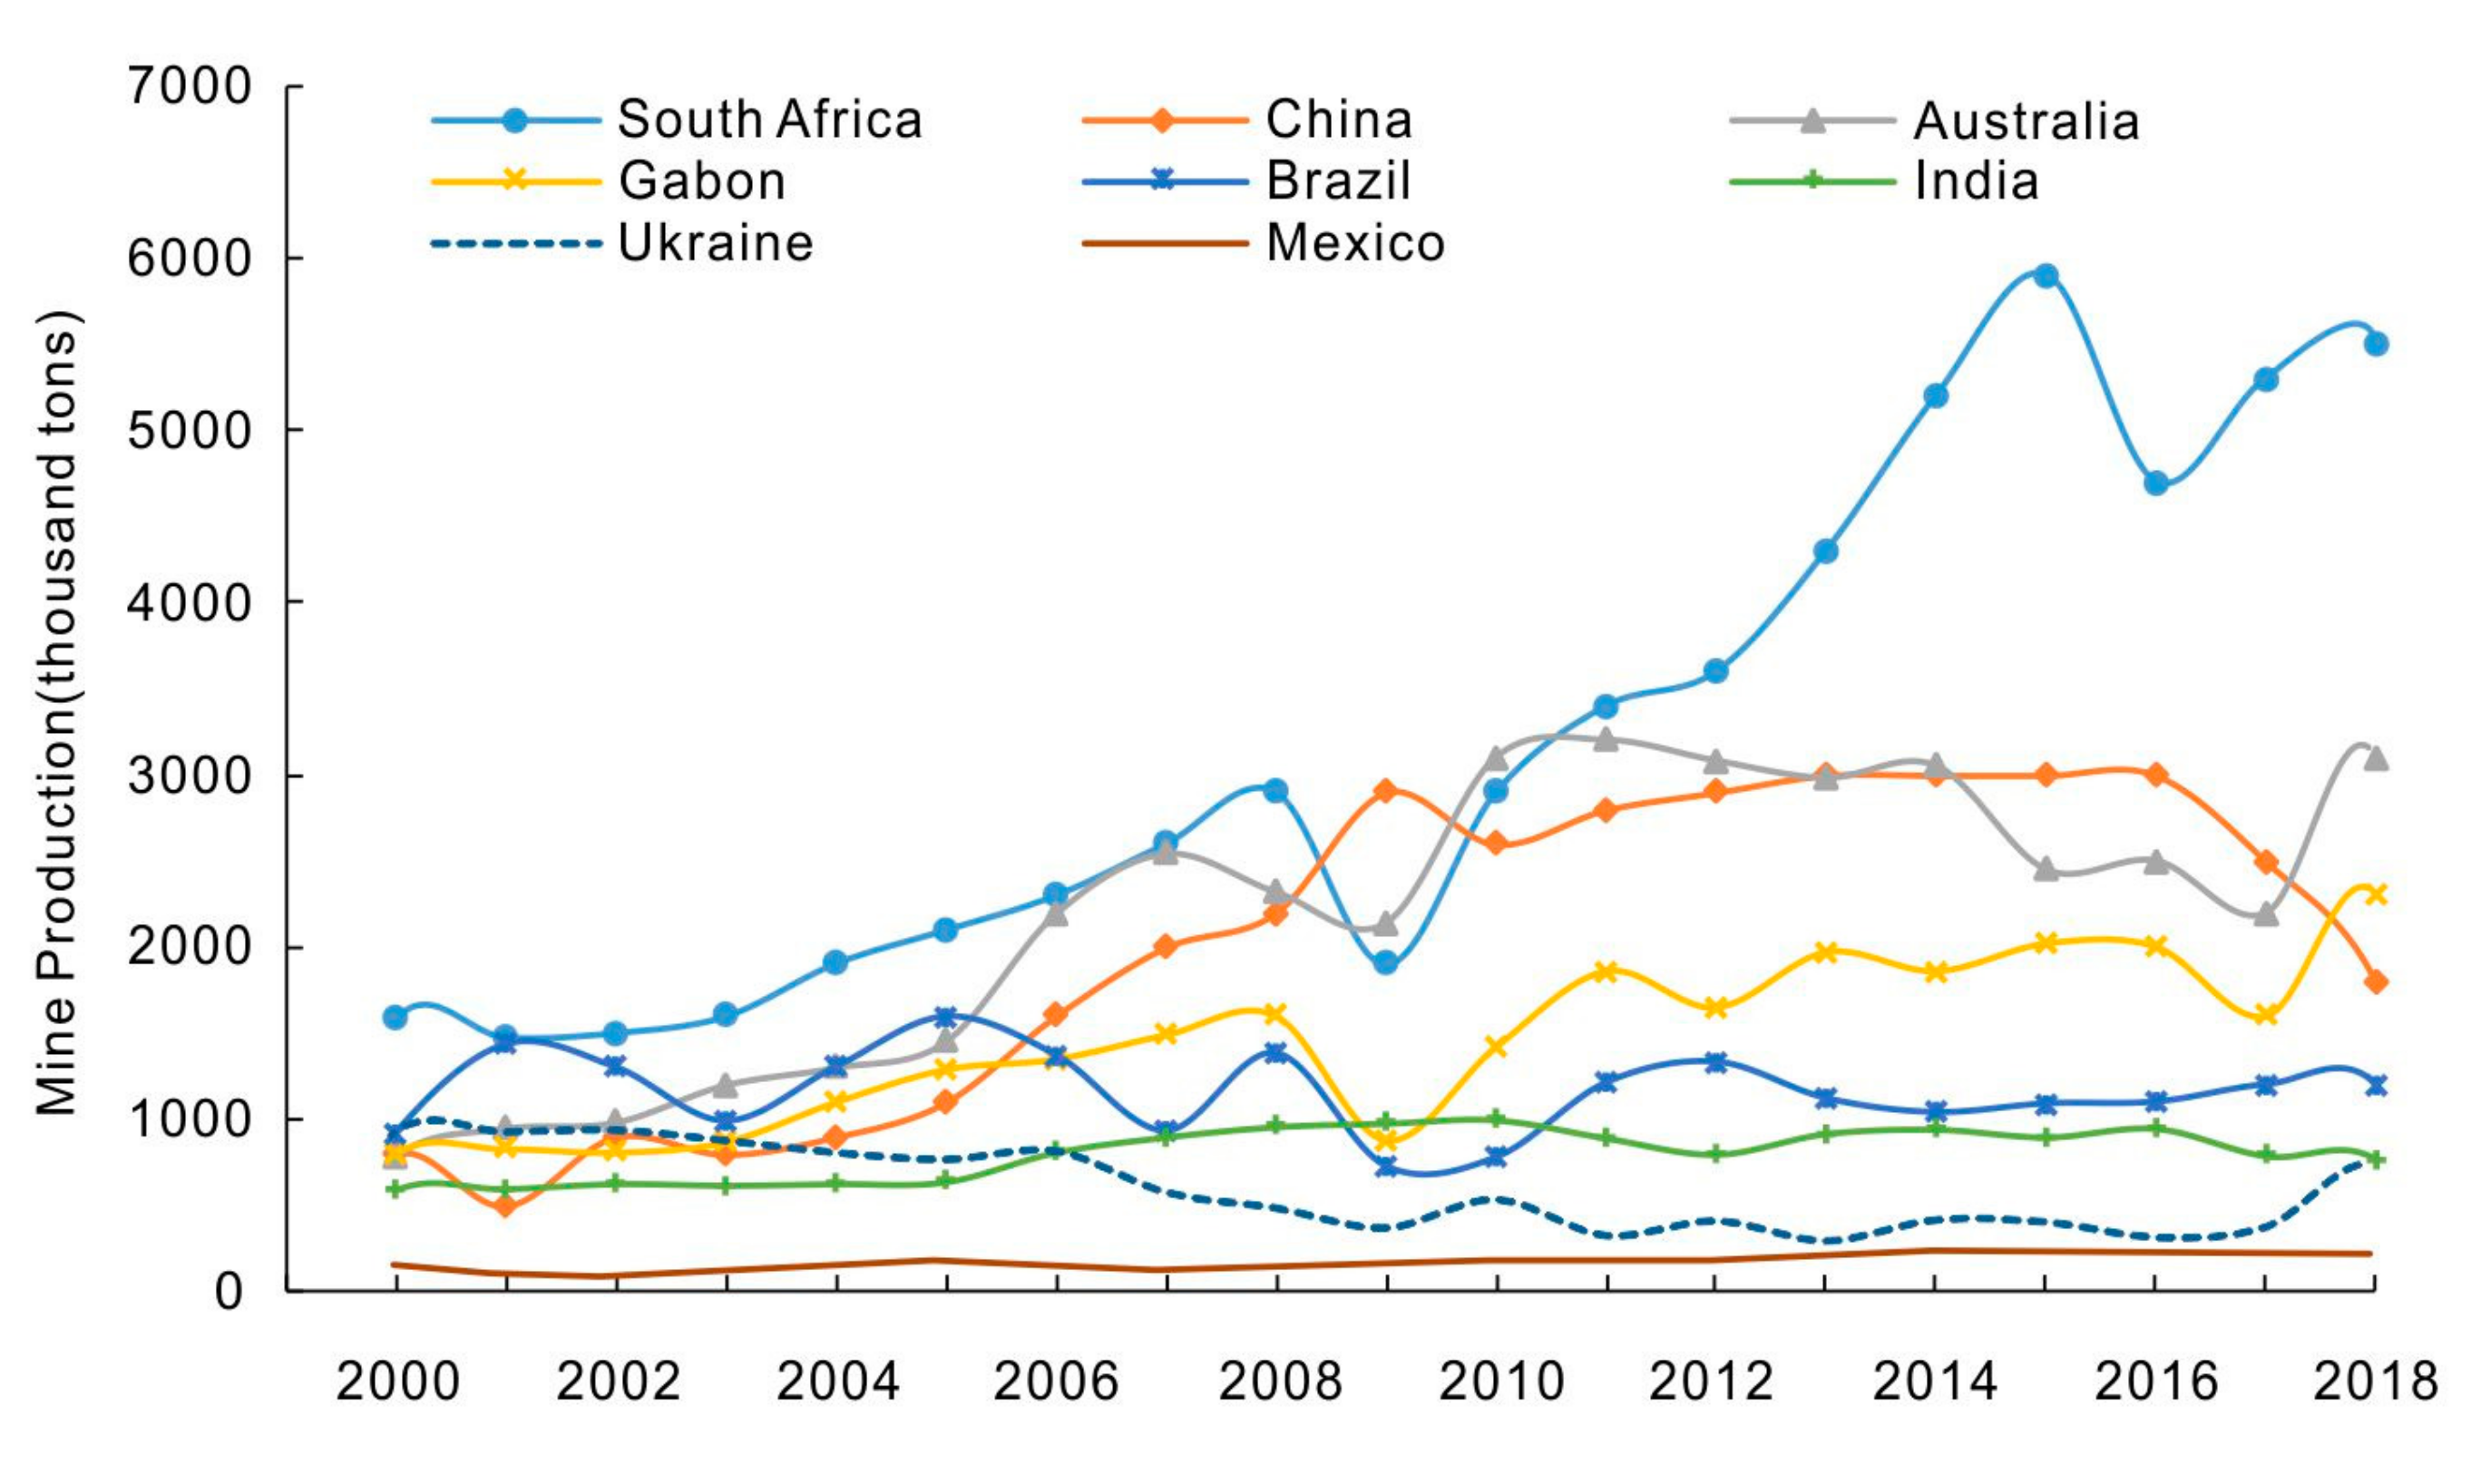
2. Overview of China’s Manganese Ore Resources
- High grade (Mn > 44%) manganese ore is mainly distributed in South Africa, Australia, Brazil and Gabon in the form of sedimentary metamorphic and weathered crust types;
- India, Kazakhstan and Mexico have medium grade (Mn 30%–44%) manganese ore resources;
- Ukraine and Ghana mainly feature low-grade manganese ore (Mn < 30%) and the deposit types are mainly sedimentary and volcanic.
3. Supply Risk of Manganese Ore Based on the VW-BGR Method
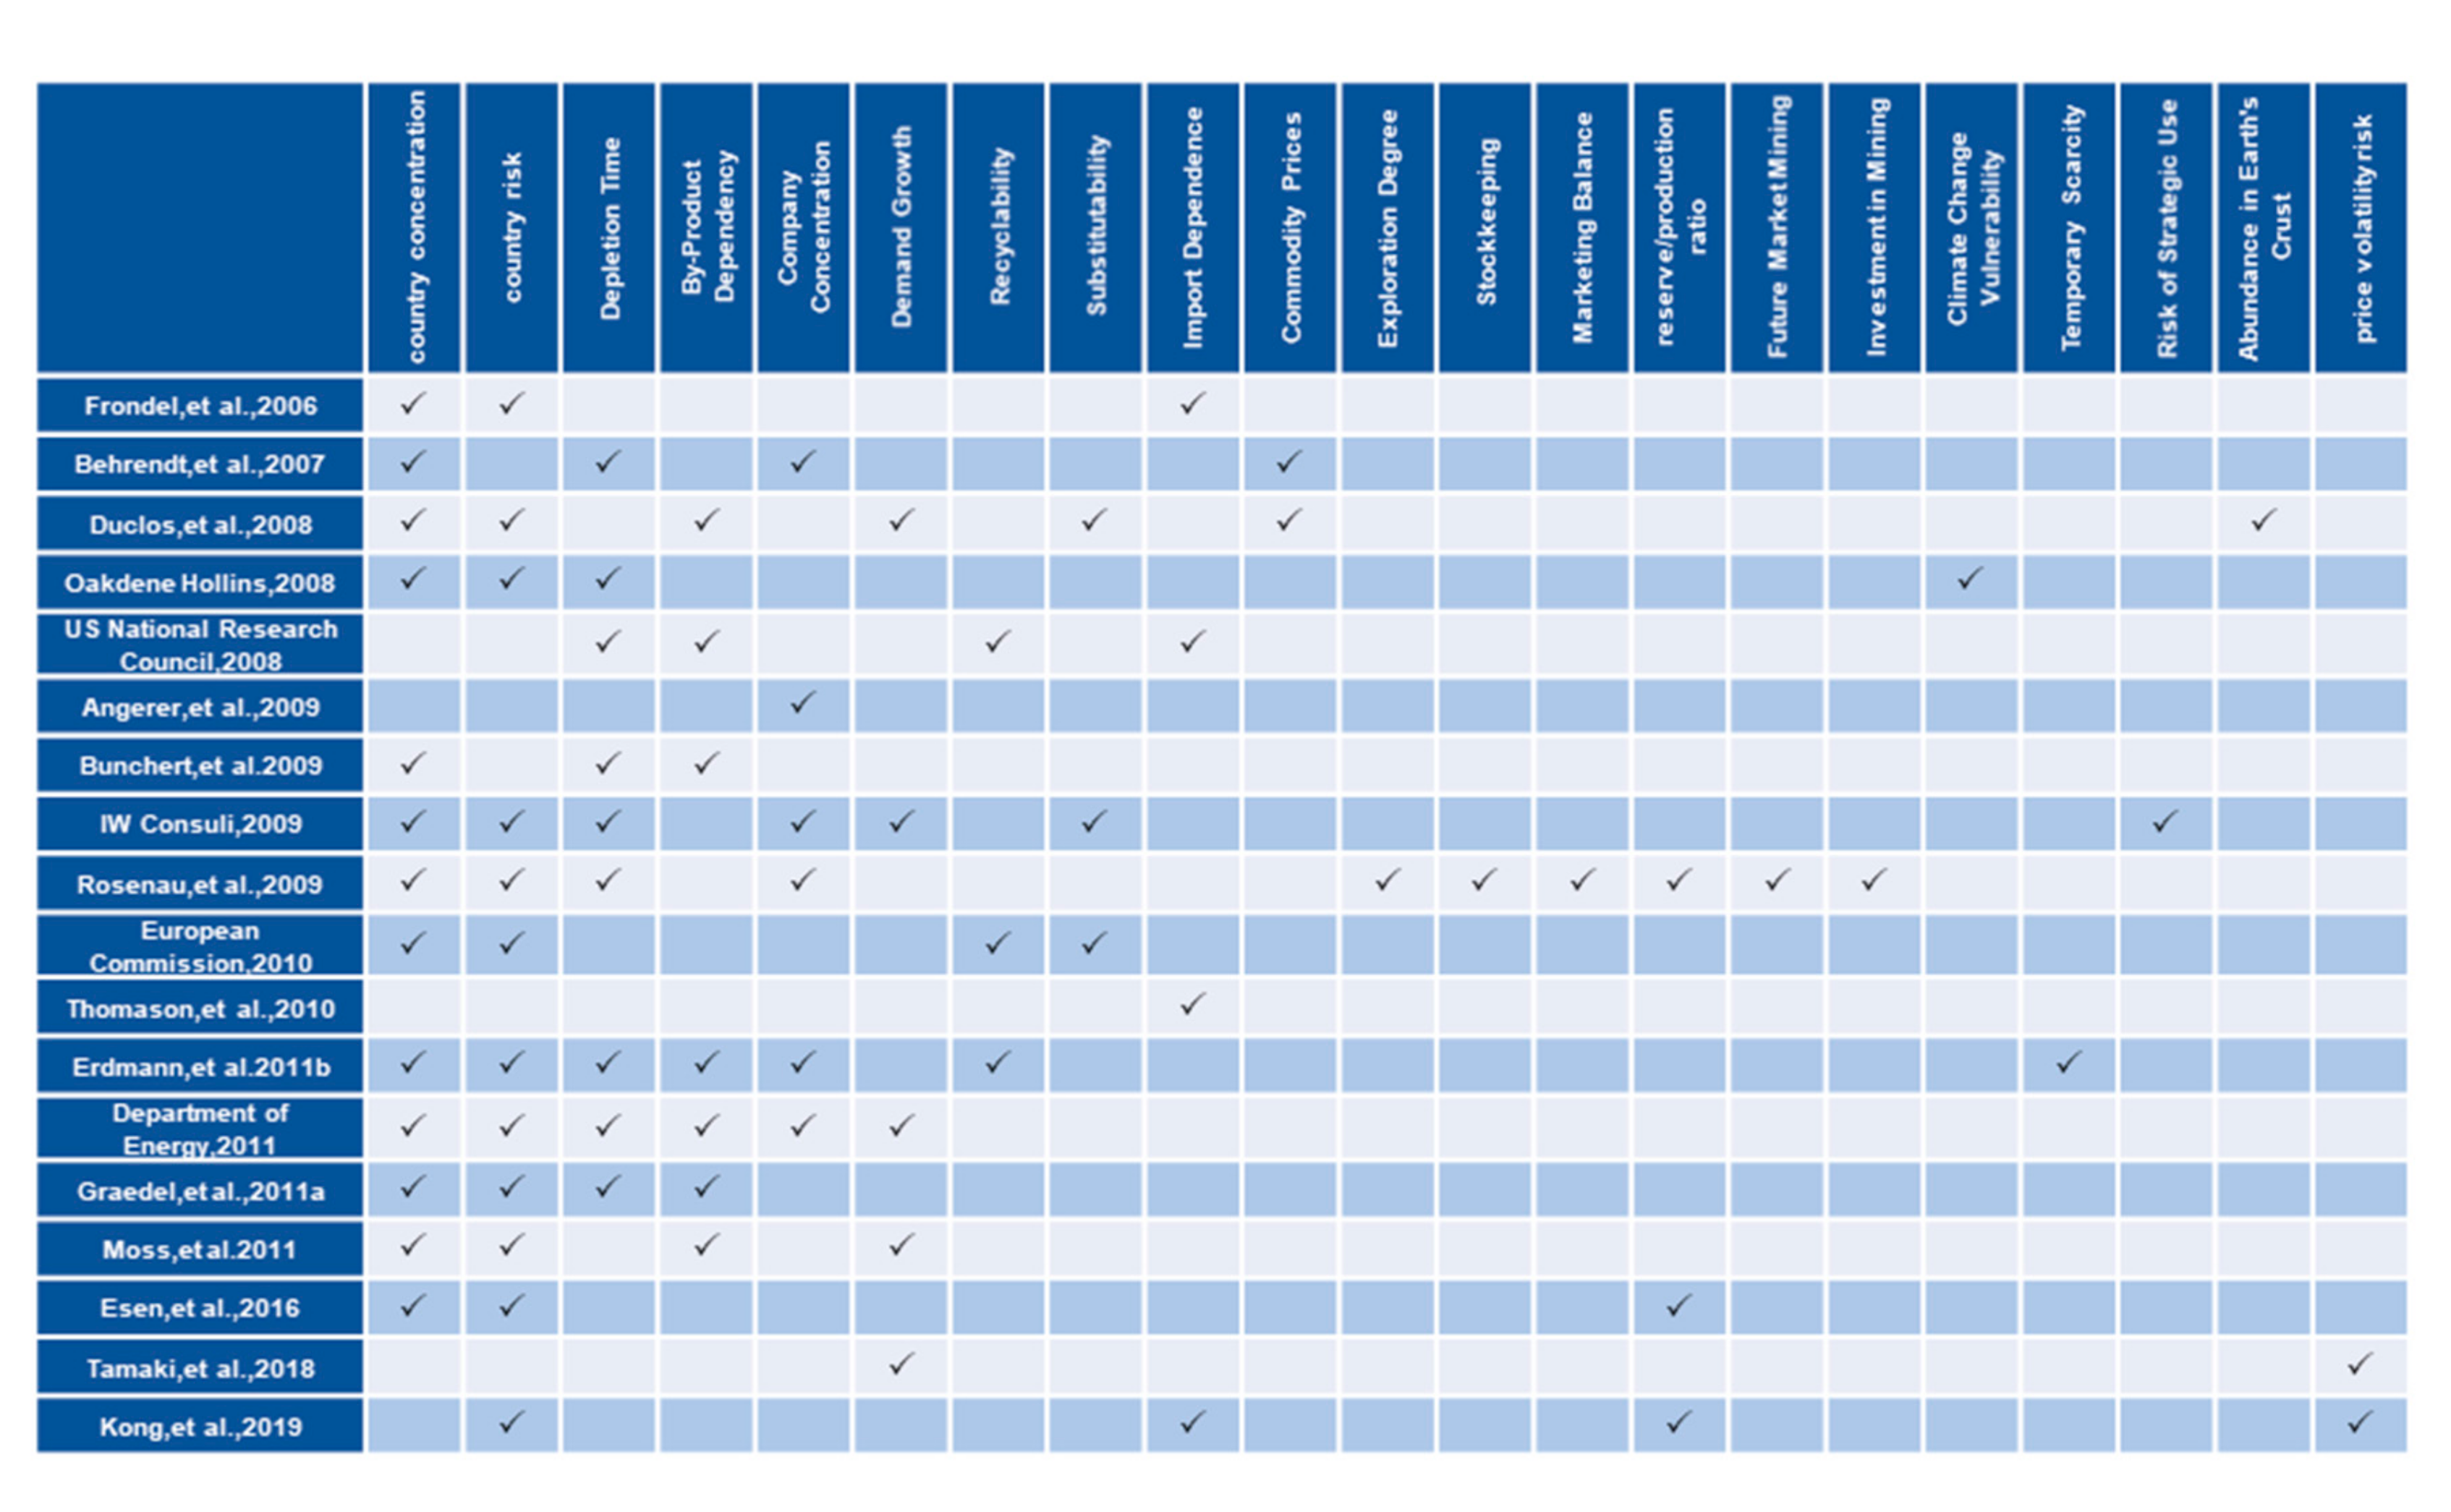
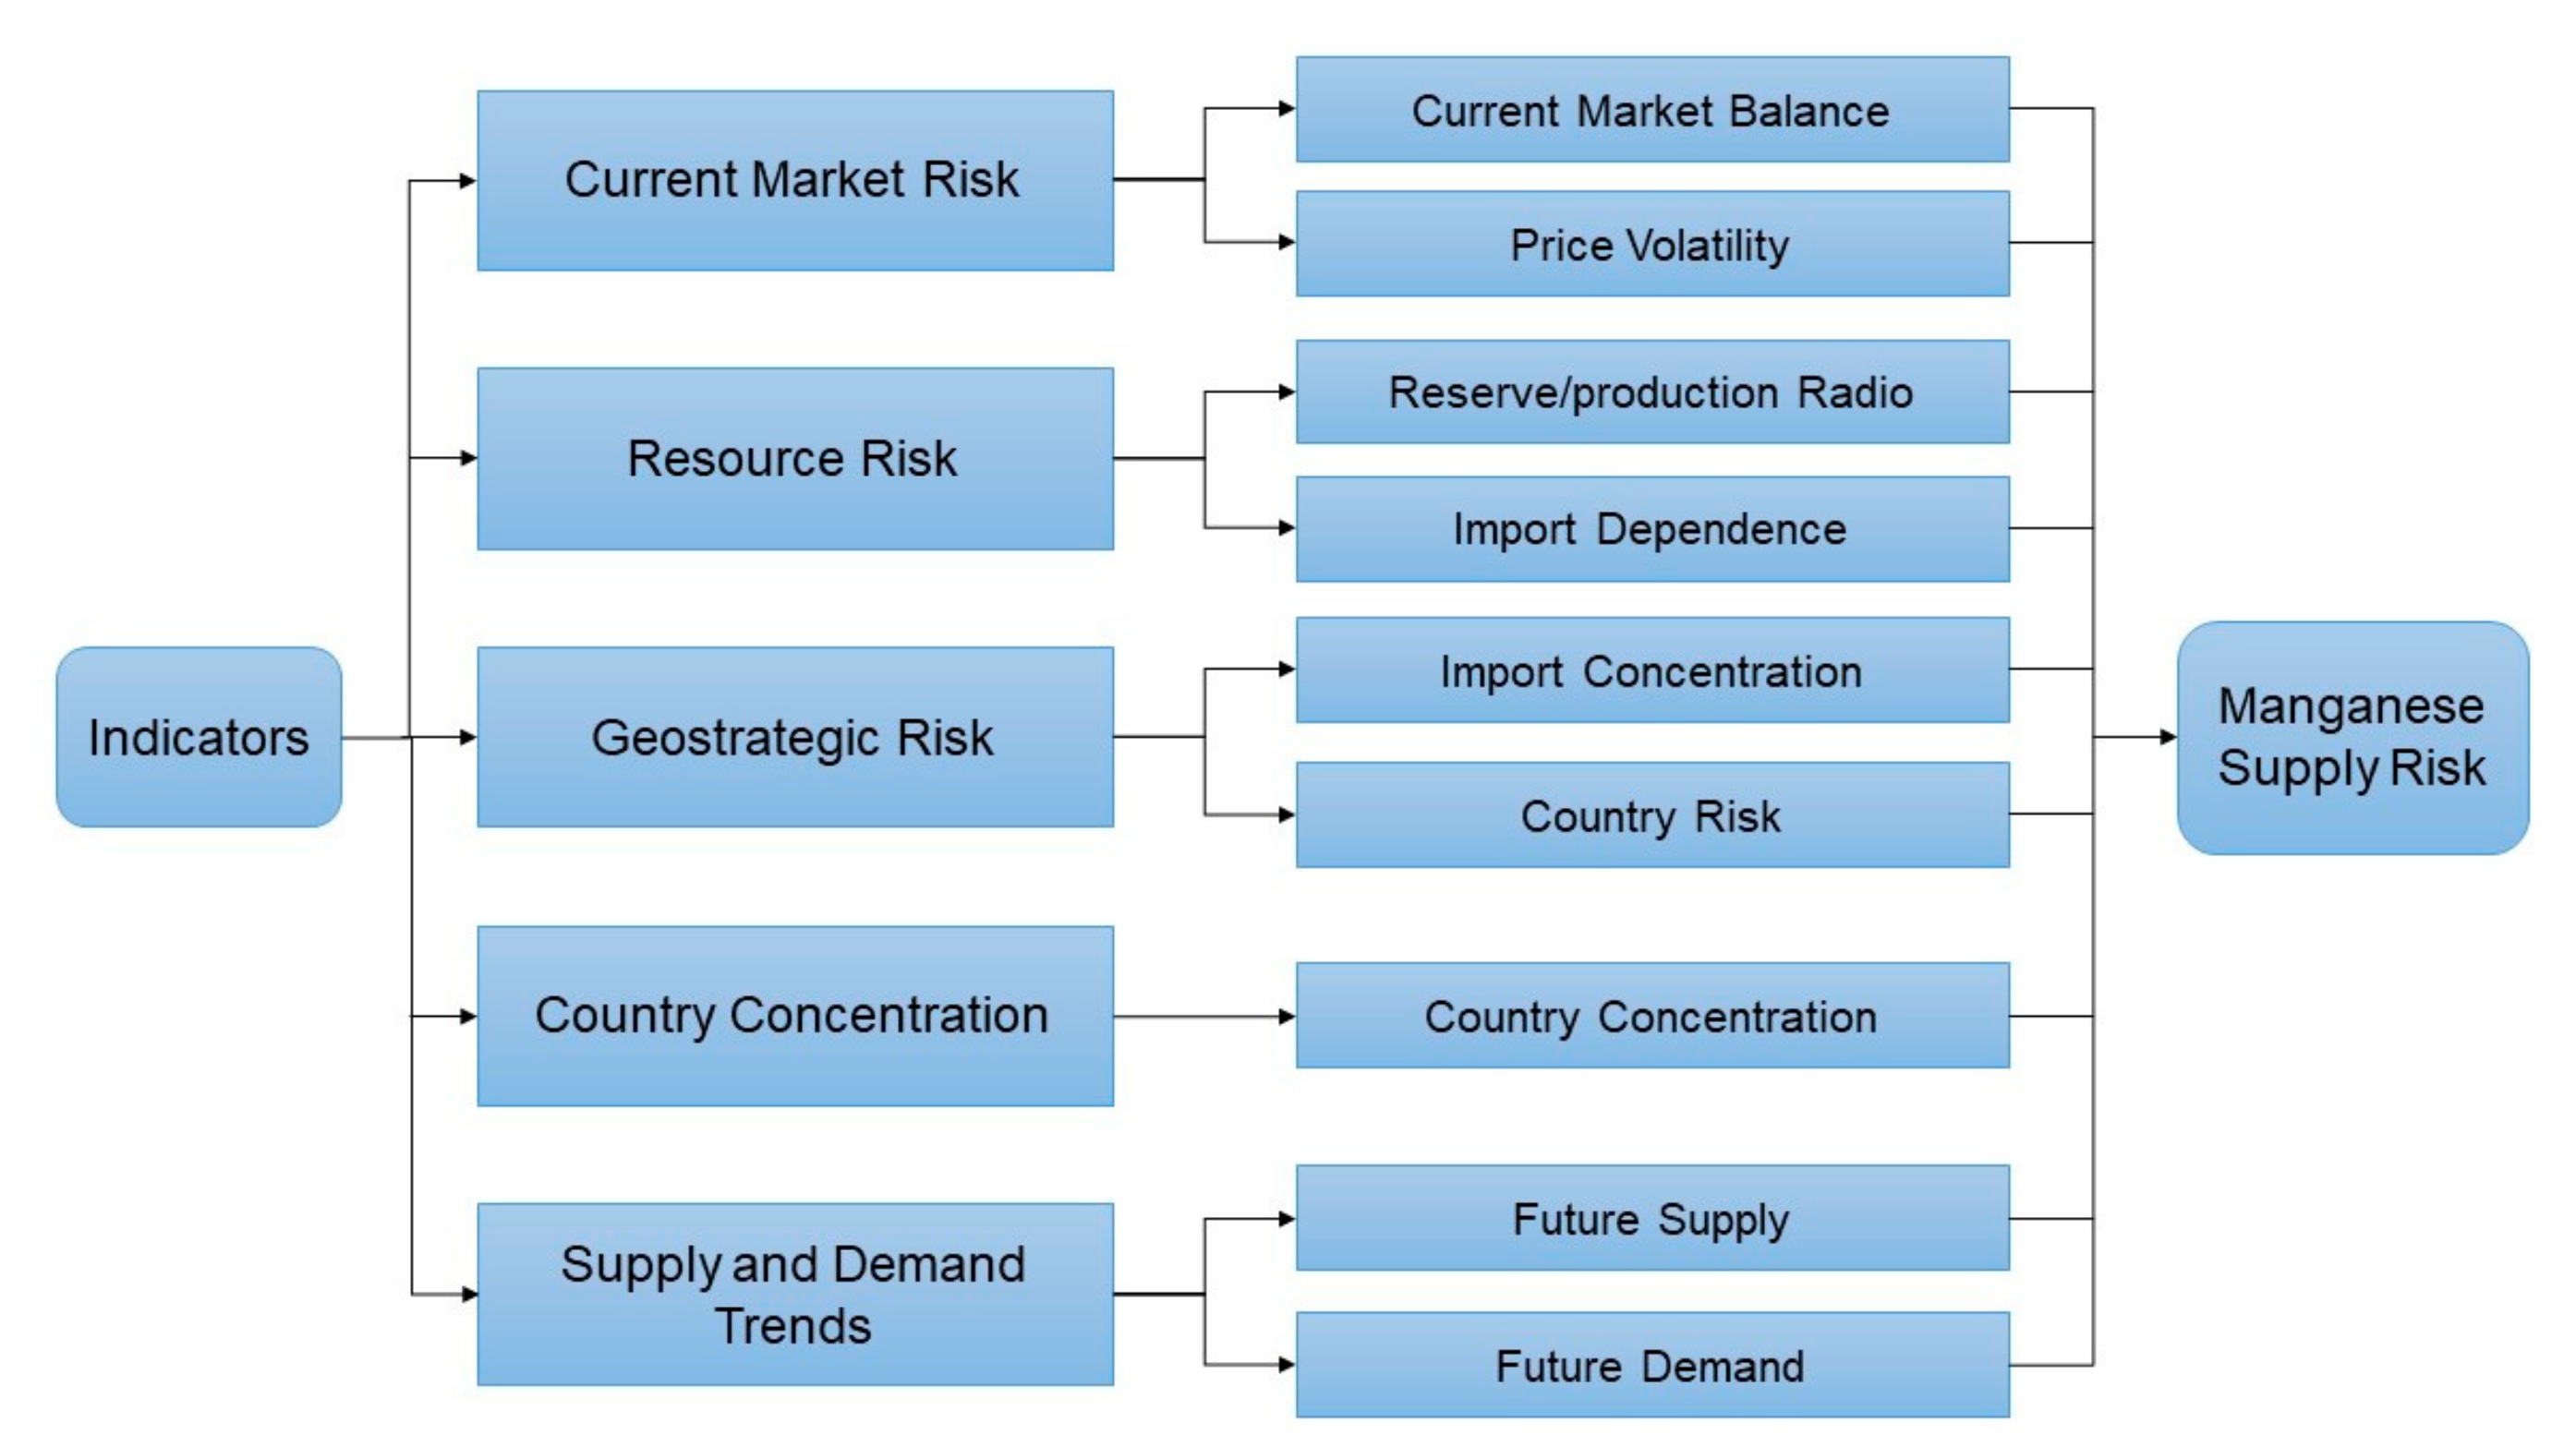
3.1. Indicator Selection
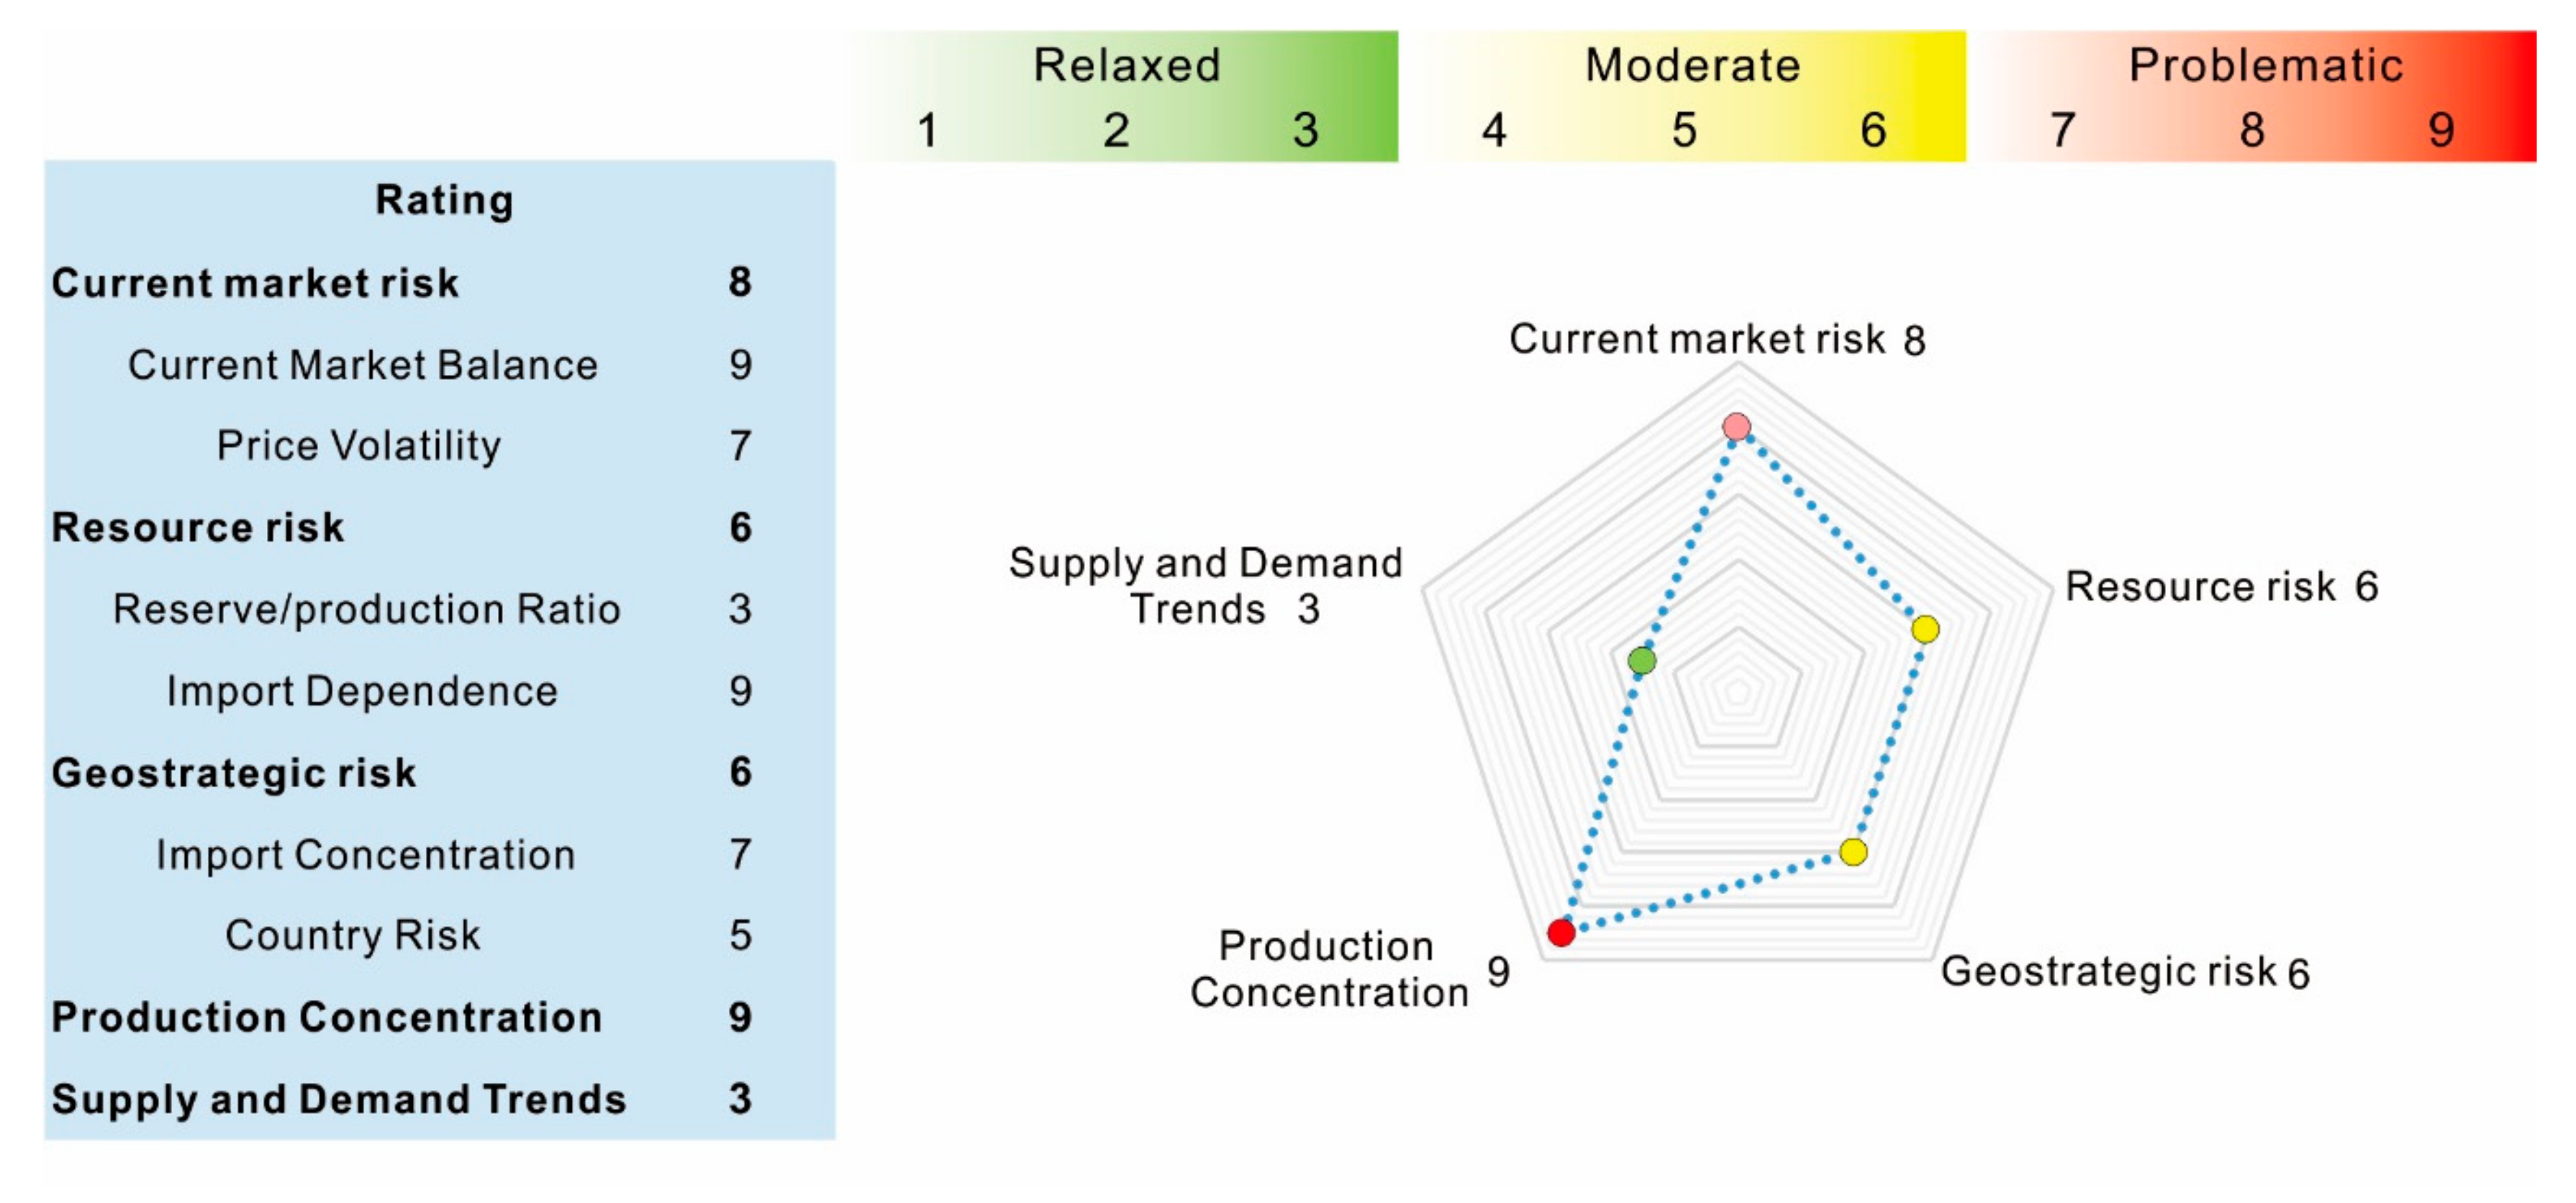
3.2. Current Market Risk (Rating: 8, Problematic)
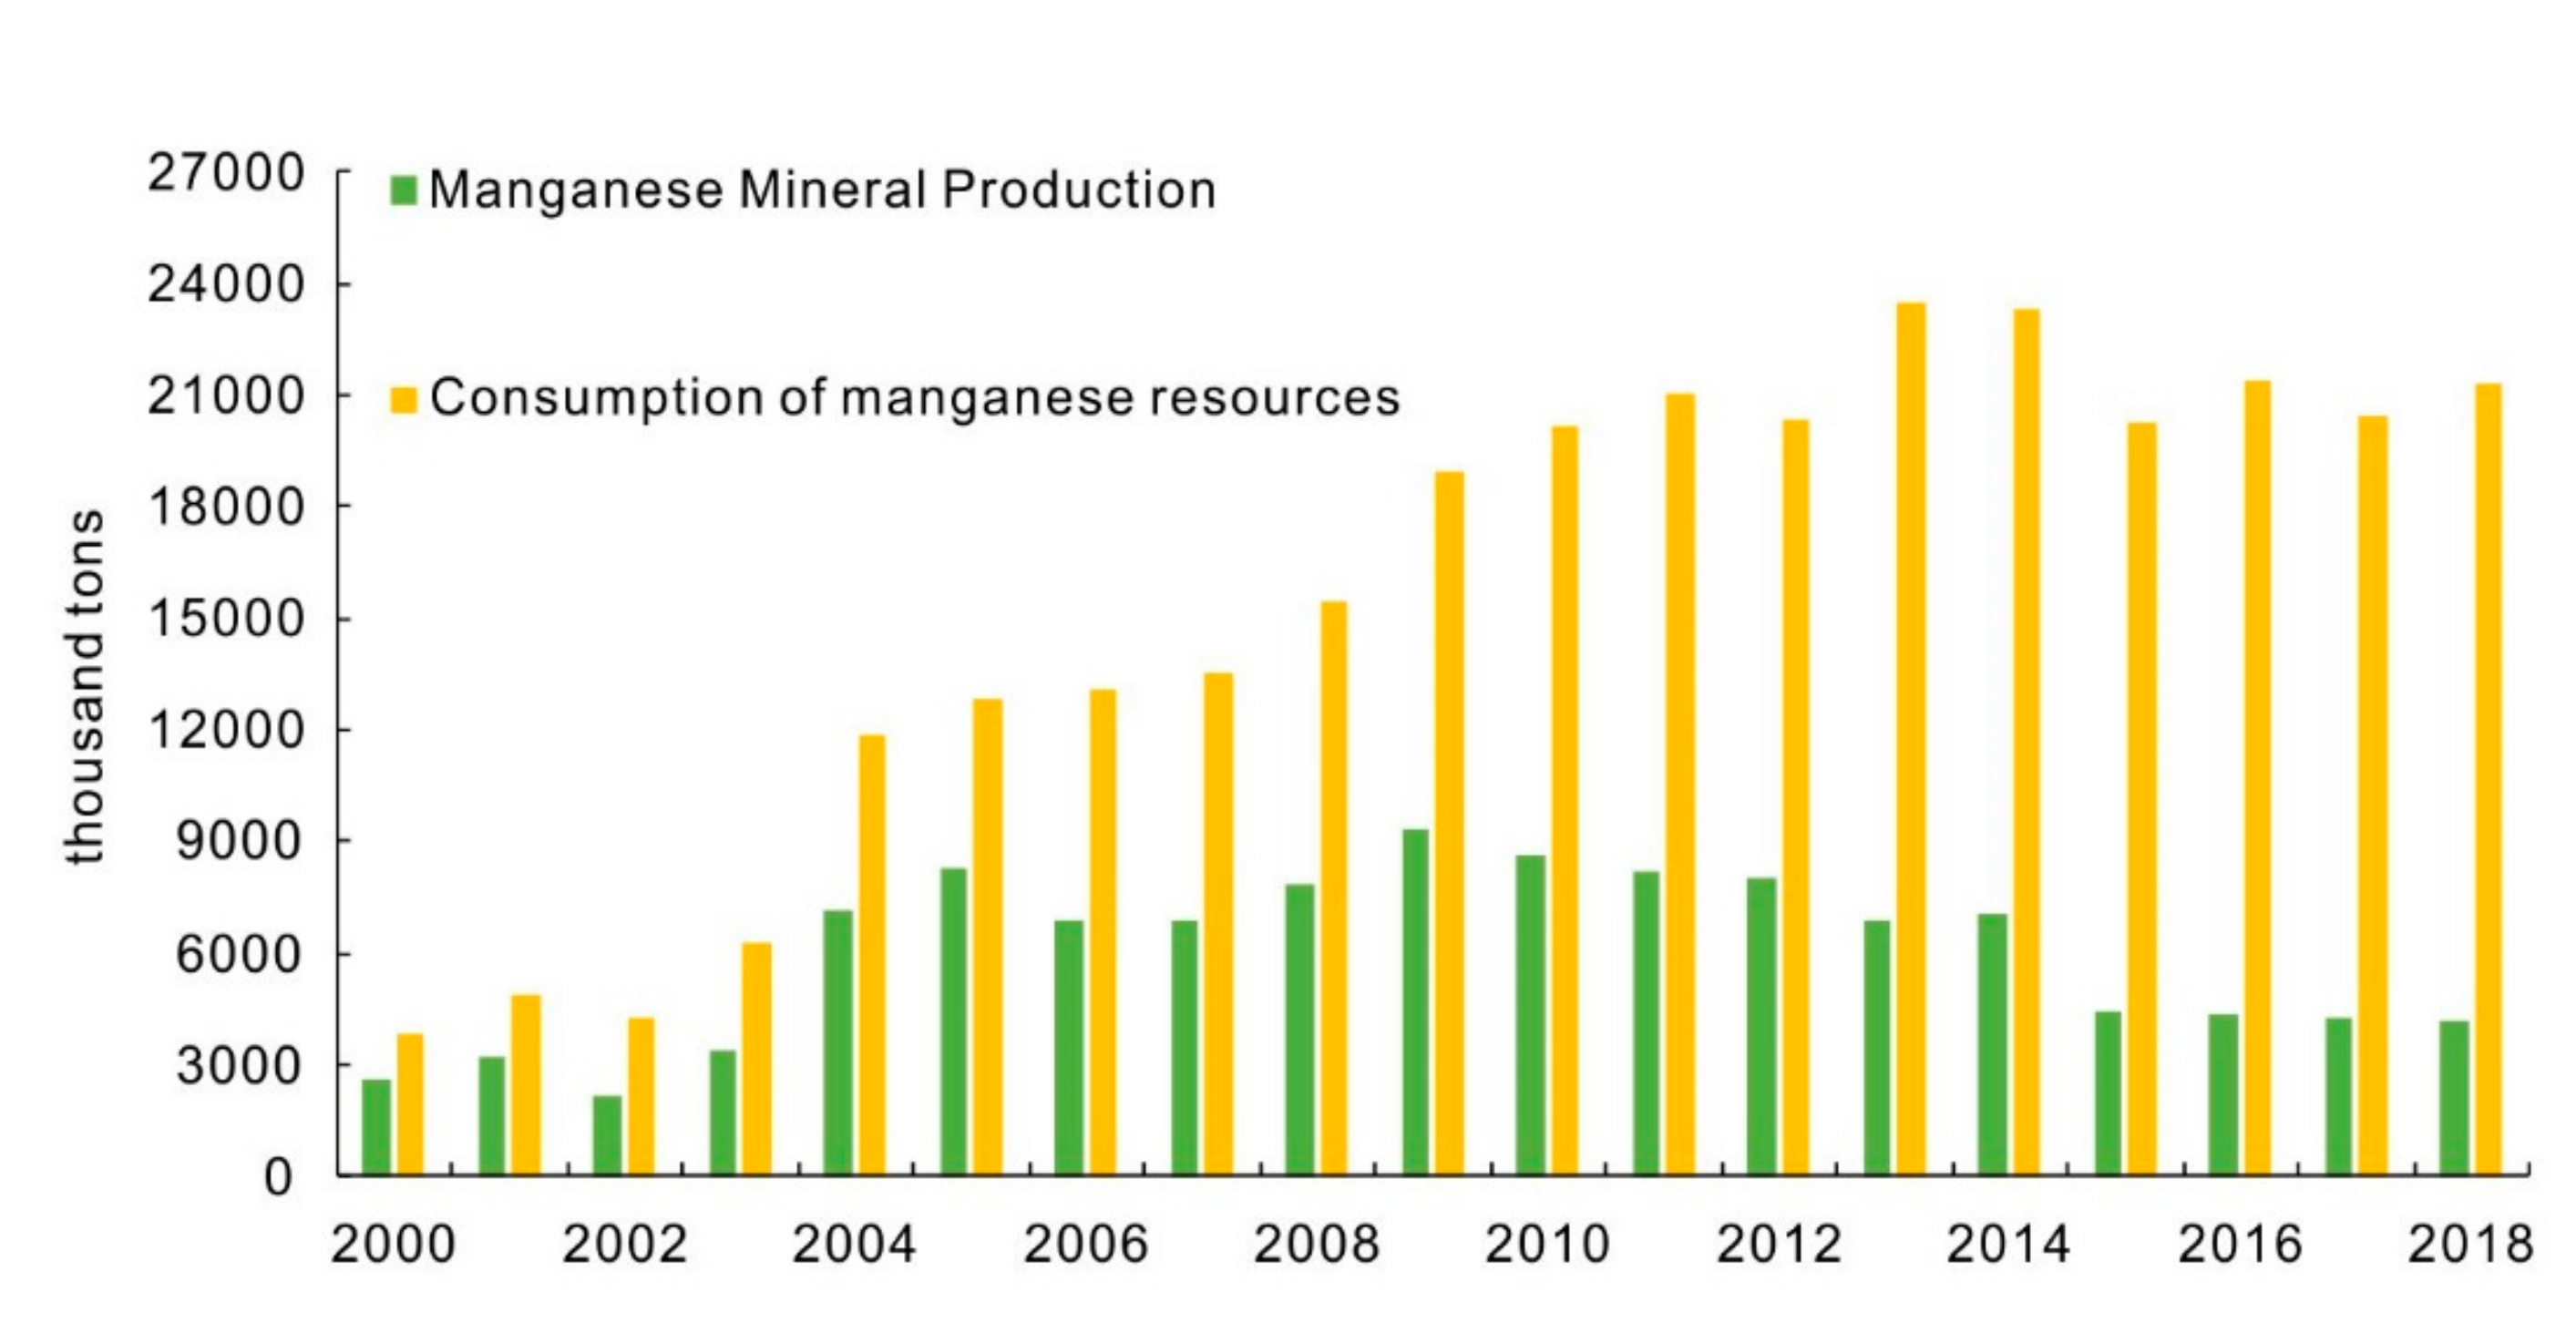
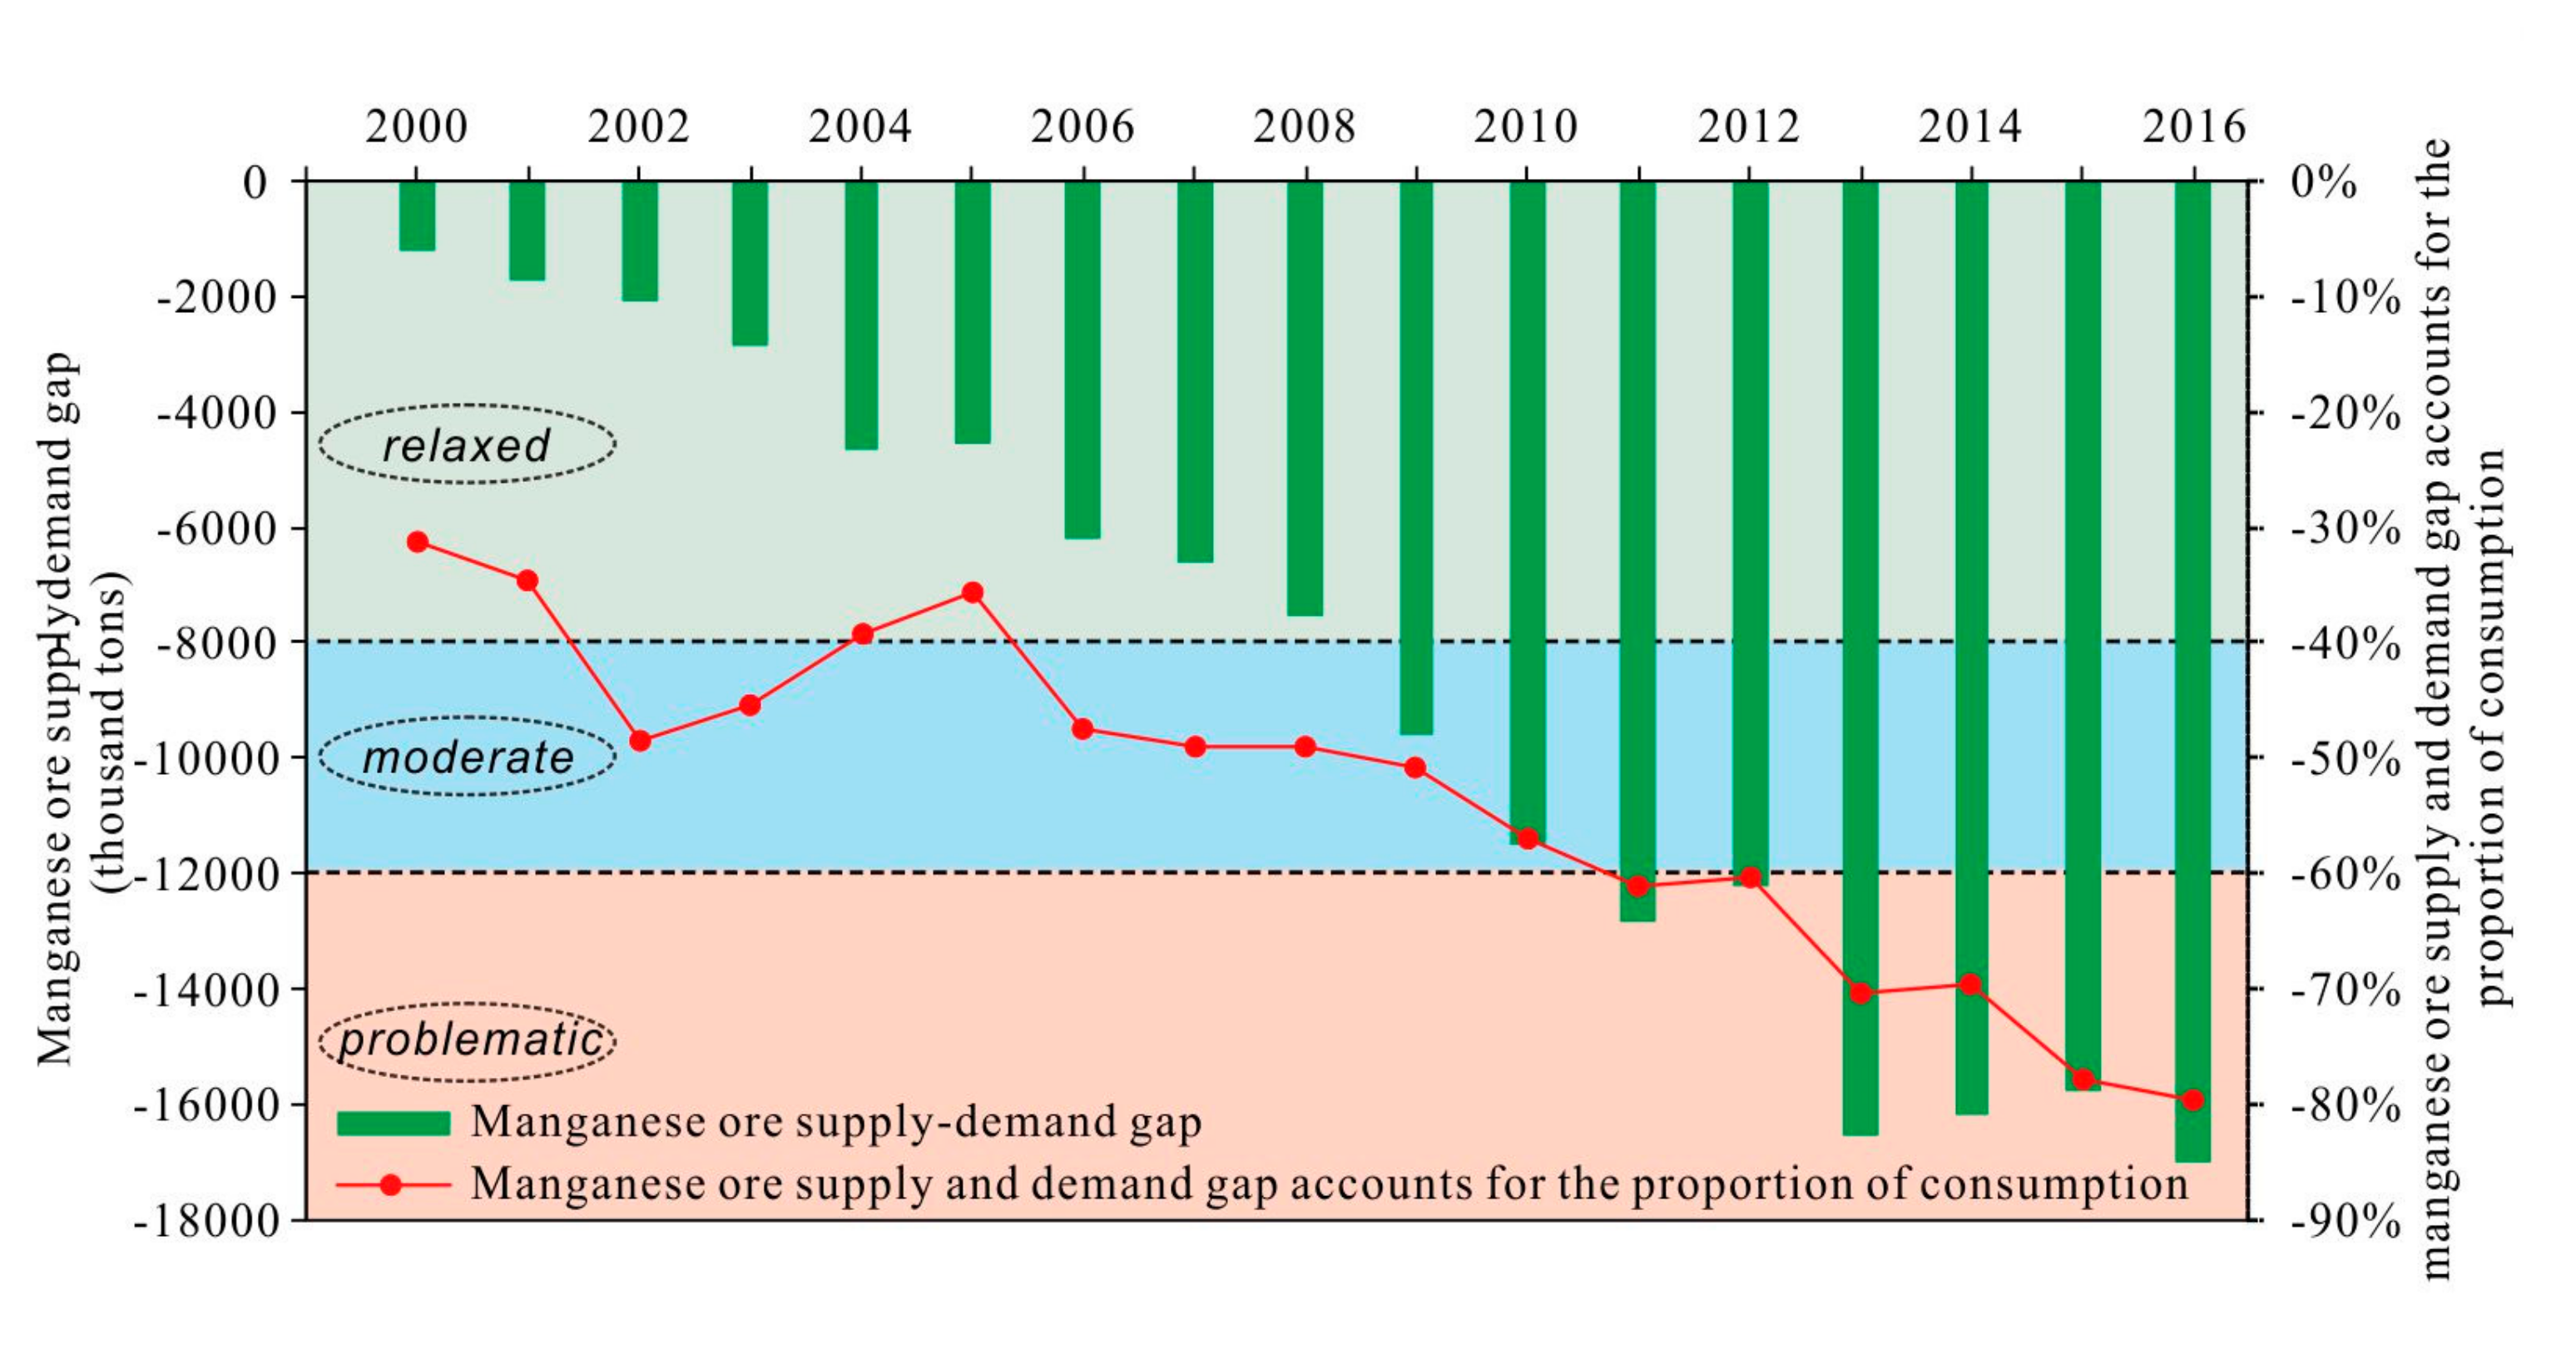
3.2.1. Current Market Equilibrium (Rating: 9, Problematic)
- : The proportion of the supply demand gap in consumption of manganese mines in China during year t
- : Manganese mineral production in China during year t
- : Apparent consumption of manganese mines in China during year t
3.2.2. Price Volatility (Rating: 7, Problematic)
- : Absolute value of annual average import price volatility of manganese mines during year t
- : Annual average import price of manganese mines during year t
- : Average annual import price of manganese mines during year t-1
3.3. Resource Risk (Rating:6, Moderate)
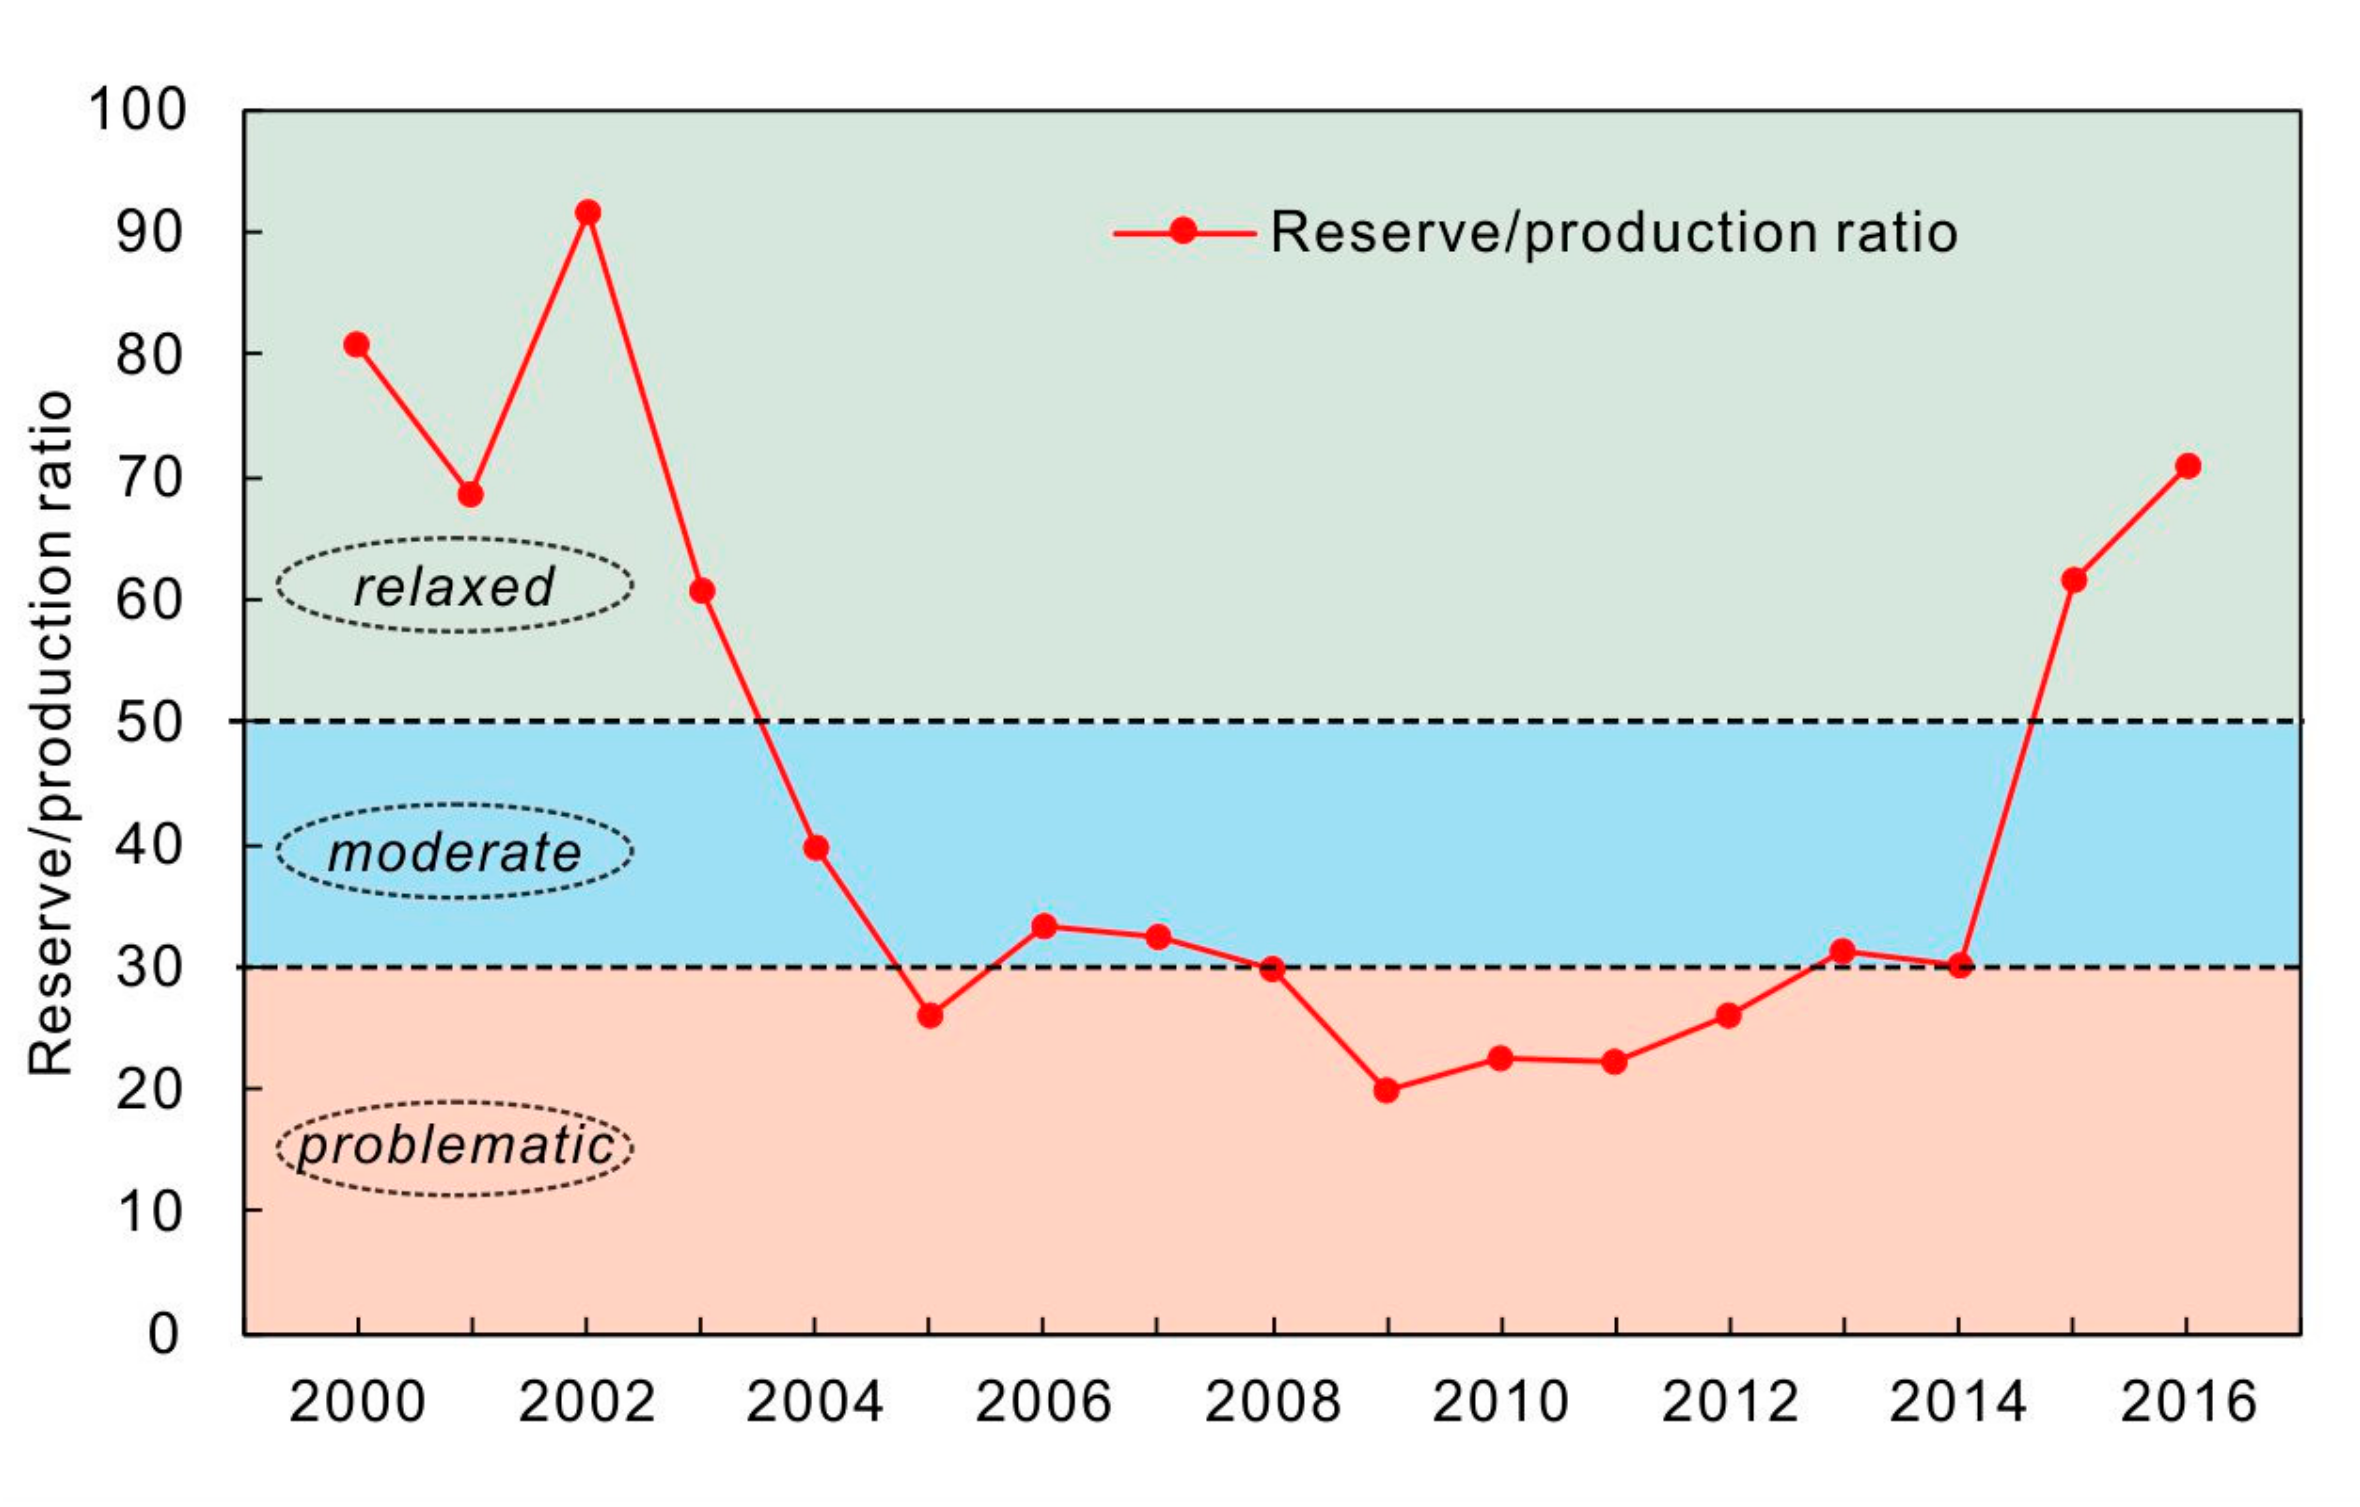
3.3.1. Reserve/Production Ratio (Rating: 3, Relaxed)
- : Reserve/production ratio of manganese mines in China during year t
- : Basic reserves of manganese Mines in China during year t
- : Manganese mineral production in China during year t
3.3.2. Import Dependence (Rating: 9, Problematic)
- : Import dependence of manganese mines in China during year t
- : Import volume of manganese mines in China during year t
- : Export volume of manganese mines in China during year t
- : Consumption of manganese mines in China during year t
3.4. Geostrategic Risk (Rating: 6, Moderate)
3.4.1. Import Concentration (Rating: 7, Problematic)
- : Concentration of importing country of manganese ore in China during year t
- : During year t, China’s imports of manganese ore in country c accounted for the share of total imports
3.4.2. Country Risk (Rating: 5, Moderate)
- : Weighted national risk
- : Risk rating of import source country C
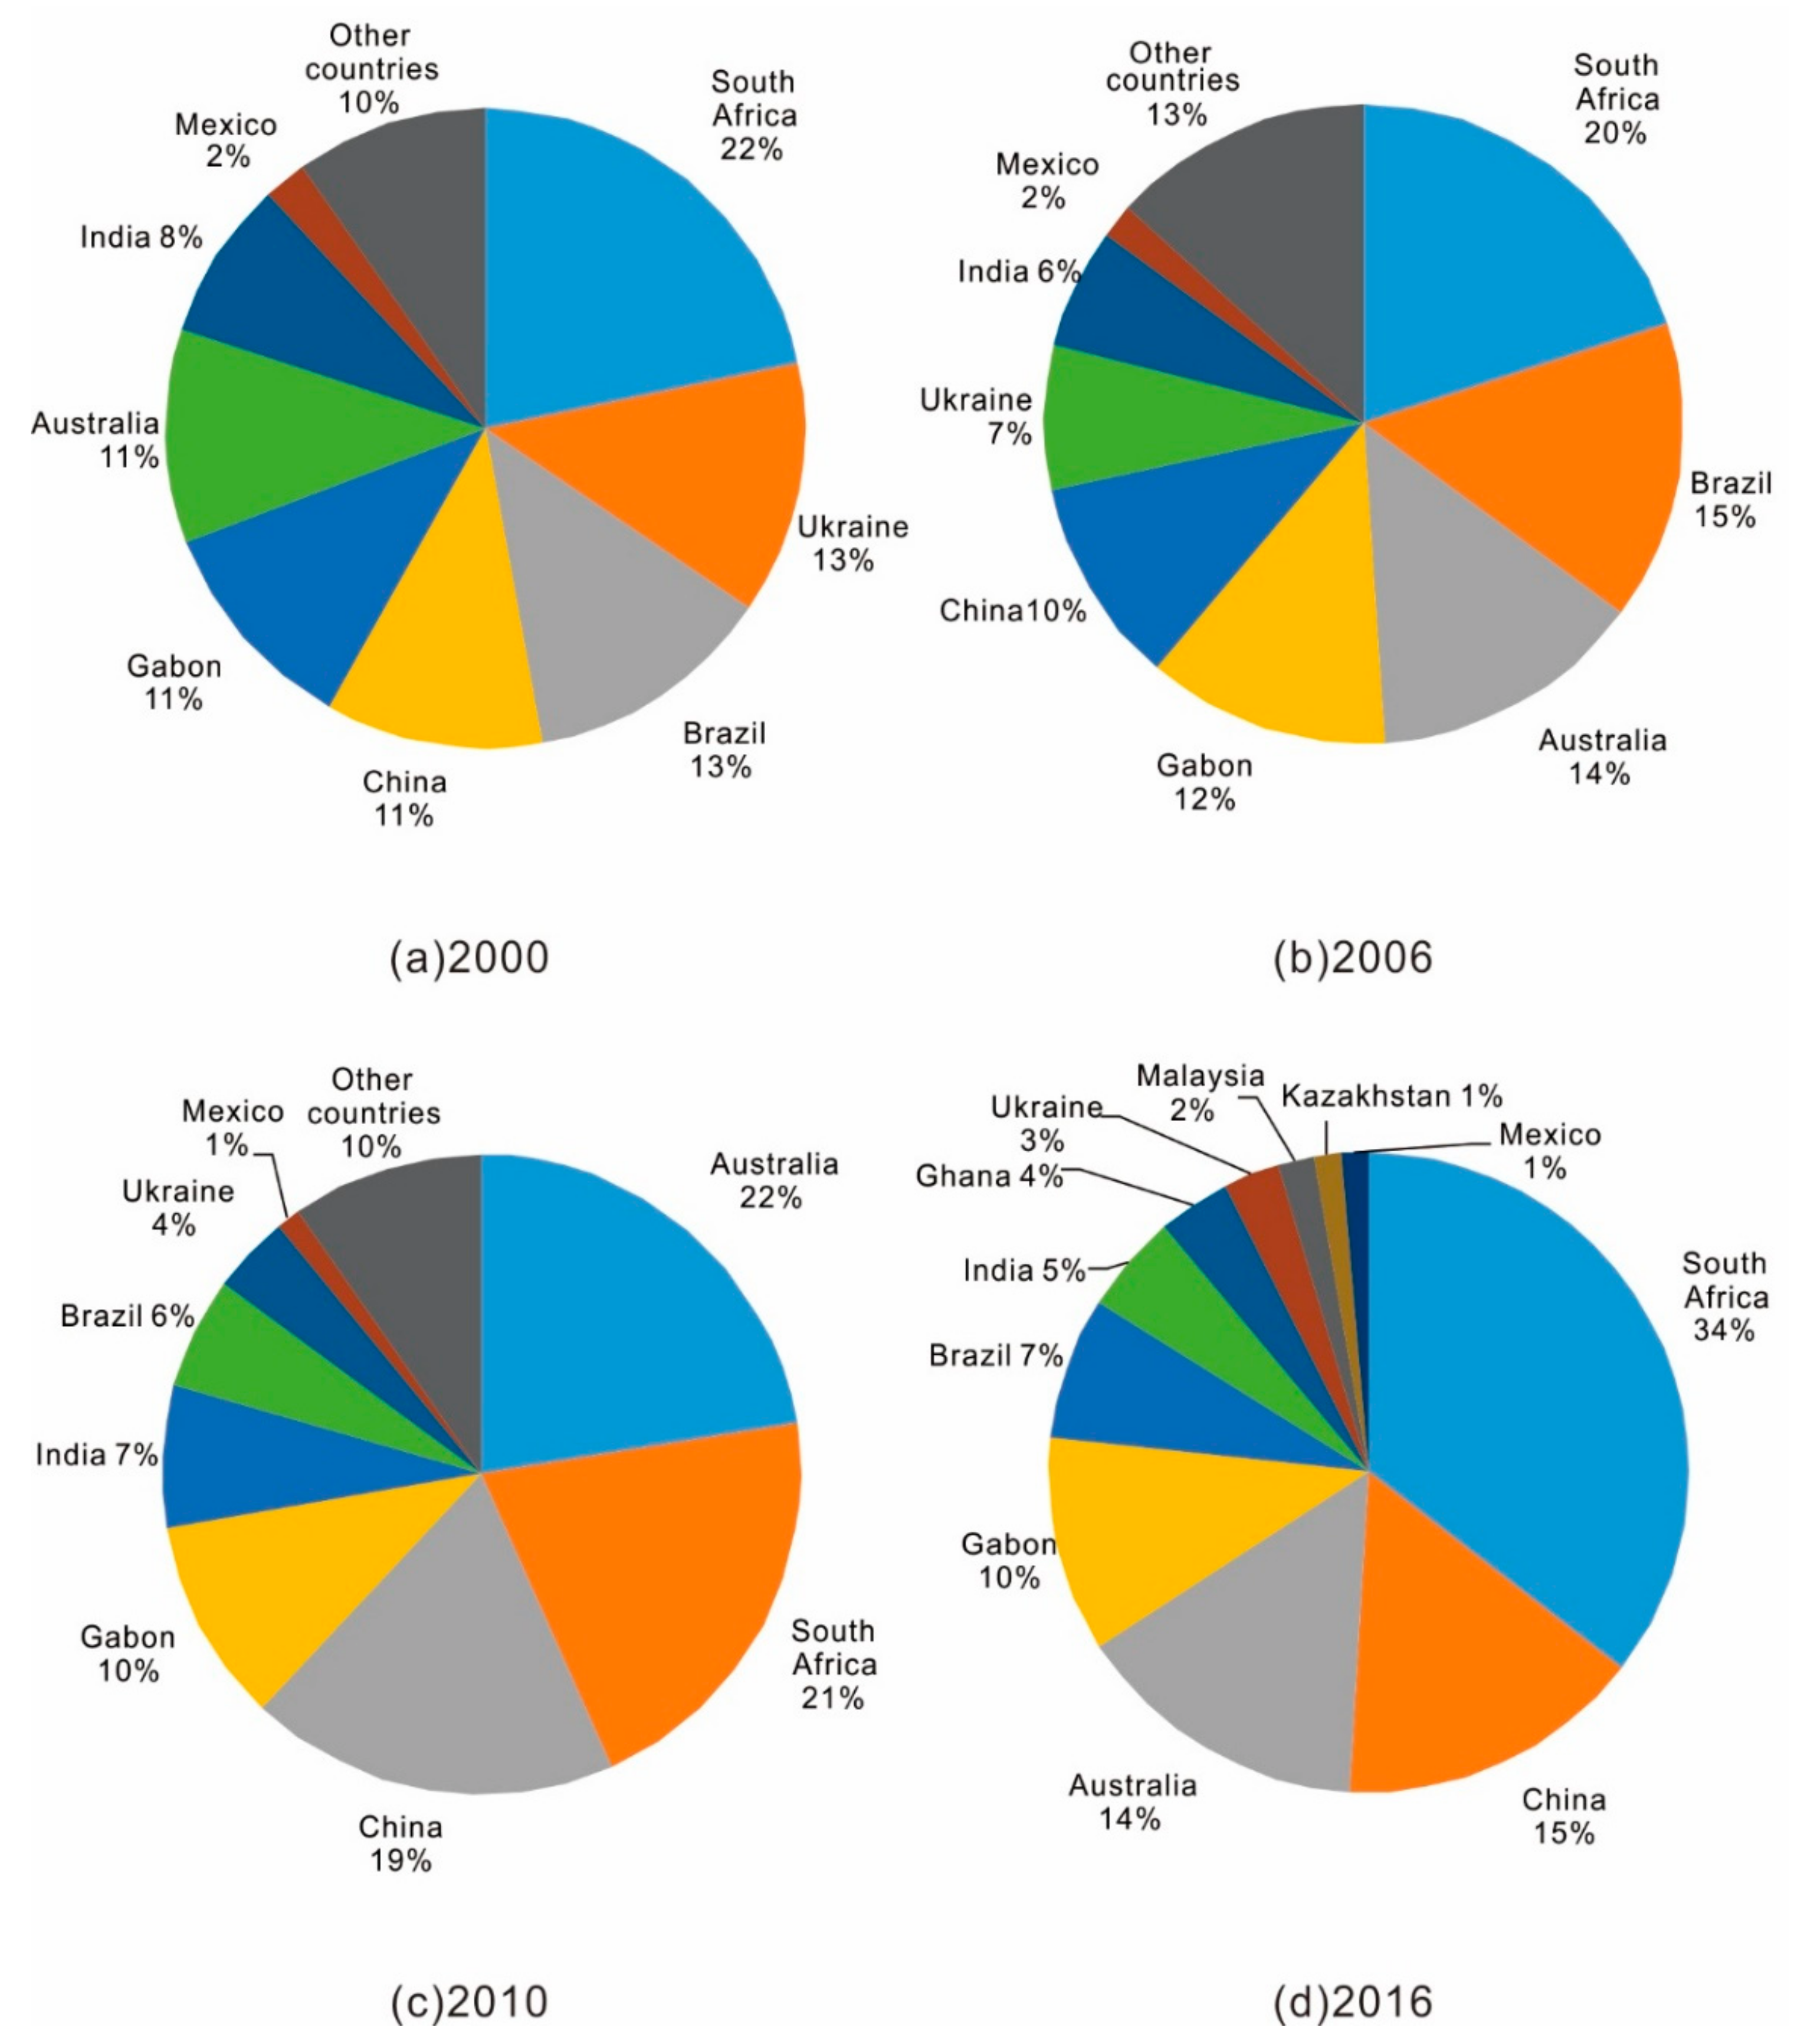
3.5. Country Concentration (Rating: 9, Problematic)
- : Herfindahl–Hirschman Index of the top four manganese producers in the world during year t
- : Country c’s share of the world’s total manganese production during year t
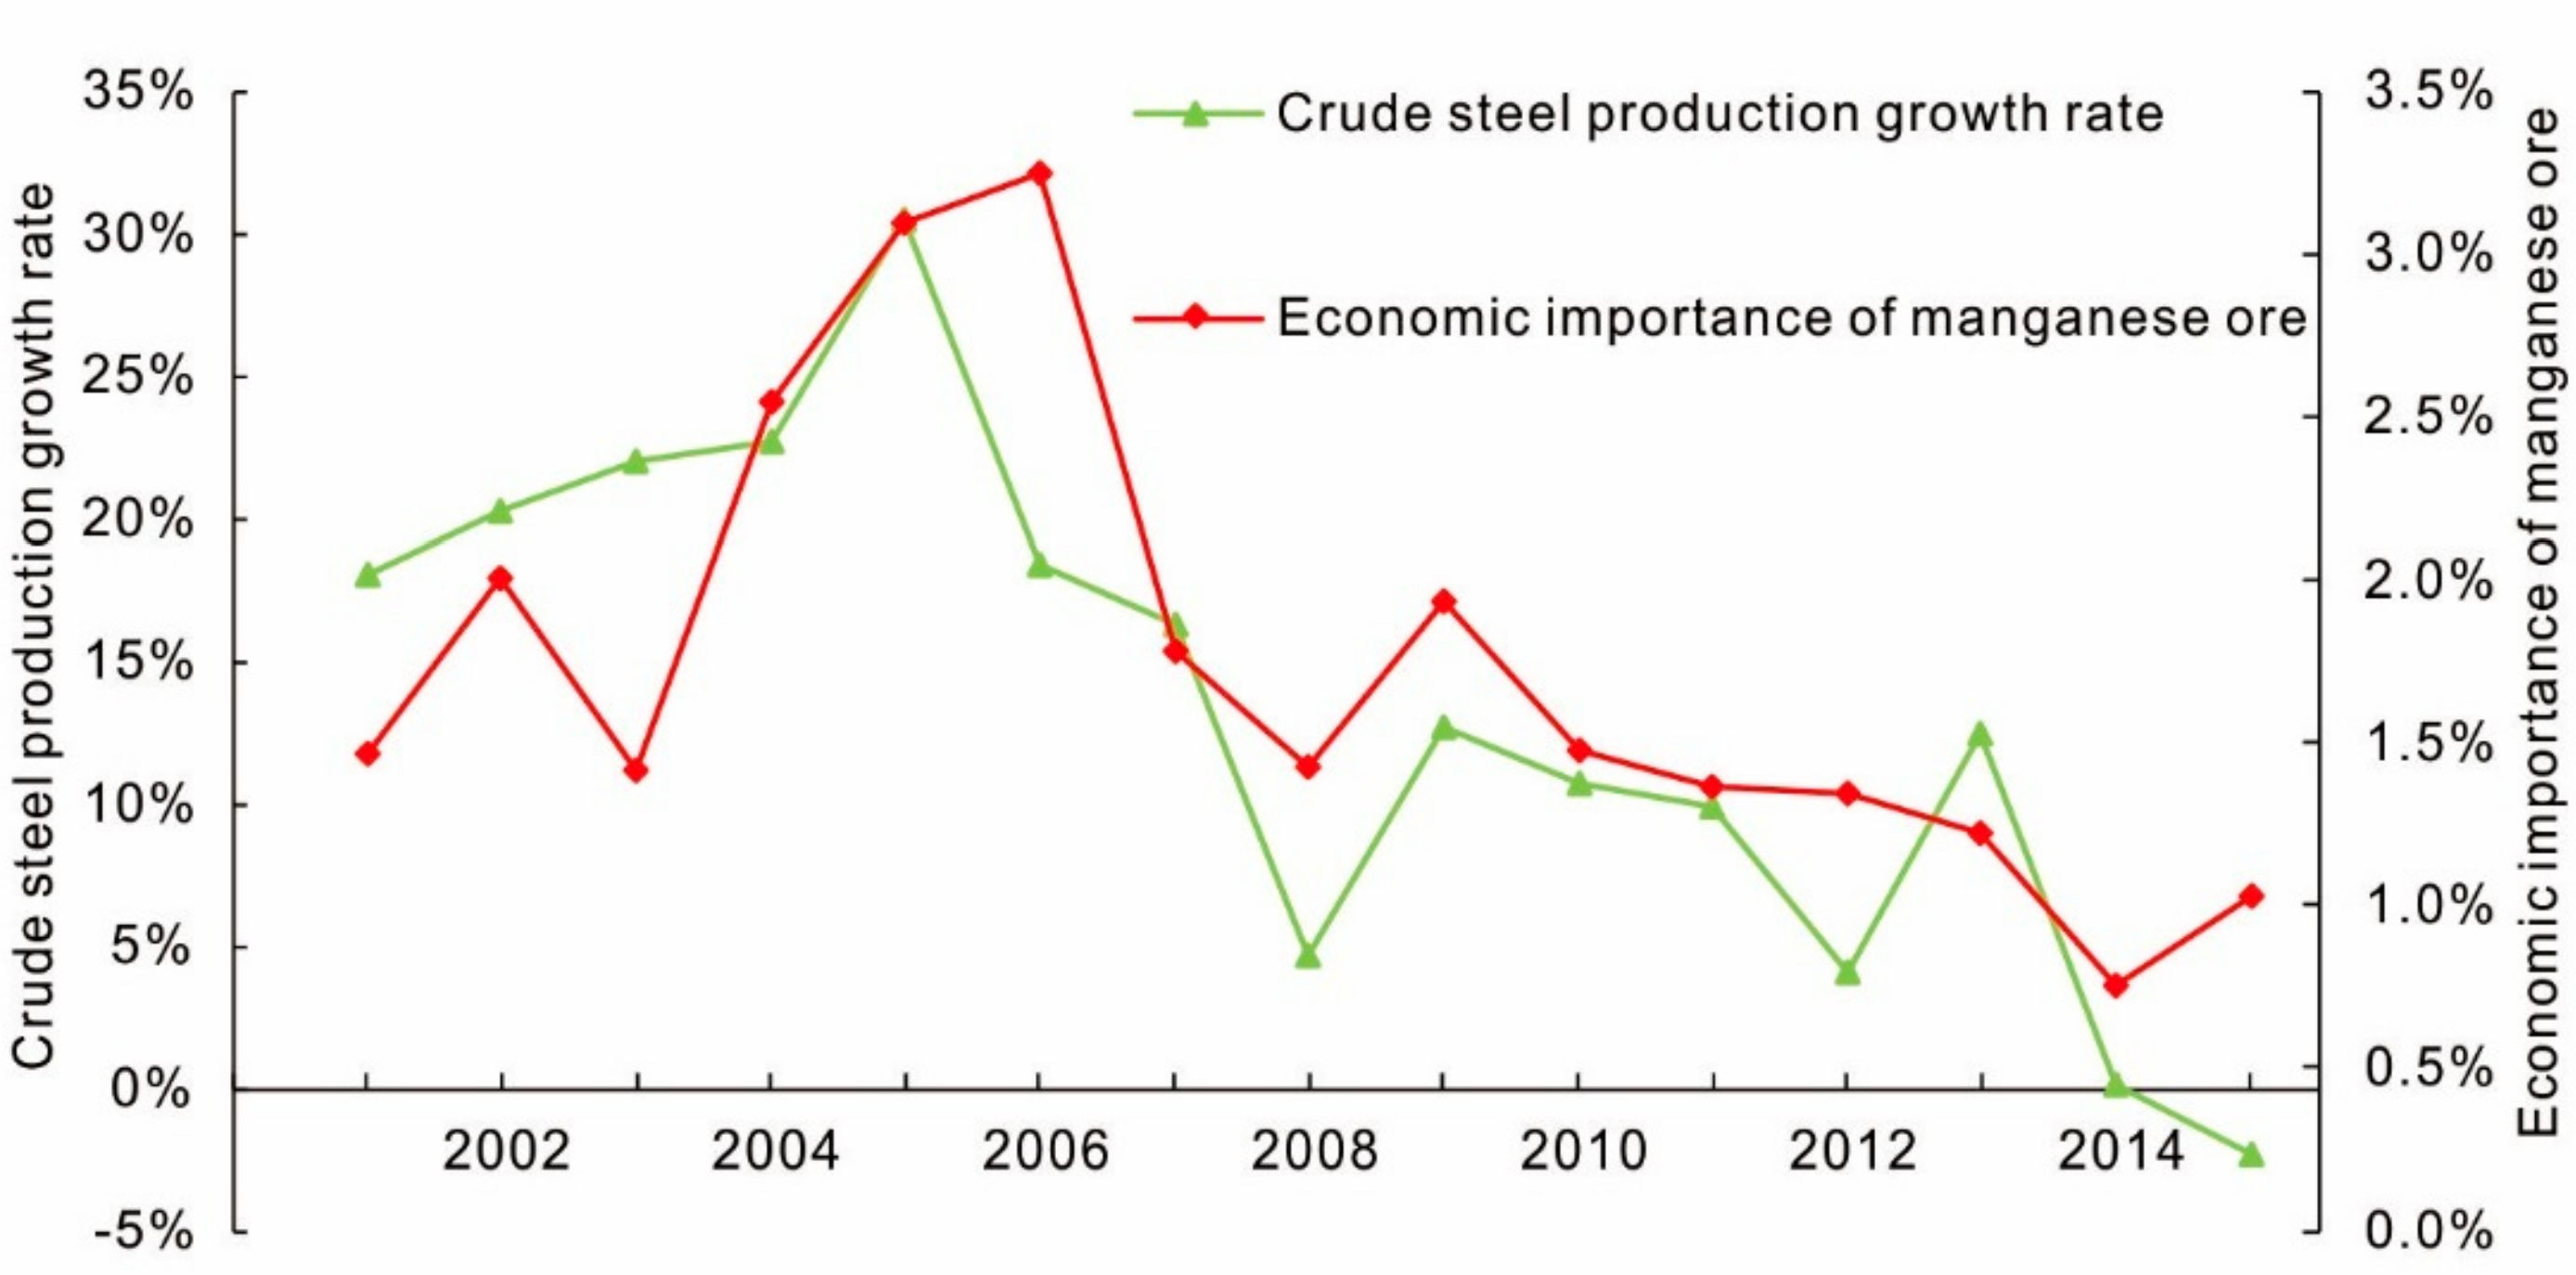
3.6. Future Supply and Demand Trend (Rating: 3, Relaxed)
- : the economic importance of minerals
- : Gross Domestic Product
- : The share of consumption of manganese ore in the sector s
- : Industrial value added by sector s
3.7. Overall Evaluation
4. Discussion
4.1. Main Supply Risk Drivers
4.2. Secondary Factors of China’s Supply Risk
4.3. Other Factors Influencing Manganese Supply Risk in China
5. Conclusions
Author Contributions
Funding
Acknowledgments
Conflicts of Interest
References
- Graedel, T.E.; Rachel, B.; Chelsea, C.; Thomas, C.; Joanne, C.; Lee, C.; Elizabeth, F.; Claire, H.; Christine, J.; Nassar, N.T. Methodology of metal criticality determination. Environ. Sci. Technol. 2012, 46, 1063–1070. [Google Scholar] [CrossRef]
- Morita, T.; Higashida, K.; Takarada, Y.; Managi, S. Does acquisition of mineral resources by firms in resource-importing countries reduce resource prices? Resour. Policy 2018, 58, 97–110. [Google Scholar] [CrossRef]
- Rosenau-Tornow, D.; Buchholz, P.; Riemann, A.; Wagner, M. Assessing the long-term supply risks for mineral raw materials—A combined evaluation of past and future trends. Resour. Policy 2009, 34, 161–175. [Google Scholar] [CrossRef]
- Henckens, M.L.C.M.; Ryngaert, C.M.J.; Driessen, P.P.J.; Worrell, E. Normative principles and the sustainable use of geologically scarce mineral resources. Resour. Policy 2018, 59, 351–359. [Google Scholar] [CrossRef]
- Henckens, M.L.C.M.; Biermann, F.H.B.; Driessen, P.P.J. Mineral resources governance: A call for the establishment of an International Competence Center on Mineral Resources Management. Resour. Conserv. Recycl. 2019, 141, 255–263. [Google Scholar] [CrossRef]
- U.S. Geological Survey (USGS). Interior Releases 2018’s Final List of 35 Minerals Deemed Critical to U.S. National Security and the Economy. 2019. Available online: https://www.usgs.gov/news/interior-releases-2018-s-final-list-35-minerals-deemed-critical-us-national-security-and (accessed on 10 May 2019).
- National Research Council (NRC). Minerals, Critical Minerals, and the U.S. Economy; The National Academies Press: Washington, DC, USA, 2008; Available online: http://dels.nas.edu/resources/static-assets/materials-based-on-reports/reports-in-brief/critical_minerals_final.pdf (accessed on 10 May 2019).
- Graedel, T.E.; Harper, E.M.; Nassar, N.T.; Nuss, P.; Reck, B.K. Criticality of metals and metalloids. Proc. Natl. Acad. Sci. USA 2015, 112, 4257–4262. [Google Scholar] [CrossRef] [PubMed]
- European Commission (EC). Report on Critical Raw Materials for the EU. Report of the Ad hoc Working Group on defining critical raw materials. 2010. Available online: https://eur-lex.europa.eu/legal-content/EN/TXT/?uri=CELEX:52011DC0025 (accessed on 10 May 2019).
- European Commission (EC). Report on Critical Raw Materials for the EU. Report of the Ad hoc Working Group on defining critical raw materials. 2014. Available online: https://eur-lex.europa.eu/legal-content/EN/TXT/?uri=CELEX:52014DC0297 (accessed on 10 May 2019).
- European Commission (EC). Report on Critical Raw Materials for the EU. Report of the Ad hoc Working Group on defining critical raw materials. 2017. Available online: https://eur-lex.europa.eu/legal-content/EN/TXT/?uri=CELEX:52017DC0490 (accessed on 10 May 2019).
- Jin, Y.; Kim, J.; Guillaume, B. Review of critical material studies. Resour. Conserv. Recycl. 2016, 113, 77–87. [Google Scholar] [CrossRef]
- Florescu, M.S.; Ceptureanu, E.G.; Cruceru, A.F.; Ceptureanu, S.I. Sustainable Supply Chain Management Strategy Influence on Supply Chain Management Functions in the Oil and Gas Distribution Industry. Energies 2019, 12, 1632. [Google Scholar] [CrossRef]
- U.S. Government Publishing Office (GPO). Strategic and Critical Materials Stockpiling Act. 1979. Available online: http://www.gpo.gov/fdsys/pkg/STATUTE-93/pdf/STATUTE-93-Pg319.pdf (accessed on 10 May 2019).
- Bauer, D.; Diamond, D.; Li, J.; Sandalow, D.; Telleen, P.; Wanner, B.U.S. Department of Energy Critical Materials Strategy. Office of Scientific & Technical Information Technical Reports. 2010. Available online: https://digital.library.unt.edu/ark:/67531/metadc834802/ (accessed on 10 May 2019).
- Goe, M.; Gaustad, G. Identifying critical materials for photovoltaics in the US: A multi-metric approach. Appl. Energy 2014, 123, 387–396. [Google Scholar] [CrossRef]
- Brown, T. Measurement of mineral supply diversity and its importance in assessing risk and criticality. Resour. Policy 2018, 58, 202–218. [Google Scholar] [CrossRef]
- Yokoi, R.; Nakatani, J.; Moriguchi, Y. Calculation of Characterization Factors of Mineral Resources Considering Future Primary Resource Use Changes: A Comparison between Iron and Copper. Sustainability 2018, 10, 267. [Google Scholar] [CrossRef]
- Zhou, Y.; Li, J.; Wang, G.; Chen, S.; Xing, W.; Li, T. Assessing the short-to medium-term supply risks of clean energy minerals for China. J. Clean. Prod. 2019, 215, 217–225. [Google Scholar] [CrossRef]
- Jasiński, D.; Cinelli, M.; Dias, L.C.; Meredith, J.; Kirwan, K. Assessing supply risks for non-fossil mineral resources via multi-criteria decision analysis. Resour. Policy 2018, 58, 150–158. [Google Scholar] [CrossRef]
- Gleich, B.; Achzet, B.; Mayer, H.; Rathgeber, A. An empirical approach to determine specific weights of driving factors for the price of commodities—A contribution to the measurement of the economic scarcity of minerals and metals. Resour. Policy 2013, 38, 350–362. [Google Scholar] [CrossRef]
- Boev, I.; Šorša, A.; Kovacevik, B.; Mitrev, S.; Boev, B. The use of factor analysis to distinguish the influence of parent material, mining and agriculture on groundwater composition in the Strumica valley, Macedonia. Geol. Croat. 2016, 69, 245–253. [Google Scholar] [CrossRef]
- Sohn, I. Long-term projections of non-fuel minerals: We were wrong, but why? Resour. Policy 2005, 30, 259–284. [Google Scholar] [CrossRef]
- Sohn, I. Long-term energy projections: What lessons have we learned? Energy Policy 2007, 35, 4574–4584. [Google Scholar] [CrossRef]
- Gemechu, E.D.; Helbig, C.; Sonnemann, G.; Thorenz, A.; Tuma, A. Import-based Indicator for the Geopolitical Supply Risk of Raw Materials in Life Cycle Sustainability Assessments. J. Ind. Ecol. 2016, 20, 154–165. [Google Scholar] [CrossRef]
- Soliman, J.L.; Lopez, N.S.A.; Biona, J.B.M.M. Assessing sustainability of long-term energy supply using desirability functions. Energy Procedia 2019, 158, 3723–3728. [Google Scholar] [CrossRef]
- Glöser, S.; Soulier, M.; Tercero Espinoza, L.A. Dynamic analysis of global copper flows. Global stocks, postconsumer material flows, recycling indicators, and uncertainty evaluation. Environ. Sci. Technol. 2013, 47, 6564–6572. [Google Scholar] [CrossRef]
- Calvo, G.; Valero, A.; Valero, A. Assessing maximum production peak and resource availability of non-fuel mineral resources: Analyzing the influence of extractable global resources. Resour. Conserv. Recycl. 2017, 125, 208–217. [Google Scholar] [CrossRef]
- Achzet, B.; Helbig, C. How to evaluate raw material supply risks—An overview. Resour. Policy 2013, 38, 435–447. [Google Scholar] [CrossRef]
- Giuliodori, D.; Rodriguez, A. Analysis of the stainless-steel market in the EU, China and US using co-integration and VECM. Resour. Policy 2015, 44, 12–24. [Google Scholar] [CrossRef]
- Sun, W.; Dong, K.; Zhao, T. Market demand dynamic induced mechanism in China’s steel industry. Resour. Policy 2017, 51, 13–21. [Google Scholar] [CrossRef]
- Liu, J.; An, R.; Xiao, R.; Yang, Y.; Wang, G.; Wang, Q. Implications from substance flow analysis, supply chain and supplier’ risk evaluation in iron and steel industry in Mainland China. Resour. Policy 2017, 51, 272–282. [Google Scholar] [CrossRef]
- Erdmann, L.; Graedel, T.E. Criticality of non-fuel minerals: A review of major approaches and analyses. Environ. Sci. Technol. 2011, 45, 7620. [Google Scholar] [CrossRef]
- U.S. Geological Survey (USGS). Mineral Commodity Summaries. 2019. Available online: https://doi.org/10.3133/70202434 (accessed on 10 May 2019).
- Dill, H.G. The “chessboard” classification scheme of mineral deposits: Mineralogy and geology from aluminum to zirconium. Earth-Sci. Rev. 2010, 100, 1–420. [Google Scholar] [CrossRef]
- U.S. Geological Survey (USGS). Mineral Commodity Summaries 2001-2018. 2001–2018. Available online: https://minerals.usgs.gov/minerals/pubs/mcs/ (accessed on 10 May 2019).
- Yin, J.; Xiao, K. Resources potential analysis and metallogenic prospect of Mn resources in China. Geol. China 2014, 5, 1424–1437. [Google Scholar]
- Xiao, J.; He, J.; Yang, H.; Wu, C. Comparison between Datangpo-type manganese ores and modern marine ferromanganese oxyhydroxide precipitates based on rare earth elements. Ore Geol. Rev. 2017, 89, 290–308. [Google Scholar] [CrossRef]
- Gao, J.; Yang, R.; Xu, H.; Zhang, X.; Feng, K.; Zheng, L. Genesis of Permian sedimentary manganese deposits in Zunyi, Guizhou Province, SW China: Constraints from geology and elemental geochemistry. J. Geochem. Explor. 2018, 192, 142–154. [Google Scholar] [CrossRef]
- Chen, X.; Jiang, S. Discovery of the largest Carboniferous manganese deposit in Longtou-Limiao, central Guangxi, China. China Geol. 2018, 1, 312–313. [Google Scholar] [CrossRef]
- Cong, Y.; Dong, Q.; Xiao, K.; Chen, J.; Gao, Y.; Yin, J. Characteristics and Predicted Potential of Mn Resources in China. Earth Sci. Front. 2018, 3. [Google Scholar] [CrossRef]
- Ministry of Natural Resources of the People’s Republic of China. China Mineral Resources 2001–2018. 2001–2018. Available online: http://www.mnr.gov.cn/sj/sjfw/kc_19263/zgkczybg/ (accessed on 10 May 2019).
- Esen, V.; Oral, B. Natural gas reserve/production ratio in Russia, Iran, Qatar and Turkmenistan: A political and economic perspective. Energy Policy 2016, 93, 101–109. [Google Scholar] [CrossRef]
- Kong, Z.; Lu, X.; Jiang, Q.; Dong, X.; Liu, G.; Elbot, N.; Zhang, Z.; Chen, S. Assessment of import risks for natural gas and its implication for optimal importing strategies: A case study of China. Energy Policy 2019, 127, 11–18. [Google Scholar] [CrossRef]
- Mo, J.; Jeon, W. The Impact of Electric Vehicle Demand and Battery Recycling on Price Dynamics of Lithium-Ion Battery Cathode Materials: A Vector Error Correction Model (VECM) Analysis. Sustainability 2018, 10, 2870. [Google Scholar] [CrossRef]
- Benchekroun, H.; Halsema, A.; Withagen, C. When additional resource stocks reduce welfare. J. Environ. Econ. Manag. 2010, 59, 109–114. [Google Scholar] [CrossRef]
- Hatayama, H.; Tahara, K. Evaluating the sufficiency of Japan’s mineral resource entitlements for supply risk mitigation. Resour. Policy 2015, 44, 72–80. [Google Scholar] [CrossRef]
- Zeng, X.; Xu, M.; Li, J. Examining the sustainability of China’s nickel supply: 1950–2050. Resour. Conserv. Recycl. 2018, 139, 188–193. [Google Scholar] [CrossRef]
- China Export & Credit Insurance Corporation. The handbook of Country Risk. 2017. Available online: http://www.sinosure.com.cn/index.shtml (accessed on 10 May 2019).
- Habib, K.; Hamelin, L.; Wenzel, H. A dynamic perspective of the geopolitical supply risk of metals. J. Clean. Prod. 2016, 133, 850–858. [Google Scholar] [CrossRef]
- National Bureau of Statistics of China. China Statistical Yearbook, 2001–2016. Available online: http://www.stats.gov.cn/tjsj/ndsj/ (accessed on 10 May 2019).
- Department of Industrial Statistics, National Statistical Bureau of China. China Industrial Statistics Yearbook, 2001–2016. 2001–2016. Available online: http://tongji.cnki.net/kns55/Navi/HomePage.aspx?id=N2017030048&name=YZGJN&floor=1 (accessed on 10 May 2019).
- Worldsteel. World Steel Statistical Yearbook, 2001–2018. 2001–2018. Available online: https://www.worldsteel.org/steel-by-topic/statistics/steel-statistical-yearbook.html (accessed on 10 May 2019).
- Lan, J.; Sun, Y.; Guo, L.; Li, Z.; Du, D.; Zhang, T.C. A novel method to recover ammonia, manganese and sulfate from electrolytic manganese residues by bio-leaching. J. Clean. Prod. 2019, 223, 499–507. [Google Scholar] [CrossRef]
- Luo, S.; Guo, H.; Zhang, S.; Wang, Z.; Li, X.; Yan, G.; Wang, J. Comprehensive utilization of metallurgic waste in manganese electrowinning: Towards high performance LiMn2O4. Ceram. Int. 2019, 45, 8607–8615. [Google Scholar] [CrossRef]
- Daw, G. Security of mineral resources: A new framework for quantitative assessment of criticality. Resour. Policy 2017, 53, 173–189. [Google Scholar] [CrossRef]
- O’Trakoun, J. China’s belt and road initiative and regional perceptions of China. Bus. Econ. 2018, 53, 17–24. [Google Scholar] [CrossRef]


| Country | Ore Grade (%) | Production in 2017 (Thousand Tons) | Production in 2018 (Thousand Tons) | Reserves (Thousand Tons) |
|---|---|---|---|---|
| South Africa | 30–50 | 5400 | 5500 | 230000 |
| Ukraine | 18–22 | 735 | 740 | 140000 |
| Brazil | 27–48 | 1160 | 1200 | 110000 |
| Australia | 42–48 | 2820 | 3100 | 99000 |
| Gabon | 50 | 2190 | 2300 | 65000 |
| China | 15–30 | 1700 | 1800 | 54000 |
| India | 50 | 734 | 770 | 33000 |
| Ghana | NA | 810 | 850 | 13000 |
| Mexico | 25 | 212 | 220 | 5000 |
| Kazakhstan | NA | 168 | 170 | 5000 |
| Malaysia | NA | 478 | 510 | NA |
| Other countries | 898 | 940 | small | |
| World total | 17300 | 18000 | 760000 |
| Risk Situation | Relaxed | Moderate | Problematic | ||||||
|---|---|---|---|---|---|---|---|---|---|
| Risk rating | 1 | 2 | 3 | 4 | 5 | 6 | 7 | 8 | 9 |
| Years | Consumption (Thousand Tons) | Export Volume (Thousand Tons) | Import Volume (Thousand Tons) | Import Dependence |
|---|---|---|---|---|
| 2000 | 3838.5 | 5.2 | 1203.7 | 31.22% |
| 2001 | 4916.7 | 3.3 | 1710.0 | 34.71% |
| 2002 | 4275.2 | 4.4 | 2079.6 | 48.54% |
| 2003 | 6255.6 | 3.9 | 2849.5 | 45.49% |
| 2004 | 11829.2 | 2.5 | 4646.7 | 39.26% |
| 2005 | 12864.4 | 2.1 | 4578.5 | 35.57% |
| 2006 | 13073.7 | 1.9 | 6207.6 | 47.47% |
| 2007 | 13549.0 | 3.9 | 6631.9 | 48.92% |
| 2008 | 15406.6 | 2.3 | 7567.9 | 49.11% |
| 2009 | 18910.2 | 27.4 | 9617.6 | 50.71% |
| 2010 | 20161.0 | 78.2 | 11578.2 | 57.04% |
| 2011 | 21071.7 | 1.9.2 | 12971.9 | 61.04% |
| 2012 | 20307.7 | 125.1 | 12365.8 | 60.28% |
| 2013 | 23471.9 | 50.6 | 16598.5 | 70.50% |
| 2014 | 23298.2 | 15.5 | 16207.7 | 69.50% |
| 2015 | 20249.0 | 17.2 | 15780.6 | 77.85% |
| 2016 | 21404.5 | 30.1 | 17051.3 | 79.52% |
| 2006 | 2016 | ||||||||
|---|---|---|---|---|---|---|---|---|---|
| Importing Country | Import Share% | HHI Index | Country Risk Rating | Country Risk Weight | Importing Country | Import Share% | HHI Index | Country Risk Rating | Country Risk Weight |
| Australia | 43.02% | 1850 | 2 | 0.86 | South Africa | 41.65% | 1735 | 5 | 2.08 |
| Gabon | 19.53% | 381 | 7 | 1.37 | Australia | 23.82% | 568 | 2 | 0.48 |
| South Africa | 14.95% | 224 | 5 | 0.75 | Ghana | 10.28% | 106 | 6 | 0.62 |
| Ghana | 9.42% | 89 | 7 | 0.66 | Brazil | 7.60% | 58 | 6 | 0.46 |
| Brazil | 6.62% | 44 | 6 | 0.40 | Gabon | 7.37% | 54 | 6 | 0.44 |
| India | 1.77% | 3 | 5 | 0.09 | Malaysia | 4.90% | 24 | 4 | 0.20 |
| Vietnam | 1.16% | 1 | 6 | 0.07 | Myanmar | 1.58% | 2 | 8 | 0.13 |
| Myanmar | 0.93% | 1 | 8 | 0.07 | Morocco | 0.51% | 0 | 6 | 0.03 |
| Other countries | 2.59% | 7 | Other countries | 1.53% | 2 | ||||
| World total | 100% | 2600 | 4.26 | World total | 100.00% | 2550 | 4.48 | ||
| Years | The Share of the Top Four Manganese Producers | HHI | |||||||
|---|---|---|---|---|---|---|---|---|---|
| 2000 | South Africa | 21.70% | Ukraine | 12.77% | Brazil | 12.64% | China | 10.99% | 914.69 |
| 2001 | South Africa | 19.46% | Brazil | 18.82% | Australia | 12.47% | Ukraine | 12.24% | 1038.08 |
| 2002 | South Africa | 18.57% | Brazil | 16.05% | Australia | 12.14% | Ukraine | 11.60% | 884.30 |
| 2003 | South Africa | 19.51% | Australia | 14.63% | Brazil | 12.07% | Ukraine | 10.73% | 855.81 |
| 2004 | South Africa | 20.37% | Australia | 13.90% | Brazil | 13.90% | Gabon | 11.76% | 940.15 |
| 2005 | South Africa | 20.00% | Brazil | 15.14% | Australia | 13.81% | Gabon | 12.29% | 970.95 |
| 2006 | South Africa | 19.33% | Australia | 18.40% | China | 13.45% | Brazil | 11.51% | 1025.56 |
| 2007 | South Africa | 20.63% | Australia | 20.16% | China | 15.87% | Gabon | 11.83% | 1223.97 |
| 2008 | South Africa | 21.80% | Australia | 17.44% | China | 16.54% | Gabon | 12.03% | 1198.06 |
| 2009 | China | 26.85% | Australia | 19.81% | South Africa | 17.59% | India | 9.07% | 1505.49 |
| 2010 | Australia | 22.30% | South Africa | 20.86% | China | 18.71% | Gabon | 10.22% | 1386.91 |
| 2011 | South Africa | 21.25% | Australia | 20.00% | China | 17.50% | Gabon | 11.63% | 1292.95 |
| 2012 | South Africa | 22.78% | Australia | 19.49% | China | 18.35% | Gabon | 10.44% | 1345.09 |
| 2013 | South Africa | 25.44% | China | 17.75% | Australia | 17.63% | Gabon | 11.66% | 1409.31 |
| 2014 | South Africa | 29.21% | Australia | 17.13% | China | 16.85% | Gabon | 10.45% | 1540.28 |
| 2015 | South Africa | 34.44% | China | 16.67% | Australia | 16.11% | Gabon | 10.00% | 1823.77 |
| 2016 | South Africa | 33.76% | China | 14.84% | Australia | 14.27% | Gabon | 10.32% | 1669.88 |
| Mine | Production Reduction Time | Deadline | Reduced Production |
|---|---|---|---|
| Tshipi | 2016/1 | 2016/1 | 860 thousand tons |
| UMK | 2015/2 | 2016/1 | Half-production in December 2015, only in the last week of January 2016 and no sales of manganese ore in January |
| SOUTH32 | 2015/1 | 2016/1 | —— |
| AML | Late 4th quarter of 2015 | —— | —— |
| Country | Company/Project | Production Capacity (1000 Tons/Year) | Commissioning Time |
|---|---|---|---|
| Malaysia | Pertama Ferroalloys (JV of Asia Minerals, Nippon Denko, Shinsho Corp) | 2000 (Sintered manganese ore) | 2015 |
| Togo | Ferrex-Nayega, project | 600 (Phase 1) to 2500 | 2016 |
| India | Runbat Mines | 1610 | 2016 |
| India | MOLK-Kandri project | 570 | 2018 |
| Indonesia | Gulf Minerals/Asia Mine | 1080 | 2018 |
| India | MOLK-Ukwa project | 1050 | 2019 |
| South Africa | Wessels Mine | 500 | —— |
| Application Field | Industry Sector | As | Qs (Billion) | GDP (Billion) | EC (%) |
|---|---|---|---|---|---|
| metal industry | Ferrous metal smelting and rolling processing industry | 0.9 | 450.34 | 90030.9. | 0.75% |
| Household appliances | Electrical machinery and equipment manufacturing | 0.04 | 1055.9 | ||
| battery | Electrical machinery and equipment manufacturing | 0.02 | 1055.9 | ||
| Chemical industry | Chemical raw materials and chemical manufacturing | 0.04 | 1194.74 |
© 2019 by the authors. Licensee MDPI, Basel, Switzerland. This article is an open access article distributed under the terms and conditions of the Creative Commons Attribution (CC BY) license (http://creativecommons.org/licenses/by/4.0/).
Share and Cite
Li, S.; Yan, J.; Pei, Q.; Sha, J.; Mou, S.; Xiao, Y. Risk Identification and Evaluation of the Long-term Supply of Manganese Mines in China Based on the VW-BGR Method. Sustainability 2019, 11, 2683. https://doi.org/10.3390/su11092683
Li S, Yan J, Pei Q, Sha J, Mou S, Xiao Y. Risk Identification and Evaluation of the Long-term Supply of Manganese Mines in China Based on the VW-BGR Method. Sustainability. 2019; 11(9):2683. https://doi.org/10.3390/su11092683
Chicago/Turabian StyleLi, Shule, Jingjing Yan, Qiuming Pei, Jinghua Sha, Siyu Mou, and Yong Xiao. 2019. "Risk Identification and Evaluation of the Long-term Supply of Manganese Mines in China Based on the VW-BGR Method" Sustainability 11, no. 9: 2683. https://doi.org/10.3390/su11092683
APA StyleLi, S., Yan, J., Pei, Q., Sha, J., Mou, S., & Xiao, Y. (2019). Risk Identification and Evaluation of the Long-term Supply of Manganese Mines in China Based on the VW-BGR Method. Sustainability, 11(9), 2683. https://doi.org/10.3390/su11092683