Abstract
Many chemical plant explosion accidents occur along with the development of the chemical industry. Meanwhile, the interaction and influence of various factors significantly increase the uncertainty of the evolution process of such accidents. This paper presents a framework to dynamically evaluate chemical plant explosion accidents. We propose twelve nodes to represent accident evolution and establish a Bayesian network model for chemical plant explosion accidents, combining historical data with expert experience to support the prevention, management, and real-time warning. Hypothetical scenarios and catastrophic explosion scenarios were analyzed by setting different combinations of states for nodes. Moreover, the impacts of factors such as factory type, material form, accident equipment, the emergency response on casualty and property loss are evaluated. We find that sensitivity of property loss and casualties to factory type and ongoing work are less significant; the equipment factors result in more casualties than that from personnel factors; the impact of emergency response on the accident results is significant; equipment safety management and personnel safety training are the most important measures to prevent chemical plant explosion risks.
1. Introduction
With the development of the world’s industrialization and the increasing population, the chemical industry is booming, the chemical plant accidents continue to rise rapidly [1]. Since most of the raw materials are inflammable, explosive, toxic, and harmful, and besides, the production process is unique and dangerous, chemical plants have become a high-risk place for safety accidents. There is an example of a chemical plant explosion accident in Xiangshui, Jiangsu Province, on 21 March 2019. The explosion caused by improper operation of the workers or blockage of pipes during the production process, resulting in 78 deaths and 566 injuries [2]. Also, on 17 April 2013, a chemical fertilizer plant in Texas, USA caught fire and exploded. Over 70 houses were damaged, 260 people injured, and 15 people died. The cause of the explosion was the illegal operation [3]. We check the accident record of the State Administration of Work Safety, 125 chemical plant safety accidents occurred in China between 2006 and 2015, 524 people killed, 438 injured, and 21 missing. Among them, explosion accidents accounted for 46% of the total accidents and 56% of the total deaths [4]. We find that the causes of many accidents are small, but they could evolve into significant safety accidents and become a huge safety hazard in society. If a chemical plant explodes, it will cause accidents in neighboring plants, and the consequences will be more serious [5]. Chemical hazards are defined as a series of conditions that can have harmful consequences [6]. Prevention is the key to reducing the occurrence of such explosion accidents. Quantitatively evaluating the role and impact the weight of each fine-grained element in chemical explosion accidents is very necessary. However, developing a suitable dynamic model to prevent explosions can be difficult because of the complex dynamic process of a chemical plant explosion. There are huge uncertainties at any stage of the accident, and each stage of the change will have varying degrees of consequences.
Due to the above reasons, factory managers and relevant departments must set reasonable management regulations, develop detailed emergency plans, and make a strategic response. The effective method should be able to combine the characteristics of the factory and use specific strategies to reduce risks and casualties. So far, many researchers have summarized and analyzed many historical cases and extensively discussed the core causes of personnel, equipment, and management that led to chemical plant explosion accidents. In particular, Wang et al. used characteristics of chemical accidents and identified the specific manifestations of each cause category in Human Factors Analysis and Classification System (HFACS). An analysis of causes of accidents was made using the supplemented HFACS model based on data on a specific chemical enterprise’s 102 accidents that occurred in 2012–2016. Finally, corresponding improvement and control measures were proposed to prevent chemical accidents [7]. Liu counted the accident data of chemical production enterprises from 2005 to 2014, used statistical analysis methods and the Grey Markov prediction method to get the law and characteristics of accidents [5]. Liu et al. discussed the types of accidents and specific causes for fire accidents in domestic chemical parks since 2010 and proposed suggestions [8]. Kao et al. used hazard analysis to analyze explosions at a manufacturing plant in northern Taiwan to ensure that similar out-of-control accidents do not occur again [9].
However, these studies don’t quantitatively study the impact and consequences of these factors on the probability of an explosion accident. Traditional risk analysis must also support elastic analysis and decision support [10]. Risk prediction models for these accidents, which is very important for accident reduction, prevention, and decision-making. These methods based on statistical-empirical summarization have some problems in the modeling of chemical plant explosion accidents: (1) They pay attention to the distribution characteristics of data but did not find the relationship between critical factors. (2) It is difficult to answer questions such as “what-if [11].” (3) They concerned the impact of significant factors, but the prediction of accidents is macroscopic, lacking microscopic prediction [5]. Traditional emergency response strategies are inadequate in predicting and handling chemical plant explosions. We need new methods to assess the uncertainty of the cause.
In this article, we use Bayesian network (commonly referred to as BN) to solve the above problems. The Bayesian network is a directed acyclic graph that describes the relationship between nodes in the form of directed edges with conditional probability distributions [12]. Bayesian network can represent the relationship between variables, and we try to study how various factors affect the likelihood and consequences of an accident. The Bayesian network has a solid theoretical foundation and is convenient for processing incomplete data. BN can determine the network structure and parameters through machine learning and use prior knowledge and expert experience. BN lays a foundation for reasoning and prediction, which improves the efficiency and effectiveness of accident prediction. BN can intuitively represent complexity of the chemical industry with the ability to handle uncertainty and update event probabilities [1].
Now there are some papers on chemical plant explosion analysis based on Bayesian network. Khakzad et al. proposed a dynamic Bayesian network-based approach to assess chemical infrastructure explosions, model the spatiotemporal evolution of the domino effect, and quantify the most likely accident sequence [13]. They also introduced the latest applications of Bayesian networks in dynamic security analysis of process systems and compared conventional risk assessment techniques such as fault trees, event trees and bowtie analysis, which have long been used for effective safety analysis of process plants [14,15]. Villa et al. reviewed the risk assessment methodology and its limitations in the chemical processing industry [16]. This method has also attracted much attention in the fields of medical care, transportation, disaster warning, and accident analysis [17,18,19]. Many scholars have used this method. Tang et al. focused on urban dirty bomb attacks and used Bayesian networks to analyze the risk of urban dirty bomb attacks [20]. Francis et al. used Bayesian Belief Networks (BBN) to construct a knowledge model for pipe breaks in a water zone [21]. Wu et al. used Bayesian networks to estimate the probability of natural gas pipeline network accidents, which helped the emergency rescue and decision-making. Experiments show that combining Bayesian networks with Dempster-Shafer evidence theory is a suitable method [22]. Yuan et al. applied the Bayesian network to the dust explosion scenario risk analysis and applied the method to case studies [23]. Wu et al. established a fast, dynamic Bayesian network model to evaluate the evolution of the subway station fire and its consequences. The authors proposed 28 BN nodes to represent the evolution of subway station fires and used the BN model to quantitatively assess the cause, interventions, and consequences of fire. This study helped the emergency decision-making of the dynamic evaluation of the subway station. [24]. Zhang et al. proposed the “EEB model.” The EEB model combines event tree (E), event evolution graph (E), and Bayesian network (B), which considers more factors, and the probabilistic analysis obtained is more comprehensive than other models. The author applied the model to oil pipeline accidents and demonstrated the potential of the model for risk assessment and performance analysis [25]. The above literature shows that the Bayesian network solves the uncertainty problem in specific areas.
However, when shifting the perspective to the chemical plant explosion accident area, there was only limited and sporadic data. Moreover, the chemical plant explosion accident involves new and uncertain risk factors. Based on the complexity of accidents, the number of case samples, and the prior knowledge that we have, we use Huang’s method [11], which is a hybrid approach, uses the Bayesian network structure learning algorithm to combine the expert knowledge with historical data.
Finally, we constructed a flexible and scalable Bayesian model to analyze, predict, and make decisions on chemical plant explosion accidents. The user can get different decision support by changing different “what assumptions.” The structure of the article is as follows. In Section 2, we describe the data and methods used to build a Bayesian network model for chemical plant explosions, and then we explain the construction details of the model. In Section 3, we conduct scenario reasoning and sensitivity analysis and get some conclusions. We conclude the paper in the last section.
2. Materials and Methods
We first describe the data sources and methods for the Bayesian network model used to construct chemical plant explosion accidents. Figure 1 shows the overview of our framework, which has three steps: (1) Identify the nodes and the attributes of the nodes. By analyzing the process and results of the actual cases, using expert knowledge, we determine the 12 core nodes and assign these nodes to different states. (2) Construct the network structure and get node probability distribution. The structure learning process of the Bayesian network needs to combine priori information to find the best network structure. We use ISM (Interpretive Structural Model) [26] and K2 algorithm [27] to find the optimal network. We use the Dempster-Shafer evidence theory to process the expert knowledge to improve the BN structure. The probability distributions are obtained by EM (Expectation-Maximization) algorithm [28]. (3) Scenario reasoning for chemical plant explosion accidents and sensitivity analysis of Bayesian network nodes. We use the Scrapy crawler tool to get website data, natural language processing tools and automated scripts to discretize data, MATLAB 2019a software to implement Bayesian network structure learning, and GeNIe 2.4 software [29] to complete parameter learning.
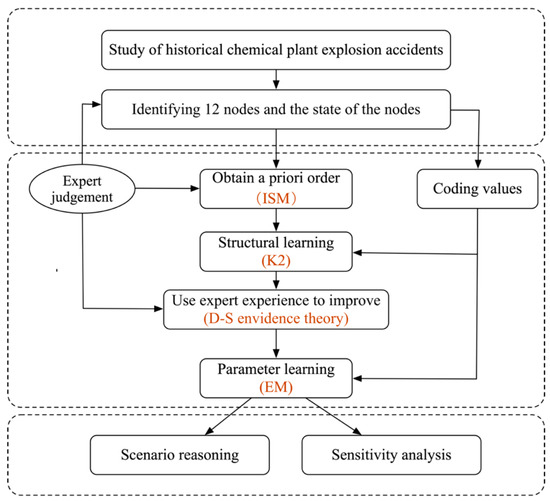
Figure 1.
The process flow of framework.2.1. Identify BN Variables.
Our data set contains 900 international cases and 100 Chinese cases. The cases come from the official website of China National Emergency Response Department, EU eMARS Accident Platform, US Process Safety Incident Database (PSIDNET), and the FACTS chemical accident database, we write a website crawler to crawl 300 detailed chemical accident reports, then we store them in a relational database for easy retrieval. By writing automated scripts for data cleaning and sorting, we ended up with 1000 chemical plant explosions cases. Each case has some numeric-like properties that are easily extracted by computer scripts, such as some numbers, but most of the rest of the information needs to be manually extracted.
To identify the Bayesian network nodes of chemical plant explosion accidents, we reviewed and analyzed the literature on chemical plant explosion accidents, then summarized the attributes and key features of the existing cases (some domestic and foreign chemical plant explosion accident databases and some official detailed descriptions of accidents). We consult the experts from People’s Public Security University of China engaged in risk assessment research to identify the nodes that play a crucial role in the development of chemical plant explosion accidents. Finally, we get 12 nodes and divide them into four categories, which correspond to “Accident background,” “Cause of accidents,” “Critical event,” and “Accident results.”
Among the 12 nodes, the nodes included in the “Accident background” category describe the objective conditions of accidents. The nodes of “Cause of accident” category include “personnel factors” and “equipment factors,” which explain the key factors that trigger an accident. After the accident is triggered, an explosion occurred, followed by an emergency response. So, we divide the nodes of the “Critical event” category into “Incidental event,” “Type of explosion,” and “Emergency response.” The nodes of the “Accident results” are divided into “property loss” and “casualties.” We use these two nodes to classify the severity of the consequences caused by accidents. Our description of each Bayesian network node is as follows:
- Activity: This node refers to some activities carried out in the chemical plant, such as running, using, transporting, and cleaning equipment. The frequency and danger of different activities in the factory are different. For example, when making chemicals, accidents are more likely to occur;
- Factory type: Due to numerous chemical industry categories, we divide them into three main categories: petrochemical, chemical fiber, and basic chemical. This is just a big category for the chemical industry, and there are many different subcategories under each category;
- Hazardous material characteristics: The characteristics of hazardous materials have a direct impact on the severity of the explosion. Some hazardous materials are flammable and explosive, toxic and harmful, or easy to vaporize. If a factory with toxic and harmful hazardous materials explodes, it will affect the health of the residents around the factory and lead to inadequate emergency response or more severe consequences;
- Material form: This node refers to the form of the material, such as gas, liquid, powder, solid. If an explosion caused by liquids or gases, hazardous materials in this state spread quickly, and the consequences may be more serious. Among them, the dust explosion is a very important type, and we classify this type into the state (3);
- Accident equipment: We use the device ontology model [30] to divide accident equipment into four main categories: heat exchange equipment, reaction equipment, fluid conveying equipment, and tower equipment. High-Pressure equipment such as a pump or compressor is the most dangerous equipment. The reaction is often carried out under high pressure or high temperature, so the reaction equipment includes rotating machinery;
- Personnel factors: this node refers to accidents caused by personnel factors. The personnel factors include operational violations, behavioral errors, and unfamiliar with the operational process;
- Equipment factors: This node refers to chemical plant explosion accidents caused by equipment factors. Based on existing literature and expert experience, equipment factors can be classified into equipment selection errors, static electricity or explosion-proof line problems, equipment aging, lack of maintenance, and equipment damage;
- Incidental event: There is a cause of explosion before the explosion, such as over-temperature and over-pressure in the equipment, material flowing out of the equipment, the material is ignited;
- Type of explosion: We classify this node into two states based on the expert experience, one is normal explosion, the other is other types of an explosion, such as a flash explosion. Normal explosions often have relatively small casualties and will not cause a series of accidents. Other types of explosions refer to a series of explosions or fires that cause more serious consequences;
- Emergency response: This node refers to the emergency mechanism, the contingency plan of the chemical plant, and the emergency plan after the explosion. We define two situations, effective response, and inadequate response;
- Property loss: We classify property loss into four levels according to the Regulations on Production Safety Accident Reporting and Investigation and Handling [31]. Property loss have four levels: less than 10 million yuan, 10–20 million yuan, 5000–100 million yuan, more than 100 million yuan;
- Casualties: Similar to property damage, casualties have four levels.
Then we determine the nodes’ values that need to represent the state of each node accurately. To discretize the data of 1000 chemical plant explosion accidents, we recruited ten programmers, and all the programmers are undergraduates of the People’s Public Security University of China, they all have a precise understanding of accidents. The specific steps for pre-processing information are:
Step one: We screen out samples of chemical plant explosion accidents;
Step two: We determine the range of values for each node. We organize the collected historical cases to enrich the possible state of each node;
Step three: We generate encoding rules. We randomly selected 250 samples and distributed them equally to 10 programmers. The programmers code separately, discuss the state of all nodes and remove the sparse state, and finally use this encoding scheme to encode the data set. We summarize the coding rules in Table 1 and show the various states that 12 nodes can take. In our data set, we found that the material form for some explosions was a gas-liquid mixture. Then we consider adding a “Gas-liquid mixture” as a new material form;

Table 1.
States of Bayesian nodes.
Step four: We manage the node states in cases. Since many case descriptions are not standardized and not detailed enough, they require manual and machine learning methods for attribute extraction and categorization. We exclude the cases with too many missing variables. If we cannot find the value of a particular variable from the case, we ask the programmers to search the Internet for missing information about the case. If the coder cannot find the relevant value, they will remove the case from the case library. After this step, we encode 1000 cases.
2.1. BN Construction
2.1.1. Step 1: Structure Learning
At this stage, we use 1000 cases to learn the BN structure. The Bayesian network learning method based on sample data contains three categories: the method based on score search, the method based on dependency analysis, and the method based on hybrid learning [32]. The scoring search method is standardized and straightforward and is suitable for the study of Bayesian network structures with few variables. We use the K2 algorithm [27] in the scoring search method to build the Bayesian network. The K2 algorithm has the advantages of being able to integrate prior knowledge and having a better time performance effectively, but the node order needs to be given in advance. It uses the greedy search to calculate the posterior probability associated with the node and takes the node with the largest posterior probability as its parent node. The construction of the network structure is completed by adding the parent node [33].
To implement the K2 algorithm, we define the input variables, ensure that the number of cases is sufficient, specify the prior order of the nodes, and make sure that “the parent node must appear in front of its child nodes.” The K2 algorithm is very sensitive to the initial ordering of variables. To get a reasonable prior sequence of the K2 algorithm, we use the ISM method [26] to derive a factor hierarchy diagram showing the direct and indirect relationships between the nodes. This hybrid method was proposed by Huang (called “ISM-K2”), which enhances the BN structure learning method by using the expert knowledge caused by the ISM method [11]. The steps to get the node prior sequence with the ISM algorithm are:
- (1)
- Use expert knowledge to obtain pair-wise influential relationships among BN nodes. We implemented the process by a questionnaire survey of four experts;
- (2)
- Compare the direct causal relationship between the two factors and establish a contiguous Boolean matrix;
- (3)
- Calculate the reachable matrix according to the adjacent Boolean matrix. This step is not required, and it is a sacrifice of computational speed for comprehensibility;
- (4)
- Partition reachable matrix into different levels to construct the influence diagram. Once the superior node is determined, it will be separated from the other nodes;
- (5)
- Draw the direct links and derive the directed acyclic graph.
In the end, we get following ordering information: (Activity, Factory type), (Hazardous material characteristics, Material form, Accident equipment), (Personnel factors, Equipment factors), (Incidental event, Type of explosion, Emergency response), (Property loss, Casualties).
We use the sorting information as the input of the K2 algorithm to construct the BN structure. The inputs required by the K2 algorithm are: (1) The set of nodes, (2) a database containing cases, (3) ordering on the nodes [27]. This paper uses MATLAB to implement the algorithm and get the Bayesian network structure. We show the structure learning results in Figure 2.
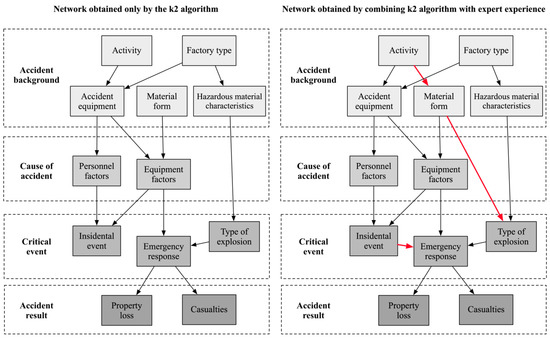
Figure 2.
Bayesian network structure of chemical plant explosion accidents.
To improve the accuracy of the network, we also use expert experience to build the network. In a similar expert evaluation method of Delphi [34], if there are 10 to 20 nodes, it is recommended to seek advice or judgment from 3 to 5 experts. We collect the professional judgments and opinions of four experts by two rounds of questionnaire. The experts were asked to give a probability to evaluate the causal relationship between each of the twelve nodes. To reduce the subjectivity of expert opinion, we use the Dempster-Shafer evidence theory to analyze the collected data to consider the evidence given by four experts. If the causal relationship weight is larger than the threshold value (generally defined as 0.85), then it is confirmed that there is a causal relationship existing between the two nodes. Dempster-Shafer evidence theory is proposed by Dempster [35] and further promoted by Shafer, and the theory forms evidence reasoning which can process uncertain information and to fuse evidence provided by multiple data sources. The Dempster-Shafer evidence method defines a frame of discernment H and the Mass function. The Mass function needs to satisfy the following conditions:
where m(A) is the Mass function of event A, which is also the basic probability function of discernment Θ, the synthesis rule of Dempster-Shafer evidence is shown in Equation (2).
where, m1, m2, ..., mN are the basic probability functions of discernment Θ, and K represents the conflict degree among m1, m2, ..., mN, which is calculated as follows:
We use the Dempster-Shafer method to analyze the causal relationship between the “Material form” and the “Explosion type” nodes as an example.
The four experts gave the probability of causal determination for the two nodes. m1(1,2), ..., m4 (1, 2) represents the probability distribution given by four experts, respectively. The value of m1 (1, 2) is (0.75, 0.25), which means that the first expert thinks “Material form” has a great influence on the “Explosion type.” The probability of having a strong relationship between the two nodes is 0.75, and the probability of having a weaker relationship is 0.25. The causal probabilities given by the four experts were (0.75, 0.25) (0.8, 0.2) (0.7, 0.3) (0.9, 0.1). Based on Equations (2) and (3), the weight of the causal relationship between the “Material form” and the “Explosive type” calculated as follows:
Since the weight of the causal relationship between two nodes is larger than the threshold value (0.85), the causal relationship exists. We add connections between nodes, such as the relationship from the “Activity” to the “Material form,” “Material form” to the “Explosion type,” and “Incidental event” to the “Emergency response.” The K2 algorithm does not learn these three relations, but we have added expert knowledge to ensure the accuracy of the network. The final Bayesian network of chemical plant explosion accidents is in Figure 2.
2.1.2. Step 2: Parameter Learning
We use EM algorithm that comes with GeNIe software [29] to finish parameter learning. In reality, the data set required for Bayesian network parameter learning often has different degrees of data loss, which makes parameter learning difficult. The traditional maximum likelihood estimation seeks the maximum value of the likelihood function without missing. However, if the likelihood function is not steerable, the maximum likelihood estimation hypothesis does not hold. Direct use of MLE leads to the accuracy of the learning result lower. A common method to solve this problem is the gradient descent method. The EM algorithm using the idea of iterative optimization came into being. The EM algorithm [36] solves the parameter learning problem with hidden variables based on maximum likelihood.
The EM algorithm is mainly divided into two significant steps.
Step E, this step patches the data to make the data complete and ensure that it has sufficient statistics.
Step M, calculates the maximum likelihood estimate of based on the repaired complete data, and gets , it needs to calculate , just substitute into formula (5).
We show the final Bayesian network model in Figure 3. It can see that the attribute which has the highest probability in the “Activity” node is “run or use,” with an initial probability of 0.87, while other nodes have corresponding initial probabilities.
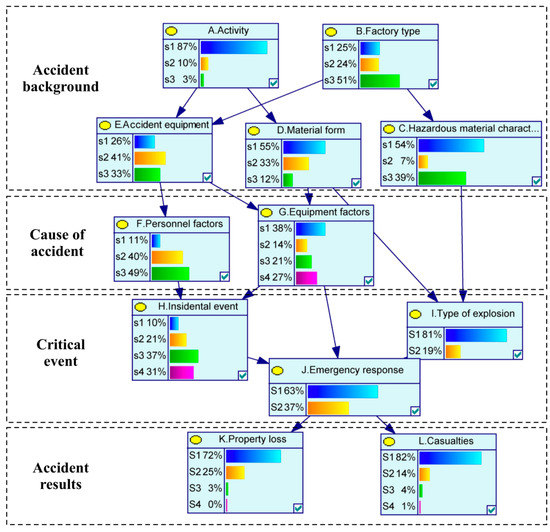
Figure 3.
BN of chemical plant explosion accidents.
3. Results and Discussions
The BN model can support the prevention and decision making of chemical plant explosion accidents. In this section, we first conduct scenario analysis and reasoning of chemical plant explosion accidents, use BN forward inference [37] to get future scenarios and assess future threats to the current chemical plant, use BN backward inference [37] to determine the best strategy and minimize threats. Next, we examine the sensitivity of chemical plant explosion accidents on different factors. Based on the different states of nodes, we test the impact of different factors on risks and potential casualties.
3.1. Scenario Reasoning
When a chemical plant explosion occurs, if the decision-maker can obtain the explosion site information in real-time, the BN model can update the corresponding BN nodes probability distribution according to the obtained information, and based on this, perform a new value distribution reasoning on other nodes. It can also determine prevention strategies to minimize damage. We use a hypothetical example to explore the potential of the model.
First state: In city A, the chemical industry is very developed, and there is a long-established chemical plant. The main business of the chemical plant is the production of petrochemical products. Several workers are transporting chemical hazardous materials in the factory. These hazardous materials are liquid and very easy to vaporize.
We can get the following information from the above state: “Factory type” = “Petrochemical,” “Material form” = “Liquid,” “Hazardous material characteristics” = “Easy to vaporize,” “Activity” = “Transport.” We bring the above information into the Bayesian network model and derive the posterior probabilities of other variables. As shown in Figure 4. In the remaining nodes, the most likely accident equipment is “Transport equipment” with a probability of 84%, which means we have to try our best to avoid problems with the transport equipment. According to common sense, transportation equipment is also the most likely to cause problems and lead to explosions. The most likely cause of accidents is “Loss of containment,” with a probability of 39%, and this is because the Hazardous material is liquid, so it is easy to flow out. Suppose we want to let minimal casualties as evidence. We can use the reverse reasoning of the BN model to take emergency response and ensure the stability of possible accident equipment. The recommended strategy is to reduce the occurrence of over-pressure and over-temperature and achieve immediate and effective emergency measures.
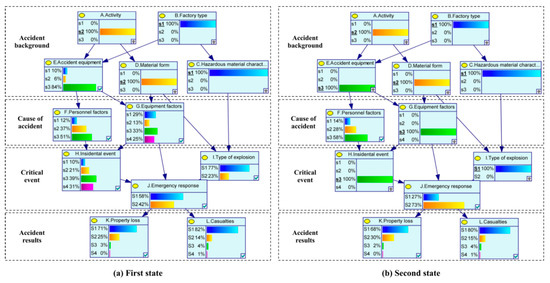
Figure 4.
Scenario reasoning of a hypothetical chemical plant explosion.
Second state: Since the transported hazardous materials are easily vaporized, the transport staff pays special attention to the technical safety of the operation. However, since workers have used the transportation equipment for a long time, there is an inevitable aging of the equipment, which causes the outflow of the hazardous materials in the fluid delivery apparatus, and is continuously vaporized in the outflow, and an explosion occurs.
In the second state, the value of the “Equipment factors” becomes “Equipment aging”, the “Accident equipment” = “Transport equipment”, the “Incidental event” = “Loss of containment”, “Explosion type” = “Normal explosion”. The Bayesian network updates. The probability of “Effective response” reaches 27%, the probability of “Inadequate response” reaches 73%, the probability of “Casualties” = “0–3 persons” is 80%, and the probability of “Loss of fewer than 10 million yuan” is 68%. The decision-making department can decide how many police forces to deploy according to the forecast situation and determine the distribution and moderate tilt of the medical force.
At the same time, we estimate the severity of the accident. The formula for evaluating the casualties and property loss of a chemical plant explosion is as follows:
As seen in Table 2, L1, L2, L3, L4 represent the states of the casualties node, K1, K2, K3, K4 represent the states of the property loss node. PL1, PL2, PL3, PL4 and PK1, PK2, PK3, PK4 represent the corresponding probability of each attribute based on the Bayesian network. As well, we round the calculated casualties.
Table 2.
Calculation results of accident in the second state.
We use the above formula to calculate the worst, best and average result of the accident. We take the maximum value of each state to calculate the worst result, and the median value to calculate the average result. For example, in the L1 (0–3 deaths) state, the maximum value is 3 and the average value is 1.5. The best result is the median of the state variable with the highest probability value. For example, in the second state, the maximum probability state of the casualties node is 80% of L1, then we take the median of 1.5 people as the best accident result and ignore the probability of other states. Through the above method, we get the severity of the accident.
The calculation results of the accident in the second state are shown in the Table 2. The maximum casualties are six deaths, the average is four and the minimal is two. The maximum property loss is 10.3 million yuan, with an average of 5.8 and a minimum of 5.
3.2. Sensitivity Analysis
Sensitivity analysis assumes that the input parameters of the model are uncertain. It refers to how sensitive the performance of the model is to small changes in input parameters [38]. Since the final output of the BBN depends on the probability of a priori allocation, it is necessary to perform a sensitivity analysis to identify key input parameters that have a significant impact on the output [39]. We explore from three aspects. This section may be divided by subheadings. It should provide a concise and precise description of the experimental results, their interpretation as well as the experimental conclusions that can be drawn. The state of each node is shown in Table 3.
Table 3.
Description of Bayesian nodes.
3.2.1. The Sensitivity of Nodes in “Accident Results” and Emergency Response
We attempt to explore the impact of various types of operations carried out in different plants on emergency response, property loss, and casualties, as this will help managers to develop management strategies and reduce the risk of explosion. As shown in Table 4 and Figure 5a, sensitivity studies are conducted by setting nine different cases (A1B1~A3B3) and find that the impact of activity and factory type on the “Accident results” is minimal. Most of the probabilities are floating within 0–1%, with less impact. However, when the activity state is A3 (Overhaul or clean) and the state of factory type changes, the probability of effective response changes by nearly 3%, this shows that different chemical plants have different levels of J1 (effective response) when conducting A2 (transportation). This finding is a hard-to-find feature, but it sounds interesting.
Table 4.
Estimated probabilities with different activity and factory type.
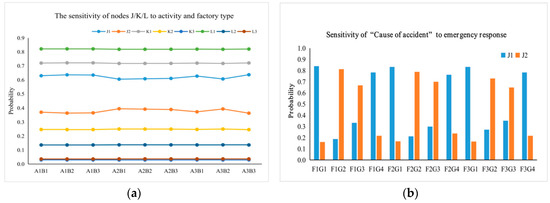
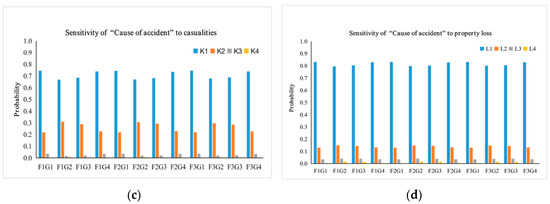
Figure 5.
Estimated probabilities with different elements in “Cause of accident”. J1 represents emergency response = ‘Effective response’; J2 represents emergency response = ‘Inadequate response’; K1 represents property loss = ‘Less than 10 million yuan’; K2 represents property loss = ‘10–50 million yuan’; K3 represents property loss = ‘50–100 million yuan’; K4 represents property loss = ‘More than 100 million yuan’; L1 represents casualties = ‘1–3 persons (3–10 injuries)’; L2 represents casualties = ‘3–10 persons (10–50 injuries)’; L3 represents casualties = ‘10–30 persons (50–100 injuries)’; L4 represents casualties = ‘More than 30 persons (More than 100 injuries)’. (a) The sensitivity of nodes J/K/L to activity and factory type; (b) Sensitivity of “Cause of accident” to emergency response; (c) Sensitivity of “Cause of accident” to casualities; (d) Sensitivity of “Cause of accident” to property loss.
Different devices have different frequency of use, and workers’ operating habits are different. Therefore, it is necessary to adopt different prevention strategies for different devices. We give evidence of other types of nodes: (a) Set personnel factors to F3 (Other personal reasons); (b) set explosion type to I1 (Normal explosion). If we set the accident equipment to E1 (Heat exchange equipment or tower equipment), the effective response is 65%, when it comes to E2 (Reaction equipment), the effective response is 62%, and if we set it to E3 (Transport equipment), the probability of the effective response is reduced to 59%. However, in the absence of other evidence, equipment factors have little impact on the outcome of the accident.
Next, we analyze the sensitivity of “Cause of accident.” As shown in Figure 5(b), we found that the G2 (Static electricity or explosion-proof line problems) and G3 (Equipment aging and lack of maintenance) states have the most significant negative impact on the emergency response. When setting these two states, the probability of J2 (Inadequate response) increases by over 50% (0.839 vs 0.187 and 0.784 vs 0.333), while the probability of K1 (Less than 10 million yuan) drops by nearly 7% (0.745 vs. 0.668 and 0.738 vs. 0.685), while K2 (10–50 million yuan) rises by 6–8%, K3 (50–100 million yuan) and the K4 (Over 100 million yuan) also have an increase of nearly 1–2%, as shown in Figure 5c,d, which reflects the more significant damage caused by G2 and G3, and it is more challenging to get timely emergency response.
If the type of explosion is changed from I1 (normal explosion) to I2 (other types of explosion), the probability of the effective response changes from 72% to 61%. However, the change in casualties only fluctuated between 0–1%. This shows that when other types of explosions occur, the relevant departments may have insufficient emergency, but the type of explosion has less impact on casualties and property losses.
3.2.2. Evaluation of the Most Severe Chemical Plant Explosion Accident
As the scale of chemical production increases and the process becomes complicated, future chemical plant explosions will have severe catastrophic consequences and lead to catastrophic property damage and casualties. To simulate such a huge explosion, we present evidence of the worst-case combination of the “Accident results” nodes and the “Critical event” nodes to estimate the catastrophic consequences. The initialization of the worst node state combination is: (a) Set “Property loss” to K4 (More than 100 million yuan); (b) set “Casualties” to L4 (More than 30 people);
We first set the “Emergency response” to J2 (Inadequate response), as we can see from the Figure 6, A1 (Use or run) has the highest probability of 86.2% in the “Activity.” In “Factory type,” B3 (Basic Chemicals) is significantly more likely to cause serious accidents than other states, with a probability of 52%, which may be due to the relatively large proportion of such plant types in the data source. In “Incidental event,” the probability of H3 (Loss of containment) reached 36%, which is most likely to cause the most severe accident. It is worth mentioning that when we changed the “Emergency response” to J1 (Effective response), the probability of G1 decreased by 32.1% (50.1–18%), the probability of G2 increased by 22.5% (5.6–28.1%), and the probability of G3 increased by 28.5% (9.6–38.1%), the probability of G4 decreased by 18.8% (34.7–15.9%), which reflects that G2 and G3 are more likely to get an effective response, and G1 and G4 are more likely to get an inadequate response. Most of the other indicators fluctuate from 0% to 5%, with little change, and the side reflects its less impact on the “Emergency response.” Overall, most of the estimated results are consistent with reality, suggesting that the proposed Bayesian network framework for assessing chemical plant explosion accidents is reasonable. We can speculate on unknown scenarios based on existing scenarios, which helps to take follow-up rescue measures and disaster response decisions.
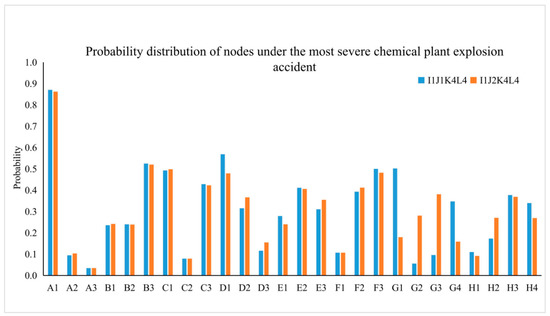
Figure 6.
Estimated probabilities of the most severe situation.
3.2.3. Impact of the Fast and Effective Emergency Response Measures
Fast and efficient response are essential to decrease property loss and casualties of accidents. To assess the impact of emergency response, we present evidence of two different states in the “Emergency response” (J1 and J2). Before this, our evidence for the nodes in the “Accident background” and “Cause of accident” is: We set all pre-nodes to the most prone to the normal situation (maximum probability). (a) Set activity to A1 (Use and run); (b) Set factor type to B3 (Basic chemical); (c) Set “Material characteristics” to C3 (Toxic and harmful); (d) Set “Material form” to D1 (Gas or gas-liquid mix). The final inference results for “Casualties” and “Property losses” are shown in Figure 7.
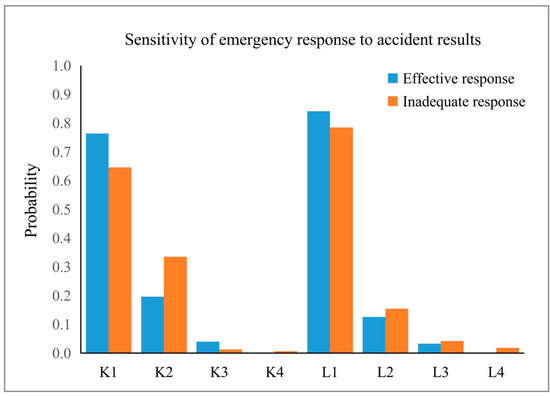
Figure 7.
Estimated probabilities of “Casualties” and “Property loss”. Under the different setup of ‘‘Emergency response”.
When we change the state of “Emergency response” from J1 (Effective response) to J2 (Inadequate response), the probability of K1 (Loss of fewer than 10 million yuan) reduces from 76% to 64%, the probability of K2 (10–50 million yuan) increases from 19% to 33%. When it comes to casualties, the probability of L1 (1 to 3 deaths) is 84% in J1 (Effective response), while in the case of J2 (Inadequate response), the probability of L1 (1 to 3 deaths) is reduced to 78%, because more probabilities transfer to the L2 (3–10 deaths), which increases from 12% to 15%. The results show that “effective response” plays a vital role in reducing the casualties. If we set the property loss and casualties to the maximum (K4 and L4), we found the probability of J2 (Inadequate response) was 98%, which also illustrates the importance of an effective response. If property loss and casualties are reduced by one level (K3 and L3), there is an 82% probability of inadequate response. However, we found that if we continue to decline by one level (K2 and L2), the probability of an effective response increases to 62%. The above explains that an inadequate response will lead to the most serious results and will also make less severe results more serious. As long as an effective response is achieved, casualties and property losses will remain at a low level.
4. Conclusions
We show the superiority of using the BN to construct a chemical plant explosion accident model and construct a BN model based on historical data of chemical plant explosion accident cases and demonstrate the operability of the model.
In previous studies, the factors that caused the explosion were analyzed independently, and the interaction between the factors was ignored. The work of [14,16,40] took a step forward, using the domino effects and DBN analysis to consider the dynamic process of chemical plant explosion accidents. Different environmental factors, accident causes and accident triggering mechanisms are critical to determining the risk level of chemical plant explosion accidents. However, this information is often difficult to determine and difficult to calculate accurately. The work of [15,41] solved these limitations by adopting other methods such as fault tree. Therefore, we perform fine-grained analysis of accidents and integrate with BN to provide a reliable analytical method. Compared with other Bayesian network analysis chemical plant accidents, the unique features of this method include: (1) We have a fine-grained analysis of chemical plant explosion accidents from the cause to the results for better understanding and evaluation. (2) We study the Bayesian network with a large number of historical cases and expert experience. (3) we analyze the interactions and uncertainties of various factors in chemical plant explosion accidents.
The main work of this paper is:
- (a)
- We analyze the process of the chemical plant explosion and propose 12 key nodes, which correspond to “Accident background,” “Cause of accident,” “Critical event,” and “Accident results.” It should be noted that in Hazard and Operability Analysis (HAZOP)and Safety Integrity Level Analysis (SIL), accident consequences are often quantified from production losses, property losses, human damage, and environmental impacts [42,43]. Chemical plant accidents have a significant impact on the environment, because of the characteristics of toxic or non-toxic chemicals, the state of gaseous or liquid chemicals, proximity to rivers or residential areas, and cause a domino effect. However, due to the limited number of historical cases we collected and the lack of environmental impact results for small and medium-sized accidents (about 95% of the total number of cases), only major accidents or particular chemical material accidents include environmental impacts. Therefore, we did not collect this information before. In the future, we will specifically collect the nodes that have the impact of the accident environment, further analyze the vital factor of the accident environment, and propose solutions;
- (b)
- We Use the Dempster-Shafer theory and the ISM-K2 algorithm to construct a Bayesian network model for chemical plant explosion accidents and the EM algorithm to learn its probability distribution;
- (c)
- Through “Forward and backward reasoning” and “Sensitivity analysis,” the scenario reasoning is carried out, various states of the nodes and severe catastrophic conditions are analyzed.
The main findings are:
- (1)
- Effective emergency response plays a vital role in reducing property loss and casualties. The most severe accidents are directly related to untimely emergency response. It should be noted that the structure of the network has a great impact on the sensitivity results. Since the node is closer to the casualty and property loss nodes, it has a stronger influence;
- (2)
- In chemical plant explosion accidents, different equipment and different equipment problems will affect the final emergency response, property loss, and casualties. More critical, equipment factors have a more significant impact than personnel factors. However, personnel factors are the key causes of accidents in all stages of the hazardous chemicals industry chain. From a longer time perspective, equipment factors are also caused by management factors [44]. At the same time, equipment defects of human defects will eventually lead to accidents [45];
- (3)
- The type of chemical plant and ongoing work have a less impact on the final casualties. The effects of different explosions are also not apparent, but different hazardous materials have a significant impact. The impact of different explosion causes is even higher, such as the damage caused by loss of containment is higher than other types of hazards;
- (4)
- In the prevention of chemical plant explosions, there are many kinds of prevention methods, such as safety management of equipment, employee safety operation training, and quick and effective emergency response. Among these methods, equipment safety management and personnel safety training are more important and useful. This also shows that passive security measures (safety management of equipment) are more robust than active security measures (emergency response) [46]. Hamza also proposed in the literature, to improve the safety of the process, the training focus on human factors is important [47], but an effective emergency response can minimize casualties and property loss. Engineering measures to prevent chemical plant explosions in advance are also critical, including the design of hazardous area classifications or ensuring separation distances to minimize damage. Reference [48] mandates EU member states to consider the domino effect and land use planning. Reference [15] combined the results of the risk analysis with the Analytic Hierarchical Process to design an optimal layout in which the level of on-site and off-site risks will be minimized in major accidents. When a domino scenario occurs, the engineering measure can reduce hazards and determine the number of installations in danger and set the corresponding best emergency strategy for different units. Furthermore, in emergencies, the fire protection team can intervene according to the best plan planned [49].
These findings may help the police and local government make macro-decisions on chemical plant explosions and provide support for other public safety agencies to prevent chemical plant explosions.
We plan to further improve in many directions. First, enrich the nodes. For example, the “quantity of raw materials” attribute is also important in chemical plant explosion accidents because the impact caused by explosions caused by different quantities of substances is different. However, since the “quantity” attribute is not included in a large number of cases collected on the Internet, we did not take it into account when selecting nodes and informed the reader of the importance of this node. The 1000 cases collected in this article are still few for complex chemical plant explosion accidents. Such as the type of dust explosion, as we collected a small number of accidents, we did not separate them into a single state. Reflecting the limitations of our method, larger-scale cases, and more fine-grained accident classification analysis are very important, which is also our future research direction. Second, we will study the methods and effects of Bayesian network structures in addition to the ISM-K2 method, and compare them to demonstrate the superiority of the network. Reference [11] has done a similar work. Third, we hope that our model is sensitive to time and space, because the possibility of chemical plant explosion accidents will change in different countries, regions, seasons, and different times every day. An example is reference [44], which analyzes the spatiotemporal characteristics of chemical plant explosion accidents, we intend to use GIS and dynamic Bayesian networks to geographically contextualize these accidents. Finally, it can be effectively applied to a variety of accident scenarios [15].
Author Contributions
Conceptualization, R.Z. and X.H.; data curation, R.Z. and D.H.; formal analysis, X.H.; funding acquisition, X.L. and X.H.; investigation, R.Z. and D.H.; methodology, R.Z. and X.H.; resources, X.L.; software, D.H.; supervision, X.L. and X.H.; validation, R.Z.; writing—original draft, R.Z.; writing—review & editing, X.H.; revision, R.Z. All authors have read and agreed to the published version of the manuscript.
Funding
This paper is supported by the National Key R&D Program of China (No. 2018YFF0301004) and National high technology research and development program (2015AA016009).
Conflicts of Interest
The authors declare no conflict of interest.
References
- Zerrouki, H.; Smadi, H. Bayesian belief network used in the chemical and process industry: A review and application. J. Fail. Anal. Prev. 2017, 17, 159–165. [Google Scholar] [CrossRef]
- Zhang, N.; Shen, S.L.; Zhou, A.N.; Chen, J. A brief report on the March 21, 2019 explosions at a chemical factory in Xiangshui, China. Process Saf. Prog. 2019, 38, e12060. [Google Scholar] [CrossRef]
- Babrauskas, V. The ammonium nitrate explosion at West, Texas: A disaster that could have been avoided. Fire Mater. 2018, 42, 164–172. [Google Scholar] [CrossRef]
- Li, Y.; Liu, Z.; Jia, J. Statistic analysis of chemical enterprises accidents occurring in China during 2006~2015. Appl. Chem. Ind. 2017, 46, 1620–1623. [Google Scholar]
- Liu, R. Research of Accident Analysis and Prediction of Chemical Manufacturers. Master’s Thesis, North University of China, Taiyuan, China, 2015. [Google Scholar]
- Reniers, L.G.L. Multi-Plant Safety and Security Management in the Chemical and Process Industries; (RENIERS:MULTIPLANT SAFETY O-BK) || Appendix B: The IESLA Instrument; John Wiley & Sons, Inc.: Hoboken, NJ, USA, 2010; pp. 251–260. [Google Scholar] [CrossRef]
- Wang, J.; Fan, Y.; Gao, Y. Analysis of causes of accidents in chemical industry based on HFACS model. China Saf. Sci. J. 2018, 28, 81–86. [Google Scholar]
- Liu, J.; Li, L. Suggestion on accident analysis and fire safety management of chemical industry park. Fire Sci. Technol. 2014, 33, 1343–1347. [Google Scholar]
- Kao, C.S.; Hu, K.H. Acrylic reactor runaway and explosion accident analysis. J. Loss Prev. Process Ind. 2002, 15, 213–222. [Google Scholar] [CrossRef]
- De Rademaeker, E.; Suter, G.; Pasman, H.J.; Fabiano, B. A review of the past, present and future of the European loss prevention and safety promotion in the process industries. Process Saf. Environ. Prot. 2014, 92, 280–291. [Google Scholar] [CrossRef]
- Huang, L.; Cai, G.; Yuan, H.; Chen, J. A hybrid approach for identifying the structure of a Bayesian network model. Expert Syst. Appl. 2019, 131, 308–320. [Google Scholar] [CrossRef]
- Husmeier, D. Introduction to Learning Bayesian Networks from Data; Springer: London, UK, 2005; pp. 17–57. [Google Scholar]
- Khakzad, N. Application of dynamic Bayesian network to risk analysis of domino effects in chemical infrastructures. Reliab. Eng. Syst. Saf. 2015, 138, 263–272. [Google Scholar] [CrossRef]
- Khakzad, N.; Yu, H.; Paltrinieri, N.; Khan, F. Reactive Approaches of Probability Update Based on Bayesian Methods. Dyn. Risk Anal. Chem. Pet. Ind. 2016, 51–61. [Google Scholar] [CrossRef]
- Khakzad, N.; Reniers, G. Risk-based design of process plants with regard to domino effects and land use planning. J. Hazard. Mater. 2015, 299, 289–297. [Google Scholar] [CrossRef] [PubMed]
- Villa, V.; Paltrinieri, N.; Khan, F.; Cozzani, V. Towards dynamic risk analysis: A review of the risk assessment approach and its limitations in the chemical process industry. Saf. Sci. 2016, 89, 77–93. [Google Scholar] [CrossRef]
- Lee, K.; Park, I.; Yoon, B. An approach for R&D partner selection in alliances between large companies, and small and medium enterprises (SMEs): Application of bayesian network and patent analysis. Sustainability 2016, 8, 18. [Google Scholar]
- Ghasemi, F.; Sari, M.H.M.; Yousefi, V.; Falsafi, R.; Tamosaitiene, J. Project portfolio risk identification and analysis, considering project risk interactions and using bayesian networks. Sustainability 2018, 10, 1609. [Google Scholar] [CrossRef]
- Chu, Z.; Wang, W.; Wang, B.; Zhuang, J. Research on factors influencing municipal household solid waste separate collection: Bayesian belief networks. Sustainability 2016, 8, 152. [Google Scholar] [CrossRef]
- Tang, Z.; Li, Y.; Hu, X.; Wu, H. Risk analysis of urban dirty bomb attacking based on bayesian network. Sustainability 2019, 11, 306. [Google Scholar] [CrossRef]
- Francis, R.A.; Guikema, S.D.; Henneman, L. Bayesian Belief Networks for predicting drinking water distribution system pipe breaks. Reliab. Eng. Syst. Saf. 2014, 130, 1–11. [Google Scholar] [CrossRef]
- Wu, J.; Xu, S.; Zhou, R.; Qin, Y. Scenario analysis of mine water inrush hazard using Bayesian networks. Saf. Sci. 2016, 89, 239. [Google Scholar] [CrossRef]
- Yuan, Z.; Khakzad, N.; Khan, F.; Amyotte, P. Risk analysis of dust explosion scenarios using Bayesian networks. Risk Anal. 2015, 35, 278–291. [Google Scholar] [CrossRef]
- Wu, J.S.; Hu, Z.Q.; Chen, J.Y.; Li, Z. Risk assessment of underground subway stations to fire disasters using bayesian network. Sustainability 2018, 10, 21. [Google Scholar] [CrossRef]
- Zhang, C.; Wu, J.S.; Hu, X.F.; Ni, S.J. A probabilistic analysis model of oil pipeline accidents based on an integrated Event-Evolution-Bayesian (EEB) model. Process Saf. Environ. Prot. 2018, 117, 694–703. [Google Scholar] [CrossRef]
- Warfield, J.N. Developing interconnection matrices in structural modeling. IEEE Trans. Syst. Man Cybern. 1974, 81–87. [Google Scholar] [CrossRef]
- Cooper, G.F.; Herskovits, E. A Bayesian method for the induction of probabilistic networks from data. Mach. Learn. 1992, 9, 309–347. [Google Scholar] [CrossRef]
- Heckerman, D.; Geiger, D.; Chickering, D.M. Learning Bayesian networks: The combination of knowledge and statistical data. Mach. Learn. 1995, 20, 197–243. [Google Scholar] [CrossRef]
- Liu, S.; Wan, F.; Yang, Y. Weiming, model of chemical domain device ontology constructing. J. East China Univ. Sci. Technol. 2017, 43, 404–410. [Google Scholar]
- BayesFusion GeNIe Modeler User Manuel. Available online: http://support.bayesfusion.com/docs/genie.pdf (accessed on 20 October 2019).
- Report on Production Safety Accident and Regulations of Investigation and Treatment, Council, S., Ed.; Beijing, China, 2007.
- Hu, C. Research overview on bayesian network. J. Hefei Univ. 2013, 23, 33–40. [Google Scholar]
- Zhou, Z.; Shen, G.; Zhu, X. Application of bayesian network in intelligence prediction. Inf. Sci. 2014, 32, 3–8. [Google Scholar]
- Banuls, V.A.; Turoff, M.; Roxanne Hiltz, S. Collaborative scenario modeling in emergency management through cross-impact. Technol. Forecast. Soc. Chang. 2013, 80, 1756–1774. [Google Scholar] [CrossRef]
- Dempster, A.P. Upper and lower probabilities induced by a multivalued mapping. Ann. Math. Stat. 1967, 38, 325–339. [Google Scholar] [CrossRef]
- Dempster, A.P.; Laird, N.M.; Rubin, D.B. Maximum likelihood from incomplete data Via the EM algorithm. J. R. Stat. Soc. Ser. B Methodol. 1977, 39, 1–38. [Google Scholar]
- Al-Ajlan, A. The comparison between forward and backward chaining. Int. J. Mach. Learn. Comput. 2015, 5, 106–113. [Google Scholar] [CrossRef]
- Nadkarni, S.; Shenoy, P.P. A Bayesian network approach to making inferences in causal maps. Eur. J. Oper. Res. 2001, 128, 479–498. [Google Scholar] [CrossRef]
- Ismail, M.A.; Sadiq, R.; Soleymani, H.R.; Tesfamariam, S. Developing a road performance index using a Bayesian belief network model. J. Frankl. Inst. Eng. Appl. Math. 2011, 348, 2539–2555. [Google Scholar] [CrossRef]
- Khan, F.I.; Abbasi, S.A. Techniques and methodologies for risk analysis in chemical process industries. J. Loss Prev. Process Ind. 1998, 11, 261–277. [Google Scholar] [CrossRef]
- Khakzad, N.; Reniers, G. Application of bayesian network and multi-criteria decision analysis to risk-based design of chemical plants. In 15th International Symposium on Loss Prevention and Safety Promotion; DeRademacher, E., Schmelzer, P., Eds.; Italian Association of Chemical Engineering-AIDIC: Freiburg, Germany, 2016; Volume 48, pp. 223–228. [Google Scholar]
- Khan, F.I.; Haddara, M. Risk-based maintenance (RBM): A new approach for process plant inspection and maintenance. Process Saf. Prog. 2004, 23, 252–265. [Google Scholar] [CrossRef]
- Johansen, I.L.; Rausand, M. Risk metrics: Interpretation and choice. In Proceedings of the 2012 IEEE International Conference on Industrial Engineering and Engineering Management, Hong Kong, China, 10–13 December 2012; pp. 1914–1918. [Google Scholar]
- Zhang, H.; Liu, W. Hazardous chemical accidents causation characteristics of china: A statistical investigation. Ind. Saf. Environ. Prot. 2012, 5. [Google Scholar]
- Liang, C. Causation Analysis of Hazardous Chemical Explosion Based on Bayesian Network-The Case of Production Explosions. Master’s Thesis, Beijing University Of Chemical Technology, Beijing, China, 2016. [Google Scholar]
- Ji, J.; Tong, Q.; Khan, F.; Dadashzadeh, M.; Abbassi, R. Risk-based domino effect analysis for fire and explosion accidents considering uncertainty in processing facilities. Ind. Eng. Chem. Res. 2018, 57, 3990–4006. [Google Scholar] [CrossRef]
- Zerrouki, H.; Tamrabet, A. Safety and risk analysis of an operational heater using bayesian network. J. Fail. Anal. Prev. 2015, 15, 657–661. [Google Scholar] [CrossRef]
- Christou, M.; Gyenes, Z.; Struckl, M. Risk assessment in support to land-use planning in Europe: Towards more consistent decisions? J. Loss Prev. Process Ind. 2011, 24, 219–226. [Google Scholar] [CrossRef]
- Khakzad, N. Which fire to extinguish first? A risk-informed approach to emergency response in oil terminals. Risk Anal. 2018, 38, 1444–1454. [Google Scholar] [CrossRef] [PubMed]


© 2019 by the authors. Licensee MDPI, Basel, Switzerland. This article is an open access article distributed under the terms and conditions of the Creative Commons Attribution (CC BY) license (http://creativecommons.org/licenses/by/4.0/).