Abstract
Under the concept of green development, coal and oil control policies were frequently introduced, but the “cold” thinking under the “hot” environment is more conducive to the smooth promotion of the “transitional period” of China’s power-structure transformation. How to better consider production efficiency and environmental benefits is the theme that thermal power enterprises need to constantly break through. The most feasible “transitional period” path for thermal power enterprises is improving the efficiency of energy saving, reducing emissions, and simultaneously ensuring benefits and social awareness. This paper selected 17 listed companies in China’s thermal power sector, combined with their input resources, output, and other indicators, using a slacks-based measure–data envelopment analysis (SBM–DEA) model with undesirable outputs, and comprehensively analyzed the relationship among the technical efficiency improvement and the industry status, including price earnings ratio (P/E ratio) in the recent two years. The results show that the improvement of energy efficiency can indeed optimize enterprises’ operations and improve P/E ratio. Although clean-energy power generation has better environmental benefits, it is still lacking in efficiency; therefore, the balance between efficiency and environment sustainability should concern us.
1. Introduction
In recent years, with the rapid development of China’s economy, single industrial structure, large energy consumption, and severe pollution troubles have gradually emerged. As China is a country with abundant coal endowment, coal accounts for a large proportion of fossil resource reserves, which means that the coal-dominating energy consumption structure will not change in a short time [1]. The coal-based consumption structure has supported the rapid development and urbanization, but it has also caused heavy environmental damage [2]. The severe haze since 2012 in places such as Beijing, Tianjin, Hebei, Yangtze River Delta, and other relatively developed urban areas has created a harsh environment that has seriously influenced normal daily life [3,4,5]. Facing these problems, in October 2013, the International Association for the Conservation of Natural Resources, an environmental protection agency, launched the project “China’s Total Coal Consumption Control Program and Policy Research”, in cooperation with more than 20 influential institutions, including government think tanks, scientific research institutes, and industry associations. For the power industry, “coal consumption control scheme and policy research” put forward these two requirements: Firstly, strictly control the total coal consumption in the power industry and urge coal consumption of the power industry to reach its peak as soon as possible. Secondly, optimize the development path under the constraints of environmental capacity and promote the sustainable development of low-carbon power industry. All of these efforts are aimed at saving resources and promoting the better allocation of resources and structural upgrading.
The Energy Statistics Yearbook 2018 [6] shows that thermal power still consumes more than 50% of the total coal use in primary energy consumption, and the emission of polluted gases from thermal power accounts for one-third of the total emissions from energy use. Under the concept of green development, the amount of carbon dioxide generated by thermal-power generation should not be underestimated, either [7]. Despite the vigorous development of clean-energy power generation in recent years, thermal power is still the main mode of production in the current power system, and the power structure dominated by thermal power will not change in the future for a long time [8]. According to the analysis of 2018 BP Energy Statistical Yearbook [9], coal power generation still keeps a steady upward trend. From 2016 to 2017, the growth rate of coal power generation is about 5%, accounting for about 67% of the total energy power generation. Under the “transition period” of China’s power structure transformation, improving energy efficiency and reducing pollutant emissions are the problems that the power industry needs to innovate constantly. For listed companies, the important objective is to get better industry position, P/E ratio, and core competitiveness of the company in the market. If improving energy efficiency and reducing environmental pollution can promote the company’s industry ranking and core competitiveness, this will indirectly encourage power companies to further improve production efficiency, change their resource structure, and finally form a virtuous circle. Therefore, studying the impact of power companies’ energy efficiency on the status of whole industry is conducive to the implementation of the green development of the energy industry and energy structure revolution, but the existing research lacks a discussion of the relationship between the two.
Based on the previous comments, the contribution of this paper is twofold: (1) Do a comprehensive analysis of energy efficiency of thermal power listed companies, show the efficiency ranking of companies, and calculate the improvement space and potential of each companies. (2) Combine the changes of market value and P/E ratio of listed companies, analyze the impact of energy efficiency on market information of listed companies, give the relationship between energy efficiency and industry status, and then put forward relevant suggestions based on these.
2. Theoretical Background
Due to the strategic position of the power industry in various countries, the efficiency evaluation of the power industry has always been a hot issue for many experts and scholars [10,11,12,13,14]. The data envelopment analysis (DEA) method has been evaluated since the first time in 1978 by the well-known American researchers Charnes, Cooper, and Rhodes, and became the most common method used. Färe et al. [15] first introduced pollution variables into the DEA model, and an increasing number of studies began to include environmental factors, especially in the fields of energy and environmental research, various types of DEA models have been widely used for a long time. Zhou et al. [16] analyzed the power consumption and overall economic development trends from the macro perspective, such as the relationship between power consumption and GDP, and the level of household consumption. Lin [17] analyzed the long-term equilibrium relationship between GDP, capital, human capital, and electricity consumption, based on the production function. Wei et al. [18] used provincial panel data to compare energy differences between regions. In addition, Xu et al. [19] studied the efficiency of overall and regional power production by introducing total factor productivity. Wang et al. [20] used carbon dioxide and sulfur dioxide emissions as environmental-effect substitution variables formed by energy utilization into the total-factor energy-efficiency research system and calculated the energy-saving and emission-reduction potential of various regions in China. In comparison, a small number of studies focus on the micro level and enterprise data. Jiang et al. [21] use the census data of industrial enterprises in Hefei and take 32 industries as research objects. By analyzing the efficiency of energy input from multiple angles, the result of technical efficiency, pure technical efficiency, scale benefit, and energy utilization efficiency shows that redundancy of power input and insufficient main revenue. Jiang et al. [22] used DEA method to measure the technical efficiency of the 24 thermal power listed companies in China from 2000 to 2011, and then used a tobit model to empirically analyze the factors affecting the technical efficiency of thermal-power listed companies.
Environmental efficiency plays a significant role in affecting the energy performance of China’s thermal generation sectors, according to Bi et al. [23]. For the emission problems of pollutants such as sulfur dioxide generated in the power industry during the production process, some studies have introduced them as undesired outputs into the model. Qu et al. [24] adopted slacks-based measure (SBM)–DEA, which considers undesired outputs to analyze the operating efficiency differences of the thermal power industry in 30 provinces in China from 2005 to 2009, and found this approach can do further analysis on efficiency variances and evaluate the impacts of thermal power industry on regional sustainable development. Mou [25] analyzed the efficiency of China’s coal-fired power plants by using the DEA–SBM method on groups, provinces, and plants. Yang et al. [26] studied Chinese coal-fired power plant efficiency by incorporating undesirable outputs and uncontrollable variables into DEA, using data from 2005.
Under the current era of vigorously promoting new energy generation, energy conservation and emission reduction are highly encouraged. Traditional thermal power companies are undergoing internal structural reforms, and multiple power-supply structure is continuously expanded. Most thermal power companies are starting to increase clean-energy power-generation devices to enrich their power sources. Welch et al. [27] used a material balance principle to estimate the distribution of coal, natural gas, and oil inputs by comparing the economic and environmental efficiencies of dozens of hybrid energy generation companies to minimize cost and carbon emissions.
There is relatively little research on whether the increase in the proportion of clean-energy power generation increases the efficiency of power generation and the environmental benefits of enterprises. Based on this, this article starts from the micro level, selects the listed companies in China’s thermal power sector, considers the traditional coal electricity generation and new energy power generation structure, and treats pollutants such as sulfur dioxide, soot, and nitrogen oxides as undesired production. The SBM–DEA model was introduced to comprehensively evaluate the energy efficiency of thermal power companies and compare them with their industry status.
3. Model Construction and Variable Selection
3.1. Model Construction
A lot of research on energy efficiency have been done in the last few years. The most two popular methods are nonparametric data envelopment analysis–Stochastic Frontier Approach (SFA) and parameter stochastic frontier analysis–data envelopment analysis (DEA). Data envelopment analysis (DEA) was first proposed by the well-known American operations researchers Charnes, Cooper, and Rhodes, in 1978, to evaluate the relative effectiveness of the research object (decision unit, DMU) [28]. This method uses linear programming techniques to convert inputs to outputs, with the purpose of evaluating the performance of comparable objects. It determines the relatively effective production frontier through the input and output of the DMU and projects each DMU to the production frontier. By means of computing the distances between each DMU and production frontier, the relative efficiency of each DMU can be judged. This method is suitable for dealing with multi-input and multi-output problems. It has great advantages in avoiding subjective factors, simplifying algorithms, and reducing errors; it gradually developed into one of the most commonly used analysis tools for evaluation efficiency in many fields [29,30,31].
The traditional DEA models fall into the categories of input-oriented or output-oriented models. With an input-oriented DEA, the model is configured to determine how much the input use of a DMU could contract if used efficiently in order to achieve the same output level. In contrast, with output-oriented DEA, the linear program is configured to determine a DMU’s potential output given its inputs if it operated efficiently. There are two scale assumptions: constant returns to scale (CRS) and variable returns to scale (VRS). CRS displays the states that the degree of change into the output is equal to that into the input, while VRS represents the state that the generated output might show diminution, augmentation, or stability in its returns to scale.
However, these traditional DEA models use radial and oriented methods to calculate the direction distance function. However, when the input or output has nonzero slacks, the relative efficiency of the radial DEA efficiency measurement will be overestimated, and the efficiency result of the oriented DEA measurement method is also inaccurate, because it ignores one aspect of the input or output. For dealing with this problem, Tone proposed a new model in 2001: the slacks-based measure [32].
SBM (slacks-based measure) model is a non-radial DEA model; it is different from the radial CCR model and BCC model. In the radial DEA model, the improvement of invalid DMU reduces (increases) all inputs (outputs) in equal proportion. In the SBM model, the improvement of invalid DMU includes not only the improvement of equal proportion, but also the slack improvement, which addresses input or output slacks directly, and it is the main advantage of the SBM model.
Traditional DEA models usually pursue the maximum of the output, but in evaluating the production or operation efficiency of an economic system, unexpected outputs are always accompanied with the expected ones. It is difficult to avoid the undesirable outputs, such as pollutants discharged. The negative externalities caused by production process should also be included in the efficiency evaluation system. Therefore, Tone [33] further extended the SBM model, to evaluate the relationship between output and pollution, and proposed to add unexpected output to the SBM model. Recently, SBM–DEA has become one of popular approach dealing with the environment undesirable outputs in efficiency evaluation.
This paper adopts Tone’s non-oriented SBM model with unexpected output. The model is as follows:
where ρ* represents the efficiency value of DMU, which ranges from 0 to 1; m, s1, and s2 represent the number of inputs, desirable-output, and undesirable-output, respectively; s represents the slacks; and λ is the weight coefficient. The objective function ρ* is a strict monotonic decline of s−, sg, and sb. , , and represent the quantity of input, the desirable output, and the undesirable output. The first constraint seeks the minimum input, and the second constraint means the maximum expansion of a desirable output. The third constraint means the maximum reduction of an undesirable output. When p* = 1, as well as s− = 0, sg = 0, and sb = 0, the evaluated unit is valid. If ρ* < 1, it shows that the evaluated decision-making unit is not efficient. In this case, the decision-making unit can achieve the most efficient by adjusting input or output.
According to various researches, the SBM–DEA model has the advantages that it can fully show the efficiency evaluation, including positive and negative output. Meanwhile, this model explicitly introduces the slack into the objective function, avoiding the deviation caused by the difference between radial and oriented selection, so that it reflects the efficiency evaluation better than other traditional DEA models. On the other hand, the SBM model cannot deal with the energy efficiency evaluation problem with negative output, so the applicability of the model should be considered when facing the negative output.
3.2. Variable Selection
For the energy efficiency evaluation of power industry, some studies have been carried out in combination with macroeconomic indicators, micro-production efficiency, single-factor productivity, and total-factor productivity, to select input indicators and output indicators in the DEA method. After reading the recent literature, we summarized the selection of indicators from previous studies in Table 1.

Table 1.
Summary of input and output indicators.
However, power generation not only produces electric energy, but also produces pollutants harmful to the environment. In the past, people used to only focus on the positive output (efficiency of power generation), but ignored the negative environmental benefits caused by the conversion efficiency. However, with the increasingly serious environmental pollution problems in recent years, especially the large-area haze caused by excessive PM2.5, serious pollution caused by low-energy efficiency in the production process must be paid attention to, as well. Thus, the contaminant emissions by plants should also be included in the efficiency evaluation. Low emissions are encouraged to be improved.
Based on previous researches and combining the research objects and the problems to be solved, multiple factors were selected here. According to the Cobb–Douglas production function, the number of employees (represented of labor), the total installed capacity (represented of capital) are two factors here to measure the product efficiency. The installed capacity of coal power and the total installed capacity of clean energy are selected as the input indicators on behalf of the traditional electricity generation and renewable power generation. The total power generation, sulfur dioxide emissions, nitrogen oxides emissions, and soot emissions are output variables, and pollutant emissions are treated as undesirable outputs. Figure 1 shows the process of input and output in electricity generation.
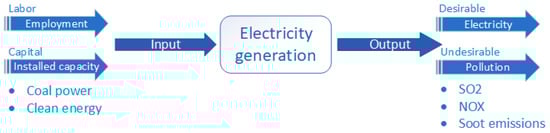
Figure 1.
Energy efficiency evaluation variable-selection mechanism chart.
4. Results and Discussion
In terms of data collection, there are currently 33 listed companies in China’s thermal power sector. (Huaneng Power International Inc(Beijing, China), GD Power Development Co., Ltd. (Dalian, China), Datang International Power Generation Co., Ltd. (Beijing, China), Huadian Power International Co., Ltd. (Jinan, China), Hubei Energy Group Co., Ltd. (Wuhan, China), Beijing Jingneng Power Co., Ltd. (Beijing, China), Shenzhen Energy Co., Ltd. (Shenzhen, China), Guangdong Electric Power Development Co., Ltd. (Guangzhou, China), Shanghai Electric Power Co., Ltd. (Shanghai, China), Guangzhou Development Incorporated(Guangzhou, China), Jointo Energy Investment Co., Ltd. (Shijiazhuang, China), Shanxi Zhangze Power Co., Ltd. (Taiyuan, China), AnHuiW energy Company Limited(Hefei, China), Jilin Electric Power Co., Ltd. (Changchun, China), Datang Huayin Electric Power Co., Ltd. (Changsha, China), Henan Yuneng Holdings Co., Ltd. (Zhengzhou, China), Guodian Changyuan Electric Co., Ltd. (Wuhan, China). Although the government has enhanced the requirements and supervision of industrial enterprises for pollution discharge and green production in recent years, only 17 of them have disclosed the corresponding indicator data in the annual report or corporate social responsibility report (sustainable report). Meanwhile, the Report on the State of the Environment in China 2018 [46] shows that the degree of environmental pollution has risen and become more serious in the past two years (2017–2018). The governments of all regions strictly control the discharge situation, vigorously adjust the production structure of high-pollution enterprises, and improve production facilities. Therefore, this paper selects 17 thermal power listed companies with data supported in 2017–2018 and collects data for the seven variables (input and output variables in Table 2). All data are from the enterprise annual report and corporate social responsibility report (sustainability report). In addition, MAXDEA was used in this research.
Table 2.
Input and output variables in this paper.
From another perspective, the covariance correlation was also evaluated through the Pearson correlation coefficient; the results are in Table 3.
Table 3.
Covariance correlation of variables.
The results show that, firstly, input variables are weakly correlated in terms of labor and capital, and there is sufficient correlation between input variables and output variables, which meets the applicability requirements of DEA model for variables selection. Secondly, for the output variables, there is a certain correlation between the desirable output variables and the undesirable output variables, which means that, in the process of power production, the unexpected output is often accompanied by the expected output at the same time, so it proves that the unexpected output should also be included in the process of energy efficiency evaluation, which proves the value of this research.
At the same time, considering the market information and the ranking of the listed companies, we select the market value of the 17 companies at the end of 2017 and 2018 and the P/E ratio of the company at the end of two years and rank them according to the market value. In order to avoid the impact of extreme values, the P/E ratio chose the average daily P/E ratio in December (average 31-day daily P/E ratio), and the results are as followed (Table 4).
Table 4.
Market capitalization ranking of 17 listed companies of thermal power (2017–2018).
Based on the above statistical work, the collected data are solved by using SBM–DEA model with unexpected output, and the efficiency results are as follows (Table 5).
Table 5.
Efficiency result of 17 listed companies of thermal power (2017–2018).
The overall efficiency evaluation results, in the past two years, for the thermal power industry has improved. The average efficiency value has increased from 0.586 to 0.830, though it was still inefficient in both years, but the increase of the average score showed the industrial efficiency changes better, less efficient companies improved their productive efficiency. In 2017, six thermal power companies achieved the valid efficiency, and 11 companies achieved the optimal efficiency in 2018. This is consistent with the policy requirements, which strictly supervised enterprise operating, improved the efficiency of traditional power generation, and reduced emissions of gas pollutants in the past two years. Meanwhile, the macro-market information shows that coal prices rose sharply in 2017. As coal is an important energy source for thermal power generation, the rise in prices led to poor performance for the thermal power industry. The negative condition changed in 2018, when the macroeconomic development became stable, and the coal prices have now fallen, and the supply and demand environment in the electricity market has become more relaxed. The electricity consumption in the secondary industry has grown steadily, and the service industry has increased substantially so that the power industry has recovered, which is in line with the findings of this paper.
According to the results of the efficiency evaluation in 2017, six companies, Beijing Jingneng Power, Datang International Power, Huadian Power, GD Power Development, Guangdong Electric Power Development, and Jointo Energy Investment, scored 1 and were at the effective frontier of DEA, achieving optimal efficiency. The efficiency evaluation value of 2018 shows that 11 companies, including, AnHuiW Energy, have achieved the valid level of efficiency. Among them, Guangzhou Development, AnHuiW Energy, Henan Yuneng Holdings, Datang Huayin Electric Power, and Shenzhen Energy have achieved optimal efficiency by adjusting their structure. Guangzhou Development has increased the installed capacity and power generation of new energy power generation to a large extent. In the year of 2018, AnHuiW Energy’s power generation achieved a 12% increase in power generation and increased environmental protection investment. Although Henan Yuneng Holdings is still negative, the situation has improved significantly. In 2017, because of the high production cost and serious loss caused by overcapacity, the P/E ratio of the company was remarkably negative. In 2018, the company adjusted its structure and rationally rearranged its production plan and also rebulit the power-distribution strategy based on regional macroeconomic development and industry competition. It gradually adapted to the trend of clean-energy power generation, so that new energy power generation projects are under planning. The result shows that Henan Yuneng Holdings has achieved a significant increase in price–earnings ratio in 2018, and another negative Datang Huayin Electric Power has also improved, the basic earnings per share in 2018 Ascension has improved and business conditions have become better. Combined with the company’s ranking and price–earnings ratio analysis, the efficiency improvement affects the company’s operating conditions to a certain extent, thus improving its industry valuation and its industry position.
By comparing companies’ two-year market values and P/E ratios, the energy efficiency of the leading companies in the industry, such as GD Power Development, Datang International Power, and Beijing Jingneng Power, have the best score, efficiency = 1. They are at the forefront of the best efficiency in two years, and the P/E ratio tends to be relatively stable, reflecting the steady and improved development trend. However, as the top one enterprise in the power industry, which ranks first in the market value of the industry and has a high P/E ratio in the past two years, Huaneng Power International does not have an efficient score (lower than 1). Comparing the data among all companies, we can find that Huaneng Power International has a great advantage in company size, installed capacity, and so on, but also pretty high value in the discharge of three major pollutants. To some extent, compared with the data of 2018 and 2017, the efficiency of Huaneng Power International has also increased, and its leading position in the industry has remained stable. Its P/E ratio is much higher than other companies. For the companies whose energy efficiency is relatively low, although some rank relatively stable, their price–earnings ratio is also negative. Therefore, the improvement of energy efficiency of low-efficiency thermal power companies can also be reflected in the market information to a certain extent, which increases the competitiveness in the industry as a whole.
From the results of the slack variables derived from the model (Table 6 and Table 7), the amount of power generation has become a major factor affecting the efficiency of power companies. From the perspective of production efficiency, most companies have the situation of redundant resources, with too many employees and excessive production-equipment investment. Under the input of existing resources, the output of power generation should be more; resource utilization and conversion efficiency need to be improved, as they have become common problems in the industry. Therefore, reducing investment in installed capacity and increasing power output can help companies effectively achieve efficiency targets. From the analysis of the companies’ energy-structure efficiency, the amount of clean energy generated compared with the optimal efficiency of the power generation structure, the increase in the proportion of clean-energy power generation cannot improve the companies’ production efficiency. The reason may be that, for traditional thermal power companies, the increase in installed capacity of clean energy may increase the power generation cost to some extent, and compared with traditional thermal power generation, clean energy is only applied and actual used in recent years, which has no advantages in terms of technical effects and scale production.
Table 6.
Slake variables of DMU inefficient efficiency in 2017.
Table 7.
Slake Variables of DMU inefficient Efficiency in 2018.
However, from the perspective of undesired output, most companies have higher pollutant emissions, so that they have greater optimization potential, which means that they can improve efficiency by reducing pollutant emissions. Moreover, under the current requirements of sustainable development, the cleanliness of energy resources must be the direction of continuous improvement in the future. Therefore, clean-energy power generation needs further improvement and development in balancing production efficiency and environmental benefits.
5. Conclusions
In general, this article has reached the following conclusions:
- The overall efficiency of the thermal power industry has improved in 2017–2018. Each company has optimized its efficiency by adjusting its energy structure and changing its production strategy. The environmental policy and the stable, improved development market have played certain roles.
- Power generation capacity has become a major factor affecting the efficiency of power companies. Most companies have been faced with the problem of resource redundancy. In the case of insufficient resource utilization, increasing the conversion efficiency has become a more common problem in the industry.
- In combination with changes in the company’s efficiency and industry status, the improvement of energy efficiency of low-efficiency companies is reflected in the market information to a certain extent, and the price–earnings ratio is gradually increasing, which has increased the valuation space for enterprises and enhanced the competitiveness among the whole industry.
- Although energy cleansing is the future development trend of the power industry, there is still room for improvement in terms of production cost and production efficiency, and the advantages of green production can play a role in achieving better environmental efficiency.
In short, thermal power will be the main form of power supply in China in the future. Under the existing resource input structure, power generation should be increased and diversified energy production structures should be gradually achieved. Meanwhile, power companies can also pursue high energy efficiency, to improve their industrial status and core competitiveness, as well. Continuing to implement the green-development concept and realizing the steady progress of the “transition period” of China’s power-structure transformation are the general objectives for the whole industry.
Author Contributions
J.C. contributed to the conception of the study and contributed significantly to analysis and manuscript preparation. W.F. performed the data analyses and wrote the manuscript. J.H. helped perform the analysis with constructive discussions. All authors have read and agreed to the published version of the manuscript.
Funding
This work is supported by the National Natural Science Foundation of China (NSFC) (71874133) and the Annual Basic Scientific\ Research Project of Xidian University (2019).
Acknowledgments
We would like to thank editors and anonymous reviewers for their valuable comments and suggestions, which have significantly improved this paper. This work is supported by the National Natural Science Foundation of China (NSFC) (71874133) and the Annual Basic Scientific Research Project of Xidian University (2019).
Conflicts of Interest
The authors declare no conflicts of interest.
References
- Lita, B.N. International Energy Outlook 2019; Energy Information Administration: Washington, DC, USA, 2007; p. 89. [Google Scholar]
- Halkos, G.E.; Polemis, M.L. The impact of economic growth on environmental efficiency of the electricity sector: A hybrid window DEA methodology for the USA. J. Environ. Manag. 2018, 211, 334–346. [Google Scholar] [CrossRef]
- Atems, B.; Hotaling, C. The effect of renewable and nonrenewable electricity generation on economic growth. Energy Policy 2018, 112, 111–118. [Google Scholar] [CrossRef]
- Guo, X.R.; Zhao, L.J.; Chen, D.S.; Jia, Y.H.; Chen, D.N.; Zhou, Y.; Cheng, S.Y. Prediction of reduction potential of pollutant emissions under the coal cap policy in BTH region, China. J. Environ. Manag. 2018, 225, 25–31. [Google Scholar] [CrossRef] [PubMed]
- Zhang, Z.Z.; Wang, W.X.; Cheng, M.M.; Liu, S.J.; Xu, J.; He, Y.J.; Meng, F. The contribution of residential coal combustion to PM 2.5, pollution over China’s Beijing-Tianjin-Hebei region in winter. Atmos. Environ. 2017, 159, 147–161. [Google Scholar] [CrossRef]
- National Bureau of Statistics of PRC. China Environmental Statistics Yearbook; China Statistics Press: Beijing, China, 2018. (In Chinese) [Google Scholar]
- Yan, Q.Y.; Wang, Y.X.; Tomas, B.; Sun, Y.K.; Dalia, S. Energy-Related CO2 emission in China’s provincial thermal electricity generation: Driving factors and possibilities for abatement. Energies 2018, 11, 1096. [Google Scholar] [CrossRef]
- Du, L.; Mao, J. Estimating the environmental efficiency and marginal CO2 abatement cost of coal-fired power plants in China. Energy Policy 2015, 85, 347–356. [Google Scholar] [CrossRef]
- BP. 2018 BP Statistical Review of World Energy. Available online: https://www.bp.com/zh_cn/china/reports-and-publications/_bp_2018_.html (accessed on 30 September 2019).
- Li, M.Q.; Dalia, P.E.; Zhang, J.F. Policies to promote energy efficiency and air emissions reductions in China’s electric power generation sector during the 11th and 12th five-year plan periods: Achievements, remaining challenges, and opportunities. Energy Policy 2019, 125, 429–444. [Google Scholar] [CrossRef]
- Song, M.L.; Wang, J.L. Environmental efficiency evaluation of thermal power generation in China based on a slack-based endogenous directional distance function model. Energy 2018, 161, 325–336. [Google Scholar] [CrossRef]
- Xie, B.C.; Shang, L.F.; Yang, S.B.; Yi, B.W. Dynamic environmental efficiency evaluation of electric power industries: Evidence from OECD (Organization for Economic Cooperation and Development) and BRIC (Brazil, Russia, India and China) countries. Energy 2014, 74, 147–157. [Google Scholar] [CrossRef]
- Patricia, Z.C.; Carlos, P.; Josep, M.M.S.; Laureano, J.; Gonzalo, G.G. Sustainability efficiency assessment of the electricity mix of the 28 EU member countries combining data envelopment analysis and optimized projections. Energy Policy 2019, 134, 110921. [Google Scholar]
- Marrasso, E.; Roselli, C.; Sasso, M. Electric efficiency indicators and carbon dioxide emission factors for power generation by fossil and renewable energy sources on hourly basis. Energy Convers. Manag. 2019, 196, 1369–1384. [Google Scholar] [CrossRef]
- Färe, R.; Grosskopf, S.; Tyteca, D. An activity analysis model of the environmental performance of firms—Application to fossil-fuel-fired electric utilities. Ecol. Econ. 1996, 18, 0–175. [Google Scholar] [CrossRef]
- Zhou, P.; Ang, B.W.; Poh, K.L. A survey of data envelopment analysis in energy and environmental studies. Eur. J. Oper. Res. 2008, 189, 1–18. [Google Scholar] [CrossRef]
- Lin, B. Electric Consumption and China’s Economic Growth: A study based on production function. Manag. World. 2003, 11, 18–27. (In Chinese) [Google Scholar]
- Wei, C.; Shen, M.H. Energy efficiency and its influencing factors: An empirical analysis based on DEA. Manag. World. 2007, 8, 66–76. (In Chinese) [Google Scholar]
- Xu, Y.P. The efficiency of Chinese electricity production industry: A perspective of government regulation. J. Appl. Stat. Manag. 2012, 31, 85–95. (In Chinese) [Google Scholar]
- Wang, K.L.; Yang, B.C.; Yang, L. Analysis on China’s energy efficiency and potentials of energy conservation and emissions reduction from the perspective of environmental impact. Manag. Rev. 2012, 24, 40–50. (In Chinese) [Google Scholar]
- Jiang, B.; Cai, Y. Evaluation of electrical energy utilization efficiency based on DEA model. Chin. J. Manag. Sci. 2012, 20, 827–832. (In Chinese) [Google Scholar]
- Jiang, C.H.; Hu, Y.N. Technical efficiency and influencing factors of thermal power listed companies: An empirical analysis based on DEA method and Tobit model. Macro-Econ. 2014, 08, 61–73. (In Chinese) [Google Scholar]
- Bi, G.B.; Song, W.; Zhou, P.; Liang, L. Does environmental regulation affect energy efficiency in China’s thermal power generation? Empirical evidence from a slacks-based DEA model. Energy Policy 2014, 66, 537–546. [Google Scholar] [CrossRef]
- Qu, Q.Q.; Xie, B.C.; Yin, K.X. Analysis of efficiency variances of thermal power industry among China’s provinces with undesirable outputs considered. Resour. Sci. 2012, 34, 1160–1166. (In Chinese) [Google Scholar]
- Mou, D.G. Understanding China’s electricity market reform from the perspective of the coal-fired power disparity. Energy Policy 2014, 74, 224–234. [Google Scholar] [CrossRef]
- Yang, H.; Pollitt, M. Incorporating both undesirable outputs and uncontrollable variables into DEA: The performance of Chinese coal-fired power plants. Eur. J. Oper. Res. 2009, 197, 1095–1105. [Google Scholar] [CrossRef]
- Welch, E.; Barnum, D. Joint environmental and cost efficiency analysis of electricity generation. Ecol. Econ. 2009, 68, 2336–2343. [Google Scholar] [CrossRef]
- Charnes, A.; Cooper, W.W.; Rhodes, E. Measuring the efficiency of decision-making units. Eur. J. Oper. Res. 1978, 2, 429–444. [Google Scholar] [CrossRef]
- Liu, T.; Li, J.X.; Chen, J.; Yang, S.L. Urban ecological efficiency and its influencing factors—A case study in Henan Province. Sustainability 2019, 11, 5048. [Google Scholar] [CrossRef]
- Dickson, K.G.; Hong, J.; Magdalene, Z.A.A.; Mohanmmad, K. Network DEA models for assessing urban water utility efficiency. Util. Policy 2019, 57, 48–58. [Google Scholar]
- José, L.R.; Inmaculada, S. Performance evaluation through DEA benchmarking adjusted to goals. Omega 2019, 87, 150–157. [Google Scholar]
- Tone, K. A slacks-based measure of efficiency in data envelopment analysis. Eur. J. Oper. Res. 2001, 130, 498–509. [Google Scholar] [CrossRef]
- Tone, K. Dealing with undesirable outputs in DEA: A slacks-based measure (SBM) approach. In Proceedings of the North American Productivity Workshop 2004, Toronto, ON, Canada, 23–25 June 2004; pp. 44–45. [Google Scholar]
- Kim, T.W.; Jo, S.H. Measuring efficiency of global electricity companies using data envelopment analysis model. Korean Resour. Econ. Rev. 2000, 9, 349–371. [Google Scholar]
- Tao, F.; Guo, J.W.; Yang, S.X. Technical efficiency of chinese power generation and its determinants in the period of electric- system transition. China Ind. Econ. 2008, 1, 68–76. (In Chinese) [Google Scholar]
- Blokhuis, E.; Advokaat, B.; Schaefer, W. Assessing the performance of Dutch local energy companies. Energy Policy 2012, 45, 680–690. [Google Scholar] [CrossRef]
- Qu, X.E. Decomposition of interprovincial total factor energy efficiency in China–An empirical Study based on malmquist index. J. Quant. Tech. Econ. 2009, 26, 29–43. (In Chinese) [Google Scholar]
- Sarıca, K.; Or, I. Efficiency assessment of Turkish power plants using data envelopment analysis. Energy 2007, 32, 1484–1499. [Google Scholar] [CrossRef]
- Li, Y.L. Market oriented reform and electric industry efficiency: Based on the DEA research of listed Company. Modern Econ. Sci. 2009, 31, 59–64+126. (In Chinese) [Google Scholar]
- Xie, B.C.; Xu, D.P.; Liu, M.L.; Xu, R. Low carbon economy study on provinces’ power generation sector based on input malmquist index. Manag. Rev. 2010, 22, 119–128. (In Chinese) [Google Scholar]
- Sueyoshi, T.; Goto, M. Photovoltaic power stations in Germany and the united states: A comparative study by data envelopment analysis. Energy Econ. 2014, 42, 271–288. [Google Scholar] [CrossRef]
- Wang, X.P.; Liu, X.H. Analysis of regional difference and spatial correlation of carbon emission performance of power industry. J. Ind. Technol. Econ. 2014, 33, 129–135. (In Chinese) [Google Scholar]
- Iribarren, D.; Vázquez-Rowe, I.; Rugani, B.; Benetto, E. On the feasibility of using energy analysis as a source of benchmarking criteria through data envelopment analysis: A case study for wind energy. Energy 2014, 67, 527–537. [Google Scholar] [CrossRef]
- Li, L.C. The Financial Contagion of Listed Commercial Banks in China: Based on Dynamic Correlation of Stock Price. Econ. Probl. 2018, 01, 71–77. (In Chinese) [Google Scholar]
- Wang, K.; Wei, Y.M.; Huang, Z. Environmental efficiency and abatement efficiency measurements of China’s thermal power industry: A data envelopment analysis based materials balance approach. Eur. J. Oper. Res. 2018, 269, 35–50. [Google Scholar] [CrossRef]
- Ministry of Ecology and Environment of PRC. Report on the State of the Ecology and Environment in China 2018. Available online: http%3A%2F%2Fwww.mee.gov.cn%2Fhjzl%2Fzghjzkgb%2Flnzghjzkgb%2F201905%2FP020190619587632630618.pdf (accessed on 30 September 2019).
© 2019 by the authors. Licensee MDPI, Basel, Switzerland. This article is an open access article distributed under the terms and conditions of the Creative Commons Attribution (CC BY) license (http://creativecommons.org/licenses/by/4.0/).