Article

Second Use Value of China’s New Energy Vehicle Battery: A View Based on Multi-Scenario Simulation

1
School of Economics and Management, Beijing Jiaotong University, Beijing 10044, China
2
School of Electrical Engineering, Beijing Jiaotong University, Beijing 10044, China
3
Asian Research Center, Copenhagen Business School, 2000 Frederiksberg, Denmark
*
Authors to whom correspondence should be addressed.
Sustainability 2020, 12(1), 341; https://doi.org/10.3390/su12010341
Submission received: 29 October 2019 / Revised: 28 December 2019 / Accepted: 30 December 2019 / Published: 1 January 2020

Abstract

:
Nowadays, many countries are actively seeking ways to solve the energy crisis and environmental pollution. New Energy Vehicle (NEV) has become an important way to solve these problems. With the rapid development of NEV, its batteries need to be replaced with new batteries after 5–8 years. Therefore, whether the second use of NEV’s battery has commercial or social value becomes a research hotspot. The innovation of this paper is to use the cost-benefit method to determine the value influencing factors of NEV’s battery second use, and use system dynamics to perform scenario simulation analysis. The methods used in this paper are the cost-benefit method and system dynamics method. Firstly, this paper systematically analyzes the cost and benefit factors that affect the second use value of China’s NEV batteries and uses system dynamics to establish the relationship and value model among various factors. Then, this paper compares the value of battery energy storage between old batteries and new batteries. According to the cost-income factor analysis, this paper eventually selects specific factors and uses VENSIM software to carry out the multi-scenario simulation. The results show that NEV’s battery second use has commercial and social value compared to new battery energy storage. Moreover, battery cost, government subsidies, and electricity prices are three important factors that affect the second use value of China’s NEV battery. Changing the government’s cash subsidy methods, such as providing free batteries or combining new energy to reduce on-grid tariffs, will help increase the second use value of the NEV battery. In the future, the second use value of China’s NEV battery industry will be more significant, with the update of the technology, the surge in the number of NEV’s used batteries, and government support.

1. Introduction

With the rapid development of the economy, the global traditional fossil energy has been overexploited and overused [1]. Many countries are gradually paying attention to new energy industries to ensure the comprehensive development of economy-society-ecology, including China [2]. From 2009, the Chinese government regarded the “new energy” and “new energy vehicle (NEV)” industries as national strategic emerging industries to accelerate the development of renewable energy industry and solve environmental pollution and energy crisis.
According to the China Association of Automobile Manufacturers (CAAM), by the end of 2018, China’s sales of NEV reached 1,256,000 units, an increase of 61.7% over 2018 (http://www.nea.gov.cn/2018-01/24/c_136921015.htm). It estimates that the sales of NEV will reach 2 million by 2020 [3]. At the same time, China’s NEV’s battery installed capacity is 65 GWh in 2018, an increase of 46% over 2017. (http://www.miit.gov.cn/n1146285/n1146352/n3054355/n3057542/n3057547/c6651773/content.html) However, when the energy storage capacity of the NEV’s battery declines to 70~80% [4], the battery is no longer suitable for NEV and must be replaced [5]. Generally, the energy storage capacity of the new battery will reduce to 80%, after 5~8 years of use on NEV [6,7]. Since the promotion of the Ten Cities and Thousand Vehicles Project in 2009, CAAM data shows that China’s NEV old battery already has a capacity of approximately 1.22 GWh. Furthermore, this number will arrive at about 25 GWh or more by 2020, which is about 10,446 tons [6]. If NEV’s used batteries cannot be handled appropriately and reused, it will not only waste resources but also cause great harm to the environment.
Under the development of this industry trend, in order to solve the problem of NEV battery reuse and increase the recycling value of NEV batteries, the Chinese government has vigorously promoted the commercialization and industrialization of the second use of NEV batteries. At the same time, the Chinese government has issued some policies, to promote the second use of NEV’s used batteries. With the support of various policies, more and more companies are beginning to enter the NEV’s battery recycling industry, especially the combination of NEV’s batteries with electrical energy storage [3,8].
According to the literature review, the second use of NEV‘s battery for energy storage has become an essential aspect of reusing NEV’s battery. On the one hand, it can reduce the waste of resources and realize the recycling of battery raw materials, such as lithium and nickel. On the other hand, it can realize the application of NEV’s battery industry in the entire life cycle, that is, the NEV battery industry process can change from “production-sales-application-disassembly” to “production-sales-application-second use for energy storage -disassembly-resource recycle.”
From the perspective of resources, the supply and demand of battery raw materials and finished products have become essential factors limiting its development, such as lithium, nickel, and manganese ore [9,10,11,12]. From the perspective of policy, the second use value of NEV’s battery energy storage can provide a multi-perspective analysis for the government to formulate relevant industrial promotion policies [13], in the early stages of industrialization and commercialization. Multi-scenario simulation can help develop more targeted approaches to give full play to the market’s enthusiasm for the secondary use of NEV’s battery. From the perspective of technical research and economic analysis, the development of the energy storage industry has received more and more attention from industry and academia [8]. Energy storage can diminish the imbalance of large-scale deployment of intermittent renewable energy (namely wind energy and solar PV), relieving the grid congestion, and promoting distributed generation [14].
The second use of NEV’s battery for energy storage can use in different scenarios, such as the power generation side, the power distribution side, the user side, and auxiliary services. According to different scenarios, it can improve the reliability of electricity consumption, extend the service life of the power grid, improve environmental friendliness, balancing the power network load, and other functions. If the energy storage of NEV’s battery is installed on the power generation side, it can combine with new energy power generation (such as photovoltaic, wind power, etc.), thus, effectively reduce the intermittentness and uncertainty of new energy power generation and improve industrial efficiency. In particular, ① Combined with the use of new energy power plants, battery energy storage can store electricity during the period of low power consumption and release electricity to the grid during peak hours of power consumption. Battery energy storage used in this way can reduce the intermittent and instability of new energy power generation to improve the efficiency of new energy power generation. ② Combined with the use of power grid transmission and distribution, it can not only slow down the expansion of the power grid and reduce the costs but also improve the reliability of the power grid. ③ Used by energy customers, it can reduce the power loss caused by power failure, and also reduce the cost of electricity for users.
Based on different scenarios, scholars have carried out multi-angle studies on their social and economic values. Research shows that NEV’s battery second use in energy storage has essential value, including commercial value and social value [5,6,7,14,15,16,17,18,19,20,21,22,23,24,25].
On the one hand, the commercial value varies depending on the location of battery energy storage in the grid, such as the power generation side, the power distribution side, and the user side [22]. The commercial value mainly includes the subsidies given by the government, and income of balancing the power network load. Balanced power network load is that in the area where the electricity price is different during peak and valley periods, when the power consumption is low (the electricity price is low), the battery energy storage system (BESS) stores power from the power grid, and when the power consumption is high (the electricity price is high), the power is released to the power grid, thereby realizing economic benefits [26].
On the other hand, social value mainly includes improving the reliability of electricity consumption, extending the service life of the power grid, and improving environmental friendliness. As for improving the reliability of the power grid, when the generator suddenly stops working, BESS can be used as backup energy to output electricity to the grid and ensure the reliability of the grid. As for extending the service life of the power grid, BESS stores electricity during the period of low grid load, and releases electricity during the period of the peak grid load so that it can meet the power demand without expanding the grid, which then improves the service life of the grid. Moreover, if the BESS is installed on the new energy generation side, it can reduce the intermittent power generation (such as wind power, photovoltaic) to reduce the no-load of the generator, thereby improving the continuity of new energy generation and reducing the use of thermal power generation, which is good for the ecological environment [5,6,18,19,20,21,22,23,27,28,29,30,31,32,33,34].
Nowadays, NEV’s battery second use for energy storage is in the early stage of development, and it still lacks effective models to calculate the value. Moreover, the value of battery energy storage involves multiple areas (such as thermal power, wind power, photovoltaic), multiple stakeholders (battery manufacturers, governments, NEV users), and a variety of influencing factors. Thus, there is a big challenge in measuring the value of NEV’s battery second use in energy storage. Some scholars have not fully considered the impact of policy changes, and the commercial value changes brought about by policies change have not been fully considered; some scholars have only focused on business value and have not taken into account the measurement of social values such as resource recycling and environmental friendliness. This is also the problem that this article strives to solve. Therefore, this article comprehensively considers the commercial value and social value of NEV’s battery second use for energy storage, and enhances the value from the whole life cycle application of NEV’s battery. The research question in this paper is to determine the key factors and mutual relationship of NEV’s battery second use in energy storage, and then uses the cost-benefit method and multi-scenario simulation to study the second use value of China’s NEV batteries.
Therefore, the main contribution of this paper is as follows. Based on qualitative and quantitative analysis, firstly, this paper systematically analyzes the key factors affecting the value of secondary energy storage in electric vehicle batteries, such as environmental changes, battery price fluctuations, and government subsidies. Then, this paper builds an SD model through the causal relationship of value factors. Finally, this paper carries out model simulation calculations for typical cases, combined with the possibility of value factors.

2. Development and Literature Review

In China and the global market, more and more institutions are strengthening their investment in renewable energy. They also strive to combine multiple energy sources and try to establish an integrated energy system. Among them, the NEV’s battery second use in energy storage is an important aspect. Moreover, the development shows it mainly focusing on commercial applications, demonstrations, and research projects.
According to the development of battery energy storage in the world [16], we have summarized the typical projects of NEV’s battery second use in energy storage [4,6,35], as shown in Figure 1.
From Figure 1, the United States has been the leader in terms of NEV’s battery second use since 2002, involving commercial value, technical feasibility, and related theories. Moreover, Japan, Germany, and Sweden have also made some progress in commercial applications and demonstrations. On the Chinese market, many organizations have begun to invest in NEV’s battery second use, and it also has achieved remarkable results (Figure 2).
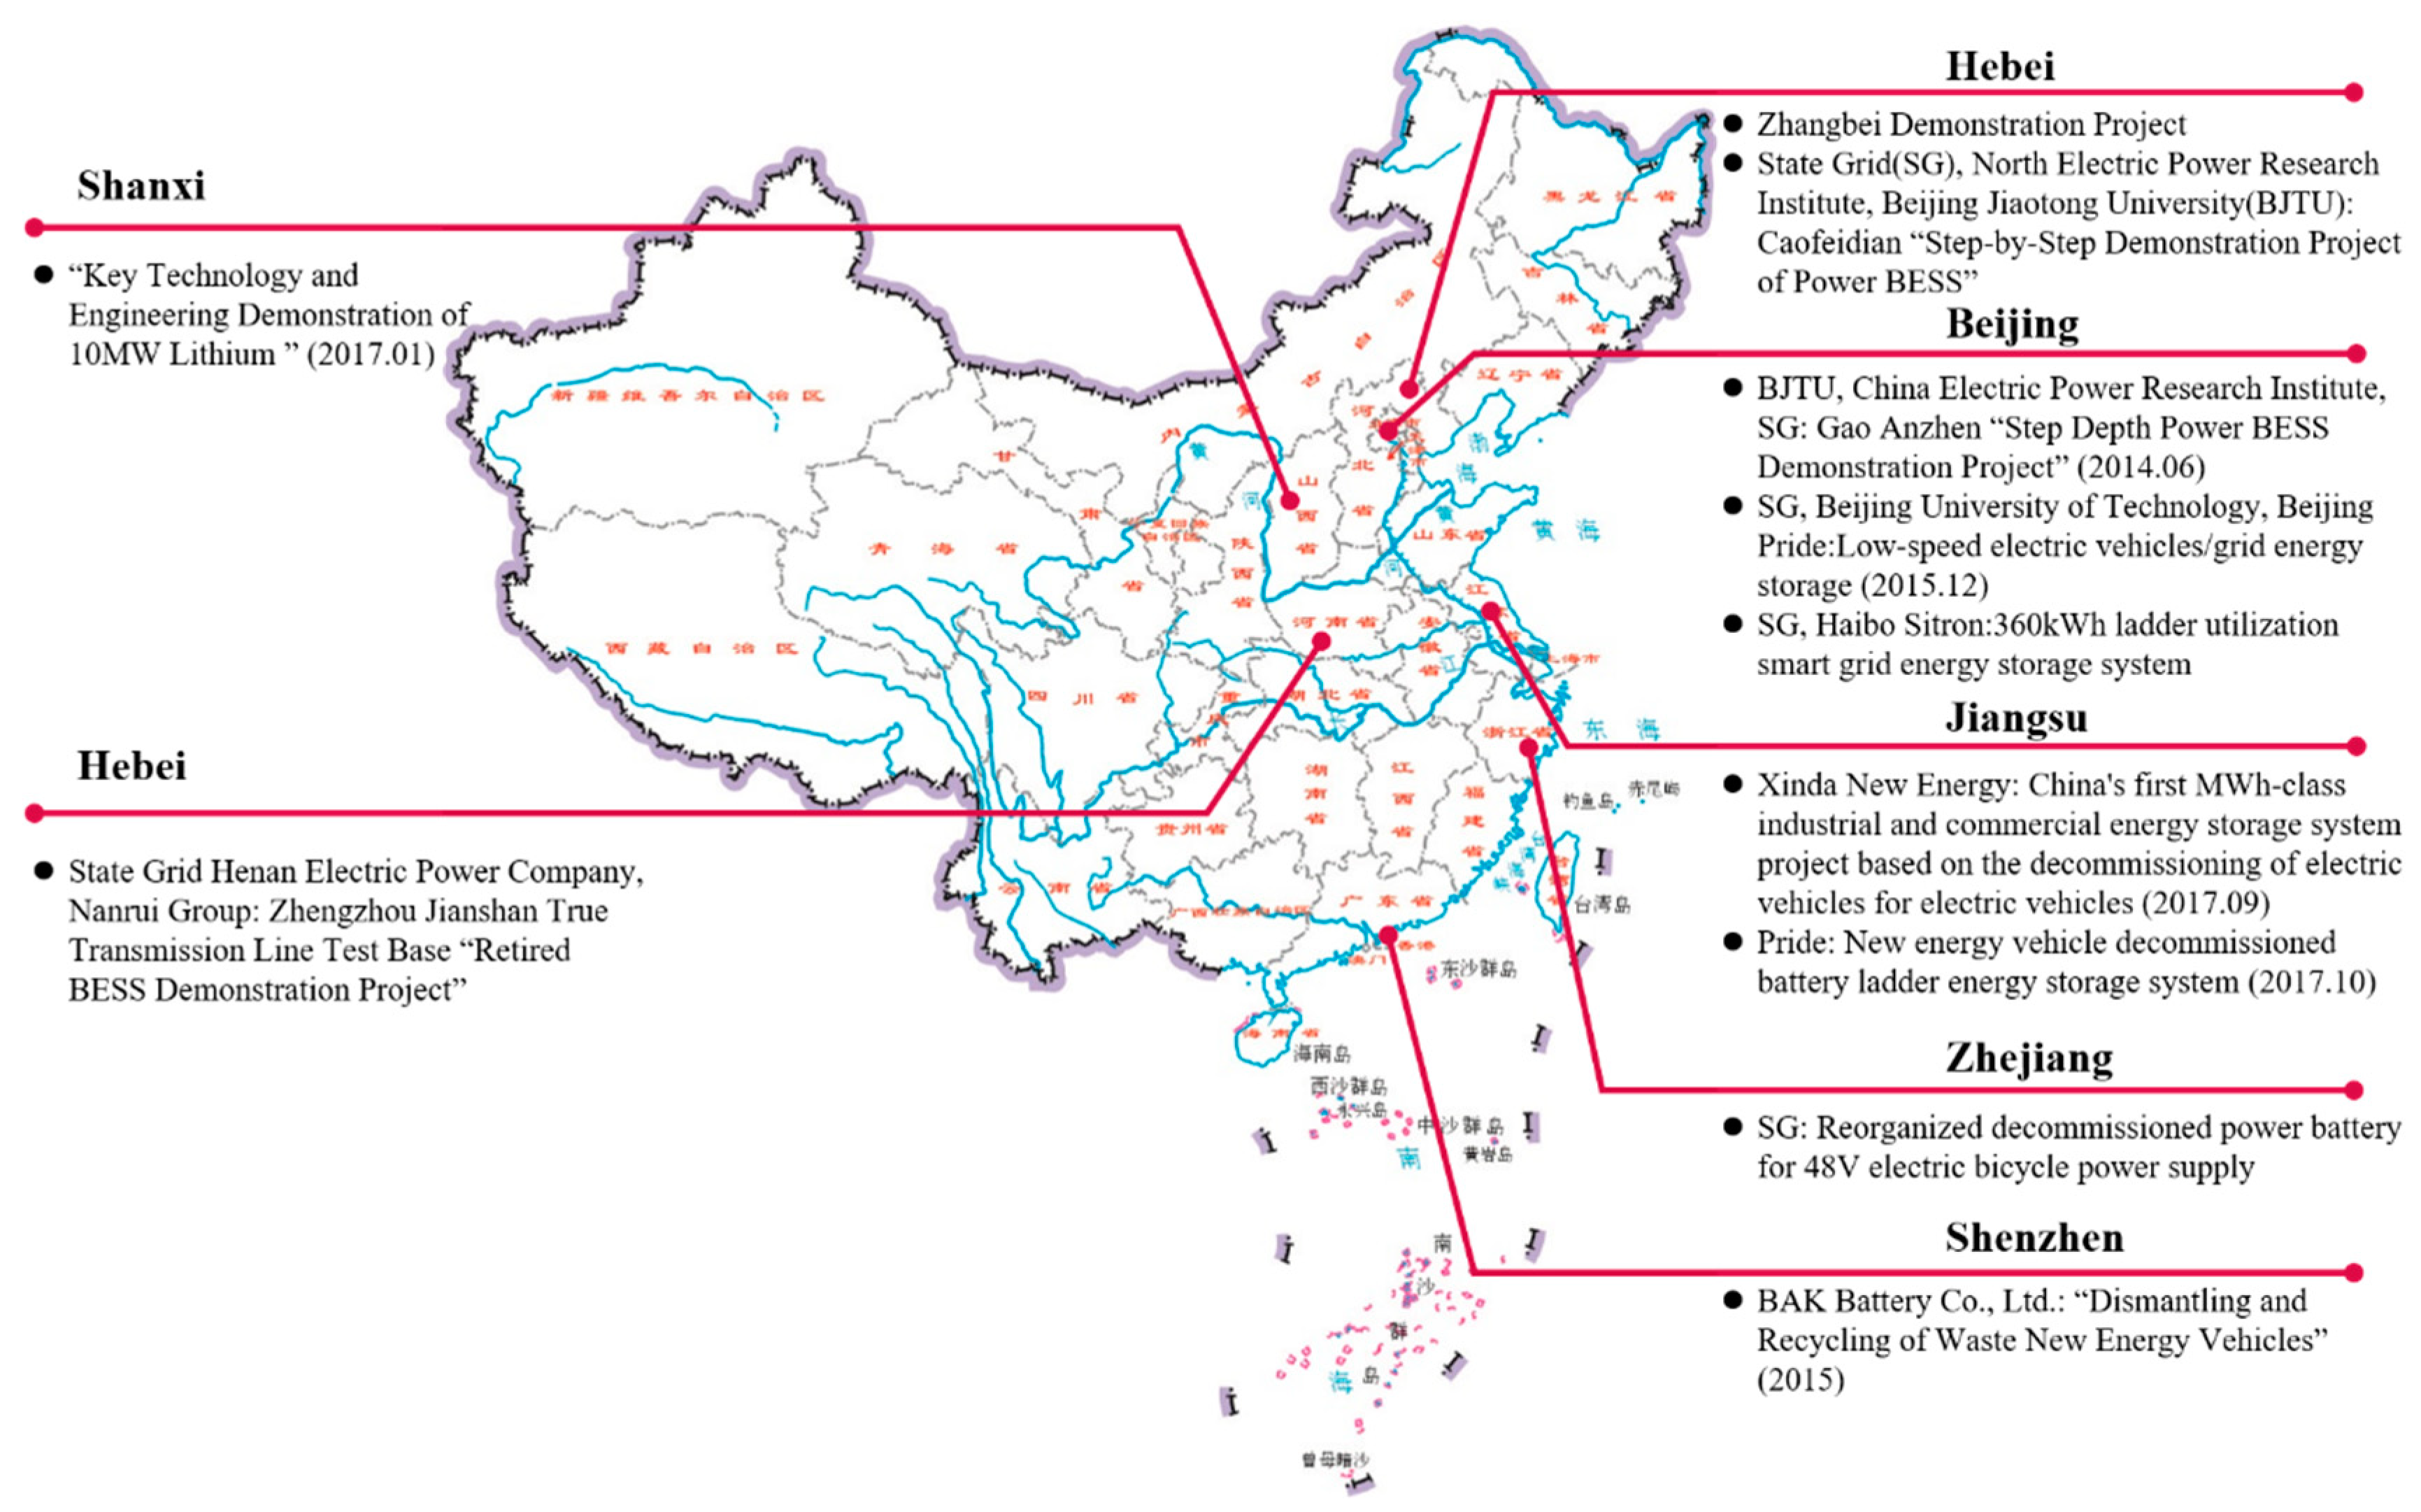
From Figure 2, we know that China has built several secondary applications for ‘NEV’s battery, mainly for demonstration and commercial operations. As we can see from the map, most projects are primarily distributed in the eastern coastal areas. After comparison, we know that the program in Zhangbei (Hebei Province, China) provides a model for the NEV’s battery second use in energy storage.
In China, NEV’s battery secondary applications are developing quickly, mainly driven by government policies and the NEV market. Government policies include industrial development guidance, action plans, industry regulations, and financial assistance and subsidies. They are designed to regulate the orderly development of NEV’s battery second use. These main policies are shown in Table 1.
From Table 1, Guidance on Promoting Energy Storage Technology and Industrial Development is the first guidance policy, which supports the development of large-scale energy storage technologies and industrial applications in China. It clearly shows that NEV’s battery should be used throughout the life cycle, and energy storage is an essential aspect of NEV’s battery second use. With the support of various policies, more and more stakeholders, such as State Grid, BYD, and CATL, have launched energy storage programs and promoted the development of the NEV’s battery second use in the energy storage industry.
In order to promote the process of industrial promotion and commercialization, scholars have carried out various researches on the value of NEV’s battery second use in energy storage [26,32,35,36,37,38,39].
Firstly, there has been research concerning the value elements analysis. Scholars have studied the value elements from the perspective of power generation, power distribution, users, and auxiliary services. This mainly includes two elements, namely, cost and benefit. On the one hand, the cost includes initial investment cost and operation and maintenance cost [14,39,40,41]. Some scholars have also carried out a technical analysis of the cost of battery energy storage, from the perspective of the capacity change of second use of NEV batteries [5,6,22]. On the other hand, the income includes the subsidies given by the government, and the benefits from balancing the power network load [40], improving the reliability of electricity consumption, extending the service life of the power grid, and improving environmental friendliness [28].
Secondly, scholars have mainly used the cost-effectiveness analysis method to analyze the commercial value and social value of battery energy storage, although the research perspective is different [15,19,42,43,44,45,46]. For example, Zakeri and Syri used the life cycle cost (LCC) analysis to analyze the economics of different forms of battery energy storage [14]. Ma et al. analyzed the feasibilities and economic comparisons between the battery and pumped storage schemes in terms of life cycle cost (LCC) and technical viability [39]. In [40], a novel approach for optimal allocation and economic operation of ESS in MGs is presented using matrix real-coded genetic algorithm (MRCGA) techniques.
Finally, research has been done focusing on the use of value simulation tools. Some scholars use the HOMER software to do the simulations and perform the techno-economic evaluation, in terms of system net present cost (NPC) and cost of energy (COE) [28,41,47,48]. Furthermore, some scholars have using a genetic algorithm, fuzzy comprehensive evaluation method, and improved bat algorithm [49,50,51,52] to evaluate the economics. For example, Cortés et al. used genetic algorithms to determine the distribution of energy storage involved in wind power auxiliary services, and optimized the total energy efficiency model of energy storage battery systems [51]. From the perspective of the entire life cycle, [14,39] Li et al. and May et al. constructed a cost-and-return-on-investment model, and an economic and sensitivity analysis is conducted to provide users with recommendations for building BESS [49,50].
Thus, we know that many scholars just focused on the investment economy, and less on the factors of the c value. The System Dynamics (SD) method can be combined with qualitative and quantitative methods [53], with functions such as simulating nonlinearity, high-order calculation, and multivariate analysis, to achieve macroscopic and microscopic dynamic examination [54,55,56]. Therefore, this paper takes the social and economic benefits of NEV’s battery second use in energy storage as the source of value. Finally, we used a cost-benefit analysis as the basic research method to evaluate the benefit in the calculation process. According to the characteristics of multi-variable and multi-feedback of BESS, this paper used SD to construct an economic benefit analysis model, as well as the economic calculation and simulation of the actual case.

3. Methodology and Research Framework

3.1. Methodology

According to the research questions and literature review, this paper selected the cost-benefit method as the basic research method, and took system dynamics as the basis for building the model.
System dynamics is a combination of structure and function. It is based on the relationship between system behavior and internal mechanisms. It uses a causality relationship graph and stock-flow graph to describe the system structure, and then uses mathematical models to achieve the related analysis of research problems. It has the advantages of non-linear, high-order, multi-variable, multi-feedback, and complex time-varying [57]. It also can realize the combination of qualitative and quantitative analysis, and provide systematic research on social, economic, ecological, and other complex issues [58,59].
In order to effectively explore the value of NEV’s battery second use in energy storage, and to determine whether the used battery is economical for use in energy storage stations, this paper compares the economic benefits of new and old batteries. According to the actual situation, this paper makes the following reasonable assumptions.
  • The cost of the monitoring system and the selection equipment are fixed, and they do not change with changes in the capacity of the energy storage station.
  • The change in the rate of decline caused by each battery charge and discharge is negligible, that is, the annual income from balancing the power network load is calculated according to the battery degradation rate in the first year.
  • The expected loss of power in the power outage is greater than the rated capacity of the energy storage system. That is, when the power is cut off, the rated capacity of the energy storage station is fully compensated to the power grid.

3.2. Research Framework

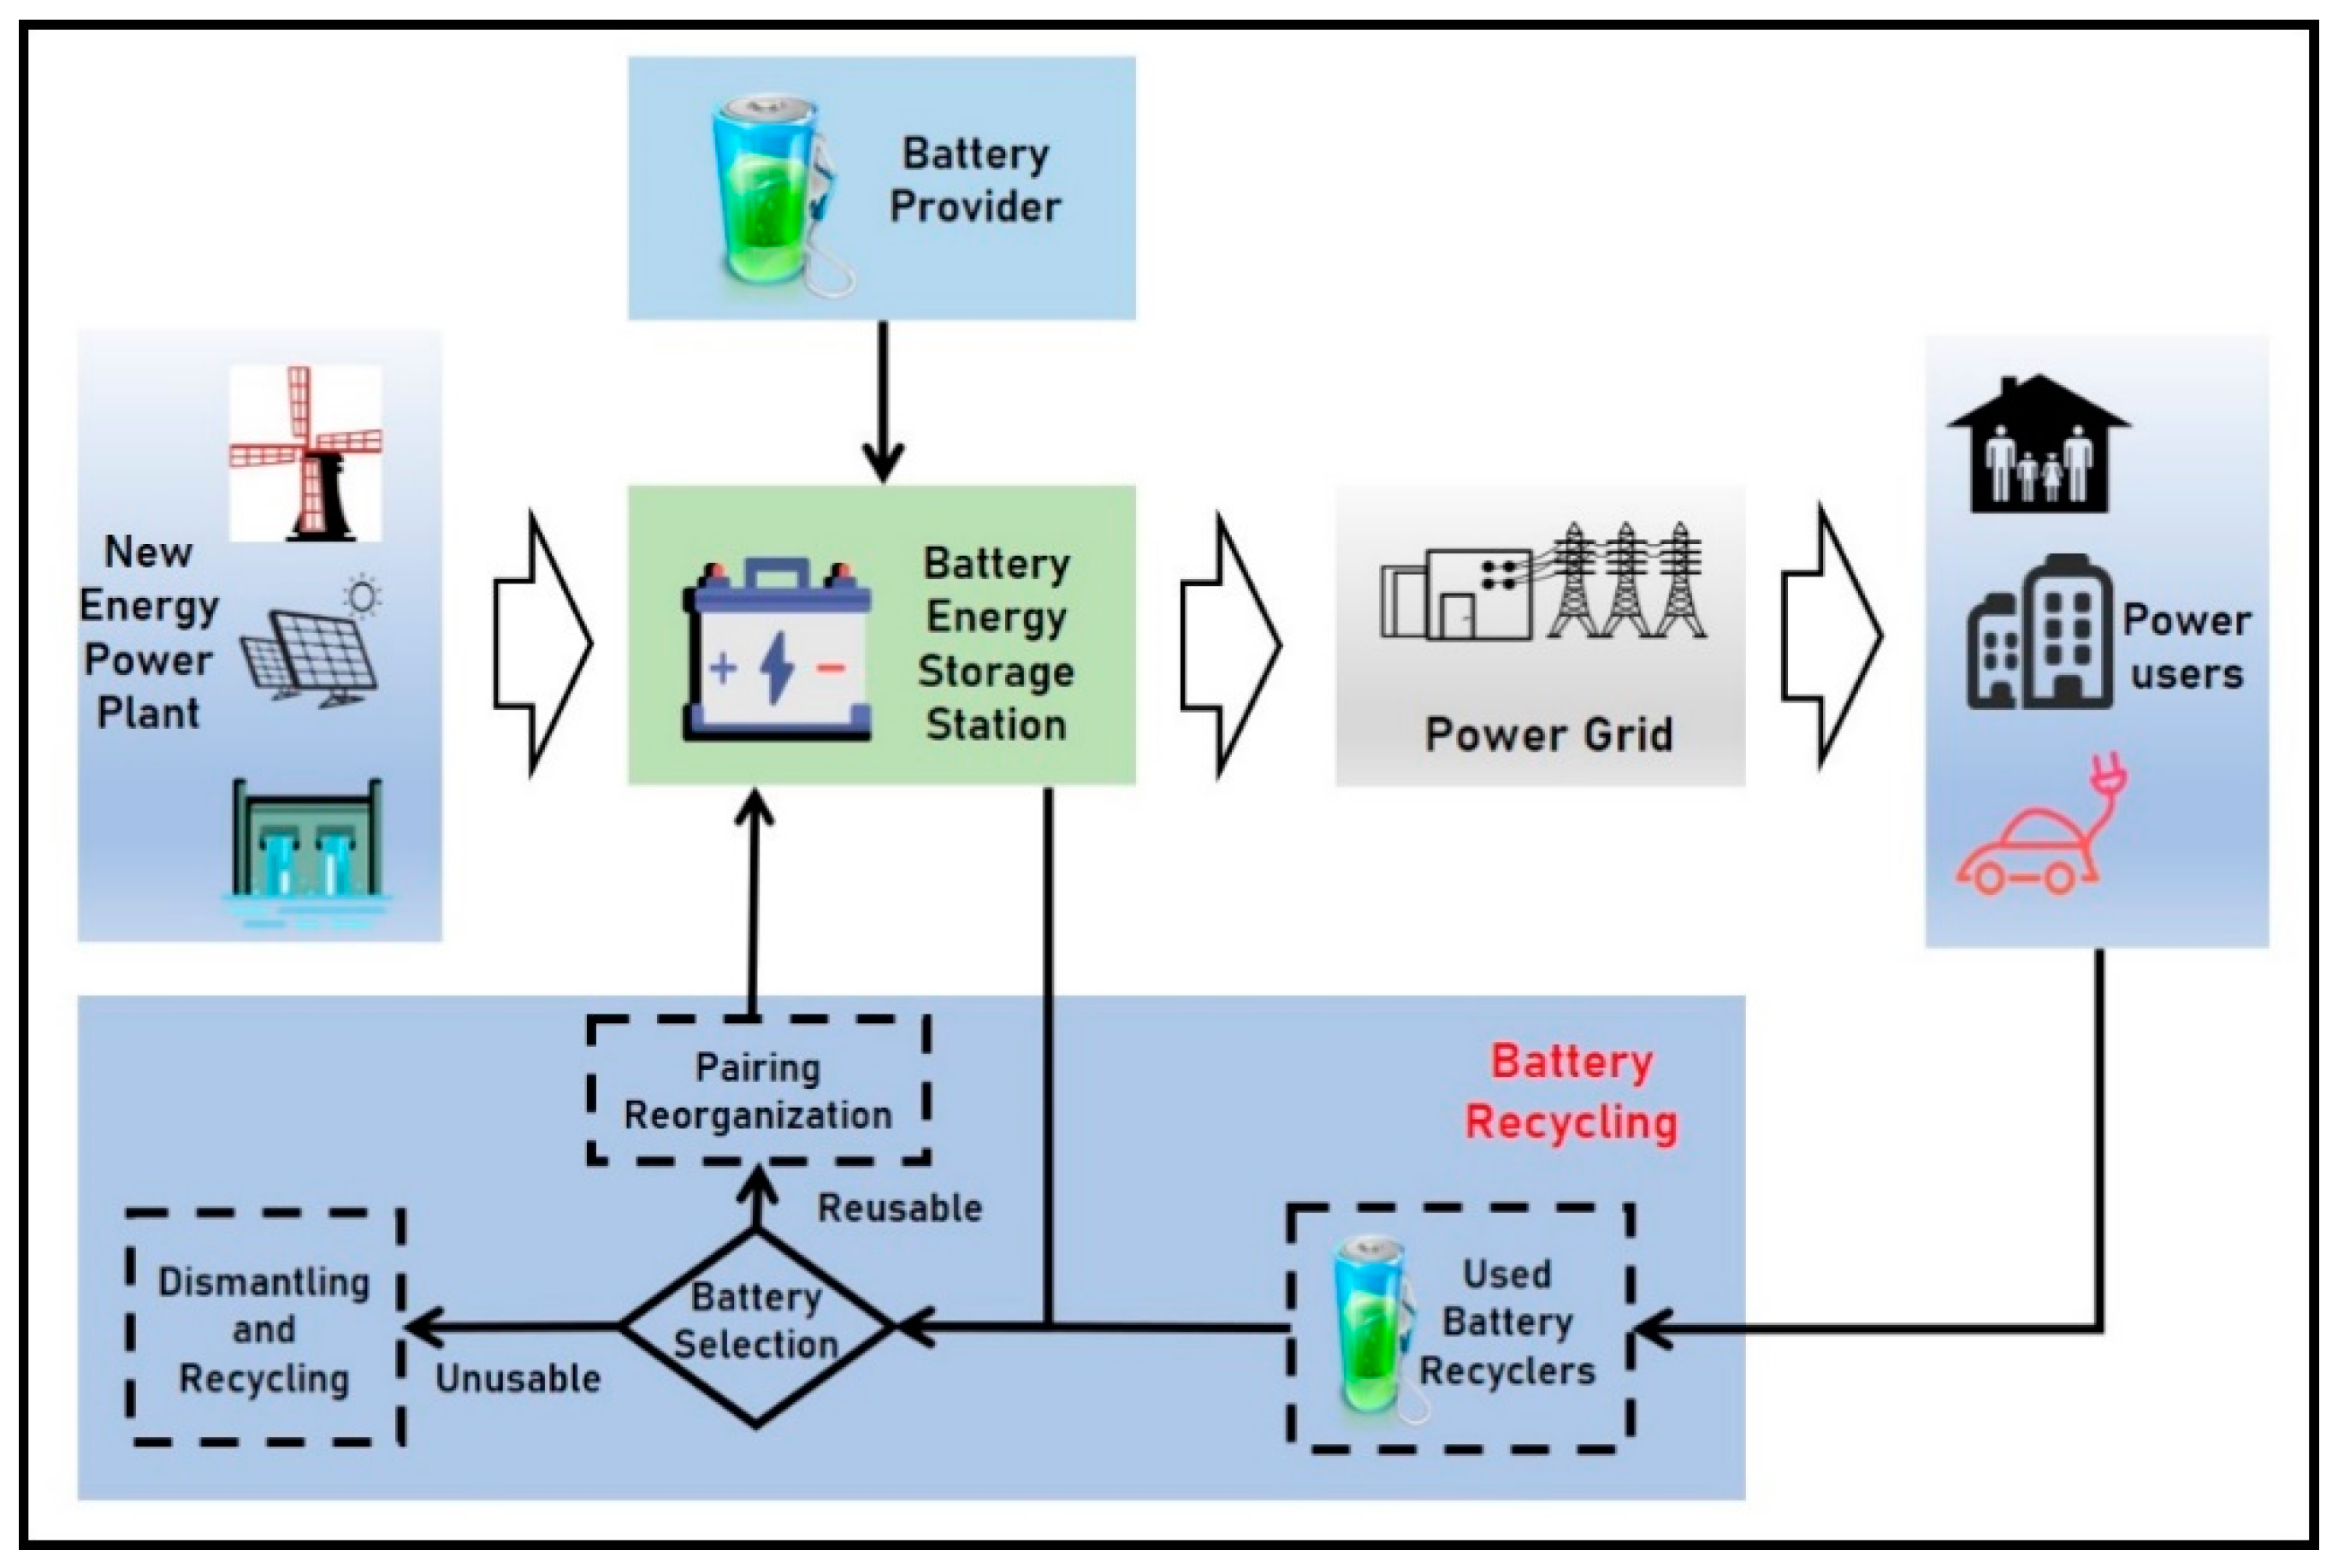
NEV’s battery second use in energy storage is a systematic process [3,6,20,28,45]. It relates to several parts, such as battery energy storage station, battery suppliers (new battery provider, old battery provider), new energy power plant, power grid, used battery recyclers, and power users [37,39,41,60,61], as shown in Figure 3.
As shown in Figure 3, NEV’s battery second use in energy storage is a complex process, which involving the production, delivery, and distribution of electricity, as well as battery supply and recycling. In order to maximize its value, this paper calculates it based on every factor, such as battery performance and economic characteristics. The research details are as follows.
  • Step 1: We analyze the technical indicators and cost indicators that affect the value of NEV’s battery second use in energy storage, and fully consider the quantitative indicators such as environmental income and government subsidies.
  • Step 2: We summarize the causal relationship between various technical indicators and cost-effective indicators, which are based on the characteristics of the BESS structure.
  • Step 3: By using the VENSIM software, we build the SD model under the correlation between the indicators.
  • Step 4: Firstly, we calculate the application of the SD model in a special case and compare the value difference between the old and new batteries. Secondly, we select specific factors for case studies based on the actual situation, and make recommendations for future development.

4. System Dynamic Model

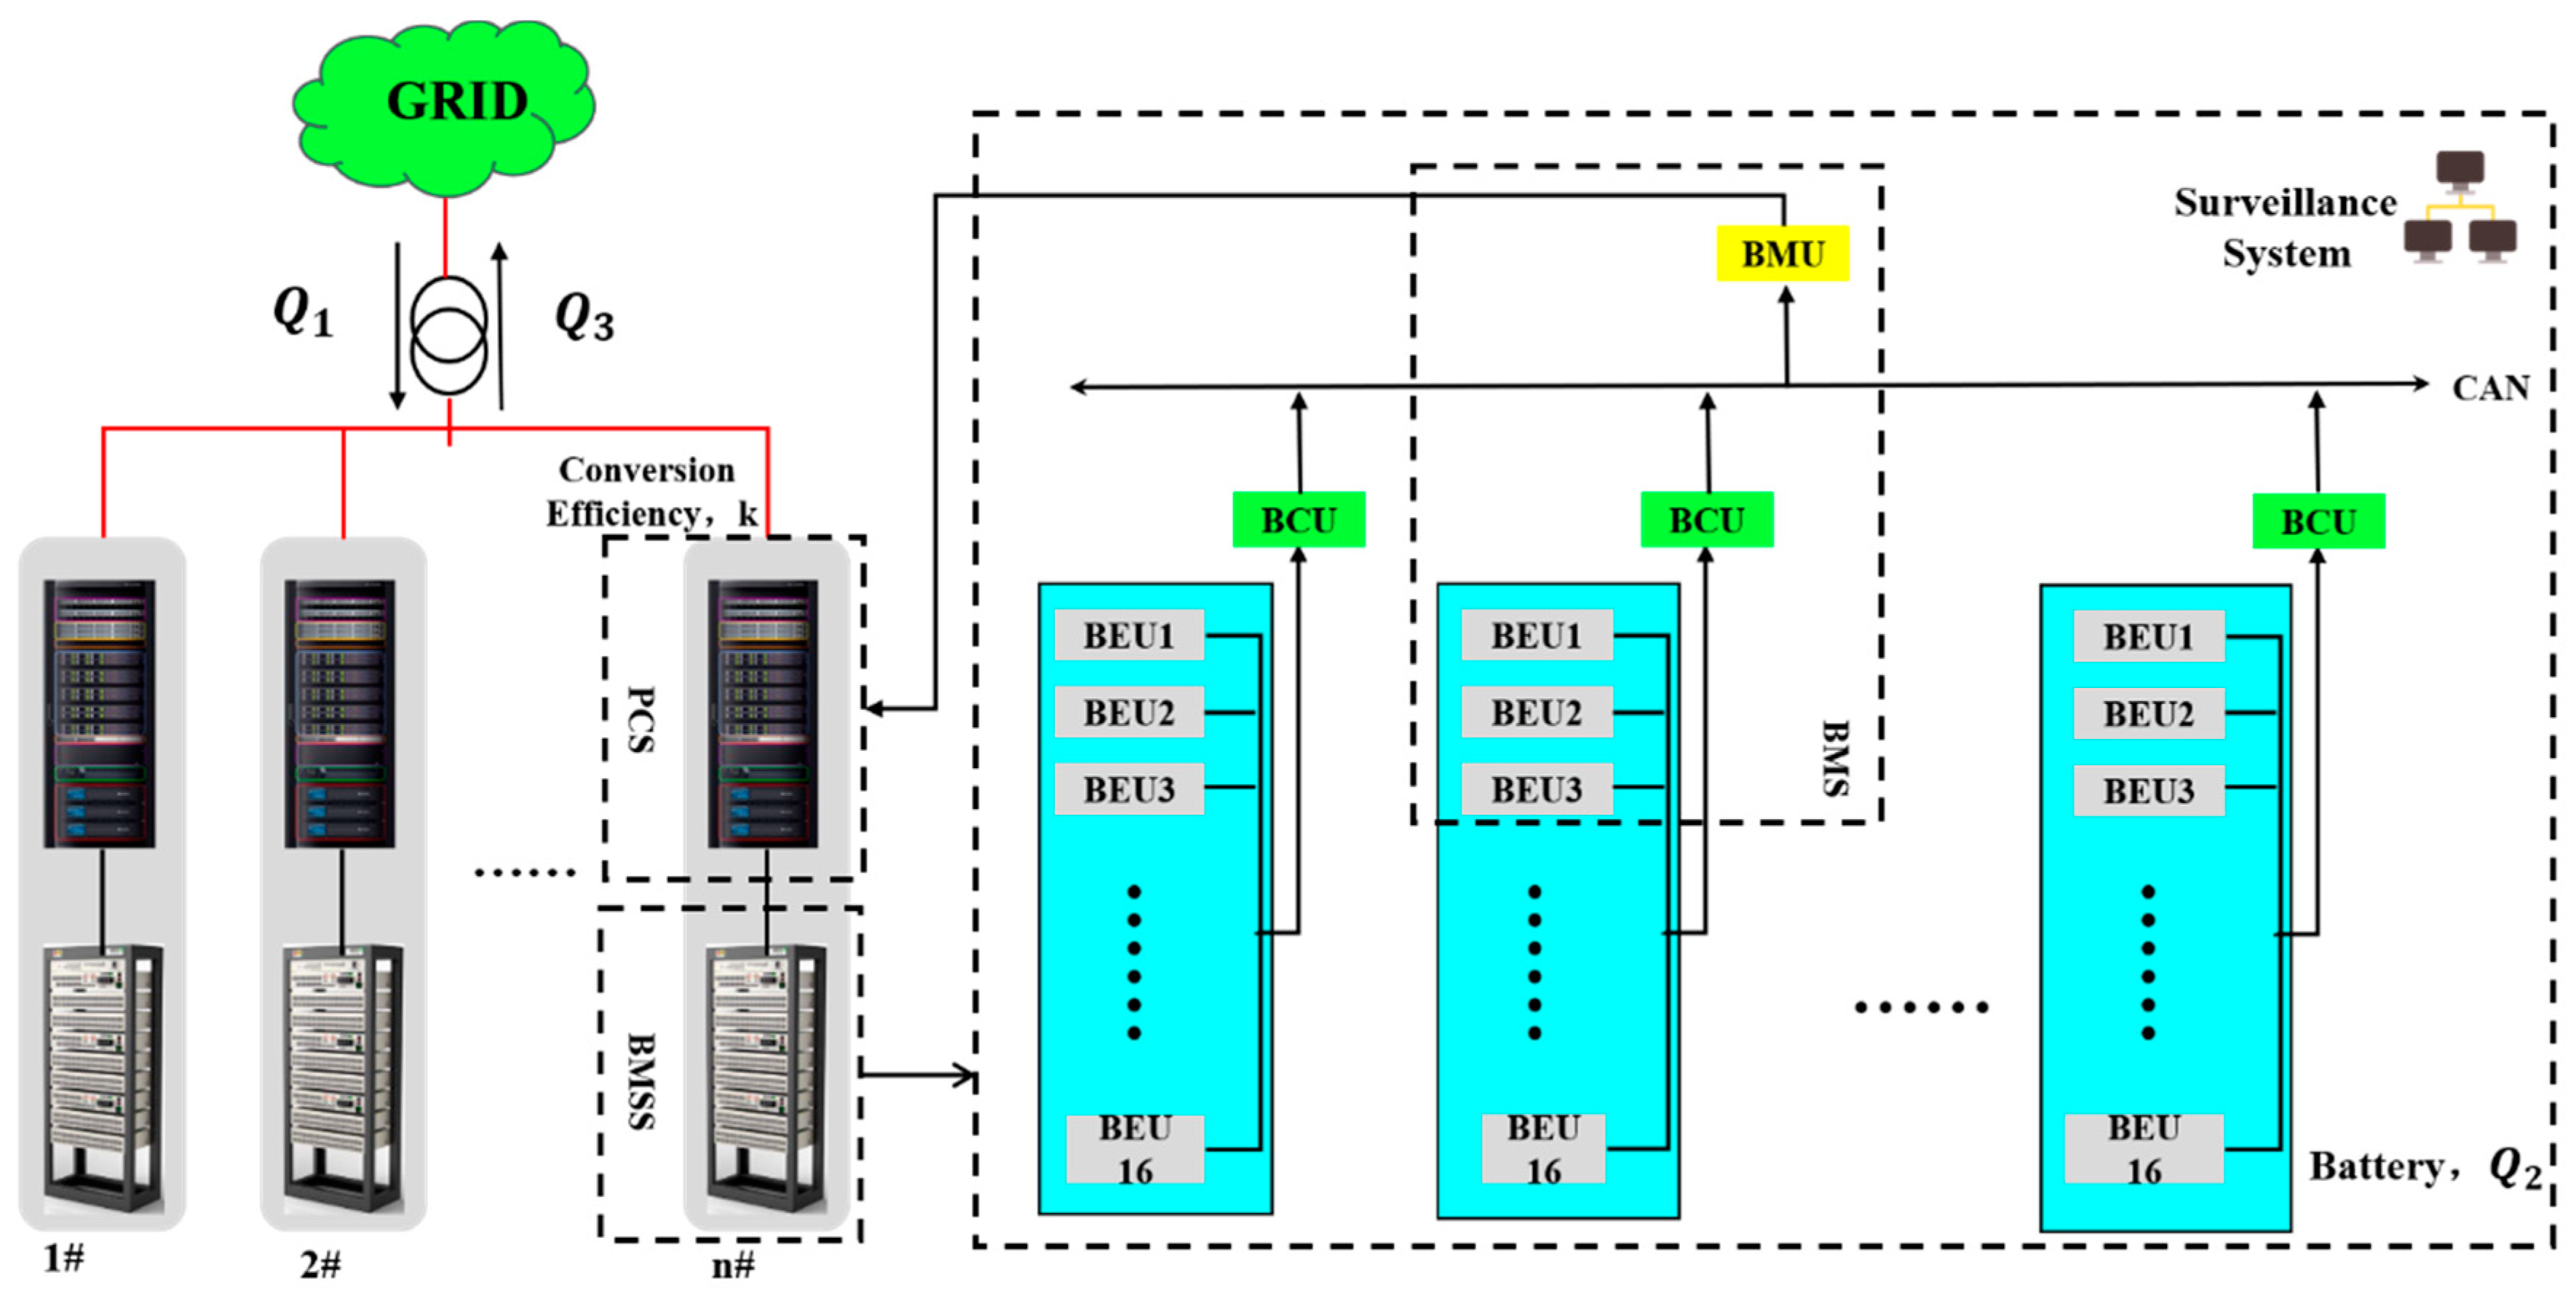
The battery energy storage stations are mainly composed of BESS [20], power converter system (PCS) [14], and monitoring system. BESS is traditionally composed of battery packs and battery management system (BMS), which is composed of a battery electronics unit (BEU), a battery computer unit (BCU), and a battery management unit (BMU).
Generally, each battery pack contains 12 batteries and is equipped with a BEU. One BCU is configured for every 16 BEUs, and one BMU is configured with 10 BCUs. Finally, the BMS communicates through the controller area network (CAN) [33,37], as shown in Figure 4.
According to Figure 4 and the literature review, we have obtained the factors of NEV’s battery second use in energy storage. Then, based on the interrelationship of factors, this paper uses VENSIM software to draw the value SD model of NEV’s battery second use in energy storage, as shown in Figure 5.
As Figure 5 shows, the SD model is composed of six parts: initial investment cost (part 1), annual operating cost (part 2), annual battery replaced cost (part 3), direct income (part 4), indirect income (part 5), and net present value (NPV) (part 6). Among them, Part 1–3 constitute the cost module; part 4, 5 constitute the income module.

4.1. Initial Investment Cost (Part 1)

The initial investment cost refers to equipment cost, land and construction costs, and battery cost required for the construction of NEV’s battery second use in energy storage. Thus, the initial investment cost can be expressed as follows:
C 1 = C j + C e + C o
where:
  • C j is the land and construction costs, RMB.
  • C e is the battery cost, RMB.
  • C o is the equipment costs, RMB.
C j includes the land cost and construction cost. C e includes the battery purchase cost, battery transportation cost, and old battery selection cost. C o includes the battery selection equipment cost and other equipment costs. Among them, other equipment includes Transformer, Converter, BMS, battery box, battery cabinet, and monitoring system.

4.2. Annual Operating Cost (Part 2)

The annual operating cost is the cost needed to maintain the BESS in a good standby state [19,40]. It includes annual equipment repair cost and annual labor cost. The annual labor cost is determined by the per capita monthly salary and the annual number of workers. The annual operating cost can be expressed as follows:
C 2 = C r + C w
C r = C s N w
where:
  • C r is the annual labor cost, RMB.
  • C s is the per capita monthly salary, RMB/Month.
  • N w is the annual number of workers.
  • C w is the annual equipment repair cost, RMB.

4.3. Battery Replaced Cost (Part 3)

Battery replaced cost is the cost of replacing a battery that is not suitable for the system operation. It is well known that the cost of batteries will change as the technology and market supply change. Therefore, we assume that the battery cost ( C e ) will be altered by a ratio θ in this paper. If the BESS can operate L years, battery replaced cost each time is:
C 3 = [ L Δ N ] ( C e θ )
where Δ N is the battery reuse period, which can be expressed as [5]:
Δ N = [ log ω ( 1 - λ ) 365 ] / n
where:
  • L is the service life of the BESS, year.
  • θ is the ratio of battery cost change, %.
  • ω is the capacity degradation rate, %.
  • λ is the battery capacity loss rate for each charge/discharge, %.
  • n is the daily charge and discharge times.

4.4. Direct Income (Part 4)

Direct income refers to the commercial value, which generated during NEV’s battery second use in energy storage. According to Figure 5, direct income includes income from balancing the power network load, annual government subsidy, and annual average residual value. In general, income from balancing the power network load

4.4.1. Income from Balancing the Power Network Load

This part of income depends on the electricity price that is variable at different time points. Generally, when the power consumption is low (that means electricity price is low accordingly), the power grid charges the BESS. Conversely, the BESS is discharged to the power grid at the peak of power consumption (which means the electricity price is high accordingly), thereby realizing the income through the above approach.
Figure 5 shows that when the BESS available capacity is Q 2 , the actual power consumption and actual discharge amount during charging and discharging are Q 2 / k and Q 2 k respectively. In fact, Q 2 is equal to BESS rated capacity Q m . Thus, annual income from the electricity price difference between the peak and the valley is as follows:
I 1 = m = 1 365 Q m ( 1 λ ) m ( e H k 2 e L ) k
where:
  • λ is the battery capacity loss rate for each charge/discharge, %.
  • k is the one-way conversion efficiency, %.
  • Q m is the BESS rated capacity, MWh.
  • e H is the electricity price at the peak of electricity consumption, RMB/kWh.
  • e L is the electricity price at the valley of electricity consumption, RMB/kWh.

4.4.2. Annual Government Subsidy

In order to promote industrial development, the government will provide some subsidies to attract more companies to enter the field. As China’s first local energy storage subsidy policy, Measures for the Management of Special Funds for Green Development of Suzhou Industrial Park clearly pointed out that for energy storage projects that promote multi-energy complementarity and NEV’s battery Second use, the government will give 0.3 RMB/kWh for 3 years according to the amount of power discharge. Therefore, the annual government subsidy in the first 3 years is:
I 2 = 365 Q m m f n
Then, the total government subsidy is:
I 2 = ( r 2 + 3 r + 3 ) ( 1 + r ) 3 I 2
Therefore, if the BESS operates for L years, the annual government subsidy is:
I 2 = r ( 1 + r ) L ( 1 + r ) L 1 I 2
where:
  • Q m is the BESS rated capacity, MWh.
  • m f is the unit capacity government subsidy, RMB/kWh.
  • n is the daily charge and discharge times.
  • r is the annual interest rate, %.
  • L is the service life of the BESS, year.

4.4.3. Annual Average Residual Value

When the service life of the BESS comes to an end, we will get the residual value of the fixed assets based on the fixed assets residual rate. Moreover, the scrapped batteries will be reclaimed and recovered to obtain the battery’s residual value. Thus, the residual value can be expressed as follows:
I 3 = ξ ( C j + C o ) + P e M e
Therefore, the annual average residual value is:
I 3 = r ( 1 + r ) L 1 I 3
where:
  • ξ is the average residual rate of fixed assets, %.
  • P e is the old battery unit weight price, RMB/ton.
  • M e is the total battery weight, tons.
  • C j is the land and construction costs, RMB.
  • C o is the equipment costs, RMB.

4.5. Indirect Income (Part 5)

Indirect income refers to the social value generated during NEV’s battery second use in energy storage.

4.5.1. Income from Postponing Power Grid Upgrade

The use of battery energy storage can increase the load on the grid, thus delaying the grid upgrade caused by the user’s increased power load. In this way, the power demand can be satisfied without increasing the power of the grid, so that the grid does not need to upgrade, thereby postponing the power grid upgrade. Thus, the income is [30]:
I 4 = Q m e j ( 1 1 e r N )
N = ( log ( 1 + μ ) ) ( log ( 1 + ϑ ) )
where:
  • N is the years postponed by power grid upgrade [62], years.
  • μ is the rate of reduction of the peak electricity consumption, %.
  • ϑ is the annual growth rate of the peak load, %.
  • e j is the unit capacity power grid construction cost, RMB/kWh.
  • r is the annual interest rate, %.
  • Q m is the BESS rated capacity, MWh.

4.5.2. Income from Increased Grid Reliability

The healthy development of the economy and society is inseparable from a stable power supply. When the power grid is out of power, the battery energy storage can output power to the grid to ensure the stability of power consumption. If a power grid failure causes a large-scale blackout failure, it will cause inevitable direct economic losses and indirect social losses. It is difficult to quantify the income brought by improving the reliability of the power grid.
Therefore, in order to facilitate the calculation, this paper indirectly represents the loss of power (the economic loss caused by power shortage and power outage) to the income from increased grid reliability [29]. In the event of a power outage, supposing that the power of the BESS fully compensates to the grid, that is, expected economic loss for each power outage ( Q s ) is equal to Q m .
Therefore, this part of the income can be expressed as follows:
I 5 = λ 1 P λ Q s = λ 1 P λ Q m
where:
  • λ 1 is the annual power outage frequency, times/year.
  • P λ is the comprehensive economic loss of the power outage per unit capacity, RMB.
  • Q s is the average power outage expected loss capacity, kWh.

4.5.3. Environmental Income

Nowadays, the realization of peak clipping is mainly completed by coal-fired power generation. The NEV’s battery second use in energy storage can effectively replace part of the peak clipping task of thermal power generation and reduce the amount of coal used to achieve environmental benefits [23,28,29,30,31]. This paper will calculate environmental income by reducing carbon dioxide emissions.
According to the Notice on Conducting Pilot Work on Carbon Emissions Trading, the total amount of carbon dioxide emissions is determined by the “tons of carbon dioxide equivalent (tCO2e)”, and it is also the most common environmental indicator used for the LCA of EVs for its simplicity and overall impact comprehension [24,63,64]. Therefore, we use tCO2e to calculate the environmental income of NEV’s battery second use in energy storage.
Moreover, China started the carbon emissions trading market in 2017, and tCO2e is equal to the power emission factor multiplied by electricity consumption. Thus, this part can be expressed as follows:
I 6 = 365 t C O 2 e P c
t C O 2 e = β Q m
where:
  • β is the electric emission factor, tons/MWh.
  • P c is the carbon trading price, RMB/tons.

4.6. Net Present Value (NPV, Part 6)

According to the analysis of the actual situation, income from postponing grid upgrades ( I 4 ) is an initial one-time income. In this paper, the battery replacement cost ( C 3 ) and the income from postponing grid upgrades ( I 4 ) are equally distributed over the operating period (L). Therefore, after NEV’s battery second use in energy storage operated for x years, NPV is:
N P V x = t = 1 x ( i = 1 i 4 6 I i + I 4 r ( 1 + r ) n 1 + r 1 C 3 r ( 1 + r ) ( 1 ( 1 ( 1 + r ) ) Δ N 1 ) C 2 ) C 1
When N P V x 0 , it means that the operation of NEV’s battery second use in energy storage is not profitable for x years.
When N P V x   =   0 , it means that NEV’s battery second use in energy storage will realize profit after x years of operation, and x year is the investment recovery period.
When N P V x 0 , it means that the accumulated profit of NEV’s battery second use is N P V x , after x years of operation.

5. Multi-Scenario Simulation

In this paper, we take the “Zhangbei (Hebei Province, China) Wind-PV-Energy Storage Demonstration Project” as an example to model the simulation and value the sensitivity analysis. The case is the crucial first project of the “Golden Sun Project” jointly launched by the State Ministry of Finance, Ministry of Science and Technology, Energy Bureau, and China State Grid Corporation. This built 500,000 kW of wind farms, 100,000 kW of PV power stations, and 110,000 kW of energy storage stations. The used battery supplier is the Xuejiadao (Qingdao, China) electric bus charge and swap station.

5.1. Data

In the BESS, the rated voltage and capacity of the battery are 38.4 V and 300 Ah, respectively. According to the project planning and construction requirements, the rated power of the system is 3 MW, the rated working time is 3 h, and the rated voltage is 10 kV. Thus, BESS rated capacity is 9 MWh.
We set each step size to 1 year in the SD model. The operating period (L) is set to 30 years (equal to the service life of the BESS). The main indicators’ data of the model are shown in Table 2.
In order to ensure the service life and energy storage efficiency of ‘NEV’s batteries, depth-of-discharge (DOD) and the capacity degradation rate are calculated according to the standards of 80% [5] and 55%, respectively. In order to reduce the construction cost, the battery energy storage power station adopts BYD’s “container” energy storage system: the rated power of a single container is 500 kW. According to the loan interest rate of the People’s Bank of China for 1~5 years in 2018, the annual interest rate is 4.9%. From 2017, industry and academia have made strong forecasts about price declines for storage, with some suggesting that battery prices could halve by 2020 [20,22]. Thus, the ratio ( θ ) of battery cost changed can be considered 50%.
Through the battery decay experiment, the average new battery capacity loss rate for each charge/discharge is 0.01%; in the installation process of the energy storage power station, the new battery does not need to be screened and consistently tested due to its good performance. Since the new battery has not declined and does not need to be filtered, thus, the selection of equipment and selection cost is 0. At the same time, according to the Ministry of Ecology and Environment of the People’s Republic of China, electric emission factor is 0.9680 (North China value), and the carbon trading price (60 RMB/ton) is calculated according to the average price of Beijing area.
According to the current status of the lithium battery market in 2018, the purchasing cost per unit capacity of a new battery is 1.2 RMB/Wh. While the purchasing cost per unit capacity of the old accounts up to 19.56% of the new one, according to Debnath, et al. [5]. Thus, we take the old battery purchase cost is 0.24 RMB/Wh (20% of the new battery purchase cost) for the convenience of calculation.

5.2. Model Simulation

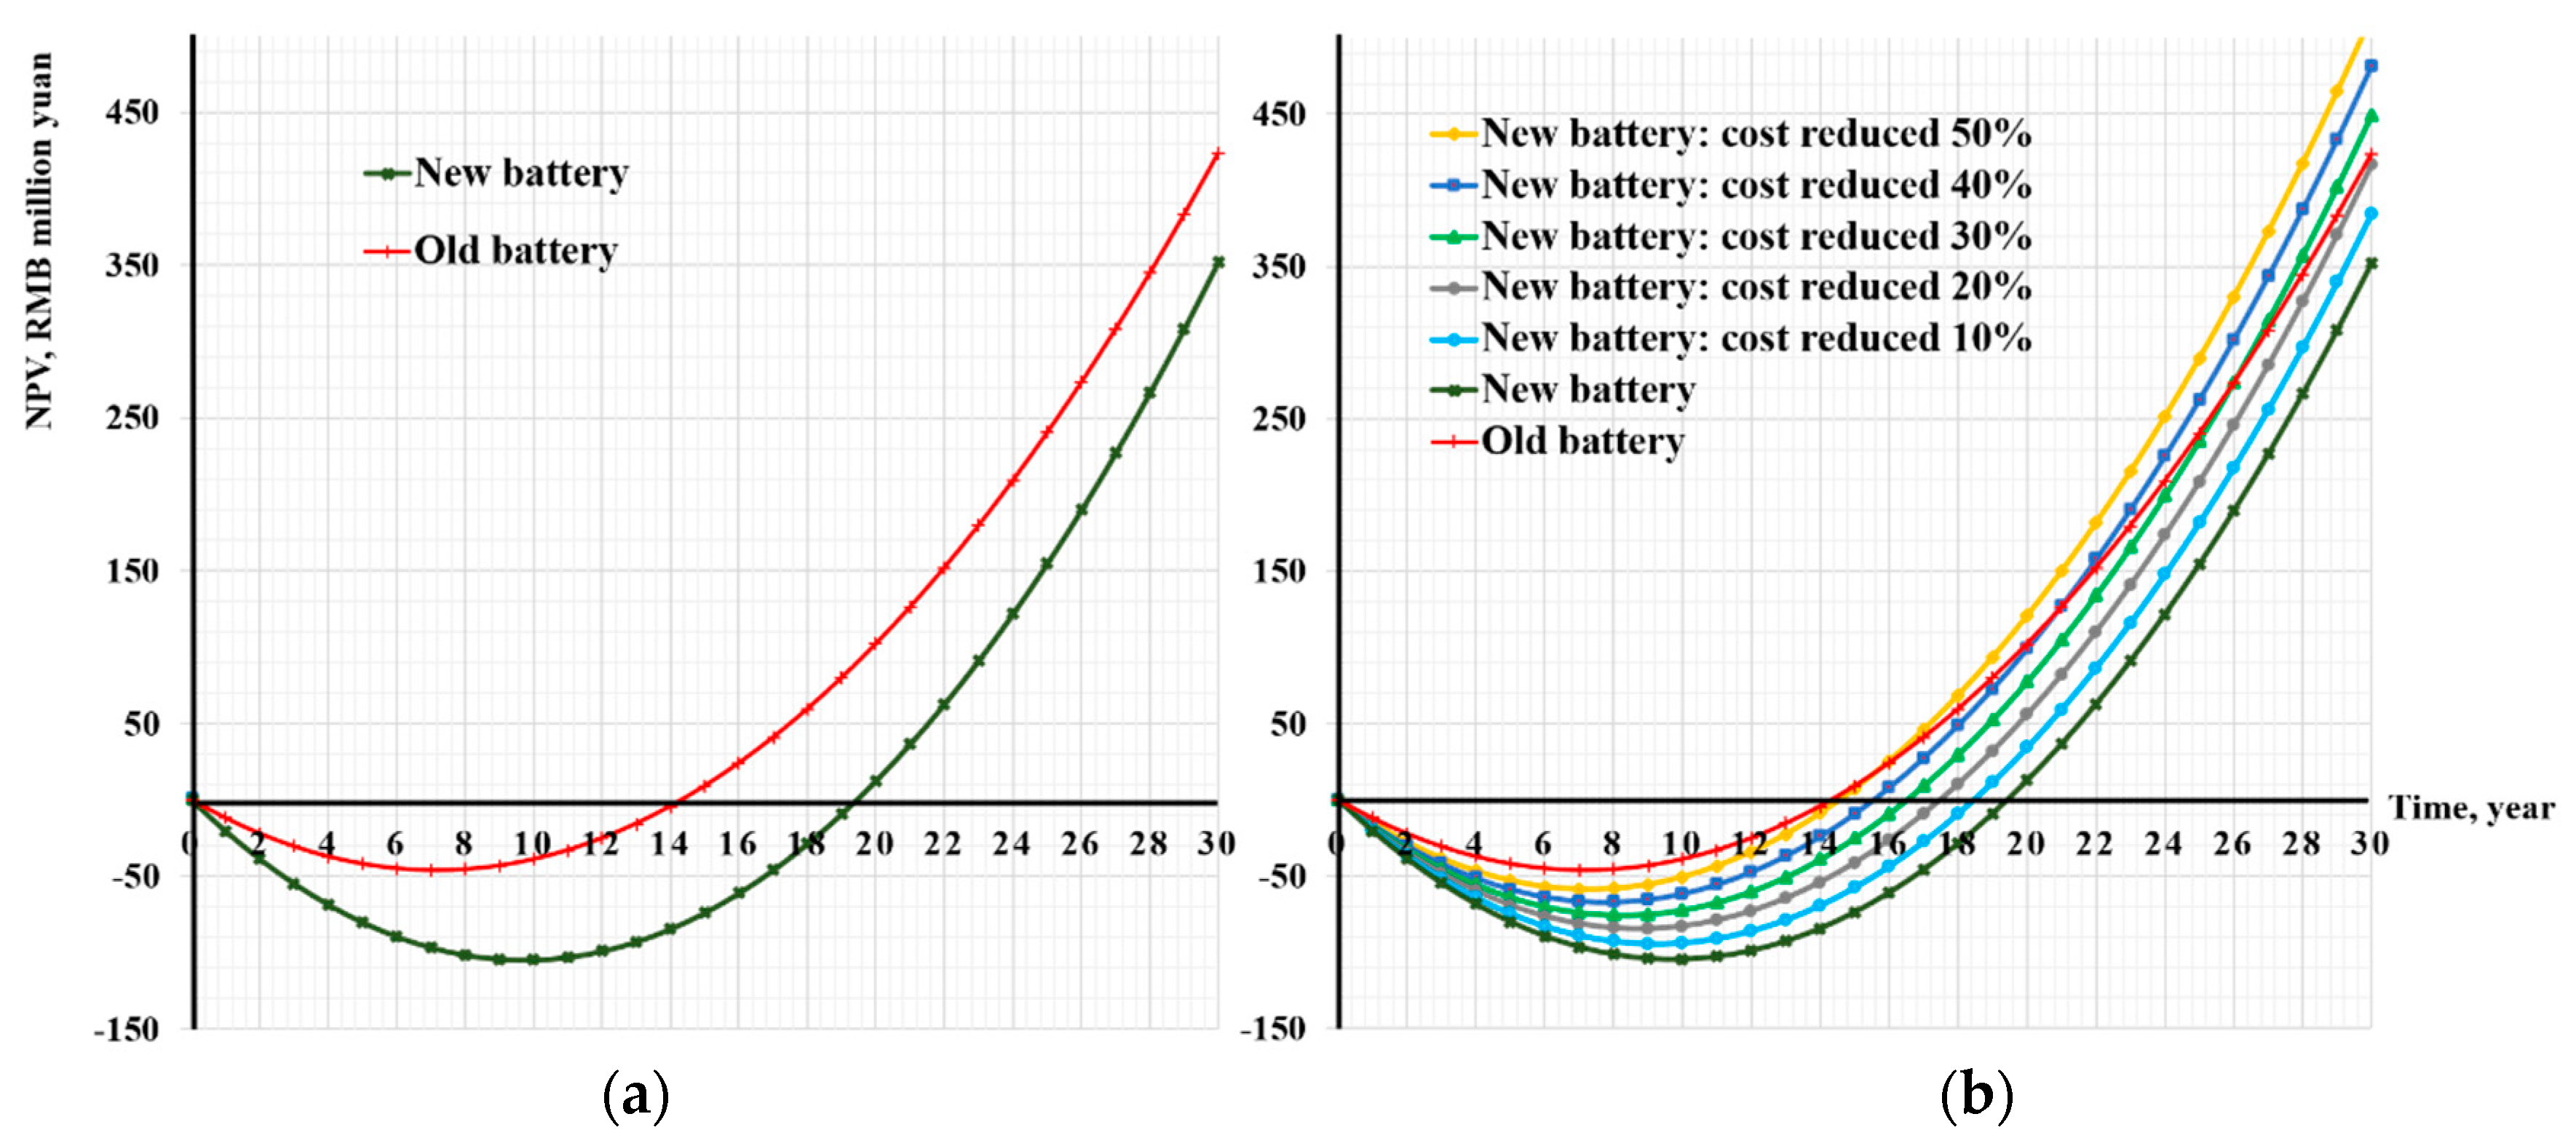
By using VENSIM software and data, we calculated Formulas (1)–(17) and obtained an NPV’s graph, as shown in Figure 6a. At the same time, with the update of technology and the use of new materials, the price of NEV’s battery will decrease year by year [20,22]. In order to clarify the economics of old battery storage in the case of a gradual decrease in the price of new batteries. We simulate the NPV trend according to the new battery price drop of 10% per year, and then compare it with the value of old battery energy storage (The red curve in Figure 6a), as shown in Figure 6b.
From Figure 6a, we know that NPV’s graph between old and new battery energy storage shows a process of “first decreasing and then increasing.” This graphic trend is because in the declining phase, although the total income growth rate is greater than the total cost growth rate, the accumulated income is insufficient to offset the initial investment cost in the current year, which in turn leads to a declining cumulative yield curve. As the operating years continue to grow, the accumulated income is enough to offset the initial investment cost, and then the curve is increasing, that is, the NPV changes from decreasing to increasing.
During the 30-year operating period, there is a big difference in the NPV between the old and new battery energy storage. Old battery energy storage can operate for 15 years to achieve profitability, while new battery energy storage requires 20 years. That is, the investment recovery period of the old battery storage energy is 5 years shorter than the new battery energy storage. As the new battery cost is reduced by 10% (Figure 6b), the investment recovery period is shortened by 1 year. Only when the price drops to 0.60 RMB/Wh (cost reduced 50%), the new battery storage and old battery energy storage have the same investment recovery period (15 years). However, the price of new batteries is hard to reduce to 50% under the current technical conditions. At the same time, the cost of the old battery will also drop.
Therefore, the NEV’s battery second use in energy storage has apparent advantages, which has not only social value, but also commercial value.

5.3. Multiple Scenario Analysis

In this part, we will analyze the value sensitivity of NEV’s battery second use in energy storage. First, we analyze the main factors affecting cost and revenue and select the critical factors for the sensitivity analysis. Second, a scenario simulation of the value is made for the sensitivity chosen part.

5.3.1. Factor Selection

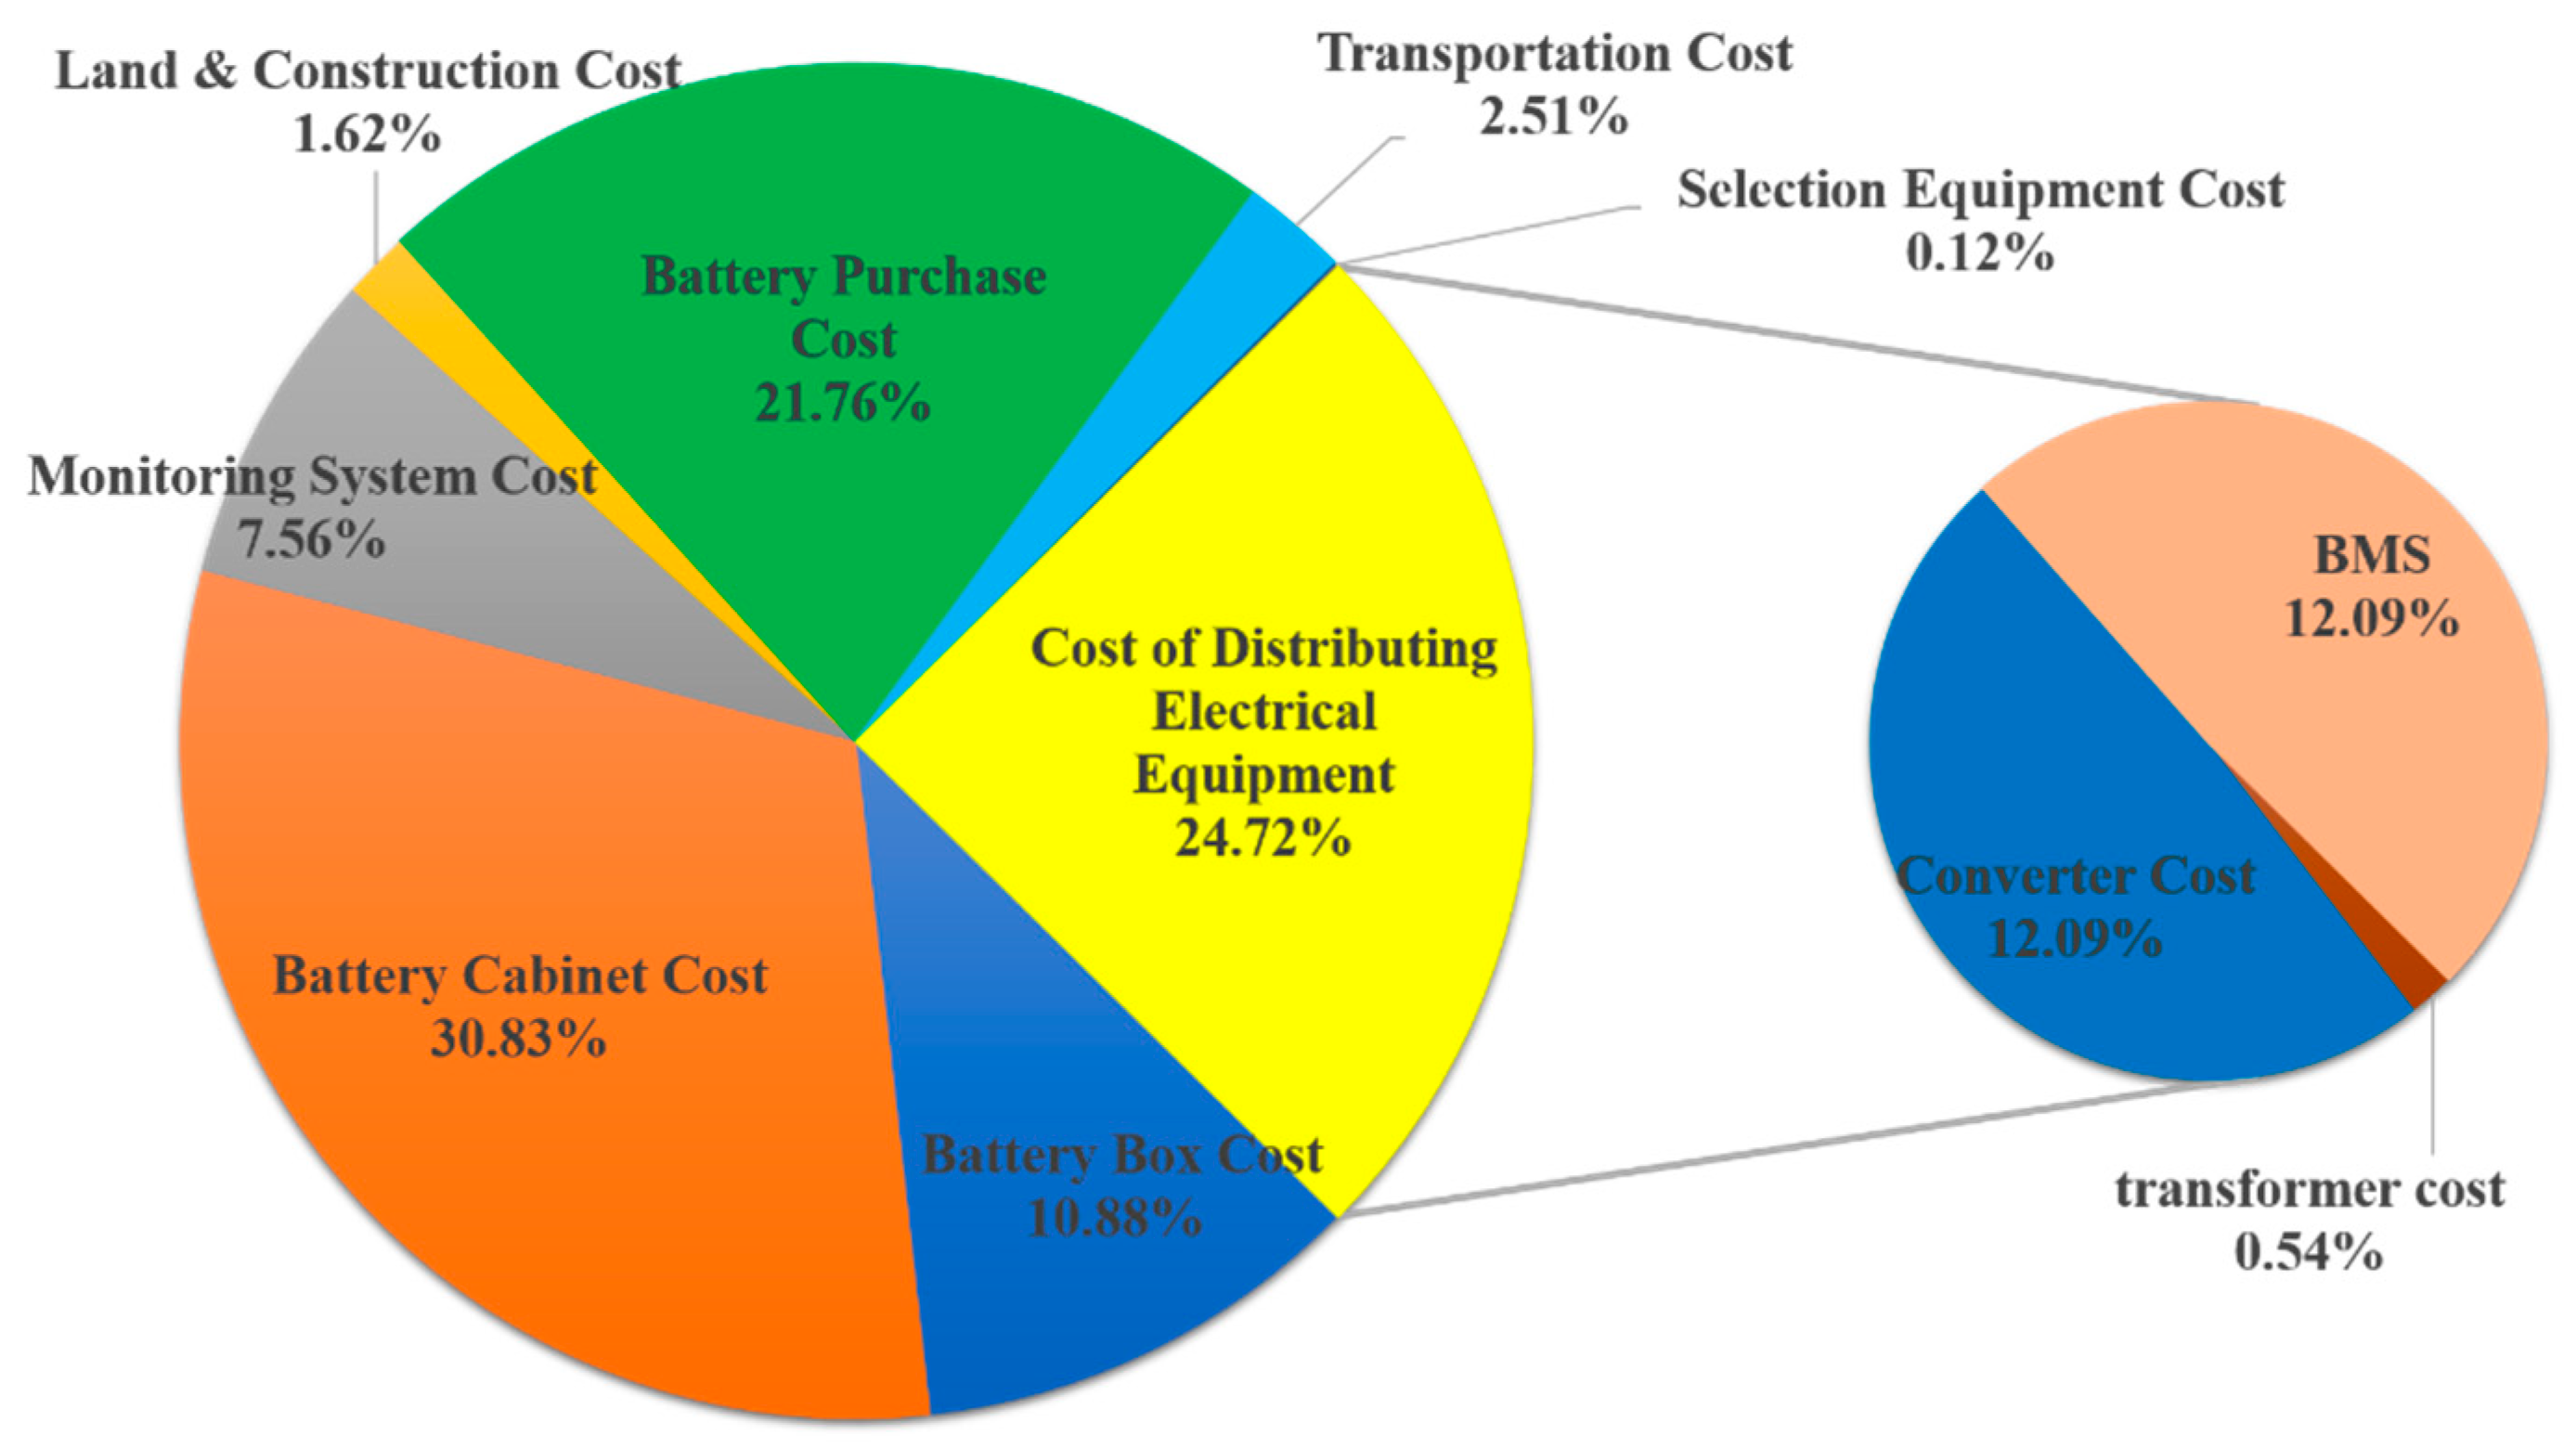
In the cost structure of the SD model, varying battery purchases cost can obviously impact the social and commercial value. The cost structure of new and old battery energy storage, the main difference being the initial investment cost; thus, we focus on the initial investment cost analysis (Figure 7 and Figure 8).
The cost structure of the old battery energy storage (Figure 7) shows that the three most influential factors are the battery cabinet (30.83%), distributing electrical equipment (24.72%), and the battery purchase cost (21.76%). Furthermore, distributing electrical equipment includes transformers, converters, and BMS. Although the battery purchase cost only accounts for 21.67%, the battery cost is more variable because it is affected by factors such as raw material supply, technological innovation, and material recovery.
Therefore, we can use the battery purchase cost as a sensitive factor in the value analysis of NEV’s battery second use in energy storage.
In the initial investment cost structure of new battery energy storage (Figure 8), there is no selection equipment cost because there is no need to select the new battery. By comparison, the three most influential factors are battery purchase cost (54.01%), battery cabinet (15.30%), and distributing electrical equipment (12.27%).
From Figure 7 and Figure 8, the battery purchase cost is the most critical factor in the analysis of battery energy storage value. Furthermore, in the future, its variability has an essential impact on the value of NEV’s battery second use in energy storage. Therefore, we choose battery purchase cost as one of the factors of value sensitivity analysis.
In the income structure, direct income includes government subsidy income, income from balancing the power network load, and residual income. They also have a great impact on the value of NEV’s battery second use in energy storage. Among the direct income, the residual income changes are small. Thus, we do not discuss its sensitivity. In China, changes in policies and the application of new energy generation have led to large uncertainties in government subsidies and electricity prices, which are highly sensitive to changes in value.
Therefore, we choose three factors to sensitivity analysis: battery purchase cost, government subsidies, and electricity price at the peak of power consumption. Moreover, we use various factors to carry out scenarios’ simulation and sensitivity analysis.

5.3.2. Scenarios Simulation

Through the above research, we know that the old battery energy storage has more significant commercial value and social value than the new battery energy storage. In order to explore the feasibility and value sensitivity of NEV’s batteries second use in energy storage, this paper only simulates the value of the old battery energy storage, just like the following scenarios.
1.
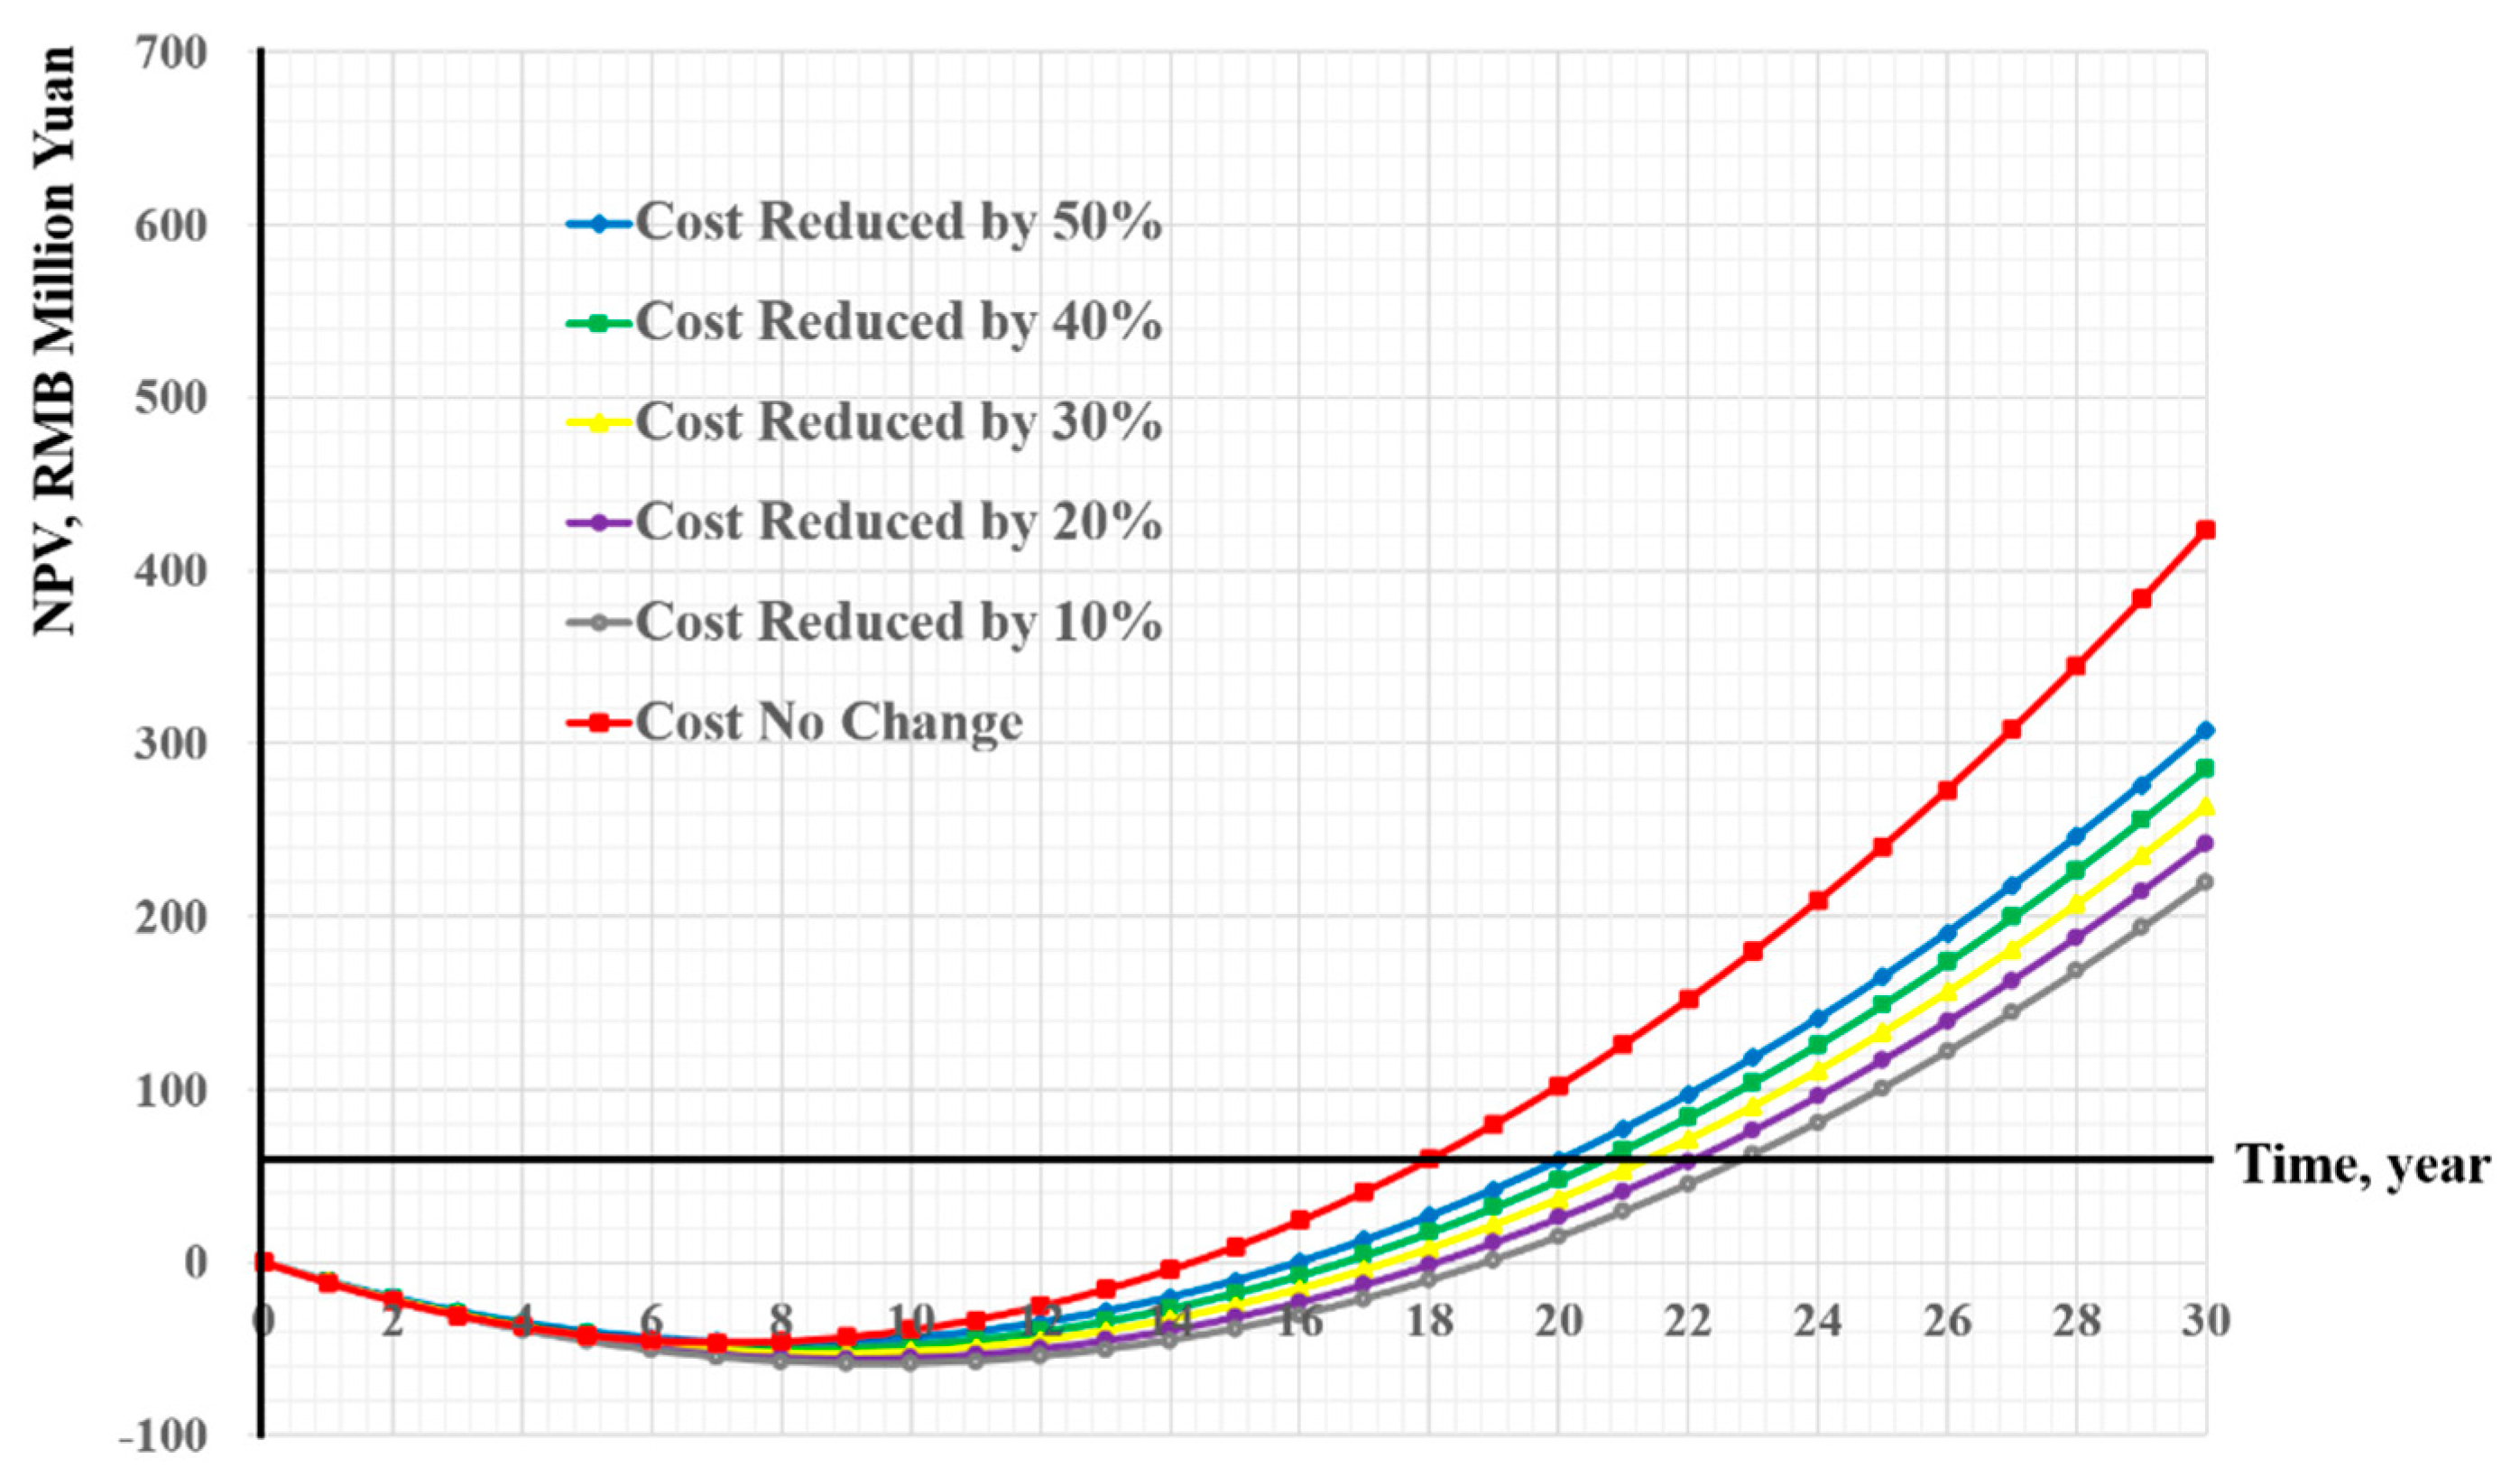
(Scenario 1) The government will no longer provide subsidies, the cost of the old battery will be reduced by 10%, and the electricity price will remain unchanged. The parameters are shown in Table 3.
Bring the data in Table 3 into the SD model, and we get NPV’s graph when the unit battery price drops without government subsidies, as shown in Figure 9.
Figure 9 shows that the payback period is reduced by about 1 year when the battery cost is reduced by 10%. When the unit capacity price drops to 120 RMB/kWh (reduced by 50%), the old battery energy storage can be profitable at 16 years, which is still lower than the initial state (red line in Figure 9).
This graphic change means that without government subsidies (in this scenario), even if the battery price falls, there is still no commercial viability.
2.
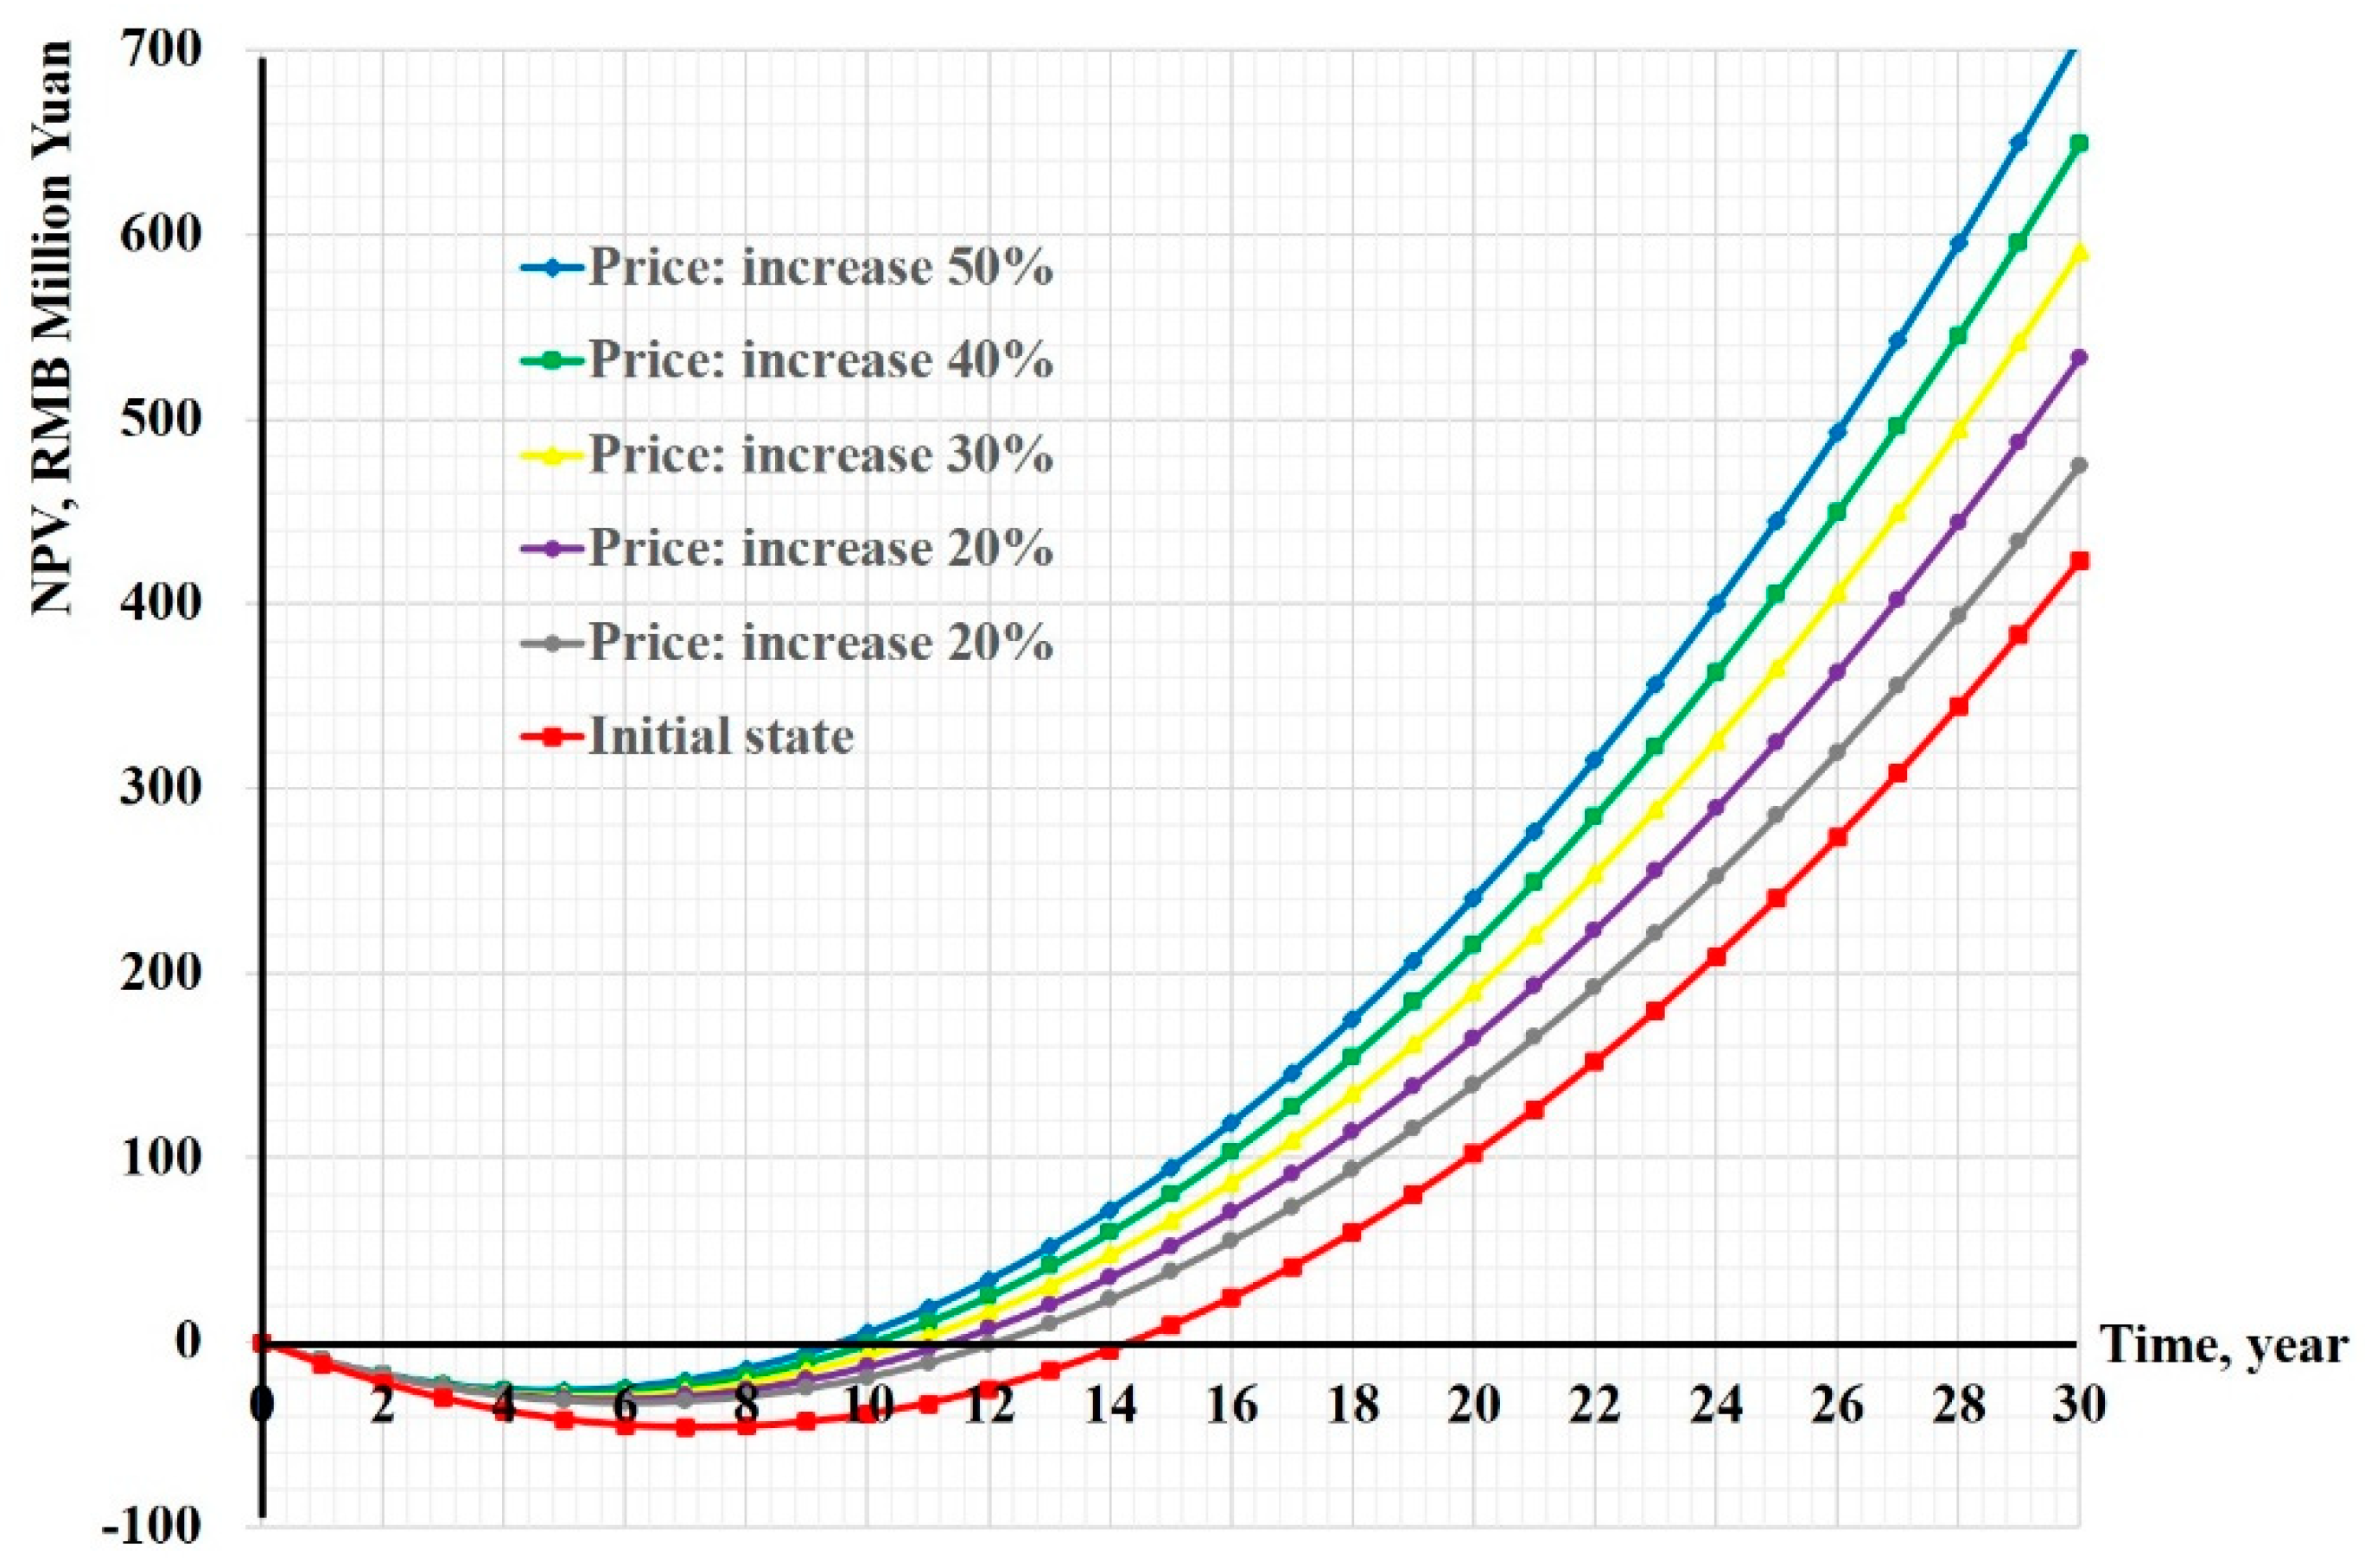
(Scenario 2) In order to encourage the market to use the electric vehicle battery for second use, the government changed the model of “providing government subsidies to related enterprises” to “no government subsidies, but old batteries are provided for free.” At the same time, the electricity price difference between the peak period and the valley period is continuously increasing.
In China, the reason for this scenario is because the supply of old batteries mainly comes from the government-controlled bus group. Due to the low utilization rate of new energy generation, the battery energy storage operator can obtain a lower on-grid price under the Feed-In Tariff.
In this paper, we use “increasing the price of electricity at the peak of electricity consumption” to indicate the increase in the electricity price difference between peak and valley period. Data are as shown in Table 4.
Bring the data in Table 4 into the SD model and calculate the NPV’s graph of the old battery energy storage, as in Figure 10.
As seen in Figure 10, the value in this scenario is obviously higher than the initial state (red line). If the government subsidy is 0 and the old battery cost is 0 as well, when the electricity price increases by 10%, which is the electricity price difference between the peak and the valley increases by 0.0427 RMB/kWh, the payback period will shorten 1 year. When the electricity price increases by 50%, the investment payback period can shorten to 10 years.
With the absence of government subsidies, if the NEV’s used battery can be obtained free of charge, this shows that once the electricity price difference between the peak and the valley increases slightly, NEV’s battery second use in energy storage will gain great commercial value and social value.
3.
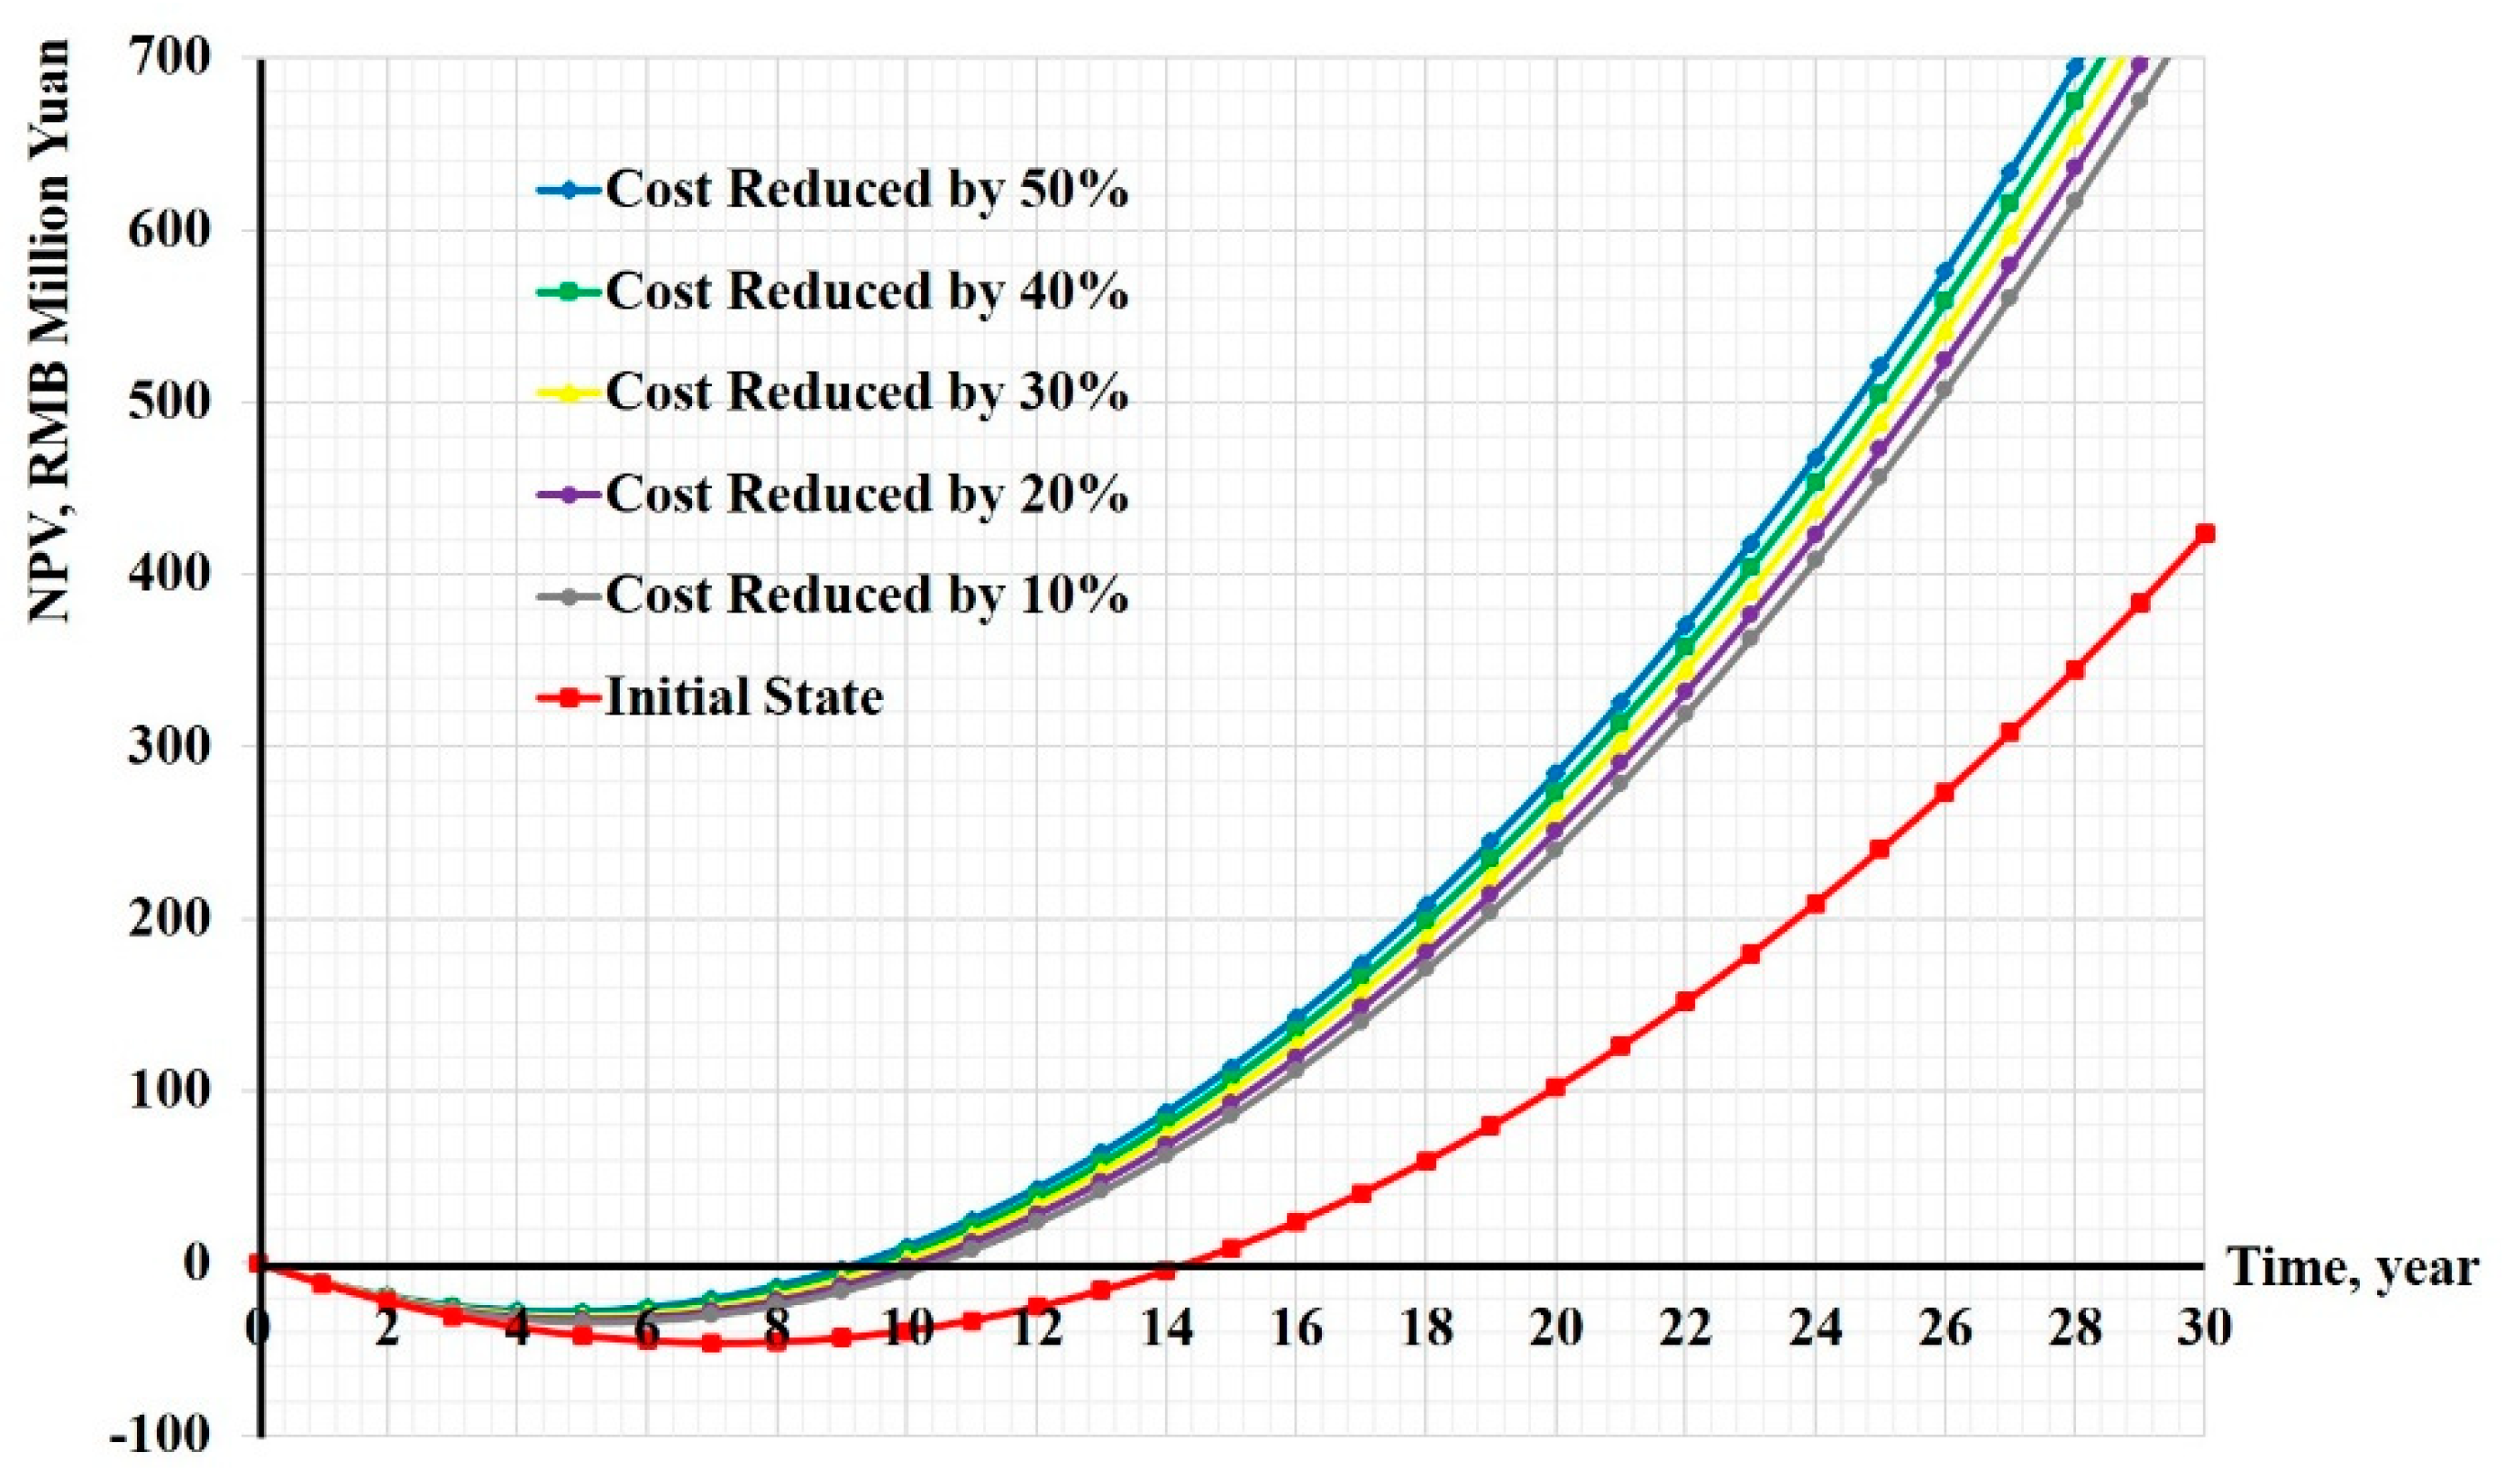
(Scenario 3) In order to increase the utilization of new energy power stations, the government no longer provides cash subsidies to battery storage (similar to scenario 2), but the battery energy storage operators can obtain electricity for free, which means the cost of purchasing electricity is zero, that is, electricity price at the valley of power consumption in the model is 0. On this basis, the battery purchase cost decreased by 10%. Data are as shown in Table 5.
Bring the data in Table 5 into the SD model and draw the NPV’s graph of the old battery energy storage, as shown in Figure 11.
Figure 11 shows that when the government replaces the cash subsidy with the free electricity price, it will achieve a more considerable investment income than the initial state (red line), and the payback period is shortened to 11 years.
At the same time, when the cost of battery purchases continues to decline, the payback period does not change much. When the battery purchase cost is reduced by 20~30%, the payback period will shorten one year. This change means that when the government does not provide cash subsidies, but promotes the combination of battery energy storage and new energy generation, the impact of changes in battery cost for the value is relatively limited. However, it also illustrates the important role of electricity prices in the value of NEV’s battery second use in energy storage.

6. Discussion and Conclusions

6.1. Discussion

In terms of battery cost, when the battery cost reduces, the value of NEV’s battery second use in the energy storage increases. On 20 February 2017, China’s Ministry of Industry and Information Technology issued the Action Plan for Promoting the Development of Automotive Power Battery Industry, which clearly states that the specific energy of EV’s battery will increase to 260 Wh/kg and the cost will drop to 1 RMB/ton by 2020. The increase in battery capacity density and the reduction in cost further increases the efficiency of NEV’s battery second use, and effectively reduces the old battery cost in BESS. Finally, changes in battery cost can significantly affect the value of NEV’s battery second use in energy storage.
In terms of government subsidies, battery energy storage is an effective method to provide auxiliary services in renewable energy generation. The economics of NEV’s battery second use in energy storage is of great significance for renewable energy generation and grid connection. The government’s policies are focusing on how to reuse NEV’s battery, which will effectively promote the orderly development of this industry. For example, the Ministry of Industry and Information of China issued the Notice on Accelerating Industrial Energy Conservation and Green Development on 29 March 2019, which pointed out that the state will focus on encouraging the development of renewable energy, and focusing on supporting the development of reuse EV’s batteries.
Furthermore, compared with battery cost and government subsidies, the change in electricity price has a greater impact on the commercial value of battery energy storage, but electricity price is a more uncertain factor. On the one hand, China’s electricity prices are under the charge of the government’s policy and management. Namely, this depends on a place’s level of economic development, resulting in different electricity prices in different regions. On the other hand, due to the large-scale construction and utilization of new energy power generation, the battery storage operators will obtain more favorable electricity prices.

6.2. Conclusions

With the gradual increase in the promotion of the new energy vehicle industry, NEV’s batteries are about to face large-scale retirement. In order to effectively improve the value of NEV’s batteries in the whole life cycle, second use in energy storage has become an important aspect.
Through the literature review, this paper systematically analyzed the commercial and social value of battery energy storage in the power generation side, power distribution side, user side, and auxiliary services. Furthermore, we sorted out the cost-benefit indicators and constructed the value analysis framework and SD model. Finally, this paper used the SD model to evaluate the value and scenarios analysis, and drew the following conclusions.
First, compared with the new battery energy storage, NEV’s battery second use in energy storage has an obvious value under the existing technical conditions. As the operating period increases, its cumulative benefit will first decline and then rise. When the operating period is less than 15 years, the cumulative benefit is under 0, which means it has no investment value. When the operating period is bigger than 15 years, the cumulative benefit is greater than 0, which means it has commercial and social value. This shows that the investment recovery period of NEV’s battery second use in energy storage is relatively long, under the existing cost structure and income model. In order to improve the commercial and social value and shorten the investment recovery period, it is necessary to explore further the main factors affecting the value from the aspects of cost structure and income model.
Moreover, through cost and income structure analysis, we selected three factors for sensitivity and scenario analysis, which are battery cost, electricity prices, and government subsidies. Through scenarios analysis, we found, on the one hand, that when the government does not provide cash subsidies, and if only the cost of the battery reduces, although reducing the cost of the battery can increase the value of NEV’s battery second use in energy storage, it will be lower overall than the initial status (Scenario 1). On the other hand, when the government tries to improve the efficiency of the use of new energy power stations and change the form of government subsidies: ① the government provides a free battery to replace the cash subsidy. In this case, when the electricity price changes slightly, it can achieve greater economic and social value (Scenario 2); ② the government provides electricity to the battery storage energy free of charge, that is, the battery energy storage operator can obtain electricity for free. In this case, the second value of NEV battery energy storage will also increase significantly (Scenario 3). Thus, we know that government subsidies have a relatively large impact on the value of NEV battery energy storage. However, if the government uses a non-cash subsidies strategy, there might be a better promotion for the development of the industry.
Based on the results of multi-scenario simulations, we know that the government can introduce more flexible policies, not just cash subsidies. Since NEV‘s battery energy storage is still in the early stages of industrial development, and enterprises are less enthusiastic about purchasing NEV batteries for secondary energy storage, the government can increase the enthusiasm of enterprises to participate by combining free battery and reducing electricity prices. At the same time, the second use of NEV’s battery has obvious environmental and social benefits. The government can introduce green financial policies, such as combining carbon credit policies, to motivate enterprises and to provide advantageous technology companies and demonstration enterprises with the necessary financial support and protection.
Therefore, in order to improve the value of NEV’s battery second use in energy storage, it is not only possible to strengthen the technology research and development, optimize the industrial structure, and so forth, but also to combine the use of new energy power generation and change the form of government subsidies [35]. In summary, we can comprehensively consider the cost-income structure, business model, government policies, and other perspectives to increase the second use value of NEV‘s battery for energy storage.
From the perspective of cost-income structure, when battery energy storage is applied to the power generation side, it can increase the local consumption rate of renewable energy and improve the operating efficiency of energy production systems. When the battery energy storage is applied to the power supply side, it can optimize the operation mode of the energy supply equipment and achieve the optimal local deployment of power energy, thereby reducing the cost of power purchase and increasing the service life of the power equipment. When battery energy storage is applied to the user side, it can provide multi-energy complementary electric power solutions, and finally, build a new energy ecosystem with energy storage as the core, multi-energy deployment, and Internet services as the supplement. According to different scenarios, the second use of energy storage by NEV batteries forms a comprehensive benefit over the entire life cycle.
From the perspective of business model, the second use of ‘NEV‘s battery for energy storage is still in the early stages of the industry. In policy-driven China, when the market, policies, and industrial chain are not complete, the government can formulate more flexibility policies in terms of cost structure and income structure. The analysis shows that there are many stakeholders involved in battery energy storage, and enterprises in different market segments have different key resources, which results in different profit models. Therefore, we can systematically analyze the factors affecting the business model, that is, analyze the market players, value proposition, key resource capabilities, customer segmentation, customer relationships, key business and profit models of NEV’s battery second use in energy storage, and finally, propose innovative business development mode.
From the perspective of government policies, in order to promote the market-oriented development of NEV’s battery second use in energy storage, the government needs to establish a good business environment for investors and service providers. Moreover, the policy should be based on the national development plan and industrial scale to guide the rational increase in market volume. At the same time, the government should handle the relationship between policy coercion and market freedom, improve the flexibility of market development, and establish a policy system that is more integrated with market mechanisms.
Among them, the green financial policy, as an essential aspect of government policy, has positive reference significance for the development of NEV’s battery second use in the energy storage industry. For example, the government can provide policies in various ways, such as granting particular loans, reducing financing interest, and exempting taxes, according to the characteristics of low industrial investment return and strong public welfare. Nowadays, “financing difficulties” is a crucial issue hindering the development of China’s NEV battery energy storage. The value of China’s NEV battery second use in energy storage is greatly affected by policies, and the financing subject is mostly individuals or small enterprises. Therefore, financial institutions generally consider such projects to have large policy changes and financial risks, and are unwilling or rarely launch related credit products.
On the one hand, the government should accelerate the improvement of NEV’s battery second use in energy storage to reduce the dependence on policy subsidies and resolve the risk of policy changes. At the same time, we can learn from advanced international policy experience and introduce a variety of guarantee mechanisms and incentive policies that are easy for the market to operate. For example, the United States has proposed tax credit policies and accelerated cost depreciation policies, in order to promote the development of the photovoltaic industry. It provides investors with an interest-free loan, which is equivalent to allowing investors to get more tax relief in the early stage of the project, thereby reducing the investment risk, and generating a variety of innovative business models.
On the other hand, the government should construct and improve the “green guarantee” mechanism to increase investors’ confidence, share bank risks for enterprises, and finally, achieve optimal allocation of resources. Battery energy storage is a veritable “green industry”. It is an effective way to solve the reuse of NEV’s battery and has good environmental benefits. The establishment of a green guarantee mechanism should also allow financial institutions to adopt diversified operating methods to fully mobilize the vitality of various parts of the green financial market. At the same time, it is possible to promote the industrialization of NEV’s battery second use in the energy storage industry by issuing green bonds. Through green bonds, the government can vigorously encourage the construction of NEV’s battery reuse in energy storage projects, and use the market’s feedback mechanism to encourage enterprises to invest in the battery energy storage industry and increase their initiative.
Through cost-income structure, business model innovation, policy encouragement, and green financial support, NEV’s battery second use in energy storage industry can explore four dimensions of industrial development, including government support, business models, financial service models, and battery energy storage companies. The deep integration of each dimension with the entire industrial chain and the entire life cycle of NEV’s battery second use in energy storage industry will significantly promote the innovative development of NEV’s battery energy storage throughout the life cycle.
Only in this way, the comprehensive application of various means can promote the integrated development of EV’s batteries in the whole life cycle. However, the changes in battery cost, the uncertainty of government subsidy policy, the robustness of BMS, the capacity of the used battery and other technical problems (load peak, unpredictability of renewable energies, faults in the network, ancillary services, safety, insurance cost, and so forth) [40] still limit the accurate judgment of the value of NEV’s battery second use in energy storage. In the future, we can comprehensively consider various factors such as battery disassembly and recovery, remaining life prediction, battery grouping, and grouping technology, industrial chain integration, and business model innovation. With the continued advancement of Made in China 2025 and the Thirteenth Five-Year Plan for Renewable Energy Development, the prospect of NEV’s battery second use in energy storage will be even brighter.

Author Contributions

All authors contributed equally to this research. All authors have read and agreed to the published version of the manuscript.

Funding

This research was funded by the National Social Science Fund of China, grant number 16AGL004.

Conflicts of Interest

The authors declare no conflict of interest.

References

  1. Tiba, S.; Omri, A. Literature survey on the relationships between energy, environment and economic growth. Renew. Sustain. Energy Rev. 2017, 69, 1129–1146. [Google Scholar] [CrossRef]
  2. Lin, B.; Ouyang, X. Energy demand in China: Comparison of characteristics between the US and China in rapid urbanization stage. Energy Convers. Manag. 2014, 79, 128–139. [Google Scholar] [CrossRef]
  3. Tang, Y.; Zhang, Q.; Li, Y.; Wang, G.; Li, Y. Recycling mechanisms and policy suggestions for spent electric vehicles’ power battery—A case of Beijing. J. Clean Prod. 2018, 186, 388–406. [Google Scholar] [CrossRef]
  4. Podias, A.; Pfrang, A.; Di Persio, F.; Kriston, A.; Bobba, S.; Mathieux, F.; Messagie, M.; Boon-Brett, L. Sustainability Assessment of Second Use Applications of Automotive Batteries: Ageing of Li-Ion Battery Cells in Automotive and Grid-Scale Applications. World Electr. Veh. J. 2018, 9, 24. [Google Scholar] [CrossRef] [Green Version]
  5. Debnath, U.K.; Ahmad, I.; Habibi, D. Quantifying economic benefits of second life batteries of gridable vehicles in the smart grid. Int. J. Electr. Power 2014, 63, 577–587. [Google Scholar] [CrossRef]
  6. Neubauer, J.; Pesaran, A. The ability of battery second use strategies to impact plug-in electric vehicle prices and serve utility energy storage applications. J. Power Sources 2011, 196, 10351–10358. [Google Scholar] [CrossRef]
  7. Heymans, C.; Walker, S.B.; Young, S.B.; Fowler, M. Economic analysis of second use electric vehicle batteries for residential energy storage and load-levelling. Energy Policy 2014, 71, 22–30. [Google Scholar] [CrossRef]
  8. Gallo, A.B.; Simões-Moreira, J.R.; Costa, H.K.M.; Santos, M.M.; Moutinho Dos Santos, E. Energy storage in the energy transition context: A technology review. Renew. Sustain. Energy Rev. 2016, 65, 800–822. [Google Scholar] [CrossRef]
  9. Weimer, L.; Braun, T.; Hemdt, A.V. Design of a systematic value chain for lithium-ion batteries from the raw material perspective. Resour. Policy 2019, 64, 101473. [Google Scholar] [CrossRef]
  10. Bobba, S.; Mathieux, F.; Blengini, G.A. How will second-use of batteries affect stocks and flows in the EU? A model for traction Li-ion batteries. Resour. Conserv. Recycl. 2019, 145, 279–291. [Google Scholar] [CrossRef]
  11. Gu, X.; Ieromonachou, P.; Zhou, L.; Tseng, M. Developing pricing strategy to optimise total profits in an electric vehicle battery closed loop supply chain. J. Clean Prod. 2018, 203, 376–385. [Google Scholar] [CrossRef]
  12. Martin, G.; Rentsch, L.; Höck, M.; Bertau, M. Lithium market research—Global supply, future demand and price development. Energy Storage Mater. 2017, 6, 171–179. [Google Scholar] [CrossRef]
  13. Liu, D.; Xiao, B. Exploring the development of electric vehicles under policy incentives: A scenario-based system dynamics model. Energy Policy 2018, 120, 8–23. [Google Scholar] [CrossRef]
  14. Zakeri, B.; Syri, S. Electrical energy storage systems: A comparative life cycle cost analysis. Renew. Sustain. Energy Rev. 2015, 42, 569–596. [Google Scholar] [CrossRef]
  15. Winfield, M.; Shokrzadeh, S.; Jones, A. Energy policy regime change and advanced energy storage: A comparative analysis. Energy Policy 2018, 115, 572–583. [Google Scholar] [CrossRef]
  16. Zheng, M.; Wang, X.; Meinrenken, C.J.; Ding, Y. Economic and environmental benefits of coordinating dispatch among distributed electricity storage. Appl. Energy 2018, 210, 842–855. [Google Scholar] [CrossRef]
  17. Escalante Soberanis, M.A.; Mithrush, T.; Bassam, A.; Mérida, W. A sensitivity analysis to determine technical and economic feasibility of energy storage systems implementation: A flow battery case study. Renew. Energy 2018, 115, 547–557. [Google Scholar] [CrossRef]
  18. Newbery, D. Shifting demand and supply over time and space to manage intermittent generation: The economics of electrical storage. Energy Policy 2018, 113, 711–720. [Google Scholar] [CrossRef]
  19. Sidhu, A.S.; Pollitt, M.G.; Anaya, K.L. A social cost benefit analysis of grid-scale electrical energy storage projects: A case study. Appl. Energy 2018, 212, 881–894. [Google Scholar] [CrossRef]
  20. Heredia, F.J.; Cuadrado, M.D.; Corchero, C. On optimal participation in the electricity markets of wind power plants with battery energy storage systems. Comput. Oper. Res. 2018, 96, 316–329. [Google Scholar] [CrossRef] [Green Version]
  21. Atherton, J.; Sharma, R.; Salgado, J. Techno-economic analysis of energy storage systems for application in wind farms. Energy 2017, 135, 540–552. [Google Scholar] [CrossRef] [Green Version]
  22. Agnew, S.; Dargusch, P. Consumer preferences for household-level battery energy storage. Renew. Sustain. Energy Rev. 2017, 75, 609–617. [Google Scholar] [CrossRef]
  23. McKenna, E.; McManus, M.; Cooper, S.; Thomson, M. Economic and environmental impact of lead-acid batteries in grid-connected domestic PV systems. Appl. Energy 2013, 104, 239–249. [Google Scholar] [CrossRef] [Green Version]
  24. Hawkins, T.R.; Gausen, O.M.; Strømman, A.H. Environmental impacts of hybrid and electric vehicles—A review. Int. J. Life Cycle Assess. 2012, 17, 997–1014. [Google Scholar] [CrossRef]
  25. Lei, Z.; Yingqi, L.; Li, Z.; Beibei, P. Commercial Value of Power Battery Echelon Utilization in China’s Energy Storage Industry. J. Beijing Inst. Technol. (Soc. Sci. Ed.) 2018, 20, 34–44. [Google Scholar]
  26. Dufo-López, R.; Bernal-Agustín, J.L. Techno-economic analysis of grid-connected battery storage. Energy Convers. Manag. 2015, 91, 394–404. [Google Scholar] [CrossRef]
  27. Yingqi, L.; Suxiu, L.; Lei, Z.; Jingyu, W. Characteristics and Application Prospects of Second Use Batteries for Energy Storage. Sci. Technol. Manag. Res. 2017, 37, 59–65. [Google Scholar]
  28. Stenzel, P.; Koj, J.C.; Schreiber, A.; Hennings, W.; Zapp, P. Primary control provided by large-scale battery energy storage systems or fossil power plants in Germany and related environmental impacts. J. Energy Storage 2016, 8, 300–310. [Google Scholar] [CrossRef]
  29. Ahmadi, L.; Yip, A.; Fowler, M.; Young, S.B.; Fraser, R.A. Environmental feasibility of re-use of electric vehicle batteries. Sustain. Energy Technol. Assess. 2014, 6, 64–74. [Google Scholar] [CrossRef]
  30. Mahlia, T.M.I.; Saktisahdan, T.J.; Jannifar, A.; Hasan, M.H.; Matseelar, H.S.C. A review of available methods and development on energy storage; technology update. Renew. Sustain. Energy Rev. 2014, 33, 532–545. [Google Scholar] [CrossRef]
  31. Akorede, M.F.; Hizam, H.; Pouresmaeil, E. Distributed energy resources and benefits to the environment. Renew. Sustain. Energy Rev. 2010, 14, 724–734. [Google Scholar] [CrossRef]
  32. Li, X.; Chalvatzis, K.; Stephanides, P. Innovative Energy Islands: Life-Cycle Cost-Benefit Analysis for Battery Energy Storage. Sustainability 2018, 10, 3371. [Google Scholar] [CrossRef] [Green Version]
  33. Han, X.; Liang, Y.; Ai, Y.; Li, J. Economic evaluation of a PV combined energy storage charging station based on cost estimation of second-use batteries. Energy 2018, 165, 326–339. [Google Scholar] [CrossRef]
  34. Wang, Y.; Liu, S.; Nian, V.; Li, X.; Yuan, J. Life cycle cost-benefit analysis of refrigerant replacement based on experience from a supermarket project. Energy 2019, 187, 115918. [Google Scholar] [CrossRef]
  35. Reinhardt, R.; Christodoulou, I.; Gassó-Domingo, S.; Amante García, B. Towards sustainable business models for electric vehicle battery second use: A critical review. J. Environ. Manag. 2019, 245, 432–446. [Google Scholar] [CrossRef]
  36. Mahmoud, T.S.; Ahmed, B.S.; Hassan, M.Y. The role of intelligent generation control algorithms in optimizing battery energy storage systems size in microgrids: A case study from Western Australia. Energy Convers. Manag. 2019, 196, 1335–1352. [Google Scholar] [CrossRef]
  37. Casals, L.C.; Amante García, B.; Canal, C. Second life batteries lifespan: Rest of useful life and environmental analysis. J. Environ. Manag. 2019, 232, 354–363. [Google Scholar] [CrossRef]
  38. Gur, K.; Chatzikyriakou, D.; Baschet, C.; Salomon, M. The reuse of electrified vehicle batteries as a means of integrating renewable energy into the European electricity grid: A policy and market analysis. Energy Policy 2018, 113, 535–545. [Google Scholar] [CrossRef]
  39. Ma, T.; Yang, H.; Lu, L. Feasibility study and economic analysis of pumped hydro storage and battery storage for a renewable energy powered island. Energy Convers. Manag. 2014, 79, 387–397. [Google Scholar] [CrossRef]
  40. Chen, C.; Duan, S.; Cai, T.; Liu, B.; Hu, G. Optimal Allocation and Economic Analysis of Energy Storage System in Microgrids. IEEE Trans. Power Electr. 2011, 26, 2762–2773. [Google Scholar]
  41. Ma, T.; Yang, H.; Lu, L. A feasibility study of a stand-alone hybrid solar–wind–battery system for a remote island. Appl. Energy 2014, 121, 149–158. [Google Scholar] [CrossRef]
  42. Laurischkat, K.; Jandt, D. Techno-economic analysis of sustainable mobility and energy solutions consisting of electric vehicles, photovoltaic systems and battery storages. J. Clean Prod. 2018, 179, 642–661. [Google Scholar] [CrossRef]
  43. Lin, B.; Wu, W. Economic viability of battery energy storage and grid strategy: A special case of China electricity market. Energy 2017, 124, 423–434. [Google Scholar] [CrossRef]
  44. Gandhi, O.; Rodríguez-Gallegos, C.D.; Zhang, W.; Srinivasan, D.; Reindl, T. Economic and technical analysis of reactive power provision from distributed energy resources in microgrids. Appl. Energy 2018, 210, 827–841. [Google Scholar] [CrossRef]
  45. Tong, S.; Fung, T.; Klein, M.P.; Weisbach, D.A.; Park, J.W. Demonstration of reusing electric vehicle battery for solar energy storage and demand side management. J. Energy Storage 2017, 11, 200–210. [Google Scholar] [CrossRef]
  46. Richa, K.; Babbitt, C.W.; Gaustad, G. Eco-Efficiency Analysis of a Lithium-Ion Battery Waste Hierarchy Inspired by Circular Economy. J. Ind. Ecol. 2017, 21, 715–730. [Google Scholar] [CrossRef]
  47. Halabi, L.M.; Mekhilef, S.; Olatomiwa, L.; Hazelton, J. Performance analysis of hybrid PV/diesel/battery system using HOMER: A case study Sabah, Malaysia. Energy Convers. Manag. 2017, 144, 322–339. [Google Scholar] [CrossRef]
  48. Hittinger, E.; Wiley, T.; Kluza, J.; Whitacre, J. Evaluating the value of batteries in microgrid electricity systems using an improved Energy Systems Model. Energy Convers. Manag. 2015, 89, 458–472. [Google Scholar] [CrossRef] [Green Version]
  49. May, G.J.; Davidson, A.; Monahov, B. Lead batteries for utility energy storage: A review. J. Energy Storage 2018, 15, 145–157. [Google Scholar] [CrossRef]
  50. Li, J.; Xiong, R.; Mu, H.; Cornélusse, B.; Vanderbemden, P.; Ernst, D.; Yuan, W. Design and real-time test of a hybrid energy storage system in the microgrid with the benefit of improving the battery lifetime. Appl. Energy 2018, 218, 470–478. [Google Scholar] [CrossRef] [Green Version]
  51. Cortés, P.; Muñuzuri, J.; Berrocal-de-O, M.; Domínguez, I. Genetic algorithms to optimize the operating costs of electricity and heating networks in buildings considering distributed energy generation and storage. Comput. Oper. Res. 2018, 96, 157–172. [Google Scholar] [CrossRef]
  52. Bahmani-Firouzi, B.; Azizipanah-Abarghooee, R. Optimal sizing of battery energy storage for micro-grid operation management using a new improved bat algorithm. Int. J. Electr. Power 2014, 56, 42–54. [Google Scholar] [CrossRef]
  53. Khodayari, M.; Aslani, A. Analysis of the energy storage technology using Hype Cycle approach. Sustain. Energy Technol. Assess. 2018, 25, 60–74. [Google Scholar] [CrossRef]
  54. Feng, Y.Y.; Chen, S.Q.; Zhang, L.X. System dynamics modeling for urban energy consumption and CO2 emissions: A case study of Beijing, China. Ecol. Model. 2013, 252, 44–52. [Google Scholar] [CrossRef]
  55. Xing, L.; Xue, M.; Hu, M. Dynamic simulation and assessment of the coupling coordination degree of the economy–resource–environment system: Case of Wuhan City in China. J. Environ. Manag. 2019, 230, 474–487. [Google Scholar] [CrossRef] [PubMed]
  56. Honti, G.; Dörgő, G.; Abonyi, J. Review and structural analysis of system dynamics models in sustainability science. J. Clean Prod. 2019, 240, 118015. [Google Scholar] [CrossRef]
  57. Yang, W.; Zhou, H.; Liu, J.; Dai, S.; Ma, Z.; Liu, Y. Market evolution modeling for electric vehicles based on system dynamics and multi-agents. In Proceedings of the International Symposium on Smart Electric Distribution Systems and Technologies (EDST), Vienna, Austria, 8–11 September 2015; IEEE: Piscataway, NJ, USA, 2015; pp. 133–138. [Google Scholar]
  58. Onat, N.C.; Kucukvar, M.; Tatari, O.; Egilmez, G. Integration of system dynamics approach toward deepening and broadening the life cycle sustainability assessment framework: A case for electric vehicles. Int. J. Life Cycle Assess. 2016, 21, 1009–1034. [Google Scholar] [CrossRef]
  59. Sverdrup, H.U.; Ragnarsdottir, K.V. A system dynamics model for platinum group metal supply, market price, depletion of extractable amounts, ore grade, recycling and stocks-in-use. Resour. Conserv. Recycl. 2016, 114, 130–152. [Google Scholar] [CrossRef]
  60. Yan, J.; Lai, F.; Liu, Y.; Yu, D.C.; Yi, W.; Yan, J. Multi-stage transport and logistic optimization for the mobilized and distributed battery. Energy Convers. Manag. 2019, 196, 261–276. [Google Scholar] [CrossRef]
  61. Gaines, L. Lithium-ion battery recycling processes: Research towards a sustainable course. Sustain. Mater. Technol. 2018, 17, e00068. [Google Scholar] [CrossRef]
  62. Dong, H.; Zheng, Y.; Yiqun, S.; Qiang, S.; Yibin, Z. Dynamic Assessment Method for Smart Grid Based on System Dynamics. Autom. Electr. Power Syst. 2012, 36, 16–21. [Google Scholar]
  63. Casals, L.C.; García, B.A.; Aguesse, F.; Iturrondobeitia, A. Second life of electric vehicle batteries: Relation between materials degradation and environmental impact. Int. J. Life Cycle Assess. 2017, 22, 82–93. [Google Scholar] [CrossRef]
  64. Zhang, J.; Zhang, Y.; Yang, Z.; Fath, B.D.; Li, S. Estimation of energy-related carbon emissions in Beijing and factor decomposition analysis. Ecol. Model. 2013, 252, 258–265. [Google Scholar] [CrossRef]
  65. Rui, L. The Study on Economics Evaluation of Distribution System Reliability with Consideration of Important Power Users. Master’s Thesis, China Elevtric Power Research Institute, Beijing, China, July 2010. [Google Scholar]
  66. Hu, S.; Jun, L.; Yuguang, W.; Ruifang, Z.; Yingjie, Z. Assessment of the Economic Value of the Energy Storage Battery Systems. J. Shang Univ. Electr. Power 2013, 29, 315–320. [Google Scholar]
  67. Jinguo, Z.; Dongsheng, J.; Xiaojun, W.; Jie, Z.; Jinghan, H.; Chao, G. Analysis on Economic Operation of Energy Storage Based on Sencond-Use Batteries. Power Syst. Technol. 2014, 38, 2551–2555. [Google Scholar]
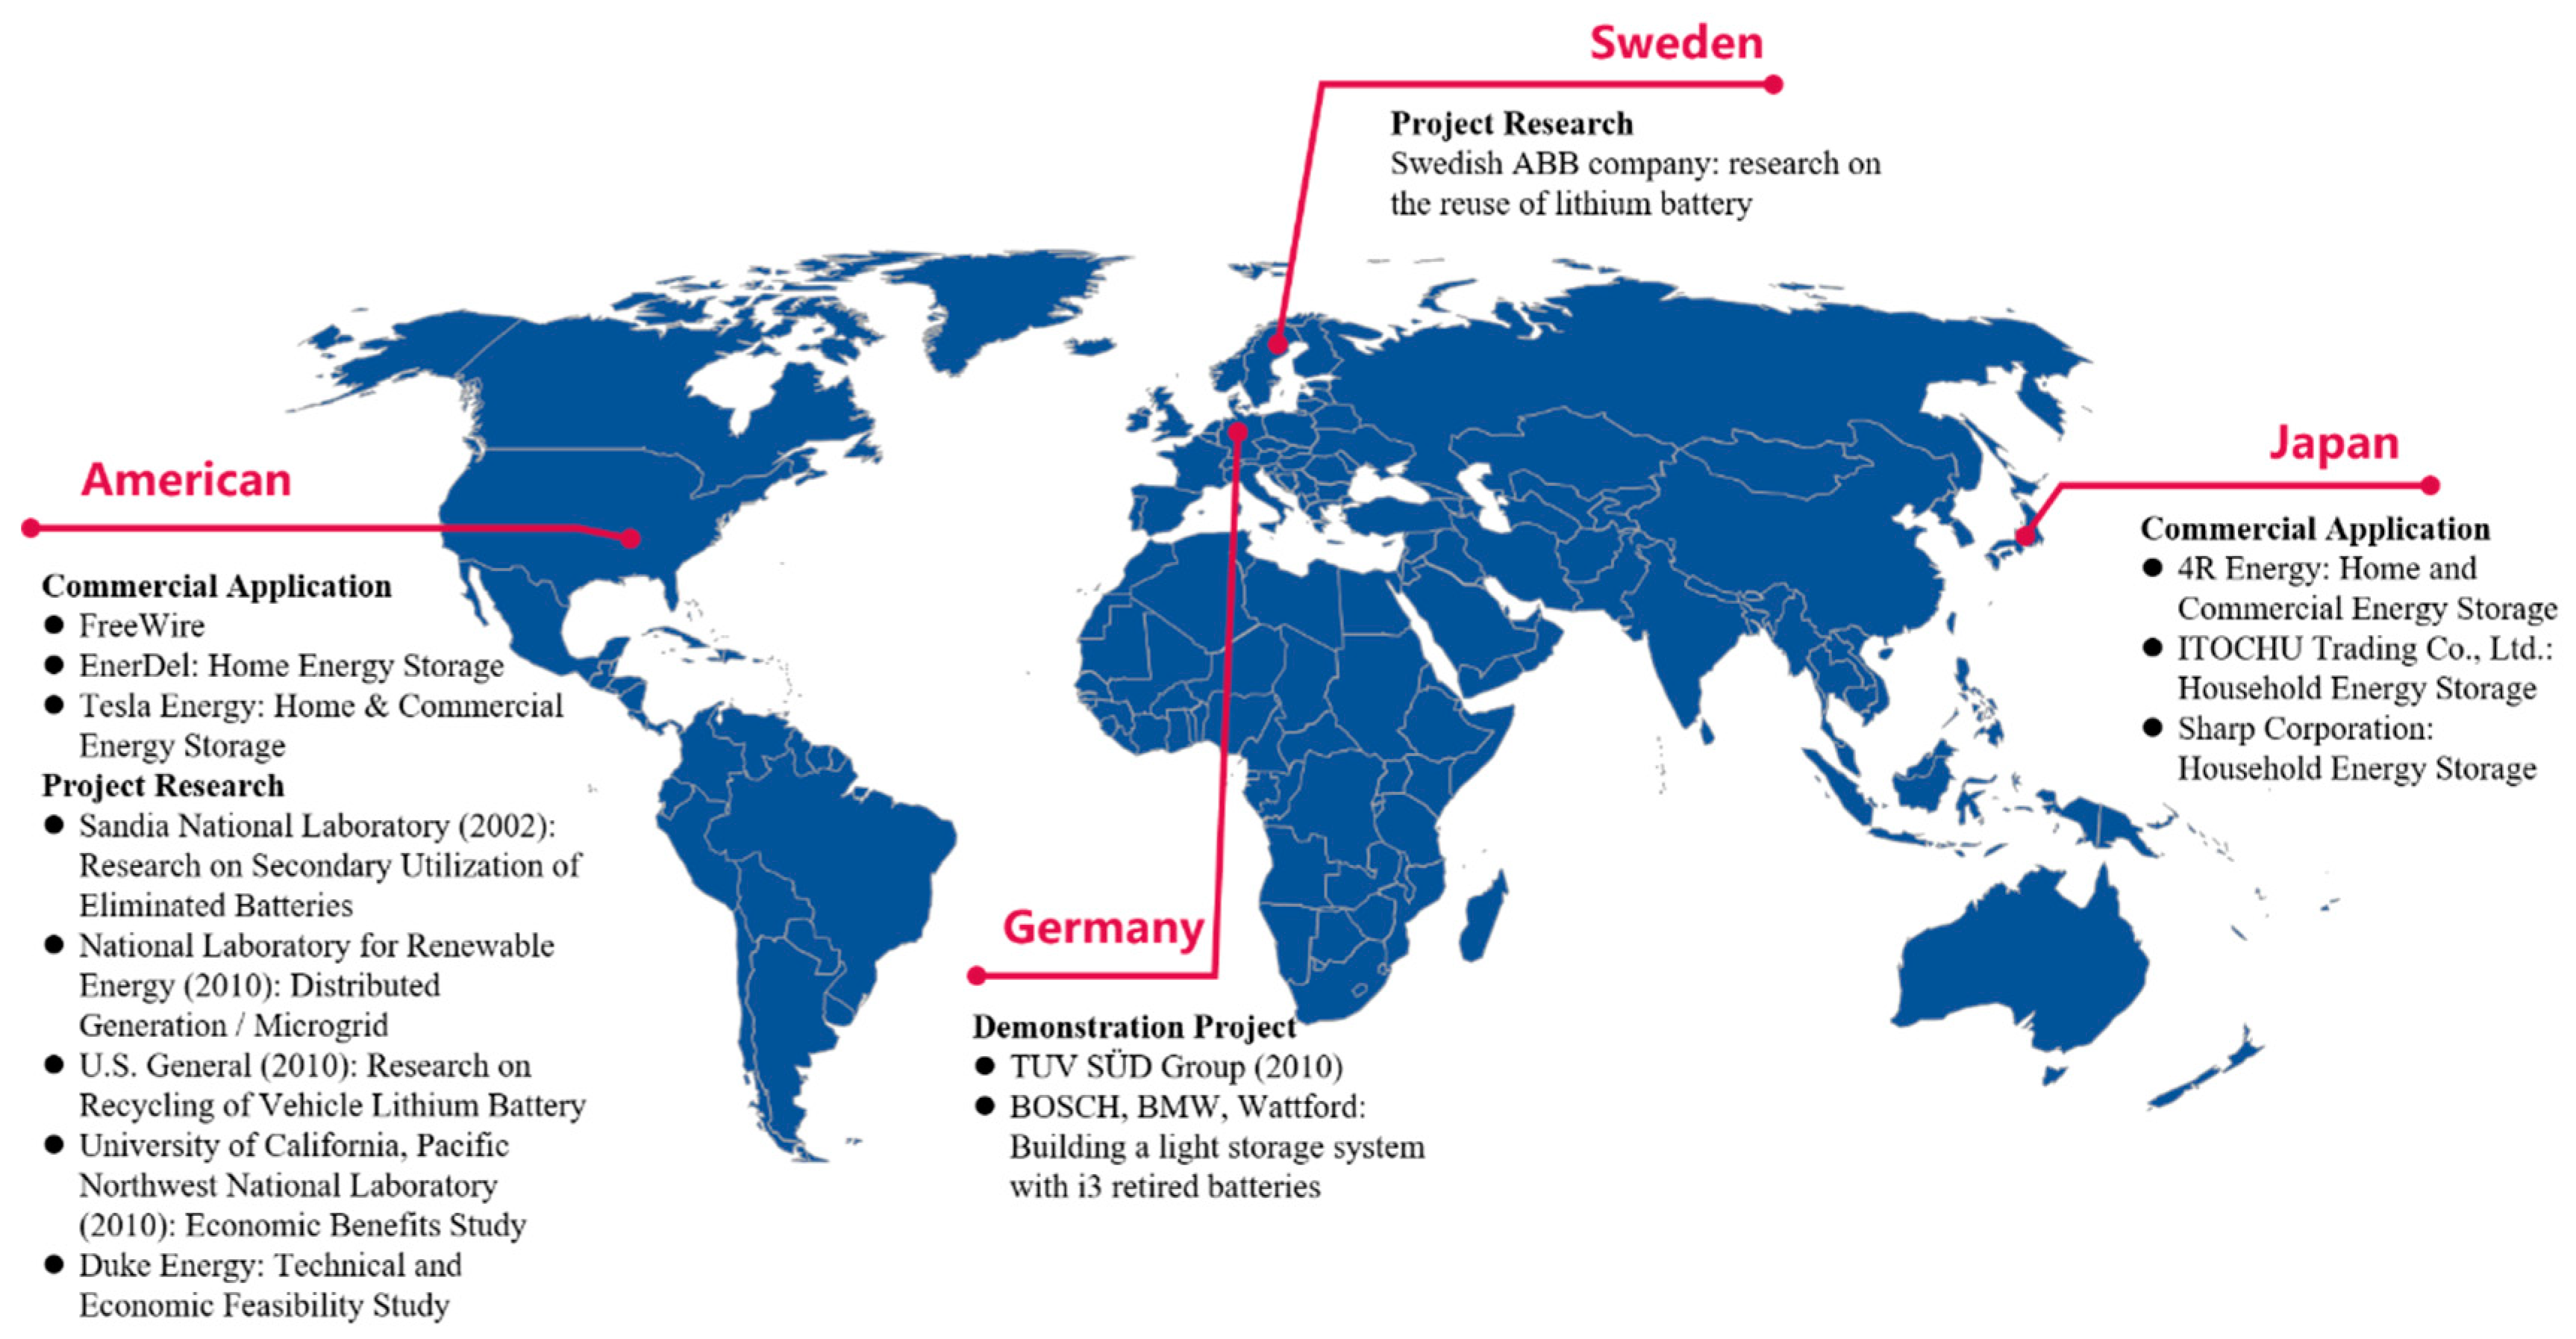
Figure 1. Global NEV’s Battery Recycling Project.
Sustainability 12 00341 g001
Figure 2. China’s NEV’s Battery Recycling Project.
Sustainability 12 00341 g002
Figure 3. Process for NEV’s battery second use in energy storage.
Sustainability 12 00341 g003
Figure 4. The structure of the battery energy storage station.
Sustainability 12 00341 g004
Figure 5. System Dynamics model of NEV’s battery second use in energy storage.
Sustainability 12 00341 g005
Figure 6. NPV’s graph between old and new battery energy storage. (a) Comparison of the benefits of new battery energy storage and old battery energy storage; (b) comparison of the benefits of new battery energy storage and old battery energy storage when the cost of new battery drops.
Sustainability 12 00341 g006
Figure 7. Initial Investment Cost Structure of Old Battery Energy Storage.
Sustainability 12 00341 g007
Figure 8. Initial Investment Cost Structure of New Battery Energy Storage.
Sustainability 12 00341 g008
Figure 9. NPV’s graph in scenario 1.
Sustainability 12 00341 g009
Figure 10. NPV’s graph in scenario 2.
Sustainability 12 00341 g010
Figure 11. NPV’s graph in scenario 3.
Sustainability 12 00341 g011
Table 1. China’s policies for the battery energy storage industry.
ClassificationTimePolicy Name
Instructions28 June 2012Energy-saving and new energy automobile industry development plan
29 February 2016Guidance on promoting the development of “Internet+” smart energy
22 September 2017Guidance on promoting energy storage technology and industrial development
Action Plan7 June 2014Energy Development Strategic Action Plan (2014–2020)
20 February 2017Promote the development plan of the automotive power battery industry
5 March 2018Pilot implementation plan for recycling of new energy vehicle power battery
Standard11 September 2015Electric Vehicle Power Battery Recycling Technology Policy (2015 Version)
4 February 2016New energy vehicle waste power battery comprehensive utilization industry-standard conditions
Interim Measures for the Administration of the Announcement of the Comprehensive Utilization of Waste Electrical Power Battery for New Energy Vehicles
Financial Subsidy7 June 2016Notice on Promoting the Participation of Electric Energy Storage in the Pilot Work of the Electric Power Auxiliary Service Replenishment (Market) Mechanism in the “Three North” Region
15 November 2017Improve the work plan of the power-assisted service compensation (market) mechanism
25 December 2017Regulations on the operation of the grid-connected operation of power plants in the southern region
Regulations on the Administration of Auxiliary Services for Grid-connected Power Plants
24 March 2019Measures for the Management of Special Funds for Green Development of Suzhou Industrial Park
Table 2. SD model indicators and data.
No.IndicatorsDataNumberIndicatorsData
1Unit capacity battery box cost, RMB/kWh12012Old battery capacity loss rate each charge/discharge, %0.02
2Unit transformer cost, RMB/kWh59.313One-way energy conversion efficiency, %95
3Unit capacity converter cost, RMB/kWh133.314Total battery weight, tons106
4Unit capacity BMS cost, RMB/kWh133.315Average residual rate of fixed assets, %5
5Unit capacity battery cabinet cost, RMB/kWh34016Annual equipment repair cost, RMB/year200,000
6Monitoring system cost, RMB750,00017The daily charge/discharge times of BESS 1
7Battery selection equipment purchase cost, RMB80,00018Annual power outage frequency, times/year0.35
8Unit capacity battery purchase cost, RMB/kWh24019Comprehensive economic loss of power outage per unit capacity, RMB/kWh99.08
9Unit capacity battery transportation cost, RMB/kWh27.720Rate of reducing the peak electricity consumption, %30
10Per capita monthly salary, RMB/Month420021Annual growth rate of peak load, %5
11Electricity price at the peak/valley of electricity consumption, RMB/kWh0.8546/0.34322Unit capacity power grid construction cost, RMB/kWh8000
The values of indicators 1–9 are the market prices (quoted by XJ Group Corporation, China). Indicators 10-11 are from the Bureau of Statistics of Hebei Province and Price Bureau, and indicators 12–13 are tested by the battery of Xuejiadao. Index 14 is derived from the nominal weight of the battery. Index 15 is according to the Provisional Regulations and Implementation Rules of the Enterprise Income Tax of the People’s Republic of China; indexes 16–22 is from references [65,66,67].
Table 3. Parameters of each factor in scenario 1.
DataCost of Old Battery, RMB/kWhGovernment Subsidy, RMB/kWhElectricity Price at the Peak of Power Consumption, RMB/kWh
Level
Cost No Change2400.300.854 6
Cost: Reduced by 10%21600.854 6
Cost: Reduced by 20%19200.854 6
Cost: Reduced by 30%16800.854 6
Cost: Reduced by 40%14400.854 6
Cost: Reduced by 50%12000.854 6
Table 4. Parameters of each factor in scenario 2.
DataCost of Old Battery, RMB/kWhGovernment Subsidy, RMB/kWhElectricity Price at the Peak of Power Consumption, RMB/kWh
Level
Initial state2400.300.8546
Price: increase 10%000.8973
Price: increase 20%000.9400
Price: increase 30%000.9827
Price: increase 40%001.0254
Price: increase 50%001.0681
Table 5. Parameters of each factor in scenario 3.
DataCost of Old Battery, RMB/kWhGovernment Subsidy, RMB/kWhElectricity Price at the Valley of Power Consumption, RMB/kWh
Level
Initial state2400.300.3430
Cost: Reduced by 10%21600
Cost: Reduced by 20%19200
Cost: Reduced by 30%16800
Cost: Reduced by 40%14400
Cost: Reduced by 50%12000