Abstract
To understand the public’s acceptance of autonomous vehicles, studies were conducted from the perspectives of personal attributes, travel demand and cognitions of autonomous vehicles based on 403 valid questionnaires. Influencing factors of whether travelers are purchasing autonomous vehicles, whether travelers without a driver’s license intend to take a driver’s license in the future and whether travelers are choosing an autonomous private car if travelers can only take a taxi or drive a private car are analyzed by building Logistic regression models. The results show that personal monthly income, driver’s license, driving confidence, preference for autonomous vehicles and convenience of arriving at public transport stations will affect the purchase decision of autonomous vehicles; teenagers, long-distance travelers, students and employees of enterprises and institutions, those who believe that traditional taxis/taxi-hailing are unsafe, and those who lack confidence in driving have a higher probability of choosing autonomous vehicles. This research can be used to predict the probability of future purchase and use decisions for autonomous vehicles based on data from other populations.
1. Introduction
Since the 1970s, many developed countries have been researching autonomous vehicles (AVs). AVs, also known as a wheeled mobile robot, is an automatic vehicle that does not require human operation and can automatically perceive the environment and make decisions. The International Society of Automation Engineers (SAE) classifies the technology of automatic driving into six levels of L0–L5 according to the degree of automation: (1) L0: No driving automation. The driver drives completely by hands, controlling all the mechanical and physical functions of the vehicle at any time, without any distraction. (2) L1: Driver assistance. The driver is responsible for the operation of the vehicle, and the individual control equipment of the vehicle can be automated; (3) L2: Partial driving automation. The driver only needs to be responsible for part of the driving task, and the vehicle can complete most of the operation; (4) L3: Conditional driving automation. Vehicles can complete the driving operation within the limited design scope, but the driver is required to be ready to control the vehicle and take over the situation where the system cannot handle at any time; (5) L4: High driving automation. Vehicles can complete driving tasks within the design scope and cope with system failure, and drivers only need to keep their attention under special circumstances; (6) L5: Full driving automation. Vehicles are completely free from the driver’s will and manipulate their driving on their own. This paper discusses the L5 level of autonomous driving, i.e., full driving automation.
Many people are very supportive of the development of AVs with a series of merits: AVs are safer and can reduce human-induced road traffic accidents [1]; they are faster and can improve road capacity and alleviate urban traffic congestion; they are more environmentally-friendly and can improve fuel efficiency and reduce exhaust pollution [2,3,4,5,6,7,8]; they are more comfortable and provide travelers with better travel experience with hands-free [9]. However, there are also some people who are conservative about AVs with a series of drawbacks: AVs will deprive people of the pleasure of driving and may deprive people of driving skills; driverless systems may break down and threaten passengers’ safety; and there are hidden dangers of personal privacy leakage in the process of information exchange [10,11,12,13]. In May 2016, a Tesla car in fully automatic driving in the United States collided with a large truck, and in 2018, an Uber autonomous car collided with a pedestrian during a road test, resulting in the pedestrians’ death. These accidents caused people’s attention and concern about the safety and ethical issues of AVs.
With the development of driverless technology, there has been more and more research on AVs [14,15,16,17,18,19,20,21,22,23,24]. In terms of risk perception, Xu and Fan [25] studied the risk perception and insurance demand of AVs in the Chinese market. The results showed that the more people knew about driverless technology, the lower their risk expectations for AVs, and 69% of respondents were willing to pay more for autonomous vehicles’ insurance. Wang and Zhao [26] studied the influence of the risk preference of Singaporeans on the choice of AVs. It was found that elderly, poor, female and unemployed Singaporeans are more inclined to avoid risks, and therefore, are less likely to choose AVs. Liu et al. [27] found that the greater the contribution of AVs to environmental protection, the higher the likelihood that the public is willing to tolerate their risks. In terms of public attitudes, Almeida Correia et al. [28] used the discrete selection model to analyze the change of travel time value of working and leisure activities in AVs, and found that the travel time value in traditional cars was systematically lower than that in AVs because people did not trust AVs. Hudson et al. [29] discussed people’s attitudes towards AVs through regression analysis. The results showed that people’s attitudes towards AVs are related to their attitudes towards robots. Young people, male, people living in cities, high-educated people are more likely to accept AVs, and countries with high accident rates are more supportive of AVs. Anania et al. [30] employed variance analysis to study the influence of positive and negative information on the willingness of travelers to choose AVs, and analyzed the possible differences in the perceptions of the same information between individuals of different genders and different nationalities. Studies have shown that Indian women are the most willing to use AVs. Bansal and Kockelman [31] predicted the acceptance of connected autonomous vehicles (CAVs) of the American public in eight different scenarios from 2015 to 2045 by assuming that the price of vehicles is declining year by year, and people’s willingness to pay is increasing year by year. Connected autonomous vehicles (CAVs), an organic combination of connected vehicles and autonomous vehicles, are equipped with advanced in-vehicle sensors, controllers, actuators and other devices, and integrate modern communications and network technologies to achieve intelligence information exchange and sharing between vehicles and people, other vehicles, roads, and the management center. CAVs is a new generation of cars that realize safe, comfortable, energy-saving and efficient driving. The main differences between AVs and CAVs are shown as below: AVs only obtain information limited to a small area, and the information may be inaccurate sometimes. Therefore, AVs can hardly achieve globally optimal efficiency. CAVs can access vehicle networks and the Internet through wireless communication technologies, which provide them with accurate traffic data about the surrounding traffic condition and the traffic management center’s decisions. Traffic efficiency and safety can be greatly improved through the cooperative driving of CAVs [32]. The authors suggested that the public’s understanding of CAVs will deepen as more and more technical experience floods into society, and public cognitions and potential choice behaviors of CAVs are easy to change. Yap et al. [33] analyzed the influencing factors affecting people’s use of AVs as the last mile of transportation. It was found that first-class passengers tend to use AVs more than bicycles, buses/trams/subway travelers, but people have not realized that AVs can improve travel time utilization. In terms of the impact of AVs, Malokin et al. [9] predicted the relationship between commute mode selection and time use and activities during commuting by establishing multinomial Logit models. The results showed that commuting could be engaged in productive activities and improve travel time utilization, which would improve the utility of this commuting mode, and AVs can provide conditions for a high level of productive activities. Arakawa et al. [34] studied the dependence of AVs drivers on the driving system. The experimental results showed that the driver feels anxiety and pressure when switching from the automatic driving mode to the manual driving mode. Abe [35] provided the benefits of the introduction of autonomous taxis and buses in Japan. The cost of public transportation will be reduced, and the flexibility of autonomous vehicles will make up for the lack of regional public transport, giving convenience to travelers. Gelauff et al. [36] studied the impact of the emergence of AVs on cities. Autonomous cars decentralize populations, while autonomous public transport centralizes populations. The interaction between the two may make the largest and most attractive city continues to grow, causing small cities to decline gradually.
Understanding the public’s cognitions and acceptance of emerging technologies is crucial, as public cognitions and attitudes towards the new technology can determine the direction and pace of its development. At present, there is little research on the factors influencing the decision of purchasing and using AVs in China. Therefore, the purpose of this study is to investigate the Chinese traveler’s choice behavior of AVs. Firstly, the influencing factors of choice behavior for AVs are analyzed from traveler personal attributes, travel demand, cognitions of AVs. Second, three disaggregated models are established to respectively analyze whether traffic travelers choose to purchase AVs without considering the price, whether drivers without a driver’s license choose to obtain a driver’s license in the future, and whether to use an autonomous private car if they can only take a taxi or drive a private car. At last, corresponding comments and suggestions are provided.
The rest of the paper is organized as follows: Section 2 describes the theoretical basis of the Logit model, and introduces the design ideas and survey scenarios of the questionnaire; Section 3 analyzes the influencing factors of AVs choice behavior based on the questionnaire data; Section 4 establishes three non-aggregate models to analyze AVs choice behavior; Section 5 summarizes the research and provides directions for future research.
2. Theoretical Basis and Data Acquisition
2.1. Theoretical Basis
Principal component analysis, multivariate analysis and factor analysis are mainly used to deal with the discussed problems [37,38,39,40,41,42,43]. Factors influencing travelers’ choice of AVs mainly include personal attributes, travel demand and their cognitions of AVs. Through this study, this paper intends to determine which specific factors will affect people purchase/use AVs in the future, and predict which groups of people will make positive decisions about AVs. By comparison, Logistic regression models are selected to address the influence of X (explanatory variable) on Y (explained variable).
When there are two options of Y, Binary Logistic regression model should be selected for analysis. For example, this paper investigates the influence of various factors on the purchase decision of AVs. The explained variable is whether to “buy AVs”, and “Y = 1” means to buy AVs, “Y = 0” means not to buy AVs. To explore the influence of various factors on whether a person without a driver’s license chooses to obtain a driver’s license in the future, the explained variable is whether to “obtain a driver’s license”, “Y = 1” means to obtain a driver’s license, and “Y=0” means not to obtain a driver’s license. The general form of Binary Logistic model is as follows,
where represents the probability that ; represents each explanatory variable; represents a constant term; represents the regression coefficient of the model.
When there are multiple options of , multinomial Logistic regression model should be selected for analysis. Multinomial Logistic regression is divided into multinomial Ordered Logistic regression and multinomial Disordered Logistic regression. Multinomial Disordered Logistic regression analysis should be used when there is no comparative significance between the choices of and the values only represent different categories. Multinomial Logistic regression analysis is actually the extension of multiple Binary Logistic regression models, which describes the role of each category compared with the reference category. This paper accommodates the influence of various factors on whether to choose autonomous private car when they can only travel by taxi or private car. The explained variable is the choice of traffic mode. means the choice of autonomous private car, means the choice of autonomous taxi-hailing, means the choice of traditional private car, means the choice of traditional taxi/taxi-hailing.
In the process of regression analysis, commonly used variable selection methods include backward deletion method, forward selection method and stepwise regression method. Backward deletion method puts all the explanatory variables into the regression model for testing first, and then eliminate the insignificant variables one by one according to the test results; forward selection method does not include any explanatory variables in the model at the beginning. The explanatory variables are then introduced into the regression model in turn after checking the significance of the variables one by one. The stepwise regression method considers both the introduction and elimination of variables, and analyzes the relationship between the variables that have entered the model and the variables that have not entered the model. It helps to reduce multiple collinearities and get a better regression model [44,45].
After estimating the regression coefficients of the model, it is necessary to test the significance of a single parameter. Common test methods include t test, Wald test and likelihood ratio test [46,47]. The probabilistic P values of regression coefficients can be obtained by these test methods, so as to test whether a single explanatory variable has a significant impact on the explained variable at the corresponding significance level. In addition, the fitting degree of the model is measured according to log likelihood and AIC. Log likelihood is the logarithm of maximum likelihood in the regression model; and sometimes it is replaced by −2 log likelihood. The larger the log likelihood is, the more accurate the model is. AIC, the Akaike information criterion, is based on the concept of entropy, which can weigh the complexity and the fitting degree of the estimated model. AIC value depends on the number of parameters and the sample size of the model. The smaller the AIC value is, the better the model is.
2.2. Data Acquisition
2.2.1. Questionnaire Design
According to the three questions studied in this paper, the content of the questionnaire is divided into three parts: Personal attributes and travel demand, cognitions of AVs, and the stated preference survey. Considered that the sample of the questionnaire covers a wide range of people with various academic qualifications and age groups, the questionnaire begins with a brief introduction of AVs about the definitions and classification of automation levels. The questionnaire sets a skip logic. After obtaining the personal attributes of the respondent, if the respondent holds a driver’s license, let the driver fill in the driving experience; if the respondent does not have a driver’s license and is not ready to obtain the driver’s license, then investigate his/her willingness to take the driving license in the future. The contents of this questionnaire are as follows:
- Personal attributes and travel demand: Gender, age, education, occupation, personal monthly income, private car ownership, driver’s license, driving age, driving confidence, average daily travel times, average daily travel distance, and convenience of arriving at public transport stations are included. Among them, driving confidence applies to both people with and without a driving license. We assume that the driving confidence of respondents with a driving license is based on their driving experience, while the driving confidence of those without a driving license is based on their cognitions of driving. Cognitions of driving refer to the individual’s knowledge and understanding of driving, and the perspective of driving after the processing of individual feelings and imaginations.
- Cognitions of AVs: Driverless experience, driverless understanding, safety cognition, low time consumption cognition, convenience cognition, comfort cognition, environmental protection cognition, productive cognition, etc. are involved, while cognition variables for AVs are quantified using the international Likert scale.
- Stated Preference Survey: The SP survey method is employed to obtain data and decide whether travelers choose autonomous private car when they can only travel by taxi/taxi-hailing or private car. This paper selects explanatory variables from personal attributes, cognitions of AVs, travel attributes (travel purpose, travel time, travel distance) and environmental attributes (weather). In order to avoid the questionnaire being too complicated and beyond the judgment ability of the respondents, the orthogonal design function of SPSS is used to combine travel attributes, and environment attributes according to different levels, forming nine different hypothetical scenarios, and then obtaining the travelers’ choice of transportation mode.
2.2.2. Survey Scenarios
In order to obtain data effectively, the survey is divided into pre-investigation and formal investigation.
- Pre-investigation: The questionnaire is distributed to the small-scale population through the network. After collecting the questionnaires, the questionnaire is revised based on the results and feedback from the respondents.
- Formal investigation: This survey is mainly carried out on the network platform and distributed through social platforms such as Sojump, WeChat and QQ. In the end, a total of 498 questionnaires were collected. In the initial screening, the questionnaires with an answer time of less than 70s were removed, and 403 questionnaires were finally obtained, with a recovery rate of 81%.
3. Analysis of Influencing Factors of AVs Choice Behavior
3.1. Personal Attributes
Individual attributes are the natural and social attributes of travelers. Travelers have different income levels, ages, gender and other characteristics, so they have different purchasing motivations and consumption psychology. Therefore, different personal attributes will ultimately affect whether the sample population will buy or use AVs in the future. The results of the survey are shown in Table 1. Among the 403 respondents, 227 are women, accounting for 56.3%; As for the age, since the survey was conducted mainly through network and the users of the network are mainly young and middle-aged, the age of the respondents is concentrated at 18–45 years old, accounting for 77.2%; As for the education level, 65.3% of the respondents have middle and higher education. Considering that driverless technology has not yet been mature and popular, people with middle or higher education may receive more information about driverless technology and pay more attention to it; As for the population type, 42.7% of the respondents are students. This young group is the main workforce of the society in the next 20 years, and they have a relatively high demand for travel and private cars in the future. Because of the high proportion of students, non-income people accounted for 30.8% of the total sample, while those with a monthly income of more than 5000 yuan accounted for 36.2%. According to the data released by the National Bureau of Statistics, the average annual wage of employees in enterprises above the national scale in 2018 was 68,400 yuan. It can be seen that about 52.3% of the respondents with income have higher monthly income than the average level. 31.3% of the respondents did not have a private car, and 56.1% of the respondents had already obtained a driver’s license.

Table 1.
Statistical characteristics of the sample.
3.2. Travel Demand
Travel demand includes average daily travel times, average daily travel distance and convenience of arriving at public transport stations. Travel demand will affect whether the sample population buys a private car. The respondents’ travel demand is shown in Figure 1. Most respondents travel within three times, accounting for 83.1%. Nearly half of the respondents have an average daily travel distance of fewer than 5 km, and 81.6% traveled within 15 km. Their travel is concentrated in short and medium distance travel. It is convenient for most respondents to get to the nearest public transport stations from their place of residence, and 84.6% of the respondents can walk to the stations within 20 min.

Figure 1.
Distribution of respondents’ travel demand. (a) Distribution of average daily travel times of respondents; (b) Distribution of average daily travel distance of respondents; (c) Distribution of the convenience of respondents to public transport stations.
3.3. Cognitions of AVs
Cognitions of AVs refer to the individual’s knowledge and understanding of AVs, and the perspective of AVs after the processing of individual feelings, thinking and imaginations. The cognitions of AVs include five aspects: Safety, low time consumption, convenience, comfort, and environmental protection. In our survey, the cognition level is divided into five levels—1 means very disapproving, with the least favorable attitudes towards AVs; 5 represents a high level of approval, with the most favorable attitudes towards AVs. Travelers’ cognitive distribution of AVs is shown in Figure 2. In general, travelers’ cognition of AVs is concentrated on “neither disagree nor agree” and “agree”. Among them, 64.5% of the respondents believe that AVs are more convenient and can free people’s hands, while only 39.7% of the respondents believe that AVs are safer and can reduce traffic accidents. It indicates that although most travelers recognize the convenience brought by AVs, they still do not trust the safety of AVs. This corresponds to the distribution of travelers’ time utilization in AVs in Figure 3, with 43.7% still paying attention to traffic conditions. Specifically, the penetration rate of “rest”, “work or study” and “still pay attention to traffic conditions” are significantly higher, in which the penetration rate is used to compare the selection popularity of a certain option and it is obtained by dividing the number of samples for a certain option by the total number of samples. 35.0% of respondents have experience with assisted driving vehicles. 6.9% of the respondents who have no experience refuse to take a ride on AVs resolutely, while only 0.7% of those who have experience refuse. Their favorable attitudes towards AVs have obvious differences. The chi-square analysis shows that the p value is 0.005, less than 0.05, which indicates that travelers who have experience of assisted driving are more likely to have a positive evaluation of driverless technology.
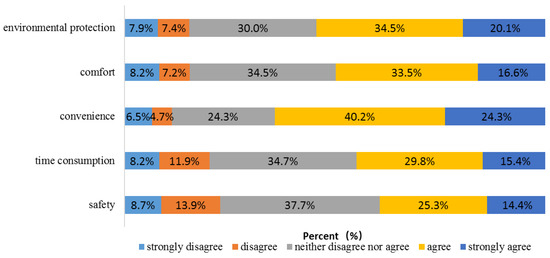
Figure 2.
Travelers’ cognitive distribution of autonomous vehicles (AVs).
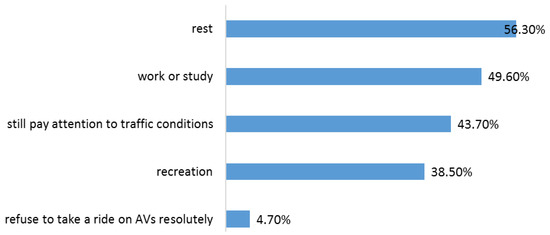
Figure 3.
Distribution of travelers’ time utilization in AVs.
4. Modeling Analysis of Choice Behavior of AVs
4.1. Analysis of the Purchase Decision of AVs Based on Binary Logistic Model
Based on the questionnaire data, variables are selected from personal attributes, travel demand, and cognition of AVs to establish a Binary Logistic model (BL1 model), analyzing whether travelers will purchase AVs. The explained variable is whether to “buy AVs”, and ‘Y = 1” means to buy AVs, “Y = 0” means not to buy AVs. The utility function of Y = 0 is 0, i.e., the reference selection is not to buy AVs.
Before establishing the regression equation, the collinearity test is performed on each explanatory variable. VIF, Variance Inflation Factors, is a measure of the degree of multi-collinearity in a collinearity test. Multi-collinearity refers to a linear correlation between independent variables, that is, one independent variable can be a linear combination of one or several other independent variables, which will affect the accuracy and stability of the regression equation. VIF represents the ratio of the variance of the regression coefficient estimator to the variance when assuming a non-linear correlation between the independent variables. The closer the VIF value is to 1, the lower the degree of multi-collinearity is, and vice versa. In general, if the VIF value exceeds 10, there is a high degree of multi-collinearity in the regression model [48]. In this paper, the collinearity test shows that the VIF value of each explanatory variable is less than 10, indicating that the collinearity between the variables is weak, and a Logistic regression model can be established. In this paper, a stepwise screening strategy based on maximum likelihood estimation is used to exclude insignificant variables from the equation. The variables and parameter estimation results in the final model are shown in Table 2.
Table 2.
Parameter estimation results of the BL1 model.
According to the data in Table 2, the following Logistic regression equation can be obtained,
where indicates personal monthly income, indicates driving license, indicates driving confidence, indicates favorable attitudes towards AVs, and indicates convenience to public transport stations.
Table 3 shows the result of the test for BL1 model. The p value corresponding to the Wald observation of the coefficient significance test of each explanatory variable in Table 2 is less than the significance level of 0.05, indicating that the linear relationship between the explanatory variable left behind and Logit P is significant. The Hosmer and Lemeshow test is used to judge how good the model fits. The value obtained by the test is called the adjoint probability. If the adjoint probability is less than the significance level, it means that there is significant difference between the predicted value and the observed value, so the fitting degree of the model is not high; if the adjoint probability is greater than the significance level, it means that there is no significant difference between the predicted value and the observed value, so the fitting degree of the model is high. In this paper, the adjoint probability tested by Hosmer and Lemeshow was greater than 0.05, indicating that the BL1 model fits well. It can be known from Section 2.1; the fitting degree of the model can also be measured according to log likelihood. The larger the log likelihood is, the more accurate the model is. Log likelihood is replaced by −2 log likelihood in this paper. The −2 log likelihood value of the final BL1 model (259.733) is smaller than that of the initial model (438.620), indicating that the model fits effectively. Cox and Snell is similar to in general linear regression analysis, describing the percentage of the change in the dependent variable explained by the model’s independent variables. Nagelkerke is a modified Cox and Snell . The two values are between 0 and 1. The larger the values, the higher the accuracy of the model. The two values of BL1 model are 0.361 and 0.482, respectively, indicating that the accuracy of the model is acceptable. The overall accuracy is also one of the criteria to evaluate the model, indicating the consistency between the results predicted by the model and the results of the actual choice behavior. The higher the accuracy is, the better the model is. The fitting accuracy of BL1 model was 77.9%, indicating that the model is good.
Table 3.
The result of the test for BL1 model.
The parameter estimation results show that: (1) Personal monthly income, driver’s license, driving confidence, favorable attitudes towards AVs and the convenience to the nearest public transport station have a significant impact on travelers’ purchase decision of Avs; (2) Compared with the individuals with a monthly income of 1–5000 yuan, individuals with a monthly income of more than 15,000 yuan are more likely to buy Avs; there is no significant difference in purchase decisions between people with income of 5001–15,000 yuan and people with income of over 15,000 yuan; (3) Drivers with a driver’s license are more likely to make purchase decisions, and are 1.948 times more likely to buy Avs than drivers without a license; (4) Travelers who are unconfident and neither unconfident nor confident in driving are more likely to buy Avs. Their probability of making purchase decisions is 2.966 and 2.077 times that of those who are confident in driving; (5) Travelers who have favorable attitudes towards Avs and agree on their safety, low time consumption, convenience, comfort and environmental protection are more likely to buy them; (6) The longer it takes travelers to get to the nearest public transport stations, the more likely they are to buy Avs.
4.2. Analysis of Future Choice of Driver’s License Based on Binary Logistic Model
Based on the questionnaire data, variables are selected from personal attributes, travel demand, and cognition of Avs to establish a binary logistic model (BL2 model), analyzing whether travelers without a driver’s license will obtain the license in the future. The explained variable is whether to “obtain a driver’s license “, and “” means to obtain a driver’s license, “” means not to obtain a driver’s license. The utility function of is 0; that is, the reference selection is not to obtain a driver’s license. The variables and parameter estimation results in the final model are shown in Table 4. According to the data in Table 4, the following Logistic regression equation can be obtained,
where indicates driving confidence, indicates favorable attitudes towards Avs.
Table 4.
Parameter estimation results of the binary logistic model (BL2 model).
Table 5 shows the result of the test for BL2 model. The p value corresponding to the Wald observation of the coefficient significance test of each explanatory variable in Table 4 is less than the significance level of 0.05, indicating that the linear relationship between the explanatory variable left behind and Logit P is significant. The adjoint probability tested by Hosmer and Lemeshow was greater than 0.05, indicating that the BL2 model fits well. The −2 log likelihood value of the final BL2 model (105.286) is smaller than that of the initial model (375.416), indicating that the model fits effectively. The Cox and Snell and Nagelkerke of BL2 model are 0.302 and 0.403, respectively, indicating that the accuracy of the model is acceptable. The overall accuracy of BL2 model was 78.9%, indicating that the model is good.
Table 5.
The result of the test for BL2 model.
The parameter estimation results show that: (1) Driving confidence and favorable attitudes towards AVs have a significant impact on whether travelers without a driver’s license will obtain a license in the future; (2) Compared with travelers with insufficient driving confidence, travelers with sufficient driving confidence have a higher probability of obtaining a driver’s license; there is no significant difference in obtaining a driver’s license between the travelers who are neither unconfident nor confident and those who are confident; (3) Travelers who have unfavorable attitudes towards AVs are more likely to take a driver’s license, which is 18.280 times higher than those who have favorable attitudes; there is no significant difference in obtaining a driver’s license between those who are moderately favorable and those who are highly favorable.
4.3. Analysis of the Choice Behavior of AVs Based on Multinomial Logistic Model
Based on the questionnaire data, variables are selected from personal attributes, cognition of AVs, travel attributes (travel purpose, travel time, travel distance) and environmental attributes (weather) to establish a multinomial logistic model (MNL model), analyzing whether travelers will travel by autonomous private car. The explained variable is the choice of traffic mode. means the choice of autonomous private car, means the choice of autonomous taxi-hailing, means the choice of traditional private car, means the choice of traditional taxi/taxi-hailing. The reference selection is the choice of autonomous private car. The variables and parameter estimation results in the final model are shown in Table 6. Table 7 shows the result of the test for the MNL model. Pearson statistic and deviance statistic are commonly used to test the goodness of fit of multiple logit models. Pearson statistic can be used to test the hypothesis that the model is established by comparing the predicted and observed the frequency of occurrence and non-occurrence. Deviance statistic is based on log likelihood function. In general, if the p value of the two statistics are greater than the significance level, it means that the model fits well. As can be seen from Table 7, the p value of Pearson and Deviance statistics in the model is greater than 0.05, indicating that the fitting is good.
Table 6.
Parameter estimation results of the multinomial logistic model (MNL) model.
Table 7.
The result of the test for the MNL model.
The parameter estimation results show that:
- Compared with middle-aged and elderly people, juveniles are more likely to choose autonomous taxi-hailing when other variables remain unchanged. Young people are prone to accept new things. They do not have the economic ability to buy and maintain private cars in the short term, but they pursue a certain quality of life, so they are more likely to use autonomous taxi-hailing. Compared with middle-aged and elderly people, young people are more likely to choose autonomous private cars than traditional private cars.
- When other variables remain unchanged, travelers who think that traditional taxi/taxi-hailing is unsafe are more likely to choose autonomous private cars. In recent years, the frequent criminal incidents of taxi and taxi-hailing drivers have caused widespread concern and negative evaluation in society. Female travelers’ sense of self-protection rose, and their willingness to take taxi/ taxi-hailing decreased. The emergence of AVs provides travelers with a new choice of transport mode. Traveling by AVs can help travelers avoid interference from drivers.
- When other variables remain unchanged, students and employees of enterprises and institutions are more likely to choose autonomous private cars than travelers of other occupations. Travelers who are unconfident and neither unconfident nor confident in driving are more likely to choose autonomous private cars than traditional private cars. For commuting and shopping/recreation purposes, travelers are more likely to choose autonomous private cars.
- When other variables remain unchanged, long distance travelers are more likely to choose autonomous private cars rather than traditional cars. Long distance driving tends to distract travelers from fatigue and reduce time efficiency. AVs can free human hands and allow people to rest and work in an autonomous car, which not only improves time utilization efficiency, but also improves travel experience.
- When other variables remain unchanged, there is no significant difference between sunny days and cloudy days. People are more likely to choose traditional private cars and traditional taxi/ taxi-hailing on rainy days than on sunny days. The driving environment is more complicated on rainy days and other bad weather, which brings much interference to the visual identification of AVs. For example, water on the road is easy to form reflections and cover road signs, which makes the safety of AVs decreased and causes people’s concern. This is consistent with the descriptive statistical results of the questionnaire. 60.3% of travelers do not trust the safety of AVs, and 43.7% of travelers still pay attention to traffic conditions in AVs.
5. Conclusions
This paper mainly focuses on the factors influencing travelers to purchase and use AVs. Through the screening of the influencing factors and the analysis of the regression model, it is found that the personal monthly income, driver’s license, driving confidence, favorable attitudes towards AVs and convenience to the nearest public transport stations have a significant impact on travelers’ purchase decision of AVs. Driving confidence and favorable attitudes towards AVs have a significant impact on whether travelers without a driver’s license will take a license in the future. Juveniles are more likely to choose autonomous taxi-hailing, and young people are more likely to choose AVs. Travelers who think that traditional taxi/ taxi-hailing is unsafe, those who are unconfident and neither unconfident nor confident in driving, those who travel a long distance, students and employees of enterprises and institutions are more likely to choose autonomous private cars. However, due to safety concerns, travelers still do not trust AVs completely. Travelers are more likely to travel by traditional cars on rainy days, and they still pay attention to traffic conditions when traveling in AVs. Therefore, the government and relevant market departments should intensify the publicity on the safety performance of AVs before and after the launch.
The analysis in this paper is based on the data obtained from the questionnaire and the three disaggregated models. The size of the sample obtained this time is not large enough, and the sample covers the student group too much. When investigating the purchase intention of AVs, only the personal factors of the respondents were considered, and the family factors, such as the number of family members and family travel demand, were not included. The factors above lead to certain limitations of the data. In-depth studies will be conducted on different types of AVs and different consumption patterns (such as sharing AVs) in the future.
Author Contributions
The authors confirm contribution to the paper as follows. Study conception and design: L.T., C.M., X.X. and J.X.; data collection: L.T. and C.M.; analysis and interpretation of results: L.T.; draft manuscript preparation: C.M. All authors reviewed the results and approved the final version of the manuscript. All authors have read and agreed to the published version of the manuscript.
Funding
This research was funded by the National Natural Science Foundation of China Grant No. 71861023, the Program of Humanities and Social Science of Education Ministry of China Grant No. 18YJC630118, the Research Fund for the Central Universities HUST: 2018KFYYXJJ001, and Foundation of A Hundred Youth Talents Training Program of Lanzhou Jiaotong University.
Acknowledgments
The authors would like to thank two anonymous reviewers for constructive comments and suggestions. The authors acknowledge the financial support from the relevant institutions. The authors also thank the respondents for providing data and information that were essential for this work.
Conflicts of Interest
The authors declare no conflict of interest.
References
- Howard, D.; Dai, D. Public Perceptions of Self-Driving Cars: The Case of Berkeley, California. In Proceedings of the Transportation Research Board 93rd Annual Meeting, Washington, DC, USA, 12–16 January 2014; pp. 1–16. [Google Scholar]
- Hula, A.; Snapp, L.; Alson, J.; Simon, K. The environmental potential of autonomous vehicles. In Road Vehicle Automation 4; Springer: Berlin, Germany, 2018; pp. 89–95. [Google Scholar]
- Anderson, J.M.; Nidhi, K.; Stanley, K.D.; Sorensen, P.; Samaras, C.; Oluwatola, O.A. Autonomous Vehicle Technology: A Guide for Policymakers; Rand Corporation: Santa Monica, CA, USA, 2014. [Google Scholar]
- Airbib, J.; Seba, T. Rethinking Transportation 2020–2030: The Disruption of Transportation and the Collapse of the Internal-Combustion Vehicle and Oil Industries. In RethinkTransportation 2020–2030; RethinkX: San Francisco, CA, USA, 2017. [Google Scholar]
- MacKenzie, D.; Wadud, Z.; Leiby, P. A First Order Estimate of Energy Impacts of Automated Vehicles in the United States. In Proceedings of the Transportation Research Board Annual Meeting, Washington, DC, USA, 12–16 January 2014. [Google Scholar]
- Faber, F.; Jonkers, E.; van Noort, M.; Benmimoun, M.; Pütz, A.; Metz, B.; Saint Pierre, G.; Gustafson, D.; Malta, L. Final Results: Impacts on Traffic Efficiency and Environment; EuroFOT: Aachen, Germany, 2012. [Google Scholar]
- Brännström, M. Commercial Viability; SARTRE, Volvo Car Corporation: Gothenburg, Sweden, 2013. [Google Scholar]
- Wadud, Z.; MacKenzie, D.; Leiby, P. Help or hindrance? The travel, energy and carbon impacts of highly automated vehicles. Transp. Res. Part A Policy Pract. 2016, 86, 1–18. [Google Scholar] [CrossRef]
- Malokin, A.; Circella, G.; Mokhtarian, P.L. How do activities conducted while commuting influence mode choice? Using revealed preference models to inform public transportation advantage and autonomous vehicle scenarios. Transp. Res. Part A Policy Pract. 2019, 124, 82–114. [Google Scholar] [CrossRef]
- Fagnant, D.J.; Kockelman, K. Preparing a nation for autonomous vehicles: Opportunities, barriers and policy recommendations. Transp. Res. Part A Policy Pract. 2015, 77, 167–181. [Google Scholar] [CrossRef]
- Kyriakidis, M.; Happee, R.; de Winter, J.C. Public opinion on automated driving: Results of an international questionnaire among 5000 respondents. Transp. Res. Part F Traffic Psychol. Behav. 2015, 32, 127–140. [Google Scholar] [CrossRef]
- Bazilinskyy, P.; Kyriakidis, M.; de Winter, J. An international crowdsourcing study into people’s statements on fully automated driving. Procedia Manuf. 2015, 3, 2534–2542. [Google Scholar] [CrossRef]
- Adnan, N.; Nordin, S.M.; bin Bahruddin, M.A.; Ali, M. How trust can drive forward the user acceptance to the technology? In-vehicle technology for autonomous vehicle. Transp. Res. Part A Policy Pract. 2018, 118, 819–836. [Google Scholar] [CrossRef]
- Jiang, Y.; Zhang, J.; Wang, Y.; Wang, W. Capturing ownership behavior of autonomous vehicles in Japan based on a stated preference survey and a mixed logit model with repeated choices. Int. J. Sustain. Transp. 2019, 13, 788–801. [Google Scholar] [CrossRef]
- Chen, Y.; Hu, C.; Wang, J. Human-Centered Trajectory Tracking Control for Autonomous Vehicles With Driver Cut-In Behavior Prediction. IEEE Trans. Veh. Technol. 2019, 68, 8461–8471. [Google Scholar] [CrossRef]
- Ma, C.; He, R. Green wave traffic control system optimization based on adaptive genetic-artificial fish swarm algorithm. Neural Comput. Appl. 2019, 31, 2073–2083. [Google Scholar] [CrossRef]
- Dietrich, M.; Weisswange, T.H. Distributive justice as an ethical principle for autonomous vehicle behavior beyond hazard scenarios. Ethics Inf. Technol. 2019, 21, 227–239. [Google Scholar] [CrossRef]
- Ma, C.; Hao, W.; Pan, F.; Xiang, W. Road screening and distribution route multi-objective robust optimization for hazardous materials based on neural network and genetic algorithm. PLoS ONE 2018, 13, e0198931. [Google Scholar] [CrossRef] [PubMed]
- Kröger, L.; Kuhnimhof, T.; Trommer, S. Does context matter? A comparative study modelling autonomous vehicle impact on travel behaviour for Germany and the USA. Transp. Res. Part A Policy Pract. 2019, 122, 146–161. [Google Scholar] [CrossRef]
- Noh, S. Decision-Making Framework for Autonomous Driving at Road Intersections: Safeguarding Against Collision, Overly Conservative Behavior, and Violation Vehicles. IEEE Trans. Ind. Electron. 2018, 66, 3275–3286. [Google Scholar] [CrossRef]
- Jing, P.; Huang, H.; Ran, B.; Zhan, F.; Shi, Y. Exploring the factors affecting mode choice Intention of autonomous vehicle based on an extended theory of planned behavior—A case study in China. Sustainability 2019, 11, 1155. [Google Scholar] [CrossRef]
- Ma, C. Network optimisation design of hazmat based on multi-objective genetic algorithm under the uncertain environment. Int. J. Bio-Inspired Comput. 2018, 12, 236–244. [Google Scholar] [CrossRef]
- Farooq, B.; Cherchi, E.; Sobhani, A. Virtual immersive reality for stated preference travel behavior experiments: A case study of autonomous vehicles on urban roads. Transp. Res. Rec. 2018, 2672, 35–45. [Google Scholar] [CrossRef]
- Ma, C.; He, R.; Zhang, W. Path optimization of taxi carpooling. PLoS ONE 2018, 13, e0203221. [Google Scholar] [CrossRef]
- Xu, X.; Fan, C.K. Autonomous vehicles, risk perceptions and insurance demand: An individual survey in China. Transp. Res. Part A Policy Pract. 2019, 124, 549–556. [Google Scholar] [CrossRef]
- Wang, S.; Zhao, J. Risk preference and adoption of autonomous vehicles. Transp. Res. Part A Policy Pract. 2019, 126, 215–229. [Google Scholar] [CrossRef]
- Liu, P.; Ma, Y.; Zuo, Y. Self-driving vehicles: Are people willing to trade risks for environmental benefits? Transp. Res. Part A Policy Pract. 2019, 125, 139–149. [Google Scholar] [CrossRef]
- de Almeida Correia, G.H.; Looff, E.; van Cranenburgh, S.; Snelder, M.; van Arem, B. On the impact of vehicle automation on the value of travel time while performing work and leisure activities in a car: Theoretical insights and results from a stated preference survey. Transp. Res. Part A Policy Pract. 2019, 119, 359–382. [Google Scholar] [CrossRef]
- Hudson, J.; Orviska, M.; Hunady, J. People’s attitudes to autonomous vehicles. Transp. Res. Part A Policy Pract. 2019, 121, 164–176. [Google Scholar] [CrossRef]
- Anania, E.C.; Rice, S.; Walters, N.W.; Pierce, M.; Winter, S.R.; Milner, M.N. The effects of positive and negative information on consumers’ willingness to ride in a driverless vehicle. Transp. Policy 2018, 72, 218–224. [Google Scholar] [CrossRef]
- Bansal, P.; Kockelman, K.M. Forecasting Americans’ long-term adoption of connected and autonomous vehicle technologies. Transp. Res. Part A Policy Pract. 2017, 95, 49–63. [Google Scholar] [CrossRef]
- Hu, J.; Kong, L.; Shu, W.; Wu, M.Y. Scheduling of Connected Autonomous Vehicles on Highway Lanes. In Proceedings of the 2012 IEEE Global Communications Conference (GLOBECOM), Anaheim, CA, USA, 3–7 December 2012; pp. 5556–5561. [Google Scholar]
- Yap, M.D.; Correia, G.; Van Arem, B. Preferences of travellers for using automated vehicles as last mile public transport of multimodal train trips. Transp. Res. Part A Policy Pract. 2016, 94, 1–16. [Google Scholar] [CrossRef]
- Arakawa, T.; Hibi, R.; Fujishiro, T.A. Psychophysical assessment of a driver’s mental state in autonomous vehicles. Transp. Res. Part A Policy Pract. 2019, 124, 587–610. [Google Scholar] [CrossRef]
- Abe, R. Introducing autonomous buses and taxis: Quantifying the potential benefits in Japanese transportation systems. Transp. Res. Part A Policy Pract. 2019, 126, 94–113. [Google Scholar] [CrossRef]
- Gelauff, G.; Ossokina, I.; Teulings, C. Spatial and welfare effects of automated driving: Will cities grow, decline or both? Transp. Res. Part A Policy Pract. 2019, 121, 277–294. [Google Scholar] [CrossRef]
- Sovacool, B.K.; Abrahamse, W.; Zhang, L.; Ren, J. Pleasure or profit? Surveying the purchasing intentions of potential electric vehicle adopters in China. Transp. Res. Part A Policy Pract. 2019, 124, 69–81. [Google Scholar] [CrossRef]
- Al-Ghamdi, A.S. Using logistic regression to estimate the influence of accident factors on accident severity. Accid. Anal. Prev. 2002, 34, 729–741. [Google Scholar] [CrossRef]
- Behnood, A.; Mannering, F. The effect of passengers on driver-injury severities in single-vehicle crashes: A random parameters heterogeneity-in-means approach. Anal. Methods Accid. Res. 2017, 14, 41–53. [Google Scholar] [CrossRef]
- Roshandeh, A.M.; Zhou, B.; Behnood, A. Comparison of contributing factors in hit-and-run crashes with distracted and non-distracted drivers. Transp. Res. Part F Traffic Psychol. Behav. 2016, 38, 22–28. [Google Scholar] [CrossRef]
- Lavieri, P.S.; Bhat, C.R. Modeling individuals’ willingness to share trips with strangers in an autonomous vehicle future. Transp. Res. Part A Policy Pract. 2019, 124, 242–261. [Google Scholar] [CrossRef]
- Ma, C.; Yang, D.; Zhou, J.; Feng, Z.; Yuan, Q. Risk riding behaviors of urban e-bikes: A literature review. Int. J. Environ. Res. Public Health 2019, 16, 2308. [Google Scholar] [CrossRef] [PubMed]
- Ma, C.; Hao, W.; Xiang, W.; Yan, W. The impact of aggressive driving behavior on driver-injury severity at highway-rail grade crossings accidents. J. Adv. Transp. 2018, 1–10. [Google Scholar] [CrossRef]
- Wang, H.W.; Wu, Z.B.; Meng, J. Partial Least-Squares Regression-Linear and Nonlinear Methods; National Defense Industry Press: Beijing, China, 2006. [Google Scholar]
- Draper, N.R.; Smith, H. Applied Regression Analysis; John Wiley & Sons: Hoboken, NJ, USA, 1998. [Google Scholar]
- Woodridge, J. Introductory Econometrics, 3rd ed.; Thomson Higher Education: Mason, OH, USA, 2006. [Google Scholar]
- Wang, J.C.; Guo, Z.G. Logistic Regression Models: Methods and Application; Higher Education Press: Beijing, China, 2001. [Google Scholar]
- Montgomery, D.C.; Peck, E.A.; Vining, G.G. Introduction to Linear Regression Analysis; John Wiley & Sons: Hoboken, NJ, USA, 2012. [Google Scholar]


© 2019 by the authors. Licensee MDPI, Basel, Switzerland. This article is an open access article distributed under the terms and conditions of the Creative Commons Attribution (CC BY) license (http://creativecommons.org/licenses/by/4.0/).