Article

Exploring the Risk Factors of Infrastructure PPP Projects for Sustainable Delivery: A Social Network Perspective

1
School of Civil Engineering and Architecture, Wuhan University of Technology, Wuhan 430070, China
2
School of Architectural and Material Engineering, Hubei University of Education, Wuhan 430205, China
3
School of Management Science and Engineering, Tianjin University of Finance and Economics, Tianjin 300222, China
*
Author to whom correspondence should be addressed.
Sustainability 2020, 12(10), 4152; https://doi.org/10.3390/su12104152
Submission received: 21 March 2020 / Revised: 12 May 2020 / Accepted: 15 May 2020 / Published: 19 May 2020

Abstract

:
Due to the relatively long period and large capital flow of public-private partnership (PPP) projects, PPP participants are faced with a complex risk situation impeding the sustainable project delivery. In recent years, risk management of PPP projects has received increasing attention. In this paper, twenty risk factors associated with infrastructure PPP projects were identified by literature review and in-depth case studies. Relationship data for these twenty typical risk factors were obtained through structured interviews. Based on the obtained data, the risk relationship network within infrastructure PPP projects was identified, and the network structure characteristics were analyzed, including individual node attributes and the influence and cohesion of subgroups. The results indicate that key risk factor nodes can form a reaction chain via bridge nodes that can trigger a risk domino effect within PPP projects. Specifically, the key risk factors of PPP projects are divided into two categories, the first of which include risk factors that have powerful and independent influence, such as delay in government approval, government credit, and imperfect legal and regulatory systems. The second category includes risk factors that are highly vulnerable and easily influenced, such as completion risks, insufficient revenue in the market, and fee change. A key risk factor reaction chain is one in which legal change leads to a decline in government credit rating, triggering a contract risk. Twelve bridge nodes were identified that play an important intermediary role in the network, e.g., legal change, public objection, and financing risk. This paper extends the application of social network analysis in PPP projects management research and identifies the key risk factors and crucial factors influencing chain reactions in PPP projects. The results provide a more in-depth understanding of sustainable PPP project management for government agencies and private enterprises.

1. Introduction

With the accelerating rate of urbanization, the construction of infrastructure is also accelerating [1,2]. Due to a large number of infrastructure projects, the flow of capital from governmental bodies has difficulty meeting the needs of infrastructure development [3,4]. The public–private partnership (PPP) model combines the strong advantages of the provision of social capital funds with government policy advantages [5]. PPP has also made a great contribution to the sustainable development of infrastructure. PPP can be used as a catalyst for sustainable development in large infrastructure projects [6]. It aims to provide sustainable solutions for project maintenance, not only by improving product quality and reducing costs, but also by potentially shortening project duration, improving technical aspects of construction and maintenance methods, encouraging contractors to innovate, and reducing the project’s impact on users and the surrounding environment [7,8,9,10,11]. Thus, PPPs are being widely promoted around the globe, especially in developing countries that have been undergoing an infrastructure boom in recent years, such as Egypt [12], Ghana [13], China [14], etc. PPPs have been applied to well-known transportation infrastructure projects, power generation projects, water conservancy and hydro-power projects, and education projects [15]. According to the World Bank, in the first half of 2019 (H1 2019), private participation in infrastructure (PPI) investment stood at 49.8 billion USD across 175 projects, representing an increase of 14 percent from H1 2018 levels.
While there have been many successful infrastructure PPP projects, there have also been numerous failures and a variety of risks associated with them, including financial and political risks, as well as the risk of public rejection during the life cycle of PPP projects [16]. The implementation of PPP projects usually suffers from legal, political, and cultural impediments [17]. For example, the construction of the Channel Tunnel Project started in 1987. After increases in the construction costs and delays during the construction period, the company responsible for the project was forced to apply for bankruptcy protection in 2006 because of its heavy financial burden and high work level in its first ten years of operation [18]. The Toll Road Project in Mexico from 1989 to 1994 is a typical case of PPP project failure due to the insufficient capacity of government agencies and the unreasonable design of the project risk-sharing and bidding system [18]. The Philippine Power Supply Project was in trouble in 2002 due to the lack of operational capacity and experience with PPP projects of the Philippine National Power Company and the unreasonable build–operate–transfer risk–sharing design [18]. Responsibility for the Bird’s Nest stadium project in Beijing was re-claimed by the State-owned Assets Supervision and Administration Commission (SASAC) in 2009 due to the project company’s improper cost control measures, design mistakes, and other missteps, which resulted in the risk of increased project costs [19]. If such risks are not well managed, the time, cost, and operational performance of PPP projects can be affected [20], and in some cases, even lead to the suspension or failure of the project [21]. Taking China as an example and as the largest developing country, as of June 30, 2019, there were 9036 projects in the project management database, as per China’s PPP integrated information platform. However, from July 2018 to June 2019, 915 projects, accounting for about 10% of the total, were withdrawn from the project management database maintained by the government and the social capital center of China’s Ministry of Finance.
Research on the risk associated with PPP projects has focused on risk identification, risk evaluation, and risk allocation, as well as the exploration of methods for identifying factors related to the success or failure of PPP projects [22]. However, although the risks associated with PPP projects do not occur in isolation and have certain links and relationships with each other, there has been scant research on the relationship between the risk factors associated with PPP projects. To identify these risks, some researchers have attempted to identify risk factors related to the PPP of a particular project or country [23,24], and have generally categorized these as either being shared equally between the two parties or allocated primarily to the public or private partners [25]. Many scholars have studied the optimal allocation of risk factors between project participants [26,27,28]. Based on the principal-agent theory, some scholars have recognized and integrated the risks introduced by project stakeholders and proposed a structure of risk allocation for PPP projects [29]. Mazher et al. [30] proposed a decision approach based on non-additive fuzzy-integral-based multiple attribute risk allocation to effectively aggregate the assessment of each stakeholder’s risk management capability based on accepted risk allocation principles derived from the qualitative judgments and experience-based knowledge of experts. Rafaat et al. [12] identified, presented, and discussed risk allocation preferences for PPPs in Egypt that involve domestic wastewater treatment and seawater desalination, and the research findings of these authors enabled the development of an efficient risk allocation framework for water-sector PPPs in Egypt in the early stages of project development. Regarding PPP risk assessment, efforts have also been made to develop models for evaluating PPP risk values. Economic modeling and risk analysis are important processes for the appraisal of infrastructure and revenue-generating projects [9]. Li and Wang [31] proposed a systematic and practical method for identifying and assessing PPP risk factors that integrates the fuzzy analytic network process and interpretive structural modeling, which had not previously been used for risk assessment in the construction field. By combining two-dimensional linguistic information and the cloud model, Wu et al. [32] put forward a risk assessment framework for PPP waste-to-energy incineration projects. The framework proposed by Valipour et al. [33] adopted the step-wise weight assessment ratio analysis and complex proportional assessment methods to introduce new criteria for risk assessment.
Moreover, some studies on analyzing PPP risks and their relationships have adopted techniques, such as multiple-regression analysis [34], hybrid fuzzy cybernetic analytic network process model [35], two-dimensional linguistic information [32], fuzzy analytic hierarchy processes [36], fuzzy synthetic evaluation [37], etc. However, studies on these relationships and influences based on failed PPP cases is lacking. Besides, it is not common to analyze the relationship between PPP risk factors from the perspective of the social network.
This paper explores the following research question:
What is the relationship between the infrastructure PPP risk factors during the life cycle of an infrastructure PPP project?
The aims of our research are that: (i) identifying the relationship between PPP project risk factors more systematically; (ii) shedding new light on coping with the negative factors and the chain reaction between them in the process of sustainable development of infrastructure and (iii) providing a new risk assessment tool for risk management strategies in the field of infrastructure engineering and management.
The rest of this paper contains the following four sections. First, we review the existing literature to gain an understanding of the results of risk identification and risk assessment of PPP projects. Second, the methodology of this study is presented, including the research method, interview design, and data collection. Third, the relationships between the risk factors are considered, including the identification of risk factors, construction of a relationship network model, and analysis of key risk factors. In the final section, we discuss our findings and conclude that the relationship between risk factors must be better managed to minimize the risk of failure of PPP projects.

2. Literature Review

2.1. PPP Projects and Sustainable Development

The Brundtland Commission defined sustainable development in 1987 as a development that fulfills the needs of the present generation without compromising the ability of future generations to fulfill their needs [38]. Rijsberman and Van de Ven [39] argue that sustainability is not just about the needs of generations but also about the carrying capacity of supporting systems and about maintaining ecological, environmental, and hydrological integrity. Koppenjan and Enserink [5] distinguished between social, environmental, and financial sustainability. Social sustainability refers to the impacts of urban infrastructure on the affordability of and access to public service delivery by poorer groups within urban society [40,41]. Environmental sustainability refers to the impact of service delivery by public infrastructures on the urban population, urban environments, and the wider surroundings [42]. Financial sustainability refers to the possibilities of authorities to live up to the financial obligations that result from investments in infrastructures, both in the short and in the long run [43]. In order to guide the rapid urbanization process towards a more sustainable direction, one option is to further establish public-private partnerships through private sector participation in the development, maintenance, and operation of sustainable urban infrastructure.
However, there are some problems in this process as many PPP projects become unsustainable or even fail to be delivered. Some studies have begun to focus on the relationship between PPP risks and the sustainable development of PPP projects. Bai et al. [44] brought the concept of “sustainability” into the risk evaluation of PPP projects and constructs a factor system of sustainability risk of PPP projects covering five first-level factors and 72 second-level factors and evaluated the sustainability risk level of PPP projects. Yuan et al. [45] concluded that social and environmental impacts including construction delay, noise pollution, and inadequate compensation for land acquisition are more likely to cause social risks of transport PPP projects than economic impacts, thus affecting the social sustainability of transport PPP projects. Shen et al. [46] considered that the distribution of the contribution to project investment between private and public sectors is one of the key variables affecting the sustainability performance of PPP-type projects. Moreover, different types of organizations including public and private sector organizations are susceptible to reputational damage in different ways [47]. As for these organizations, most of the reputational risk was caused by the failure to fulfill their social responsibilities [48,49] and to implement sustainable and responsible supply chain management [50,51], which will eventually affect the sustainable delivery of PPP projects.
In conclusion, the public-private partnership (PPP) is a project delivery system that can play an important role in the sustainable development of public facilities and infrastructure. In this paper, we identified the key risk factors that can positively or negatively affect PPP (as a system) to achieve sustainability by investigating the relationship between the risk factors of PPP projects, so as to promote the sustainable development of infrastructure.

2.2. Risk Factors of PPP Projects

The PPP model has been widely used in many countries, and the PPP project process will experience interference from and be influenced by many risk factors. Hwang et al. [52] identified 42 critical risk factors that influenced PPP projects in Singapore, which were assigned to both the government and the private sector. Based on a literature review and interviews, Tang and Shen [53] proposed 18 risk factors related to the needs of stakeholders in a Hong Kong PPP project. Shao et al. [14] identified 29 residual value risk (RVR) factors associated with road PPP projects in China and their key characteristics. For ease of analysis, other researchers have placed risk factors into different categories.
Aziz and Shen [54] indicated that force majeure risks represent a risk category that requires delicate management as it could cause tremendous losses to the private party. Doloi [20] identified the risk attributes associated with the PPP procurement method across three dimensions, i.e., time, cost, and operational performance. Tang et al. [55] presented a literature review of PPP usage in Australia and identified four main categories of factors (procurement, stakeholder, risk, and finance). Ameyaw and Chan [13] grouped PPP risks into eight categories in their research on Ghana’s management of water supply projects, including political and regulatory risks, operational risks, market/revenue risks, financial risks, relationship risks, project and private consortium selection, social risks, and third-party risks. Generally, the PPP model could be applied in most countries to their conventional public services that directly affect the daily life of people, i.e., power, water supply, gas, sewage treatment, roads, and others [56,57,58]. Song et al. [24] conducted interviews, surveys, and visits to some selected PPP projects and identified ten key risks in their investigation of the key risks of PPP waste-to-energy incineration projects in China. The authors then performed a detailed analysis of these risks, which mainly included the risks associated with government decision-making, government credit, legal and policy issues, technical aspects, contract changes, public opposition, payment, and revenue. In a later study of PPP water supply infrastructure projects, Ameyaw and Chan [59] derived a risk factor list, ranked the factors, and described the ‘top-ranked’ risk factors as including poor contract design, water pricing, and tariff review uncertainty, political interference, public resistance to the PPP, construction time and cost overruns, non-payment of bills, lack of PPP experience, financing risk, faulty demand forecasting, high operational costs, and conflict between partners.

2.3. Methods of Risk Management

There are four logical processes of risk management including the identification of risks, analysis of the implications, responding to minimize risk, and allocating appropriate contingencies [60]. Some literature has investigated these aspects. Kivleniece and Quelin [61] recognized the triangular nature of public-private ties as the key mechanism shaping value distribution, and then identified governance-specific, asymmetric value claims by public actors and social activists as critical constraints on private value capture. Barlow et al. [62] argued that public-private partnerships in health care should be much more about ensuring that risks arising from the development and operation of healthcare infrastructure are optimally allocated between public and private partners through bundling activities and using the payment mechanism, thereby reducing the risk premium. Of course, there are some different types of governance mechanisms to address risks. Xiong et al. [63] took a holistic approach to identify eight governance mechanisms to address transaction hazards based on contracting theories, and concluded that flexibility, credibility, and competition are especially critical to determine the success or failure of PPP projects among them. Some work has explored topics such as renegotiation and contractual design as ways to address lifecycle uncertainty [64] as well as counterparty actions during PPP implementation and operations [65]. Dewulf and Garvin [66] presented two distinct but related investigations examining how governance strategies can address uncertainty in PPP projects and illustrated the necessity for responsiveness and complementarity of contractual and relational mechanisms in PPPs. Performance-based contracting schemes are also emerging in government procurement sectors [67], including as part of complex, performance-involving, public-private partnerships [68,69]. The performance-based contract is a promising contractual mode that enables business partners to adopt “use rather than own” strategies [70].
Some of the frequently adopted risk management analysis techniques have been reported in international construction management journals. Xu et al. [71] presented a detailed study of the contractual structure, risk-sharing scheme, risk response measures to critical risk factors, and project transfer of a PPP project. Tallaki et al. [72] conducted a systematic literature review and defined five constitutive areas, namely value for money, risk determination and allocation, financial risk transfer, contractualization of risk, and risk management in the post-construction phase. Based on Monte Carlo simulation, Ye and Tiong [73] developed a new method: the net-present-value-at-risk method, which can provide a better decision for risk evaluation of, and investment in, privately financed infrastructure projects. Hastak and Shaked [74] used the Analytical Hierarchy Process to analyze the hierarchy of risk indicators within each level and to determine the relative importance of the risk indicators by establishing priority among the criteria, sub-criteria, and indicators, proposing a risk assessment model for international construction projects. Researchers have been adopting more complicated methods. Thomas [75] et al. proposed a risk probability and impact assessment framework based on fuzzy-fault tree and the Delphi method, which includes extensive scenario modeling of critical risks in projects and systematic processing of professional judgment (subjective knowledge) of experts, and is developed and demonstrated in the context of critical risks in Indian build-operate-transfer (BOT) road projects. Wu et al. [76] employed a three-dimensional model that included probability, losses, and uncontrollability for risk assessment, and used an analytical hierarchy process for weight determination and the grey fuzzy method for assessment. Xiong et al. [77] proposed an ex-post risk management model that introduced renegotiations and early terminations, beginning with risk-impact evaluation and then the assessment, selection, and enforcement of ex-post risk response measures. There are some limitations and disadvantages in each of the above methods, which are listed in Table 1.

2.4. Social Network Analysis: An Effective Approach to Settle PPP Related Issues

Since Moreno introduced the concept of social network analysis (SNA) in 1934, SNA has become an effective tool for researchers and practitioners to simulate organizational structures and analyze the interaction between different individuals or groups [78]. SNA assumes that network members can interact with each other and their behavior is largely influenced by the relationship patterns embodied in the network structure [79]. From this perspective, SNA is to study how the social structure of the relationship around a person, group, or organization affects belief or behavior [80]. According to Borgatti et al. [81], networks are a way of thinking about social systems that focus our attention on the relationships among the entities that make up the system, which were called actors or nodes.
SNA has been widely used as an effective method to solve stakeholder related issues in the field of construction project management and other research fields [82]. SNA can help researchers identify key stakeholders and practical issues in their research. Li et al. [83] established the SNA model to deal with the schedule issues related to stakeholders in prefabricated construction projects. Based on network analysis, the authors believed that BIM-based information systems can be used to improve scheduling performance. Moreover, the nature of SNA, which analyzes the interdependencies of network objects, particularly of the network centralities, is such that it could be used to examine complex networks other than social structures, such as risk factor networks in which the causes of risks interact with each other [84]. Risks arising from technical, organizational, and environmental complexity can be analyzed using SNA to investigate the interrelationships between risk and accidental factors, as described in Li et al. [83], Mohammadfam et al. [85], Yang and Zhou [86], and Zhou and Irrizary [87]. Additionally, the uses of SNA are not limited to social studies for analyzing trust, communications, and other social structure networks, but the practitioners can also extend the uses of SNA to broader complex project management areas that involve interdependencies between activities and resources. For example, Luo et al. [88] adopted social network analysis to develop the risk network of the supply chain of a prefabricated building project in Hong Kong to prioritize the stakeholder-associated supply chain risk. Yu et al. [89] used social network analysis to investigate social risks related to housing demolition from a stakeholder perspective and their study contributed to the body of knowledge on social risk management via linking social risks with stakeholders. Yang and Zou [86] developed a social network analysis-based stakeholder-associated risk analysis method to assess and analyze the risks and their interactions in complex green building projects. In this study, we also employed SNA to investigate infrastructure PPP project risk factors because this method can link one risk factor with others and quantify the interactions among different network nodes.
In summary, many scholars have identified PPP project risks and proposed corresponding risk management methods, but there has been little research on the relationship between the risk factors associated with PPP projects, and the research that has been conducted was not thorough or in-depth. This paper summarizes the risk factors of PPPs based on a systematic search and sorting of relevant documents and presents a social network analysis of the relationships between the risk factors of PPP projects to generate new and effective approaches to risk management in infrastructure PPP projects.

3. Methodology

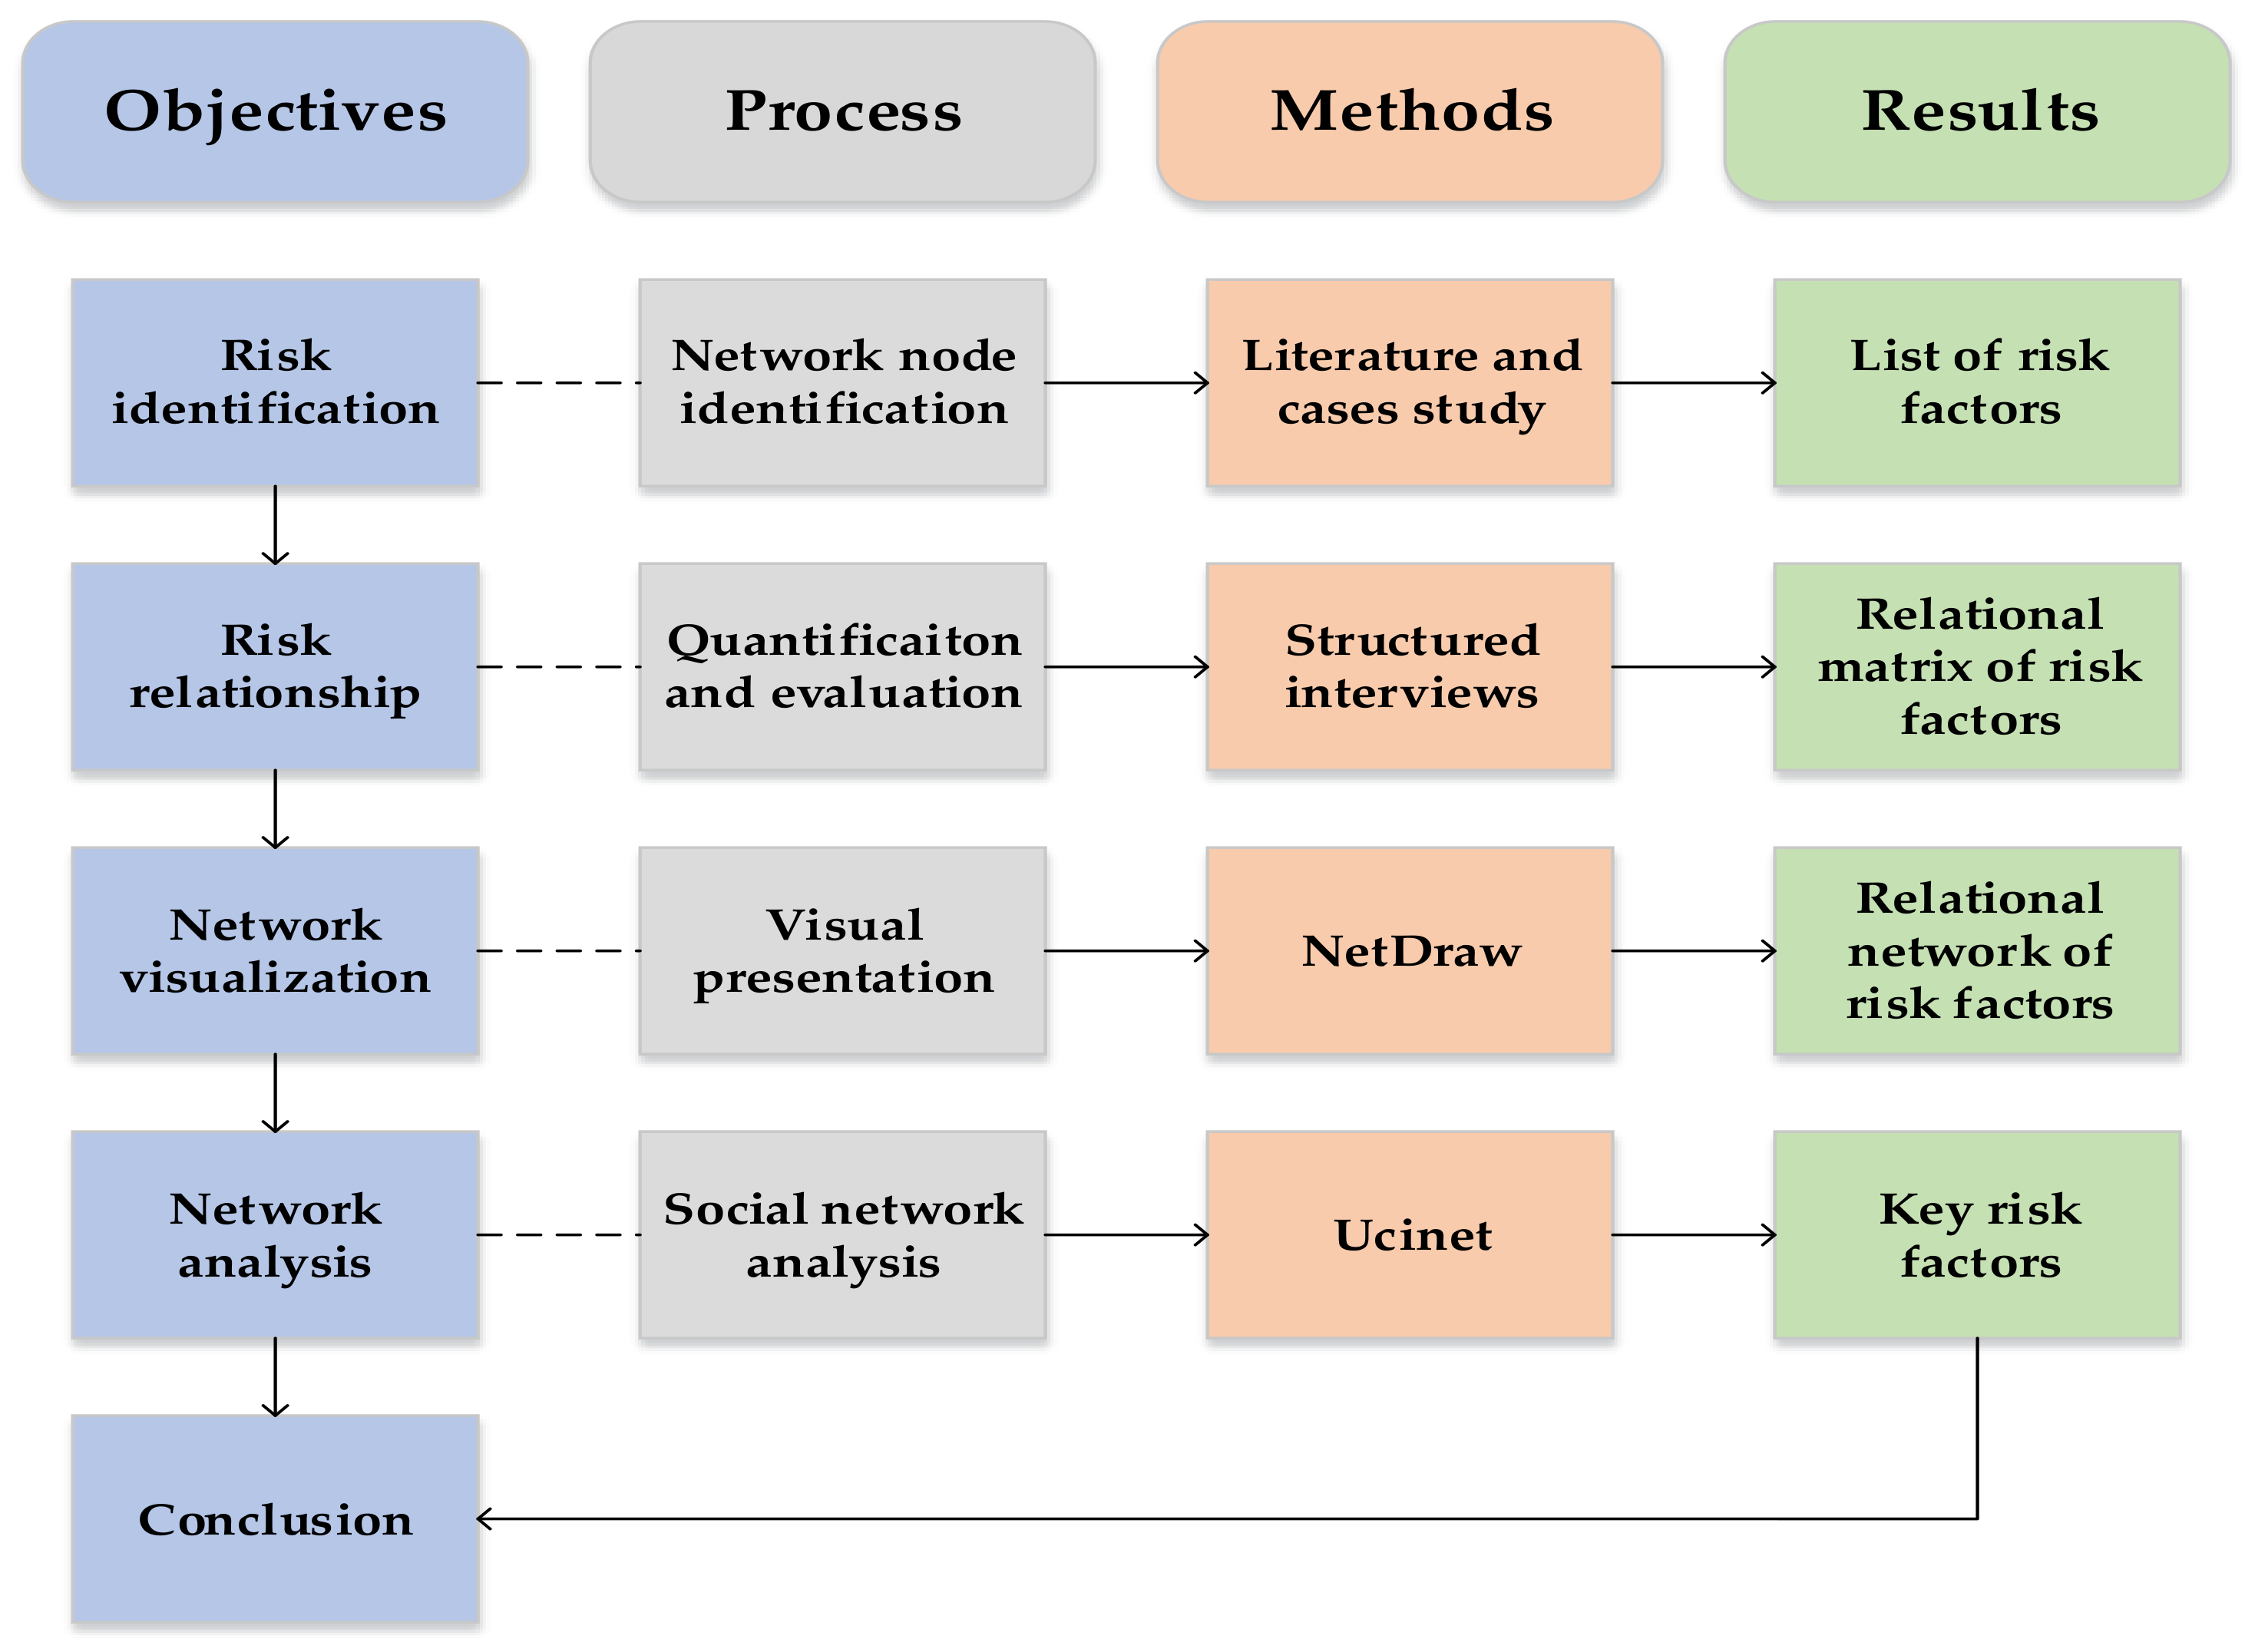
3.1. Research Methods

In this paper, the relationship network of PPP project risk factors is investigated and analyzed; the research framework for which is shown in Figure 1.
The five steps of this investigation and analysis of the relationship network between risk factors are as follows:
  • Determine the research object: To construct a social network model, the first and most important task is to determine the nodes in the network. In this study, the network nodes are the risk factors of each infrastructure PPP project.
  • Establish the interview design: Social network analysis was used to study the relationship between risk factors, which was facilitated by the use of Ucinet 6.0 software. The data processed by the software is expressed in matrix form. Therefore, this interview was formulated as a risk factor relationship matrix for scoring the weights of answers provided by experts and determining the magnitude of the impact of different factors in different directions.
  • Structured interviews and data collection: To facilitate data entry in the processing of data for this study, the results of the interview are expressed in the form of the matrix.
  • Conduct data quality test: The data quality was mainly dependent on whether the respondents gave consistent answers. Answers were consistently checked using Ucinet 6.0 software.
  • Analyze data: Data analysis was performed from two perspectives. First, the overall structural characteristics of the risk factor relationship network were analyzed to determine the closeness of the overall network structure. Second, the attributes and location characteristics of each node were determined. These two aspects are described based on different indicators, and their specific contents are presented in the following sections.

3.2. Interview Design and Data Collection

The research items of this interview were drawn from a collation of relevant literature. Based on our review of the literature and a series of failed infrastructure PPP projects (including a wide range of project types) in the past, we identified the risks preliminarily. Then, we summarized twenty risk factors common to PPP projects based on the interviews of experts, each of which is the key factor leading to their failure. Based on prior studies [90,91], this article argues that PPP "failure" refers to the phenomenon of contract cancellations, transfer of management rights, unrealizable value for money, project predicament or no operations, government buyback and severe losses. These cases were selected as typical examples of the failed PPP projects, and their unique characteristics and causes of failure are very consistent with the identification of key PPP risks. For example, F1 is legal change, which refers to the risk caused by a change in the validity of the project contract due to a relevant legal change after the promulgation of the project contract led to the failure of Shanghai Da Chang Waterworks project and Yan’an East Road Tunnel project in China. F19 is cost risk, which refers to risk arising from increased project costs due to improper cost control measures, design errors, or other factors, which led to the failure of China National Stadium Bird’s Nest PPP Project. These twenty risk factors are shown in Table 2.
Interviews were to collect data because they can provide a lot of information and face-to-face communication between researchers and interviewees. Ambiguities can be reduced by open discussion, and the reliability of data can be improved by information sharing among different participants [92]. In order to quantify the interactions among the identified risk factors, we conducted a series of structured face-to-face interviews. To ensure the quality and effectiveness of interviews, a purposive approach was employed to select the targeted interviewees. This approach is suggested by Le et al. [93]. All the interviewees have at least five years of experience in infrastructure PPP project management. The main consideration of selecting interviewees is the diversity of professional backgrounds. The interviewees include both academics and practitioners and involve various project roles, with the aim to increase the heterogeneity of the interview group and thus to expand the depth and width of interview information. Finally, five experienced industrial practitioners and academics were invited and participated in the interviews. Table 3 shows the profile of these five individuals. As for phenomenological studies, the recommended number of interviewees is approximately six [94,95]. This method is also used in related literature. In order to test the artificial neural network model for modeling (PPP) project risk allocation decision-making process, Jin and Zhang [96] obtained a test data set containing information about five PPP projects from a panel of five experts. Our research is considered to be a study of risk phenomena in PPP projects.
In the interview process, in order to minimize the ambiguity, when the participants were not clear about the interview questions, we would provide them with an oral explanation. In SNA, nodes represent identified risk factors. Links refer to the influence of a risk factor on other factors. For example, if there is a link from F1 to F2, it means that F1 can affect F2. Interviews required experts to assess the directions and effects of potential connections. Accordingly, there were two types of questions in this evaluation: (1) Can risk F1 affect F2 during the life cycle of a PPP project (the direction of the link)?; and (2) If F1 impacts F2, to what degree can F1 influence F2 (the degree of influence)? The results of the second type of questions were measured using a five-point scale, similar to studies conducted by Li et al. [83] and Yang et al. [97]. Here, “1” indicates the lowest level and “5” refers to the highest level.
We use X to represent the evaluation value of experts on the impact of risk factors (1 X 5 ) . When interviewing, it is inevitable that in some ways, the experts could not agree on the final evaluation result of one link. In this situation, we calculated the degree of variation (V = X max X min 5 , X max = the maximal value of the evaluation, X min = the minimal value of evaluation) to determine whether a re-evaluation should be performed to determine the weight of a link. In fact, V can be used as a simple parameter to measure the degree of variation in statistical samples [89]. If the degree of variation was acceptable (V 0.2), we used the median of the evaluation results to reflect the weight of this line [89]. If the degree of variation was not acceptable (V > 0.2), we organized online meetings with the experts through WeChat (a kind of online communication software developed by Tencent Company). Then, we re-evaluated until an acceptable result was produced. After two rounds of WeChat-based communication, the investigation formed an acceptable risk network.

3.3. Reliability Test

To determine the reliability and validity of the interview data, Ucinet 6.0 software was used to perform a consistency analysis of the data obtained in the interviews regarding the relationships of the PPP project risk factors.
According to the consistency test results, the ratio of the largest eigenvalue to the second-largest eigenvalue is 6.167. As this value is greater than 3, this indicates that in the questionnaire, respondents exhibited a consistent understanding of the relationship between risk factors in infrastructure PPP projects. In addition, all the experts scored higher than 0.5 in their ability to answer questions, scoring 0.519, 0.560, 0.579, 0.595, and 0.633, which indicates that their answers to questions were highly reliable. Therefore, the consistency analysis results confirm that the PPP project risk factor relationship data obtained from these five experts have high stability and reliability.

4. Results

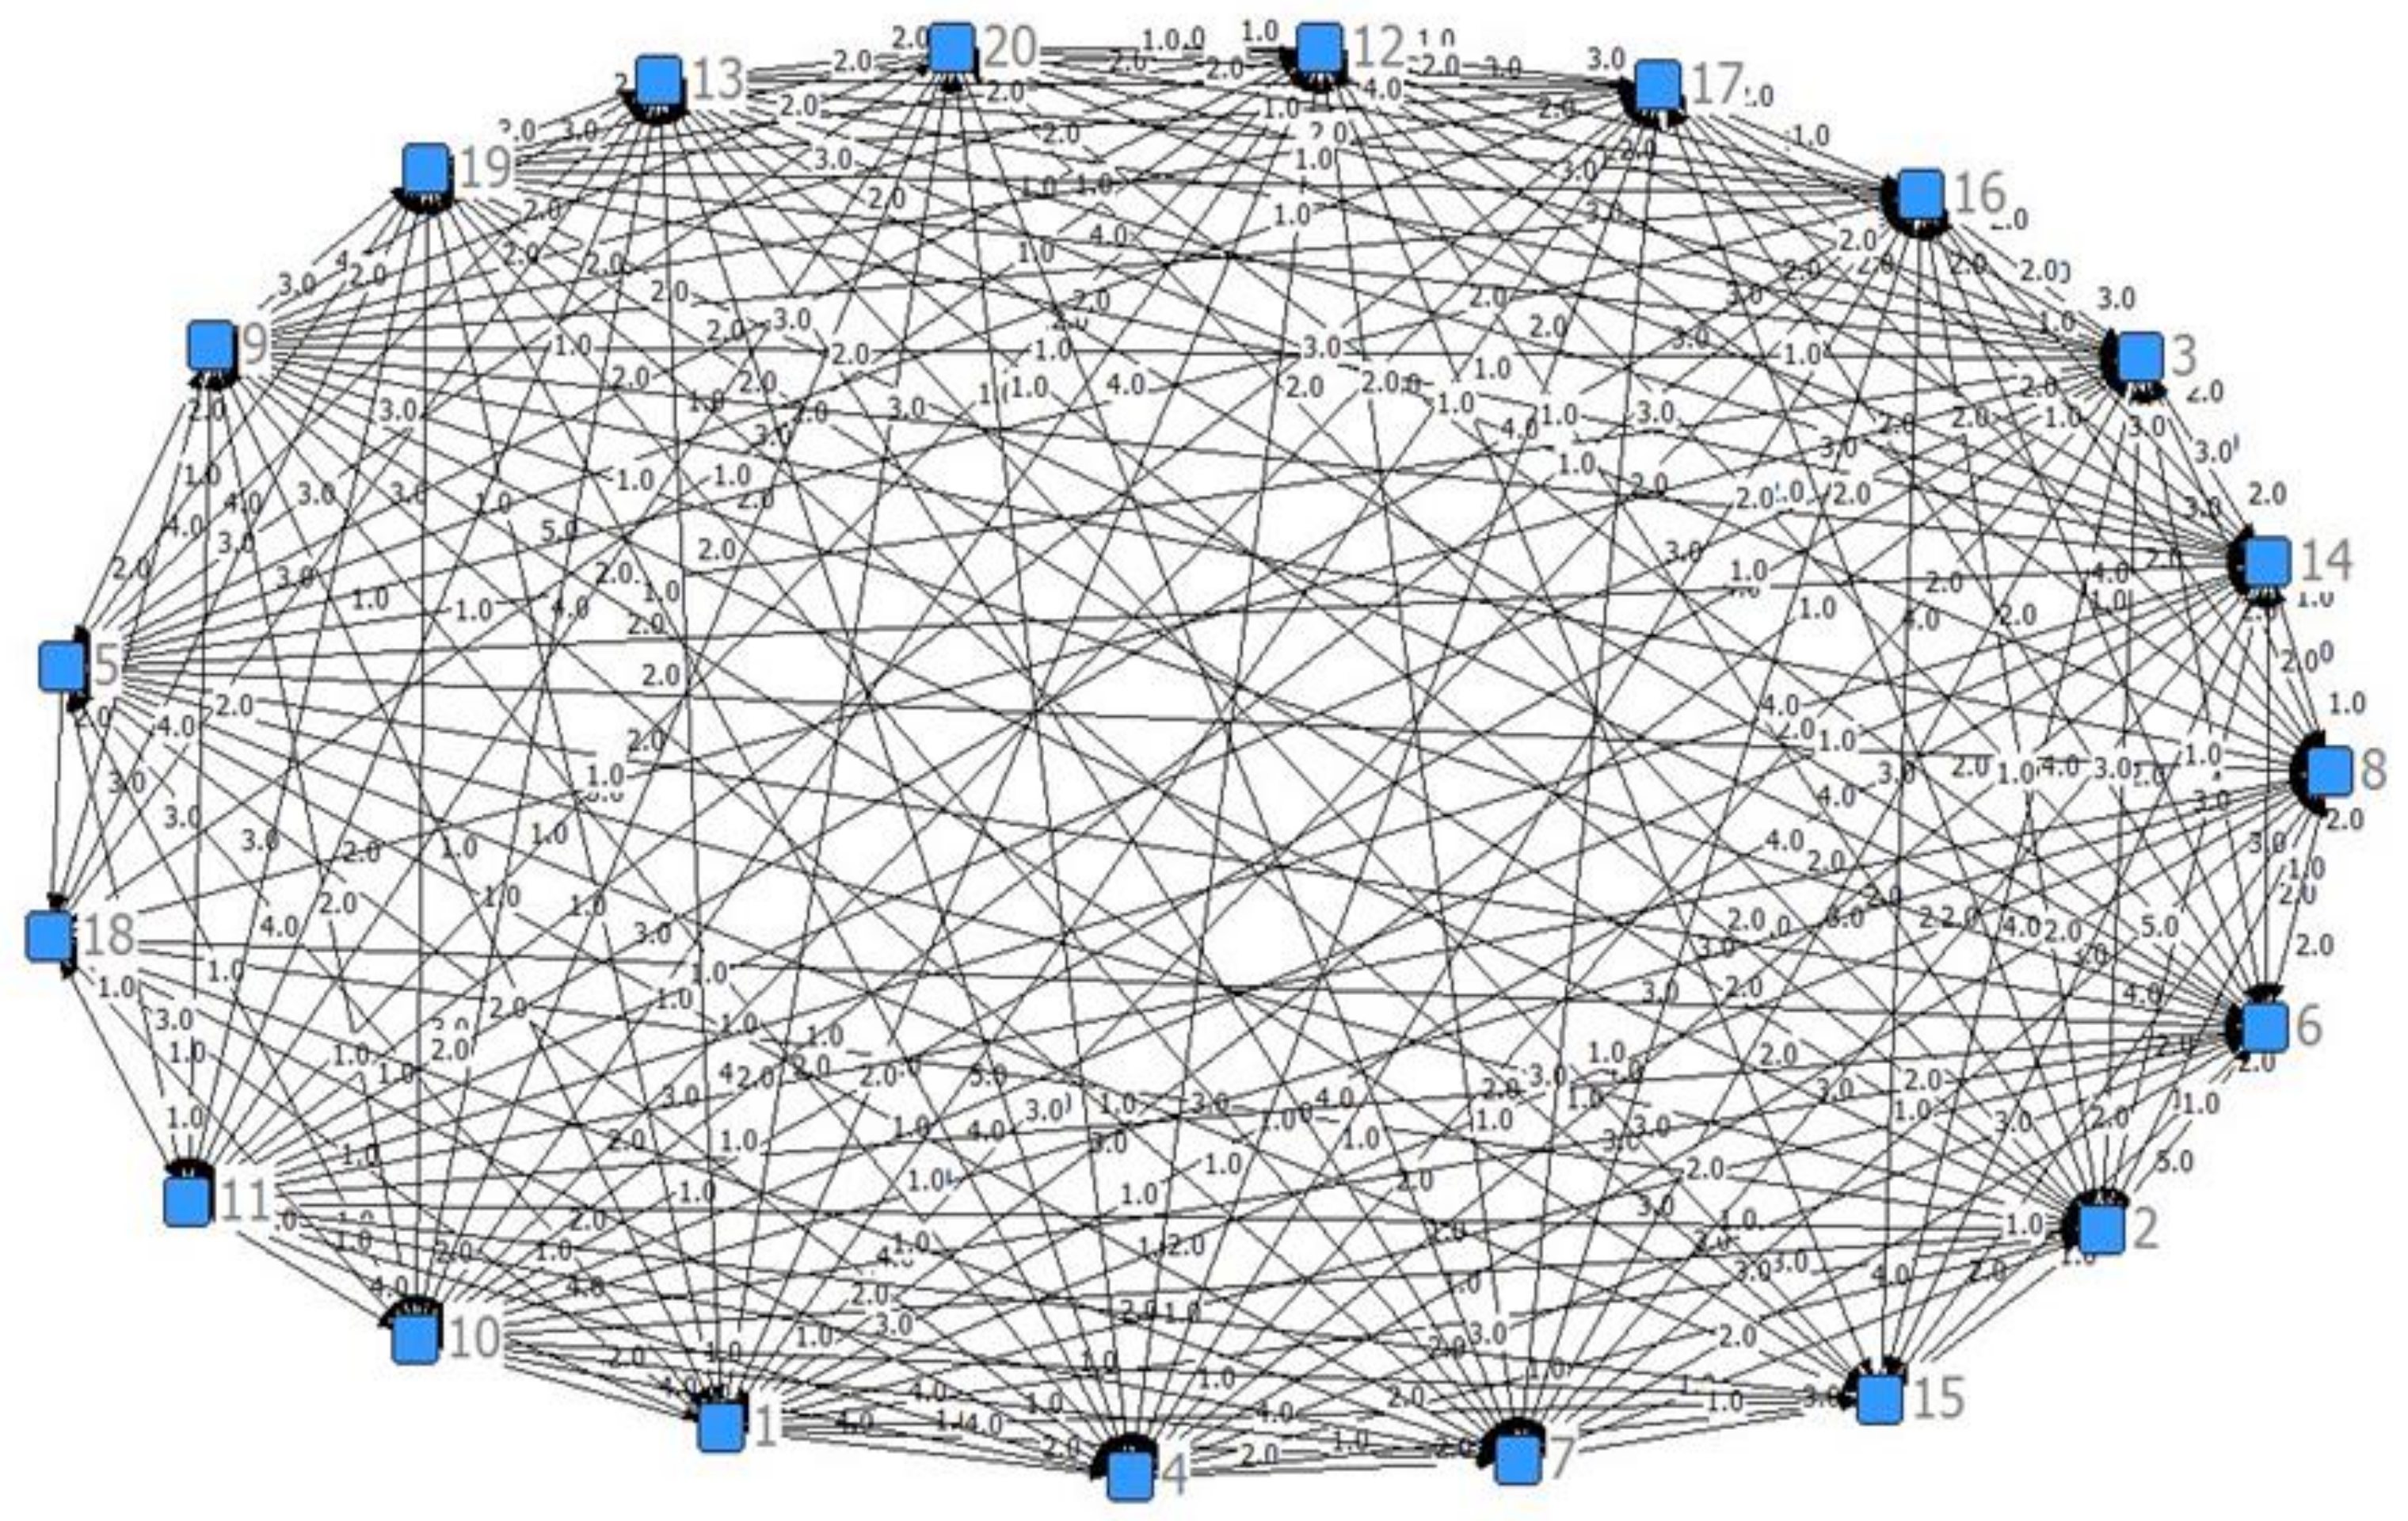
4.1. Relational Network Model

According to the social network concept, the PPP project risk factor network refers to the relationship network model formed by the interaction and correlation of risk factors in PPP projects. To establish a risk factor model for infrastructure PPP projects, the first step is to determine the model elements:
  • Network nodes: Determine each risk factor as the node of network construction.
  • Network relations: Ensure that the arcs constructed by the network model represent the relationships among various risk factors and that these arcs are directional segments.
  • Network relation assignment: Determine the strength of the influence relationships represented by the arcs in the relational network model.
  • Network relation matrix: Determine the relationship between the risk factor nodes as represented by the directed relational data, and establish a network relationship matrix based on the weight data provided by the experts for each arc.
Based on the risk factors identified in the literature and cases, five structured interviews were designed. The answers provided in the process of interviews were analyzed and summarized. After confirming the data consistency, a risk network relationship matrix for infrastructure PPP projects was constructed, as shown in Appendix A (Table A1). Each row element represents a factor having influence, and each column element, a factor being influenced. The element values indicate the intensity of the influence of the row element on the column element, which increases from 0 to 5.
After inputting the risk factor relationship matrix data, the NetDraw program in Ucinet 6.0 was used to construct the PPP project risk factor relationship network model, as shown in Figure 2.

4.2. Analysis of Relational Network Model

4.2.1. Analysis of the Characteristics of Relational Networks

(1)
Overall Network Density
First, using Ucinet 6.0 software, the overall network density was determined to describe the integrity of the relational network model. Overall network density refers to the closeness of the relationship between the nodes. In this paper, it refers to the closeness of the relationship between the risk factors. If Vi is used to represent the weight value of the arc, N is the number of nodes, then the total number of possible arcs is N (N-1), and the expression of the overall network density is:
i = 1 V i N N 1
The results indicate that the overall density of the PPP project risk factor relationship network model is 0.7079 > 0.5, which shows that the twenty common risk factors in this study have a high impact relationship, i.e., the risk factors are closely related, which increases the overall risk. When a project is associated with some risks, these are likely to lead to other risks that can participate in a chain reaction. As such, a relationship network consisting of these risk factors is subject to high risk. The standard deviation of the density of the network is 1.2779, which means there is a strong relationship between the risk factors in the model. By comprehensive analysis of the density and standard deviation of this network, we can infer that the project managers should strengthen their dynamic management of the overall project process.
(2)
Central Potential Index
The central potential index includes the degree central potential, closeness central potential, and betweenness central potential, as calculated by the Ucinet 6.0 software.
The central potential is used to describe whether a network graph has overall centrality around a point. In this paper, the relative centrality is selected for calculation, and the relative degree central potential index formula is:
C D   = i = 1 N C RDmax C RDi N 2
where C RDmax is the maximum value of the relative degree centrality, C RDi is the relative degree centrality of node i, and N is the number of nodes.
The betweenness central potential reflects the control power of the network over the whole. The formula of relative betweenness central potential is as follows:
C B = i = 1 N C RBmax C RBi N 1
where C RBmax is the maximum value of the relative betweenness centrality, and C RBi is the relative betweenness centrality of node i.
The closeness central potential reflects the degree of uncontrollability of the whole network. The formula of relative closeness central potential is as follows:
Cc = i = 1 N C RCmax C RCi N 1 N 2 2 N 3
where C RCmax   is the maximum value of the relative closeness centrality, and C RCi is the relative closeness centrality of node i.
In this study, the degree central potential (out-degree) and degree central potential (in-degree) of the PPP project risk factors network relationship model were determined to be 26.09% and 24.99%, respectively, which indicate that there is a possibility of linking around one node in the network, that is, there is a strong possibility of having a central point.
The betweenness central potential of the PPP project risk factors network relationship model is 2.55%, which is small. This indicates that there is little control effect by any one point on the network, that is, no betweenness point exists that plays the role of “intermediary,” and the interaction between nodes is not strong. This also indicates that there may be a risk of generating a chain reaction in the risk factor network of infrastructure PPP projects.
The closeness central potential of the PPP project risk factor network relationship model is 55.17%, which indicates that the relationship network in the model as a whole is not controlled by other risk factors. That is, the independence of each node is relatively high, so we can infer that although individual nodes may have a strong impact on other nodes, the force of this impact is less controlled by other nodes.
(3)
Small-World Indicators
In this paper, the characteristic path length is referred to as a small-world indicator, which was also analyzed using Ucinet 6.0 software. Small-world indicators reflect the sensitivity of risk factors; it refers to the average length of the shortest path between any two nodes.
According to the calculation results, the average distance between the risk factors of the network is 1.208, i.e., the risk factors in the model can influence each other via an average distance of 1.208 units, and their cohesion value is 0.896, which means that the cohesion between risk factors is strong so the risk is high. The distance between 301 nodes is 1, which accounts for 79.2% of the total logarithm. The distance between 79 nodes is 2, which accounts for 20.8% of the total logarithm. The distance of 1 thus accounts for the vast majority of the total logarithm, which means that it is easy for each risk factor to influence others.
Next, we performed a statistical analysis of the distance between risk factors, and the calculation results show that the standard deviation is 0.406, the variance is 0.165, the minimum distance is 1, and the maximum distance is 2. By synthesizing the above two tables, the average distance between each risk factor in the risk factor relationship network is found to be 1.208, with a maximum distance of 2, and a distance of 2 representing only 20.8% of the total logarithm. This shows that for most risk factors, there is no need for an "intermediary point" to establish a link and that links can be established directly.

4.2.2. Key Risk Factors of the PPP Project

The determination of the key risk factors of a PPP project depends on the magnitude of the impact of this factor on other factors and the closeness of the relationship. Social network analysis uses a centrality index to describe the capability of each node.
(1)
Degree Centrality
Degree centrality reflects the aggregation degree of the relationship between nodes. In weighted digraphs, they are divided into in-degree and out-degree. The calculation formula of in-degree at node i is
C i = j = 1 N X ji
The calculation formula of out-degree is
C o   = j = 1 N X ij
where X ji is the weight number of the arc from node j to node i, and X ij is the weight number of the arc from node i to node j.
In weighted digraphs, degree centrality is divided between out-degree and in-degree. Table 4 shows the results determined by the Ucinet 6.0 software, which indicates the out-degree and in-degree of the twenty key risk factors.
The above calculation results show that F2 (Imperfect legal and regulatory system) has the largest out-degree centrality of 56, followed by F1 (legal change), with 50, and the third to sixth places are F5, F6, F3, and F4, namely government credit, corruption, government decision-making errors, and delay in government approval. These results indicate that these six risk factors have the most direct effect on other factors and are at the core of the power of the relationship network. Among these factors, F2 (imperfect legal and regulatory system) and F1 (legal change) are the two most important. F5 (government credit), F6 (corruption), F3 (government decision-making errors), and F4 (delay in government approval) are governmental risks, which means that legal and governmental risks have the most significant impact on infrastructure PPP projects, which can easily lead to other kinds of risks that can then affect the normal and safe operation of the whole PPP project. Therefore, in the process of formulating or amending laws, legislative departments should seek and fully consider the opinions and interests of all parties. Government departments should strive to improve their efficiency, fully consider the input of all parties in their decision-making process, and avoid blind decision-making. Besides, the government should strengthen its internal management to prevent corruption. Supervisory authorities should fulfill their supervisory obligations and guarantee the government’s credit.
F19 (cost risk) has the maximum in-degree centrality of 55, followed by F11 (completion risk), with 52, with the third to sixth being F13, F16, F10, and F7, namely, fee change, contract risk, financing risk, and insufficient revenue in the market. This means that these six risk factors are the most directly affected by other factors in the relational network, and occupy the important positions in the network. These six risk factors are very likely to lead to the failure or termination of infrastructure PPP projects. In this regard, the social capital party and the project management company should pay close attention to controlling the cost and construction period, conduct more comprehensive market research, cooperate with government departments, and avoid and transfer various risks to the degree possible.
In the network of risk factors, F1 (legal change), F2 (imperfect legal and regulatory system), F5 (government credit), and F6 (corruption) have larger in-degree and smaller out-degree centralities. As such, they can be classified as "key risk sources" that have a greater impact on other risk factors and are less subject to influence by other risk factors. F10 (financing risk), F11 (completion risk), F16 (contract risk), and F19 (cost risk) also have larger in-degree and smaller out-degree centralities, but are classified as "risk results." As such, they are greatly influenced by other risk factors but have little impact on other risk factors.
(2)
Betweenness Centrality
Betweenness centrality in social network analysis is used to measure whether a node serves as an "intermediary." The greater the betweenness centrality, the stronger is its risk transmission ability and ability to control other risk factors. Assuming that there are node j and node k in the network diagram, the ability of the third node i to control the connection between j and k is expressed by gjk (i). The formula for calculating the absolute betweenness centrality of node i (recorded as CABi) is:
j N k N g jk i g jk   ,   j k i ,   and   j < k
where gjk (i) is the number of geodesic paths connecting j and k through i, gjk is the total number of geodesic paths connecting j and k. Table 5 shows the calculation results for the betweenness centrality of the PPP project risk factors network.
The calculation results show that F4 (delay in government approval) has the largest betweenness centrality and a nbetweenness centrality of 3.581%. The second to sixth places are F3 (government decision-making errors), F11 (completion risk), F13 (fee change), F7 (insufficient revenue in the market), and F5 (government credit), which play intermediary roles in the relationship network. These risk factors have a stronger risk transmission ability than other risk factors. However, due to the low potential for a betweenness center in the risk network and the low betweenness-center degree of each node, the intermediary role of these factors in the relationship network is not significant. Among these six risk factors, delay in government approval, government decision-making error, and government credit are governmental risks, which means that the risks generated by the government have a more serious and direct impact on the other risks. Governmental risks play a very important role in the network model of the risk factors of infrastructure PPP projects and are also the main transmitters of PPP project risk. Once governmental risks occur, they are very easily transferred to social capital risks, which can easily lead to stagnation or even failure of the project. Therefore, the occurrence of these risks must not only be prevented, but their relationships with the other risk factors must be cut off.
(3)
Closeness centrality
Closeness centrality indicates the degree to which a node is not controlled by other nodes. It refers to the sum of shortcut distance between a node and other nodes on the graph. The formula of absolute closeness centrality is:
C ACi = j = 1 N d ij
where d ij is the shortcut distance between node i and node j. Table 6 shows the calculation results for the closeness centrality of the PPP project risk factors network.
The closeness centrality results show that F11 (completion risk), F7 (insufficient revenue in the market), F13 (fee change), and F4 (delay in government approval) have the largest values, and their relative closeness centrality is 100%, followed by F19 (cost risk), F16 (contract risk), and F3 (government decision-making errors), for which the relative point-to-point centrality is 95%. These nodes have a high degree of point-to-point closeness to the center, which means that their corresponding risk factors are strongly independent and are not easily affected by other risk factors.
F4 (delay in government approval), F3 (government decision-making errors), F5 (government credit), F2 (imperfect legal and regulatory system), F6 (corruption), and F1 (legal change) have the greatest out-degree centralities, with a relative outcloseness centrality of 100%. As such, these nodes have a high degree of closeness to the center, which means that their corresponding risk factors have strong independence, and they are more likely to independently influence other risk factors.

4.2.3. PPP Project Risk Factor Impact and Response Chain

The Huber index takes into account the interaction among nodes. In this analysis, the attenuation factor (beta) is set to 0.5 following conventional research practice. Table 7 shows the ranking of influence as calculated by Ucinet 6.0 software.
The Row Sums impact index reflects the impact of nodes on other nodes, for which the top six ranked risk factors are: F2 (imperfect legal and regulatory system), F1 (legal change), F5 (government credit), F6 (corruption), F3 (government decision-making errors), and F4 (delay in government approval). These results indicate that legal risks, such as imperfect legal and regulatory systems and legal changes, have the most significant impact on other risk factors. Secondly, governmental risks, including government credit, corruption, government decision-making errors, and government approval delays, are very likely to cause the failure or suspension of the entire PPP project. Therefore, legal and governmental risks should be prevented as much as possible during the operation of the PPP project, which is consistent with the centrality analysis results presented in the previous section.
The Col Sums impact index reflects the impact of nodes affected by other nodes, for which the top six are F19 (cost risk), F11 (completion risk), F13 (fee change), F16 (contract risk), F10 (financing risk), and F7 (insufficient revenue in the market). This means that these six risks are very vulnerable to impact by other risk factors, and can easily lead to project failure or termination. In addition, the influential relationship matrix indicates that the most influential relationships include F1 (legal change) on F16 (contract risk) and F18 (interest rate risk); F2 (imperfect legal and regulatory system) on F6 (corruption); F5 (government credit) on F16 (contract risk); and F8 (change in market demand) on F7 (insufficient revenue in the market).

4.3. Factions and Cluster Analysis

Using the Ucinet 6.0 software, the risk factor relationship network matrix of the PPP project was analyzed. When the minimum size of the subgroups is set to six, five subgroups (or factions) are identified in the risk factor network, as shown in Table 8.
In Table 8, five small groups are listed, the members of which have a close, strong, and direct relationship in the PPP project risk factor network. As each element in these small groups is closely related, the occurrence of one risk factor can easily lead to the occurrence of the other risk factors. Moreover, these five factions contain some risk factors that can directly lead to project failure or termination, so the grouping of these risk factors is very likely to lead to PPP project failure. To improve PPP project management and prevent these risks, targeted precautions must be taken to these risk groups. According to the grouped risk factors shown in Table 8, a shared membership matrix can be obtained, as shown in Table 9.
This matrix indicates the PPP project risk factors of the five factions, in which the diagonal value represents the total number of members in each faction. Elsewhere, the row I, column J (i≠j) element denotes the number of members shared by the I and J factions (I and J range from one to five). For two different factions, their degree of intimacy is positively related to their number of shared members, and closely related factions are easily combined in the PPP project risk factor group. The clustering graph in Figure 3 is obtained by hierarchical clustering analysis of the shared membership matrix.
There are a large number of shared members in these five factions, which are referred to as "bridge nodes." Bridge nodes act as bridges between subgroups to spread influence. Strong relationships occur among the risk factors of infrastructure PPP projects that have directly related subgroups, and weak relationships are formed through "bridge nodes." Weak relationships improve the cohesion of the risk factor relationship network, that is, PPP project risk factors with corresponding bridge nodes will connect with more subgroups to yield a larger PPP project risk factor relationship network. Figure 3 shows that F1 (legal change), F4 (delay in government approval), F2 (imperfect legal and regulatory system), F6 (corruption), F9 (public objection), F10 (financing risk), F11 (completion risk), F12 (project uniqueness), F3 (government decision-making error), F13 (fee change), F5 (government credit), and F7 (insufficient revenue in the market) are members of all five factions. These risk factors also serve as bridge nodes in the relationship network. The risk factors represented by these nodes have an important role in the transmission of risk in the relationship network model. If these bridge nodes were to be removed from the subgroups, some of the remaining subgroups would not easily form networks but would become independent subgroups. In the process of PPP project risk management, it is necessary to strictly guard against these risks at all times to greatly reduce the risk they represent to the risk network and maintain the safe and stable operation of the PPP project.
In order to verify the consistency of the results, we conducted another round of structured interviews with five selected experts. Based on this, our research results were recognized by the experts. Moreover, some PPP projects failed due to these risk factors. For example, the Qingdao Veolia sewage treatment plant project mainly failed due to government credit. Its problem is that after the contract was signed, the government thought the price was unfair and unilaterally asked for renegotiation. The Chenganyu highway project failed due to a legal change and an imperfect legal and regulatory system. The specific problems described are that illegal subcontracting projects cause economic contract disputes, disturbance of visiting events, progress lagging behind, and a state of repeated suspension and resumption of work. After the adjustment of relevant national loan policies, the project company’s own capital turnover is difficult, the loan is difficult, and the capital chain is interrupted.

5. Discussion and Conclusions

This study started by identifying twenty key risk factors that can positively or negatively affect PPP (as a system) to achieve sustainability in infrastructure PPP projects, using a combination of various risk identification methods, such as case study, literature survey, and expert interviews. Then, SNA was used to discuss the PPP project risk factors and their complicated relationship, where the PPP project risk factor relationship network model was constructed based on the results of expert interviews. Moreover, a systematic analysis was conducted on the relationship between risks and their propagation mechanism through index analysis. The final sequence of factors, which can affect the sustainable development of infrastructure, was obtained as a result of an analysis of the dependencies between risk factors.

5.1. PPP Project Risk Factor Network Characterized by High Risk

According to the overall network density results, central potential analysis, and small-world index analysis, it can be concluded that the risk factors in infrastructure PPP projects are closely related and are characterized by high risk. Based on a literature review and centrality analysis, the key sources of risk in the network are legal change, imperfect legal and regulatory system, government credit, and corruption. These risk factors can be categorized as legal and governmental risks. Based on this conclusion, we established a link with the existing research and made a comparative analysis. Previous studies have also indicated that legal and governmental risks are key risks. For example, Song et al. [24] investigated the key risks of PPP waste-to-energy incineration projects in China and studied the strategies for managing these risks by drawing experience and learning lessons from these projects, and identified ten key risks including government decision-making risk, government credit risk, legal and policy risk, etc. Sastoque et al. [98] identified the risk allocation for the development of a public school in Colombia and indicated that the legal risk and the relationship risks are key factors for a successful PPP implementation. These risks depend on the government regulations and stability, but these risks have to be assumed by the private sector. Therefore, government responsibility is to provide the most stable conditions for project development. Valipour et al. [99] prioritized significant risks in freeway PPP projects based on an Iranian freeway PPP project and concluded that the top three risk groups of freeway PPP projects in Iran involve legal and political risks. So, we recommended that the government strengthen internal management, improve work efficiency, put the interests of the people first at all times, and strengthen its communication with social capitalists and project companies to achieve project success. Legislative departments should fully seek and consider public input in the process of promulgating laws, weigh the interests of all parties, and avoid legal changes. Financing risk, completion risk, contract risk, and cost risk are the identified "risk results" in the network, which can easily lead to the failure or termination of PPP projects.

5.2. Two Risk Factors of PPP Projects that are Influential and Greatly Affected by other Risk Factors

The closeness centrality analysis revealed that delays in government approval, government decision-making errors, government credit, imperfect legal and regulatory systems, corruption, and legal changes play important and independent roles in the network of risk factors. Osei-Kyei and Chan [100] reported that effective risk management, reduced public sector administrative cost, reduced project life cycle cost, and satisfying the need for public facility and service are criteria that are ranked higher in Hong Kong and lower in Ghana, and are directly related to efficiencies of cost and service delivery of PPP projects. Mazouz et al. [101] classified risks under three headings: macroeconomic risks, sociopolitical risks, and administrative risks, which must be carefully considered and avoided in the practice of PPP project risk management. Completion risk, insufficient revenue in the market, fee change, and delay in government approval were found to play an independent and affected role in the relationship network and are easily restricted by other factors. Doloi [20] also took these factors into account. Therefore, the focus should be on preventing these factors from affecting other factors and blocking their impact to the degree possible.

5.3. Chain of Risk Factors Links the Risk Factors Nodes of PPP Projects

According to the influence analysis results, there is a strong link between the reaction chain of legal change—government credit—contract risk and imperfect legal and regulatory system—corruption—change in market demand—insufficient revenue in the market. In PPP project risk management, attention must be paid not only to risk factors with high influence but also to the effective restriction of strong connections in the risk network and to cutting off the potential for a chain reaction between risk factors to avoid PPP project failure or suspension.

5.4. Key Bridge Nodes Link PPP Project Risk factor Subgroups in the Network

The cluster analysis results show that the important bridge nodes include legal change, delay in government approval, imperfect legal and regulatory system, corruption, public objection, financing risk, completion risk, project uniqueness, government decision-making error, fee change, government credit, and insufficient revenue in the market, which closely link the risk network. If we sever the bridges connecting these risk factors, this will reduce the overall network density of the overall network risk and enhance the security of the PPP project risk network.
There is a close interaction between PPP project risks, which has been neglected in the relevant literature. Furthermore, the existing research on the interaction of PPP risks lacked consideration of complexity among risks. Based on this, this study has adopted the SNA method to discuss the risk factors and their complicated relationship of infrastructure PPP projects. In addition, the method of SNA can provide a new risk assessment tool for risk management strategies in the field of sustainable infrastructure development management.
For the direction of our future research, our ideas are as follows: First, increase the number of experts, expand the scope of research, collect more detailed and extensive relational data, and use typical cases from China and around the world for more in-depth research. Second, introduce more PPP project risk accident cases in the study of risk factor relationships and the impact of the risk factor relationship network on PPP project risk accidents. The degree of influence of the risk factors of PPP projects on risk accidents should be further clarified by the construction of a more micro and comprehensive relationship network. Third, further explore the risk network for a specific type of PPP project (e.g. transportation, healthcare, etc.).

Author Contributions

Y.W. (Yan Wang) is the lead author of this publication, completing most of the writing of this paper. Y.W. (Yujie Wang) contributed to the formal analysis. X.W. provided many suggested revisions of the paper. J.L. proofread the entire paper. All authors have read and agreed to the published version of the manuscript.

Funding

This research is funded by the National Natural Science Foundation of China (Project Number: 71571130).

Conflicts of Interest

The authors declare no conflicts of interest. The funders had no role in the design of the study; in the collection, analyses, or interpretation of data; in the writing of the manuscript, or in the decision to publish the results.

Appendix A

Table A1. Risk Factor Relation Matrix.
F1F2F3F4F5F6F7F8F9F11F12F13F14F15F16F17F18F19F20
F10134221123241155432
F23044452133232134333
F31204432133222131232
F42220422124331112341
F53322021223342151243
F61233202242432132242
F70122220311241031110
F82112225002421020000
F91221224303242122130
F100222111114121110130
F111112111210121031140
F120222101302041131121
F131122223431301120020
F140021123124120133032
F150001003113010020030
F160022222104122000030
F171111103223320020040
F180011002001020000040
F190021201003030030000
F200011004023021021020

References

  1. Li, F.; Wang, R.; Paulussen, J.; Liu, X. Comprehensive concept planning of urban greening based on ecological principles: A case study in Beijing, China. Landsc. Urban Plan. 2005, 72, 325–336. [Google Scholar] [CrossRef]
  2. Ichimura, M. Urbanization, Urban Environment and Land Use: Challenges and Opportunities An Issue Paper. In Proceedings of the Asia-Pacific Forum for Environment and Development, Expert Meeting, Guilin, China, 23 January 2003; Volume 23. [Google Scholar]
  3. Zhu, J. Local Developmental State and Order in China’s Urban Development during Transition*. Int. J. Urban Reg. Res. 2004, 28, 424–447. [Google Scholar] [CrossRef]
  4. Wu, W. Reforming China’s Institutional Environment for Urban Infrastructure Provision. Urban Stud. 1999, 36, 2263–2282. [Google Scholar] [CrossRef]
  5. Koppenjan, J.F.M.; Enserink, B. Public–private partnerships in urban infrastructures: Reconciling private sector participation and sustainability. Public Adm. Rev. 2009, 69, 284–296. [Google Scholar] [CrossRef]
  6. Wessels, M. Stimulating sustainable infrastructure development through public–private partnerships. Proc. Inst. Civ. Eng. Procure. Law 2014, 167, 232–241. [Google Scholar] [CrossRef]
  7. Agarchand, N.; Laishram, B. Sustainable infrastructure development challenges through PPP procurement process. Int. J. Manag. Proj. Bus. 2017. [Google Scholar] [CrossRef]
  8. Carpenter, B.; Fekpe, E.; Gopalakrishna, D. Performance-Based Contracting for the Highway Construction Industry: An Evaluation of the Use of Innovative Contracting and Performance Specification in Highway Construction; Final Rep.; Koch Industries Inc.: Washington, DC, USA, 2003. [Google Scholar]
  9. Abdel Aziz, A.M.; Russell, A.D. Generalized economic modeling for infrastructure and capital investment projects. J. Infrastruct. Syst. 2006, 12, 18–32. [Google Scholar] [CrossRef]
  10. Anastasopoulos, P.C.; Labi, S.; McCullouch, B.G.; Karlaftis, M.G.; Moavenzadeh, F. Influence of highway project characteristics on contract type selection: Empirical assessment. J. Infrastruct. Syst. 2010, 16, 323–333. [Google Scholar] [CrossRef]
  11. Kwak, Y.H.; Chih, Y.; Ibbs, C.W. Towards a comprehensive understanding of public private partnerships for infrastructure development. Calif. Manag. Rev. 2009, 51, 51–78. [Google Scholar] [CrossRef]
  12. Rafaat, R.; Osman, H.; Georgy, M.; Elsaid, M. Preferred risk allocation in Egypt’s water sector PPPs. Int. J. Constr. Manag. 2020, 1–13. [Google Scholar] [CrossRef]
  13. Ameyaw, E.E.; Chan, A.P.C. Identifying public-private partnership (PPP) risks in managing water supply projects in Ghana. J. Facil. Manag. 2013, 11, 152–182. [Google Scholar] [CrossRef]
  14. Shao, Y.; Yuan, J.; Li, Q. Identification of the residual value risk factors for road PPP projects in China: Questionnaire survey and analysis. In Proceedings of the 20th International Symposium on Advancement of Construction Management and Real Estate; Springer: Berlin, Germany, 2017; pp. 379–389. [Google Scholar]
  15. Gurn, A.M. Courting Corporate Philanthropy in Public Education: Multi-Disciplinary Literature Review of Public–Private Partnerships (PPPs) in Urban Public Schooling. SAGE Open 2016, 6, 2158244016635714. [Google Scholar] [CrossRef] [Green Version]
  16. Zou, P.X.W.; Wang, S.; Fang, D. A life-cycle risk management framework for PPP infrastructure projects. J. Financ. Manag. Prop. Constr. 2008, 13, 123–142. [Google Scholar] [CrossRef]
  17. Abdel Aziz, A.M. Successful delivery of public-private partnerships for infrastructure development. J. Constr. Eng. Manag. 2007, 133, 918–931. [Google Scholar] [CrossRef]
  18. The Channel Tunnel Project. Available online: http://finance.china.com.cn/roll/20140722/2556871.shtml (accessed on 22 July 2014).
  19. The Bird’s Nest Stadium Project. Available online: https://www.sohu.com/a/142496023_798724 (accessed on 22 May 2017).
  20. Doloi, H. Understanding impacts of time and cost related construction risks on operational performance of PPP projects. Int. J. Strateg. Prop. Manag. 2012, 16, 316–337. [Google Scholar] [CrossRef]
  21. Wang, H.; Liu, Y.; Xiong, W.; Song, J. The moderating role of governance environment on the relationship between risk allocation and private investment in PPP markets: Evidence from developing countries. Int. J. Proj. Manag. 2019, 37, 117–130. [Google Scholar] [CrossRef]
  22. Cui, C.; Liu, Y.; Hope, A.; Wang, J. Review of studies on the public–private partnerships (PPP) for infrastructure projects. Int. J. Proj. Manag. 2018, 36, 773–794. [Google Scholar] [CrossRef]
  23. Liu, Y.; Sun, C.; Xia, B.; Liu, S.; Skitmore, M. Identification of Risk Factors Affecting PPP Waste-to-Energy Incineration Projects in China: A Multiple Case Study. Adv. Civ. Eng. 2018, 2018, 4983523. [Google Scholar] [CrossRef]
  24. Song, J.; Song, D.; Zhang, X.; Sun, Y. Risk identification for PPP waste-to-energy incineration projects in China. Energy Policy 2013, 61, 953–962. [Google Scholar] [CrossRef]
  25. Jayasuriya, S.; Zhang, G.; Yang, R.J. Challenges in public private partnerships in construction industry. Built Environ. Proj. Asset Manag. 2019. [Google Scholar] [CrossRef]
  26. Ma, G.; Du, Q.; Wang, K. A concession period and price determination model for PPP projects: Based on real options and risk allocation. Sustainability 2018, 10, 706. [Google Scholar]
  27. Shrestha, A.; Chan, T.-K.; Aibinu, A.A.; Chen, C.; Martek, I. Risk allocation inefficiencies in Chinese PPP water projects. J. Constr. Eng. Manag. 2018, 144, 4018013. [Google Scholar] [CrossRef]
  28. Xu, Y.; Chan, A.P.C.; Yeung, J.F.Y. Developing a fuzzy risk allocation model for PPP projects in China. J. Constr. Eng. Manag. 2010, 136, 894–903. [Google Scholar] [CrossRef]
  29. Shrestha, A.; Tamošaitienė, J.; Martek, I.; Hosseini, M.R.; Edwards, D.J. A Principal-Agent Theory Perspective on PPP Risk Allocation. Sustainability 2019, 11, 6455. [Google Scholar] [CrossRef] [Green Version]
  30. Mazher, K.M.; Chan, A.P.C.; Zahoor, H.; Ameyaw, E.E.; Edwards, D.J.; Osei-Kyei, R. Modelling capability-based risk allocation in PPPs using fuzzy integral approach. Can. J. Civ. Eng. 2019, 46, 777–788. [Google Scholar] [CrossRef]
  31. Li, Y.; Wang, X. Using fuzzy analytic network process and ISM methods for risk assessment of public-private partnership: A China perspective. J. Civ. Eng. Manag. 2019, 25, 168–183. [Google Scholar] [CrossRef] [Green Version]
  32. Wu, Y.; Xu, C.; Li, L.; Wang, Y.; Chen, K.; Xu, R. A risk assessment framework of PPP waste-to-energy incineration projects in China under 2-dimension linguistic environment. J. Clean. Prod. 2018, 183, 602–617. [Google Scholar] [CrossRef]
  33. Valipour, A.; Yahaya, N.; Md Noor, N.; Antuchevičienė, J.; Tamošaitienė, J. Hybrid SWARA-COPRAS method for risk assessment in deep foundation excavation project: An Iranian case study. J. Civ. Eng. Manag. 2017, 23, 524–532. [Google Scholar] [CrossRef] [Green Version]
  34. Jang, G.-W. Bids-Evaluation Decision Model Development and Application for PPP Transport Projects: A Project Risks Modeling Framework, The. Ph.D. Thesis, Colorado State University, Fort Collins, CO, USA, 2010. [Google Scholar]
  35. Valipour, A.; Yahaya, N.; Md Noor, N.; Mardani, A.; Antuchevičienė, J. A new hybrid fuzzy cybernetic analytic network process model to identify shared risks in PPP projects. Int. J. Strateg. Prop. Manag. 2016, 20, 409–426. [Google Scholar] [CrossRef]
  36. Li, J.; Zou, P.X.W. Fuzzy AHP-based risk assessment methodology for PPP projects. J. Constr. Eng. Manag. 2011, 137, 1205–1209. [Google Scholar] [CrossRef]
  37. Xu, Y.; Yeung, J.F.Y.; Chan, A.P.C.; Chan, D.W.M.; Wang, S.Q.; Ke, Y. Developing a risk assessment model for PPP projects in China—A fuzzy synthetic evaluation approach. Autom. Constr. 2010, 19, 929–943. [Google Scholar] [CrossRef]
  38. Imperatives, S. Report of the World Commission on Environment and Development: Our Common Future; Oxford University Press: Oxford, UK, 1987. [Google Scholar]
  39. Rijsberman, M.A.; Van de Ven, F.H.M. Different approaches to assessment of design and management of sustainable urban water systems. Environ. Impact Assess. Rev. 2000, 20, 333–345. [Google Scholar] [CrossRef]
  40. Wang, G.; Wu, P.; Wu, X.; Zhang, H.; Guo, Q.; Cai, Y. Mapping global research on sustainability of megaproject management: A scientometric review. J. Clean. Prod. 2020, 259, 120831. [Google Scholar] [CrossRef]
  41. Roseland, M. Toward Sustainable Communities: Solutions for Citizens and Their Governments; New Society Publishers: Gabriola Island, Canada, 2012; ISBN 0865717117. [Google Scholar]
  42. Gray, M.A. The United Nations Environment Programme: An Assessment. Envtl. L. 1990, 20, 291. [Google Scholar]
  43. Nair, D.G.; Enserink, B.; Gopikuttan, G.; Vergragt, P.; Fraaij, A.; Dalmeijer, R. A conceptual Framework for sustainable–affordable housing for the rural poor in less developed economies. In Proceedings of the 2005 World Sustainable Building Conference, Tokyo, Japan, 27–29 September 2005. [Google Scholar]
  44. Bai, L.; Li, Y.; Du, Q.; Xu, Y. A fuzzy comprehensive evaluation model for sustainability risk evaluation of PPP projects. Sustainability 2017, 9, 1890. [Google Scholar] [CrossRef] [Green Version]
  45. Yuan, J.; Wang, C.; Skibniewski, M.J.; Li, Q. Developing key performance indicators for public-private partnership projects: Questionnaire survey and analysis. J. Manag. Eng. 2012, 28, 252–264. [Google Scholar] [CrossRef]
  46. Shen, L.; Tam, V.W.Y.; Gan, L.; Ye, K.; Zhao, Z. Improving sustainability performance for public-private-partnership (PPP) projects. Sustainability 2016, 8, 289. [Google Scholar] [CrossRef] [Green Version]
  47. Wright, C.F. Leveraging Reputational Risk: Sustainable Sourcing Campaigns for Improving Labour Standards in Production Networks. J. Bus. Ethics 2016, 137, 195–210. [Google Scholar] [CrossRef]
  48. Wang, G.; He, Q.; Meng, X.; Locatelli, G.; Yu, T.; Yan, X. Exploring the impact of megaproject environmental responsibility on organizational citizenship behaviors for the environment: A social identity perspective. Int. J. Proj. Manag. 2017, 35, 1402–1414. [Google Scholar] [CrossRef] [Green Version]
  49. Amann, M.; Roehrich, J.K.; Esig, M.; Harland, C. Driving sustainable supply chain management in the public sector: The importance of public procurement in the European Union. Supply Chain Manag. 2014, 19, 351–366. [Google Scholar] [CrossRef] [Green Version]
  50. Roehrich, J.K.; Grosvold, J.; Hoejmose, S. Reputational risks and sustainable supply chain management: Decision making under bounded rationality. Int. J. Oper. Prod. Manag. 2014, 34, 695–719. [Google Scholar] [CrossRef]
  51. Hoejmose, S.; Roehrich, J.K.; Grosvold, J. Is doing more, doing better?: The relationship between responsible supply chain management and corporate reputation. Ind. Mark. Manag. 2014, 43, 77–90. [Google Scholar] [CrossRef]
  52. Hwang, B.-G.; Zhao, X.; Gay, M.J.S. Public private partnership projects in Singapore: Factors, critical risks and preferred risk allocation from the perspective of contractors. Int. J. Proj. Manag. 2013, 31, 424–433. [Google Scholar] [CrossRef]
  53. Tang, L.; Shen, Q. Factors affecting effectiveness and efficiency of analyzing stakeholders’ needs at the briefing stage of public private partnership projects. Int. J. Proj. Manag. 2013, 31, 513–521. [Google Scholar] [CrossRef] [Green Version]
  54. Aziz, A.A.; Shen, T.-L. Management of force majeure risks in Canadian PPP transportation projects. In Proceedings of the Construction Research Congress, San Juan, PR, USA, 31 May–2 June 2016; pp. 538–548. [Google Scholar]
  55. Tang, L.; Shen, Q.; Skitmore, M.; Cheng, E.W.L. Ranked critical factors in PPP briefings. J. Manag. Eng. 2013, 29, 164–171. [Google Scholar] [CrossRef] [Green Version]
  56. Rossi, M.; Civitillo, R. Public Private Partnerships: A general overview in Italy. Procedia-Soc. Behav. Sci. 2014, 109, 140–149. [Google Scholar] [CrossRef] [Green Version]
  57. Lee, C.H.; Yu, Y.-H. Service delivery comparisons on household connections in Taiwan’s sewer public–private-partnership (PPP) projects. Int. J. Proj. Manag. 2011, 29, 1033–1043. [Google Scholar] [CrossRef]
  58. Forsyth, T. Building deliberative public–private partnerships for waste management in Asia. Geoforum 2005, 36, 429–439. [Google Scholar] [CrossRef] [Green Version]
  59. Ameyaw, E.E.; Chan, A.P.C. Evaluation and ranking of risk factors in public–private partnership water supply projects in developing countries using fuzzy synthetic evaluation approach. Expert Syst. Appl. 2015, 42, 5102–5116. [Google Scholar] [CrossRef]
  60. Smith, N.J.; Merna, T.; Jobling, P. Managing Risk in Construction Projects; Blackwell Science Ltd: Victoria, Australia, 1998. [Google Scholar]
  61. Kivleniece, I.; Quelin, B. V Creating and capturing value in public-private ties: A private actor’s perspective. Acad. Manag. Rev. 2012, 37, 272–299. [Google Scholar] [CrossRef]
  62. Barlow, J.; Roehrich, J.; Wright, S. Europe sees mixed results from public-private partnerships for building and managing health care facilities and services. Health Aff. 2013, 32, 146–154. [Google Scholar] [CrossRef] [PubMed] [Green Version]
  63. Xiong, W.; Chen, B.; Wang, H.; Zhu, D. Transaction Hazards and Governance Mechanisms in Public-Private Partnerships: A Comparative Study of Two Cases. Public Perform. Manag. Rev. 2019, 42, 1279–1304. [Google Scholar] [CrossRef]
  64. Athias, L.; Saussier, S. Are public private partnerships that rigid? And why? Evidence from price provisions in French toll road concession contracts. Transp. Res. Part A Policy Pract. 2018, 111, 174–186. [Google Scholar] [CrossRef]
  65. Chung, D.; Hensher, D. Risk Management in Public–Private Partnerships. Aust. Account. Rev. 2015, 25, 13–27. [Google Scholar] [CrossRef]
  66. Dewulf, G.; Garvin, M.J. Responsive governance in PPP projects to manage uncertainty. Constr. Manag. Econ. 2020, 38, 383–397. [Google Scholar] [CrossRef]
  67. Behn, R.D.; Kant, P.A. Strategies for Avoiding the Pitfalls of Performance Contracting. Public Product. Manag. Rev. 1999, 22, 470–489. [Google Scholar] [CrossRef]
  68. Caldwell, N.; Roehrich, J.K.; Davies, A. Procuring complex performance in construction: London Heathrow Terminal 5 and a Private Finance Initiative hospital. J. Purch. Supply Manag. 2009, 15, 178–186. [Google Scholar] [CrossRef] [Green Version]
  69. Lewis, M.; Roehrich, J.K. Contracts, relationships and integration: Towards a model of the procurement of complex performance. Int. J. Procure. Manag. 2009, 2, 125–142. [Google Scholar] [CrossRef] [Green Version]
  70. Essig, M.; Glas, A.H.; Selviaridis, K.; Roehrich, J.K. Performance-Based Contracting in Business Markets. Ind. Mark. Manag. 2016, 59, 5–11. [Google Scholar] [CrossRef] [Green Version]
  71. Xu, Y.; Chan, A.P.C.; Xia, B.; Qian, Q.K.; Liu, Y.; Peng, Y. Critical risk factors affecting the implementation of PPP waste-to-energy projects in China. Appl. Energy 2015, 158, 403–411. [Google Scholar] [CrossRef] [Green Version]
  72. Tallaki, M.; Bracci, E.; Stefani, F. Risk Allocation and Management in PPP and PFI: Systematic Literature Review; Working Papers 2019038; University of Ferrara: Ferrara, Italy, 2019. [Google Scholar]
  73. Ye, S.; Tiong, R.L.K. NPV-at-risk method in infrastructure project investment evaluation. J. Constr. Eng. Manag. 2000, 126, 227–233. [Google Scholar] [CrossRef]
  74. Hastak, M.; Shaked, A. ICRAM-1: Model for international construction risk assessment. J. Manag. Eng. 2000, 16, 59–69. [Google Scholar] [CrossRef]
  75. Thomas, A.V.; Kalidindi, S.N.; Ganesh, L.S. Modelling and assessment of critical risks in BOT road projects. Constr. Manag. Econ. 2006, 24, 407–424. [Google Scholar] [CrossRef]
  76. Wu, Y.; Song, Z.; Li, L.; Xu, R. Risk management of public-private partnership charging infrastructure projects in China based on a three-dimension framework. Energy 2018, 165, 1089–1101. [Google Scholar] [CrossRef]
  77. Xiong, W.; Zhao, X.; Yuan, J.-F.; Luo, S. Ex post risk management in public-private partnership infrastructure projects. Proj. Manag. J. 2017, 48, 76–89. [Google Scholar] [CrossRef]
  78. Jones, F.E.; Moreno, J.L. The sociometry reader. Can. J. Econ. Polit. Sci. 1962, 28, 318–319. [Google Scholar] [CrossRef]
  79. Wasserman, S.; Galaskiewicz, J. Advances in Social Network Analysis: Research in the Social and Behavioral Sciences; Sage: Thousand Oaks, CA, USA, 1994. [Google Scholar]
  80. Lee, B.; Collier, P.M.; Cullen, J.; Gummesson, E. Case study research and network theory: Birds of a feather. Qual. Res. Organ. Manag. Int. J. 2007. [Google Scholar] [CrossRef]
  81. Borgatti, S.P.; Everett, M.G.; Johnson, J.C. Analyzing Social Networks; Sage: Thousand Oaks, CA, USA, 2013. [Google Scholar]
  82. Mok, K.Y.; Shen, G.Q.; Yang, J. Stakeholder management studies in mega construction projects: A review and future directions. Int. J. Proj. Manag. 2015, 33, 446–457. [Google Scholar] [CrossRef]
  83. Li, C.Z.; Hong, J.; Xue, F.; Shen, G.Q.; Xu, X.; Mok, M.K. Schedule risks in prefabrication housing production in Hong Kong: A social network analysis. J. Clean. Prod. 2016, 134, 482–494. [Google Scholar] [CrossRef] [Green Version]
  84. Lee, C.; Chong, H.; Liao, P.; Wang, X. Critical Review of Social Network Analysis Applications in Complex Project Management. J. Manag. Eng. 2018, 34, 4017061. [Google Scholar] [CrossRef] [Green Version]
  85. Mohammadfam, I.; Bastani, S.; Esaghi, M.; Golmohamadi, R.; Saee, A. Evaluation of Coordination of Emergency Response Team through the Social Network Analysis. Case Study: Oil and Gas Refinery. Saf. Health Work 2015, 6, 30–34. [Google Scholar] [CrossRef] [PubMed] [Green Version]
  86. Yang, R.J.; Zou, P.X.W. Stakeholder-associated risks and their interactions in complex green building projects: A social network model. Build. Environ. 2014, 73, 208–222. [Google Scholar] [CrossRef]
  87. Zhou, Z.; Irizarry, J. Integrated Framework of Modified Accident Energy Release Model and Network Theory to Explore the Full Complexity of the Hangzhou Subway Construction Collapse. J. Manag. Eng. 2016, 32, 5016013. [Google Scholar] [CrossRef]
  88. Luo, L.; Shen, G.Q.; Xu, G.; Liu, Y.; Wang, Y. Stakeholder-Associated Supply Chain Risks and Their Interactions in a Prefabricated Building Project in Hong Kong. J. Manag. Eng. 2019, 35, 5018015. [Google Scholar] [CrossRef]
  89. Yu, T.; Shen, G.Q.; Shi, Q.; Lai, X.; Li, C.Z.; Xu, K. Managing social risks at the housing demolition stage of urban redevelopment projects: A stakeholder-oriented study using social network analysis. Int. J. Proj. Manag. 2017, 35, 925–941. [Google Scholar] [CrossRef]
  90. Pinto, J.K.; Mantel, S.J. The causes of project failure. IEEE Trans. Eng. Manag. 1990, 37, 269–276. [Google Scholar] [CrossRef] [Green Version]
  91. Jamali, D. Success and failure mechanisms of public private partnerships (PPPs) in developing countries: Insights from the Lebanese context. Int. J. Public Sect. Manag. 2004, 17, 414–430. [Google Scholar] [CrossRef]
  92. Brinkmann, S. Det Kvalitative Interview; Hans Publishers: Berlin, Germany; Washington, DC, USA, 2014. [Google Scholar]
  93. Le, Y.; Shan, M.; Chan, A.P.C.; Hu, Y. Investigating the causal relationships between causes of and vulnerabilities to corruption in the Chinese Public Construction Sector. J. Constr. Eng. Manag. 2014, 140, 5014007. [Google Scholar] [CrossRef]
  94. Marshall, B.; Cardon, P.; Poddar, A.; Fontenot, R. Does sample size matter in qualitative research?: A review of qualitative interviews in IS research. J. Comput. Inf. Syst. 2013, 54, 11–22. [Google Scholar] [CrossRef]
  95. Denzin, N.K.; Lincoln, Y.S. Strategies of Qualitative Inquiry; Sage: Thousand Oaks, CA, USA, 2008; Volume 2, ISBN 1412957567. [Google Scholar]
  96. Jin, X.-H.; Zhang, G. Modelling optimal risk allocation in PPP projects using artificial neural networks. Int. J. Proj. Manag. 2011, 29, 591–603. [Google Scholar] [CrossRef]
  97. Yang, R.J.; Zou, P.X.W.; Wang, J. Modelling stakeholder-associated risk networks in green building projects. Int. J. Proj. Manag. 2016, 34, 66–81. [Google Scholar] [CrossRef]
  98. Sastoque, L.M.; Arboleda, C.A.; Ponz, J.L. A proposal for risk allocation in social infrastructure projects applying PPP in Colombia. Procedia Eng. 2016, 145, 1354–1361. [Google Scholar] [CrossRef] [Green Version]
  99. Valipour, A.; Yahaya, N.; Md Noor, N.; Kildienė, S.; Sarvari, H.; Mardani, A. A fuzzy analytic network process method for risk prioritization in freeway PPP projects: An Iranian case study. J. Civ. Eng. Manag. 2015, 21, 933–947. [Google Scholar] [CrossRef] [Green Version]
  100. Osei-Kyei, R.; Chan, A.P.C. Comparative analysis of the success criteria for public–private partnership projects in Ghana and Hong Kong. Proj. Manag. J. 2017, 48, 80–92. [Google Scholar] [CrossRef] [Green Version]
  101. Mazouz, B.; Facal, J.; Viola, J.-M. Public-private partnership: Elements for a project-based management typology. Proj. Manag. J. 2008, 39, 98–110. [Google Scholar] [CrossRef]
Figure 1. Research framework.
Sustainability 12 04152 g001
Figure 2. Visualization of Risk Factor Relational Network Model.
Sustainability 12 04152 g002
Figure 3. Cluster graph.
Sustainability 12 04152 g003
Table 1. Common methods for risk management.
MethodDisadvantageReference
Monte Carlo SimulationThe number of samples needed for it must be large enough to make the estimated distribution close to the real distribution.Ye and Tiong [73]
Analytical Hierarchy ProcessIt has less quantitative data and more qualitative components, which may not be convincing, and may not consider the relationship between risks.Hastak and Shaked [74]
Wu et al. [76]
Fuzzy Set TheoryThe fuzzy processing of simple information can reduce the control precision and dynamic quality of the risk management system.Thomas et al. [75]
Wu et al. [76]
The Grey Fuzzy MethodThe calculation is complex and the determination of the index weight vector is subjective in risk assessment.Wu et al. [76]
Table 2. List of risk factors.
Risk FactorsImplicationsCase SourcesLiterature Sources
F1 Legal changeRefers to the risk caused by a change in the validity of the project contract due to a relevant legal change after the promulgation of the project contract.Shanghai Da Chang Waterworks;
Yan’an East Road Tunnel
Song et al. [24]
F2 Imperfect legal and regulatory systemRisk caused by the absence or imperfection of current relevant laws.Quan Zhou Ertong Bridge, Fujian Province;
Yan’an East Road Tunnel Double Line
Ameyaw and Chan [13]
F3 Government decision-making
errors
Risk caused by errors or length of the government decision-making process that made the process unreasonable or inadequate staff capacity and experience.Qingdao Veolia Sewage Treatment Project Song et al. [24]
F4 Delay in Government ApprovalRisk caused by cumbersome approval process or inefficiency of staff in related departments.Beijing 10th Water PlantHwang et al. [52]
F5 Government CreditRisk caused by the government’s failure to perform, refusal to perform, or failure to perform contractual obligations for certain reasons.Changchun Huijin Sewage Treatment Plant; Xin yuan Four Bridges of Min Jiang RiverAmeyaw and Chan [59]; Song et al. [24]
F6 CorruptionIllegal income demanded by government officials or staff, resulting in increased company costs and increased risk of government default.Shenyang No. 9 Water PlantAmeyaw and Chan [13]; Ameyaw and Chan [59]
F7 Insufficient revenue in the marketOperating income was lower than expected due to poor project performance or services, which leads to a risk that the investment cannot be recovered.Tianjin Shuanggang Waste
Incineration Power Plant
Song et al. [24]
F8 Change in market demandMarket supply-demand relationship change due to macroeconomic changes and/or other reasons, which lead to the risk of a difference between market forecast and actual demand.Hangzhou Bay Cross-Sea Bridge;
Shandong Zhong Hua Power Generation Project
Shao et al. [14]; Ameyaw and Chan [59]
F9 Public objectionThe public interest is damaged due to a lack of environmental protection and/or other reasons, leading to the risk of public opposition to the continued construction of the project.Beijing 10th Water Plant;
Shanghai Da chang Water Plant
Ameyaw and Chan [13]; Song et al. [24]; Ameyaw and Chan [59]
F10 Financing riskRisk arising from difficulties in financing due to unreasonable financing structure, credit, or national policies.A power plant in Hunan Ameyaw and Chan [13]
Ameyaw and Chan [59]
F11 Completion RiskRisk of unfinished, delayed, or substandard project quality due to inappropriate project schedule control for various reasons.Chengdu Rail Transit Line 18 ProjectDoloi [20]
F12 Project UniquenessRisk arising from commercial competition due to government building or remodeling of other similar projects.Xin yuan Four Min Jiang River Bridge;
Hangzhou Bay Sea-Crossing Bridge;
Ameyaw and Chan [13]
F13 Fee changeRisk arising from changes in fees due to unreasonable or inconsistent charges for project products and services.Beijing Metro Line 4;
Kaifeng Sports Center Project
Xu et al. [71]
F14 Poor project company managementRisk resulting from improper management of project company due to an unreasonable bidding process and internal conflict in the project company.Hua shan Service Area Project;
Hangzhou Bay Bridge Project
Ameyaw and Chan [13]
F15 Force MajeureFactors, such as natural disasters, wars, or other risks to the project that cannot be predicted, controlled or prevented.A power plant in HunanAmeyaw and Chan [59];
Aziz and Shen [54]
F16 Contract riskRisk arising from the refusal or failure of a party to fulfill contract obligations for certain reasons.Shanghai Da chang Water Plant;
Lian Jiang China-France Water Supply Plant
Ameyaw and Chan [13]; Song et al. [24]; Ameyaw and Chan [59]
F17 Environmental riskRisk arising from violations of environmental regulations or pollution that require increased investment to continue operation or project failure. Domestic Waste Incineration Power Plant
in Western Qin Huang Dao
Xu et al. [71]
F18 Interest rate riskChange in the market interest rate that leads to investment difficulty for social capitalists, thus increasing the project risk.Guangxi Lai Bin Waste Incineration Power PlantAmeyaw and Chan [13]; Ameyaw and Chan [59]
F19 Cost riskRisk arising from increased project costs due to improper cost control measures, design errors, or other factors.China National Stadium Bird’s Nest PPP Project Doloi [20]; Ameyaw and Chan [59]
F20
Inadequate
Infrastructure
Risk arising from factors such as inadequate project-related infrastructure and its consequent impact on project progress.Lake Townsend Sewage Treatment Plant Xu et al. [71]
Table 3. Profile of the experts and scholars.
No.RoleCompany
Type
Experience in
The Sector
Major Research
Fields
1Project ManagerContractorFive yearsProject Management
2Cost ManagerContractorEight yearsCost Management
3EngineerContractorSix yearsThe entire project management process
4Investment managerContractorFive yearsProject investment and financing management
5ProfessorCollegeTwenty yearsPPP project management mode
Table 4. Degree Centrality.
NodeOut-DegreeIn-DegreeNodeOut-DegreeIn-Degree
F25621F82829
F15016F172824
F54833F122734
F64728F112652
F34535F102544
F44438F162448
F94029F202116
F133251F151611
F143221F191555
F73143F181421
Table 5. Betweenness Centrality.
NodeBetweennessnBetweennessNodeBetweennessnBetweenness
F412.2483.581F142.8940.846
F39.8582.882F22.8630.837
F118.1022.369F162.1220.621
F137.0862.072F82.0450.598
F76.6951.958F11.7790.520
F56.2951.841F171.1640.340
F105.1031.466F190.5590.175
F93.7781.105F200.1620.047
F63.1390.918F150.1620.047
F122.9260.856F180.0710.021
Table 6. Closeness centrality.
NodeinClosenessoutClosenessNodeinClosenessoutCloseness
F11100.0090.48F1282.6182.61
F7100.0086.36F1482.6186.36
F13100.0086.36F979.1795.00
F4100.00100.00F276.00100.00
F1995.0061.29F676.00100.00
F1695.0073.08F1773.0879.17
F395.00100.00F1870.3761.29
F1090.4886.36F1570.3765.52
F886.3676.00F167.86100.00
F586.36100.00F2063.3370.37
Table 7. Influence Ranking.
NodeRow SumsCol SumsNodeRow SumsCol Sums
F11.0391.013F111.0211.041
F21.0441.017F121.0211.027
F31.0361.028F131.0251.040
F41.0351.030F141.0251.017
F51.0381.026F151.0131.009
F61.0371.022F161.0191.038
F71.0251.034F171.0221.019
F81.0221.023F181.0111.017
F91.0321.023F191.0121.043
F101.0201.035F201.0171.013
Table 8. Factional table.
Five Factions
1: 1 2 3 4 5 6 7 9 10 11 12 13 14 16 17 19 20
2: 1 2 3 4 5 6 7 8 9 10 11 12 13 14 16 17
3: 1 2 3 4 5 6 7 8 9 10 11 12 13 14 15 16
4: 1 2 3 4 5 6 7 9 10 11 12 13 14 15 16 19
5: 1 2 3 4 5 6 7 9 10 11 12 13 18 19
Table 9. Shared Membership Matrix.
12345
11715141513
21516151412
31415161512
41514151613
51312121314

