Article

Implantable Magnetic Resonance Wireless Power Transfer System Based on 3D Flexible Coils

School of Electronic and Information Engineering, Beijing Jiao Tong University, Beijing 100044, China
*
Author to whom correspondence should be addressed.
Sustainability 2020, 12(10), 4149; https://doi.org/10.3390/su12104149
Submission received: 22 April 2020 / Revised: 14 May 2020 / Accepted: 14 May 2020 / Published: 19 May 2020

Abstract

:
A magnetic resonance wireless power transfer system based on flexible 3D dual-coil is proposed and implemented in this paper. Firstly, a magnetic coupling resonant circuit model based on dual-coil is established, and the analysis indicates that enlarging the coil inductance and quality factor can effectively improve the transfer efficiency and performance. The coil parametric model is created by HFSS (High Frequency Structure Simulator), the effects of structural parameters on the coil inductance and quality factor are analyzed, and the optimized coil structure parameters are determined. To achieve maximum power transfer, the coupled resonant model after impedance matching is established and simulated in HFSS, and S11 reaches −30 dB at 13.56 MHz. Considering the radiation on human tissues, the SAR (Special Absorption Rate) value is evaluated simultaneously. To confirm the validity of the proposed prototype, the efficient wireless power transfer system composed of two flexible and biocompatible coils with 10 mm radius has been verified by the experimental measurements, and measure results show that the output power is 70 mW, when the transfer distance is 6 mm, the input power is 200 mW, and the maximum transfer efficiency is 35%.

1. Introduction

With the rapid development of biomedical, implantable medicine has become a very promising treatment. The application of WPT (Wireless Power Transfer) in implantable medicine is not only reflected in some special joints, such as [1,2,3,4,5,6], which makes energy transfer easier in such parts, and for some special disease groups, like blind and deaf people, the emergence of [7,8] brought the gospel to these patients. In addition to applications in implantable therapy, WPT has great potential in the industry [9,10,11]. Compared to wired charge, wireless power transfer systems offer an efficient, flexible means of charging electric vehicles (EV) [12] from multiple classes and at a range of power levels from a common ground source. In order to make the charging system more robust, S. K. Samal [13] analyzes the effects of the operating parameters on the system performance. Moreover, the coil optimal design is indispensable for improving the system performance. F. Corti et al. [14] present an EV wireless charging system, and the combination of Series-Series compensation and full active rectifier (FAR) makes the costs, size, and weight reduction possible, ensuring high conversion efficiency.
The emerging robotics technology has attracted more and more attention. I. Sato et al. [15] propose a wireless power transfer system for automatically charging the inspection robot in cable tunnels. C. Anyapo [16] presents the development of a battery-free mobile robot using dynamic wireless power transfer (DWPT). The DWPT can replace batteries, with which the load capacity and the operation ratio of the mobile robot can be improved. To generate propulsion force for the micro-robot, a high-efficiency wireless power transfer (WPT) and force transfer system for a micro-robot is proposed, and both the efficiency of electrical energy transfer and the generation of propulsion force can be significantly improved. In addition, a possible solution for a wireless recharging connection [17], able to drastically simplify underwater robotics recharge operations in underwater environment at abyssal depth (thousands of meter depth), is investigated.
The rapid development of wireless power transfer technology brings forth innovative vehicle energy solutions and breakthroughs utilizing wireless sensor networks (WSNs) [18]. Existing trajectory planning schemes for wireless chargers fail to optimize the one-to-many characteristic of wireless charging. There exists a trade-off between charging efficiency and trajectory distance. To address this trade-off, N. Wang et al. [19] propose the idea of charging bundle, and optimize the charger’s trajectory based on the charging bundle rather than each sensor. I. Krikidis [20] studies a simple network topology, where a sensor node harvests energy from radio frequency signals (transmitted by a dedicated energy source) to transmit real-time status updates without further energy management.
Moreover, implantable medical devices [21,22,23] or implantable micro-robots [24,25,26,27] in the human body can perform operations, such as drug delivery [28], monitoring of vital signs [29], detecting gastrointestinal motility [30], electrical stimulation [31], or an optical stimulation treatment of brain diseases, bringing new solutions for the diagnosis, monitoring, and treatment of diseases.
Although these implantable medical devices have brought good news to many patients, the energy supply of these devices has become an important factor limiting their development. Traditional battery power supply requires periodic replacement due to limited capacity and poor biocompatibility, which contributes to immeasurable pain and inconvenience to patients. In contrast, wireless power transfer featured with significant advantages has received increasing attention in the research of implantable medical and wearable devices. High transfer efficiency is critical for such implantable medical devices. To improve PTE (Power Transfer Efficiency), different methods have been proposed in [32,33,34,35]. In order to improve reliability and availability, Md. Rubel Basar proposed a three-coil inductive link; the merit of this design [2] is that it improves the system’s RPS (Received Power Stability). The disadvantage is that the transmission efficiency is relatively low. Quan Ke proposed a wireless power transfer system [3] for the endoscope micro-robot. Despite the large size of the transmit coil and the four-coil design, transmission efficiency has not increased significantly. In addition, in order to achieve an efficient wireless power supply for brain implanted devices, Manoufali M designed a corresponding impedance matching circuit [4] with a transmission loss of -30.12 dB. There is a need for new WPT schemes that can support good flexibility and enhanced performance. In this paper, an efficient, miniaturized wireless power transfer system for implantable medicine is proposed.
This paper is organized as follows: Section 2 formulates the design method and analysis of dual-coil based on magnetic resonance link. Section 3 elaborates the coil structure parameter optimization, impedance matching circuit design, and Special Absorption Rate (SAR) simulation. Experimental results and results analysis are presented in Section 4. Finally, Section 5 concludes the paper.

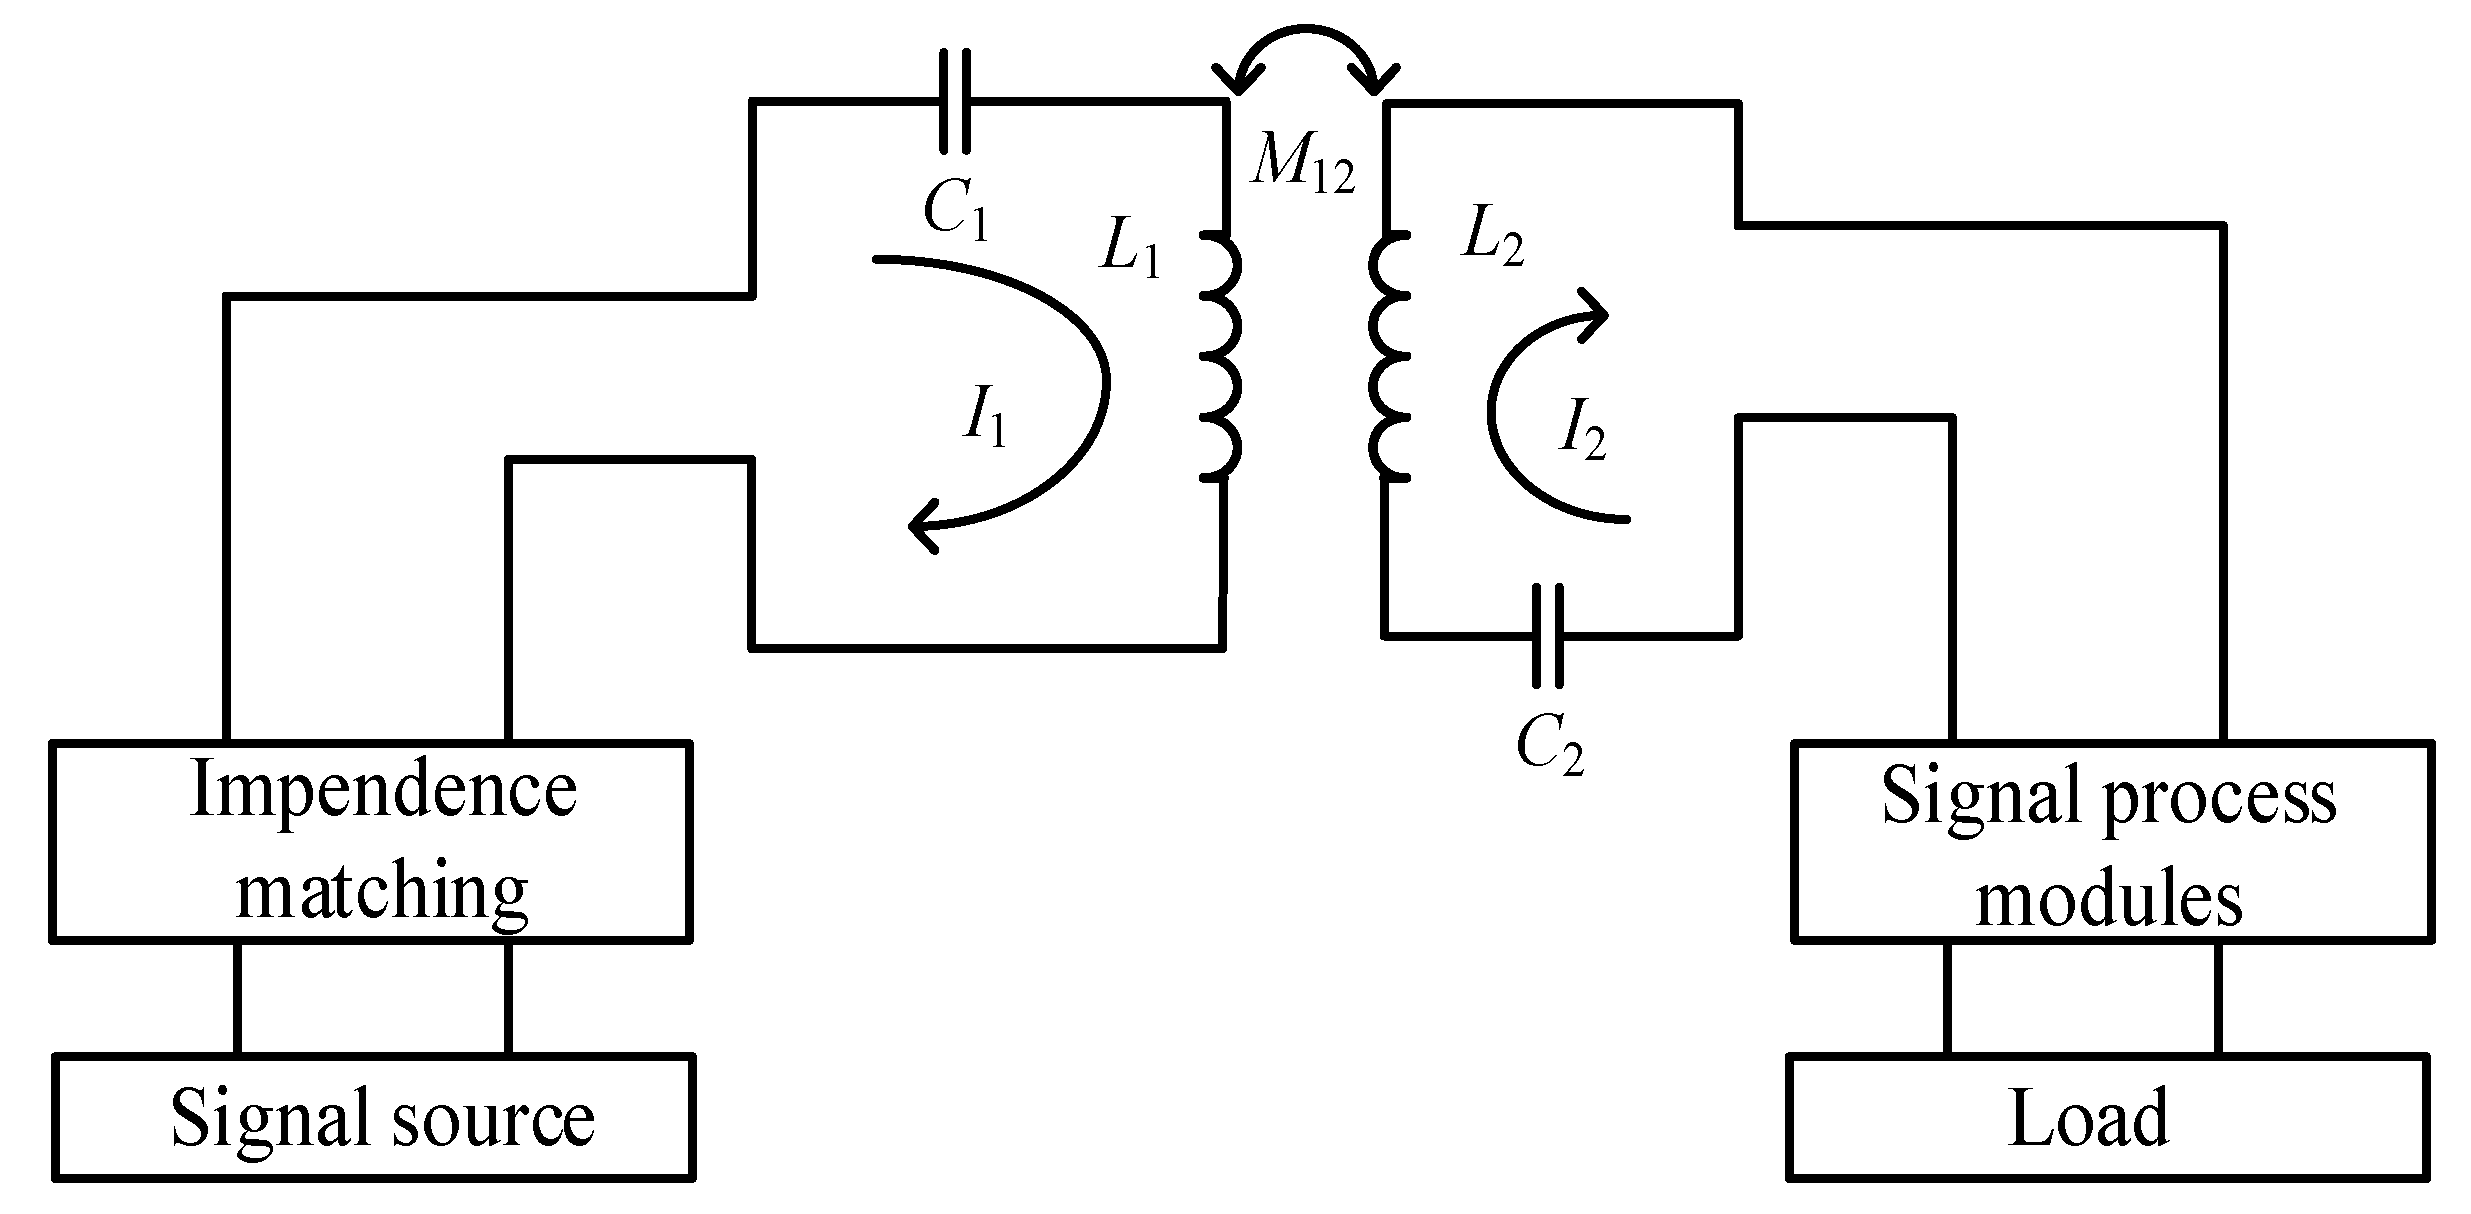
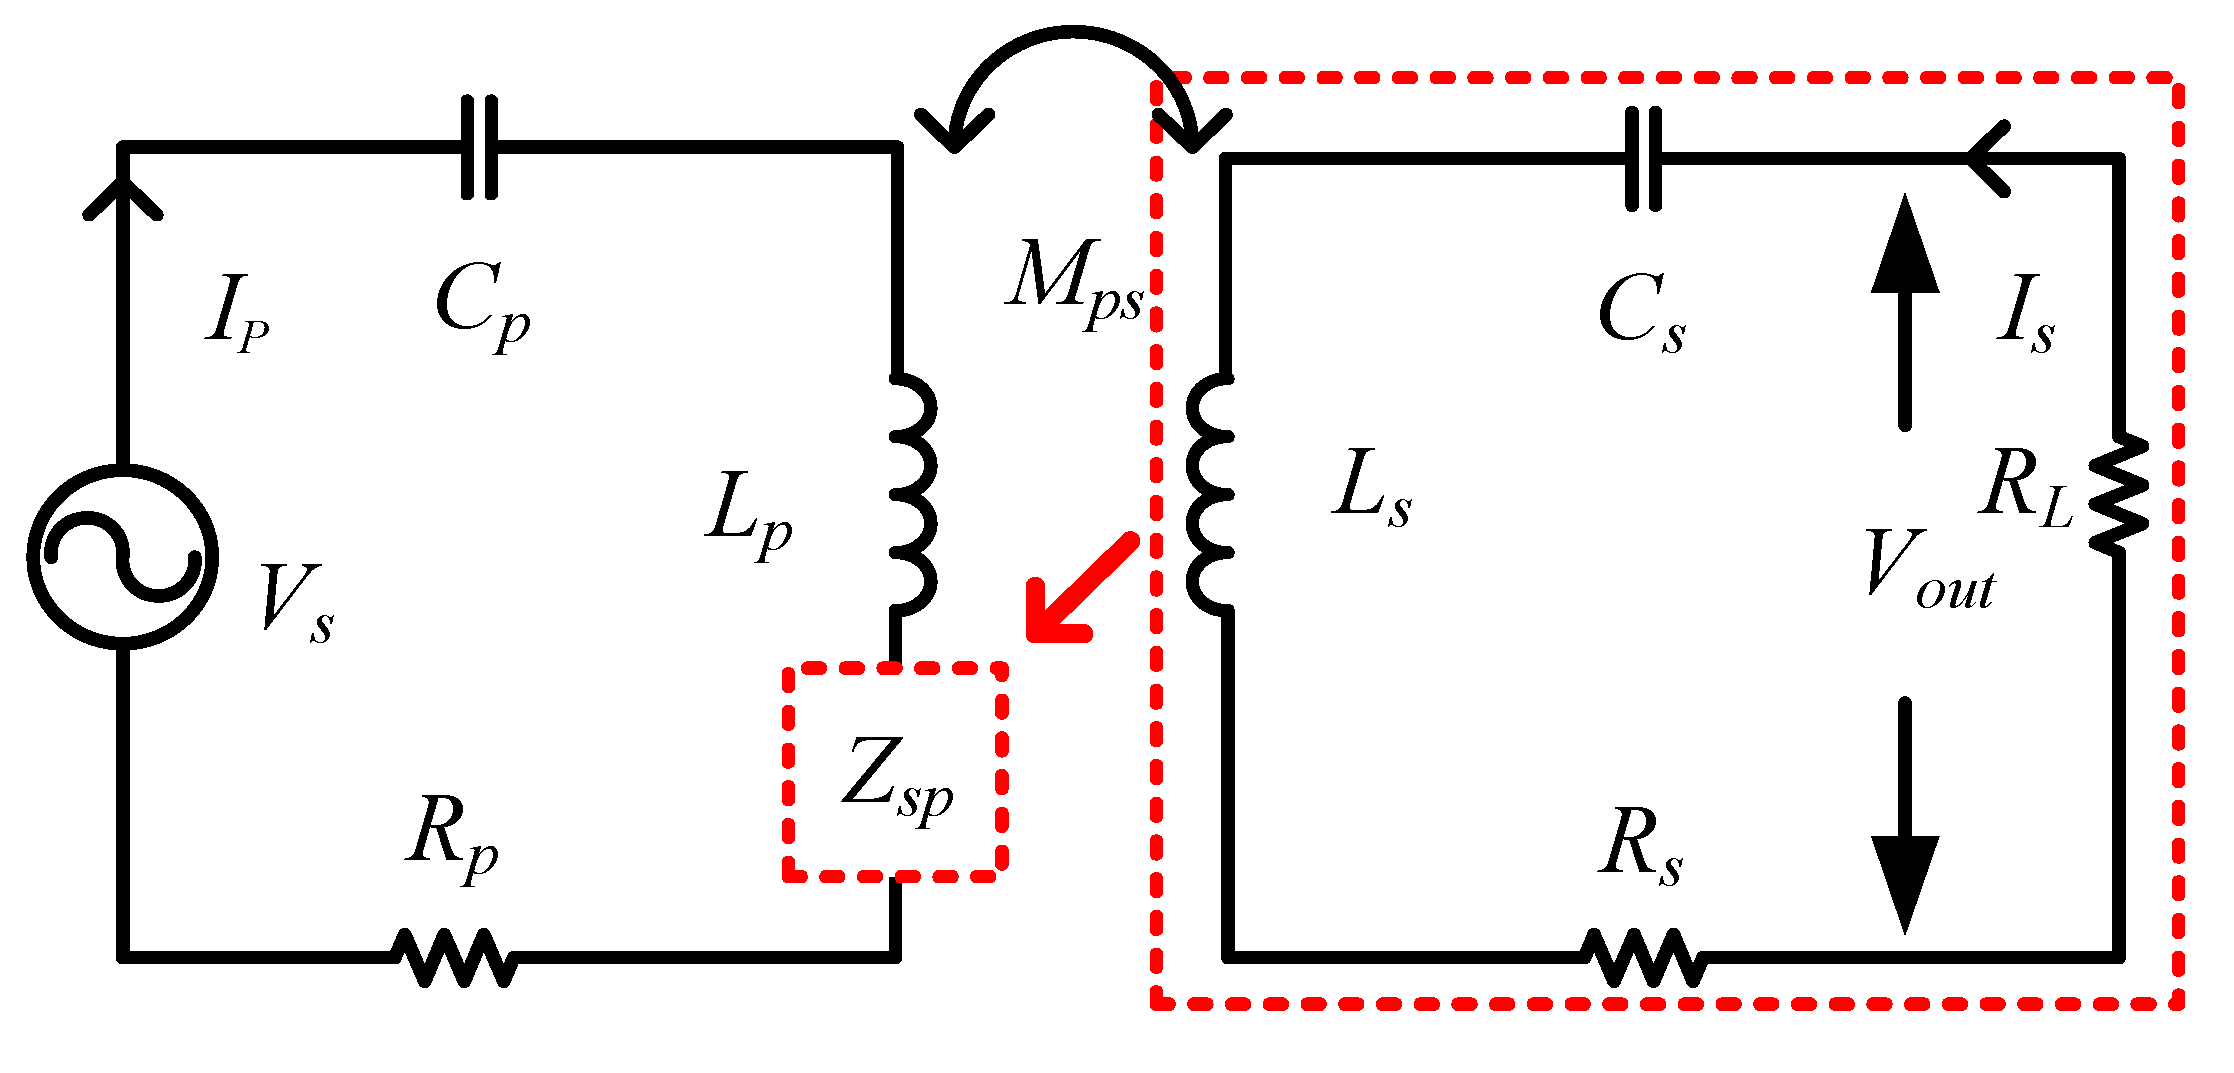
2. Operation Principle

A typical schematic of WPTS (Wireless Power Transfer System) for implantable medical devices is shown in Figure 1. The whole system consists of five parts: Signal source, impedance matching module, double coil coupled resonant module, receiver circuit, and load. The signal processing circuit at the receiver includes rectifier module, low pass filter module, and voltage regulator module.
The signal source provides excitation to the circuit, and the impedance matching module is used to adjust the port impedance of the resonant circuit so that the source energy transfer can be maximized. The dual-coil coupled resonant module realizes power transmission by magnetic field coupling. The purpose of receiver circuit is to rectify, filter, and regulate the received signal, providing a stable DC level for subsequent sensors or implanted electronic devices. The coupling transfer module is the most critical part of the whole system. Because the energy transfer is coupled through the magnetic field generated inside the coil, the system transfer efficiency is closely related to it, so the coupled resonance model is especially critical. The following is an analysis based on the two-coil resonance model, and the transfer efficiency of the resonance model is derived.
Figure 2 exhibits the double coil resonant transfer model, where R p and R s are the equivalent resistance of the transmitter and the internal resistance of the receiver, C p and C s are the compensation capacitors of the transmitter and the receiver, respectively, L p and L s are equivalent inductance of the transmitter and the receiver coil. V s , V o u t , and R L are the power voltage, the input voltage for rectifier module, and the equivalent load impedance, respectively. The mutual inductance between the transmitter coil and the receiver coil is M p s .
In order to determine the equivalent load impedance R L before the rectifier module, the input voltage for rectifier module R L and current I s before the voltage regulator module can be represented by the output voltage V r e and current I r e of the rectifier module.
{ V o u t = 2 2 π V r e I s = π 2 2 I r e
V r e and I r e are the output voltage and current of the rectifier module, respectively. From the above input voltage and current, the equivalent load impedance can be derived as:
R L = V o u t I s = 8 π 2 V r e I r e
The impedance of the transmitter can be expressed as:
Z p = j ω L p + 1 j ω C p + R p
ω is the resonant frequency, and the power voltage can be expressed as:
V s = I p R p + 1 j ω C p I p + j ω L p I p + j ω M p s I s
I p and I s are the transmitter and receiver loop currents, respectively. The impedance at the receiver can be calculated as:
Z s = j ω L s + 1 j ω C s + R s
Due to the mutual inductance coupling of the transmitter coil and the receiver coil, the induced voltage generated in the receiver coil is given by:
V i n d = j ω M p s I p
The output voltage and current are given by:
{ I s = V i n d Z s + R L V o u t = V i n d Z s + R L R L
In order to evaluate the energy transfer capability, the apparent power of the transmitted energy depends on the impedance reflected to the transmitter. The apparent power is calculated by:
S t r a n s = I p 2 Z s p
Here, Z s p represents the reflected impedance from the receiver to the transmitter, and the reflected impedance is:
Z s p = j ω M p s I s I p = ω 2 M p s 2 Z s + R L
Equation (10) illustrates the real and imaginary parts of the impedance, respectively. In order to achieve the maximum output power on the load, the transmitter power factor should be the largest. In other words, the reactive power factor of the transfer channel should be reduced as much as possible [36]. The reactive power factor can be expressed as Formula (11):
{ R e ( Z s p ) = ω 4 M p s 2 ( R s + R L ) ( ω 2 L s 1 C s ) 2 + ω 2 ( R L + R s ) 2 I m ( Z s p ) = ω 3 M p s 2 ( ω 2 L s 1 C s ) ( ω 2 L s 1 C s ) 2 + ω 2 ( R L + R s ) 2
Q t r a n s = Im ( Z s p ) I p 2 = ω 3 M p s 2 I p 2 A ω 2 C s 2 ( R L + R s ) 2 + A 2
where A = ω 2 C s L s 1 , when A = 0 , the receiver power factor is zero, and the reactive power can be eliminated. The corresponding angular frequency can also be obtained, which is consistent with the previous resonant frequency analysis. The input power at the transmitter and the output power at the receiver can be expressed as follows:
{ P i n = V s I p = | V s 2 ( Z s + R L ) ( ω M p s ) 2 + Z p ( Z s + R L ) | P o u t = I s 2 R L = | ω 2 M p s 2 V s 2 R L ( ω M p s ) 2 + Z p ( Z s + R L ) |
Thereby the power transfer efficiency can be calculated:
η = P o u t P i n = | ω 2 M p s 2 R L ( ( ω M p s ) 2 + Z p ( Z s + R L ) ) ( Z s + R L ) |
At the resonant frequency point, Z p and Z s degrade into pure resistance, so the more concise expression is:
η = P o u t P i n = | ω 2 M p s 2 R L ( ( ω M p s ) 2 + R p ( R s + R L ) ) ( R s + R L ) |
From the power transfer efficiency Formula (14), the mutual inductance between the coils, the internal resistance of the power supply, the internal resistance of the coil, and the load impedance all affect the transfer efficiency. The mutual inductance between the coils is closely related to the coil structure and the relative position. The coil internal resistance indirectly reflects the quality factor.
Therefore, if the load impedance is determined, in order to effectively improve the energy transfer efficiency, it is necessary to optimize the coil’s structure and improve the coil quality factor. Optimizing the coil structure and designing a coil with a high Q value is an effective way to improve the WPTS performance.

3. Simulation Performances

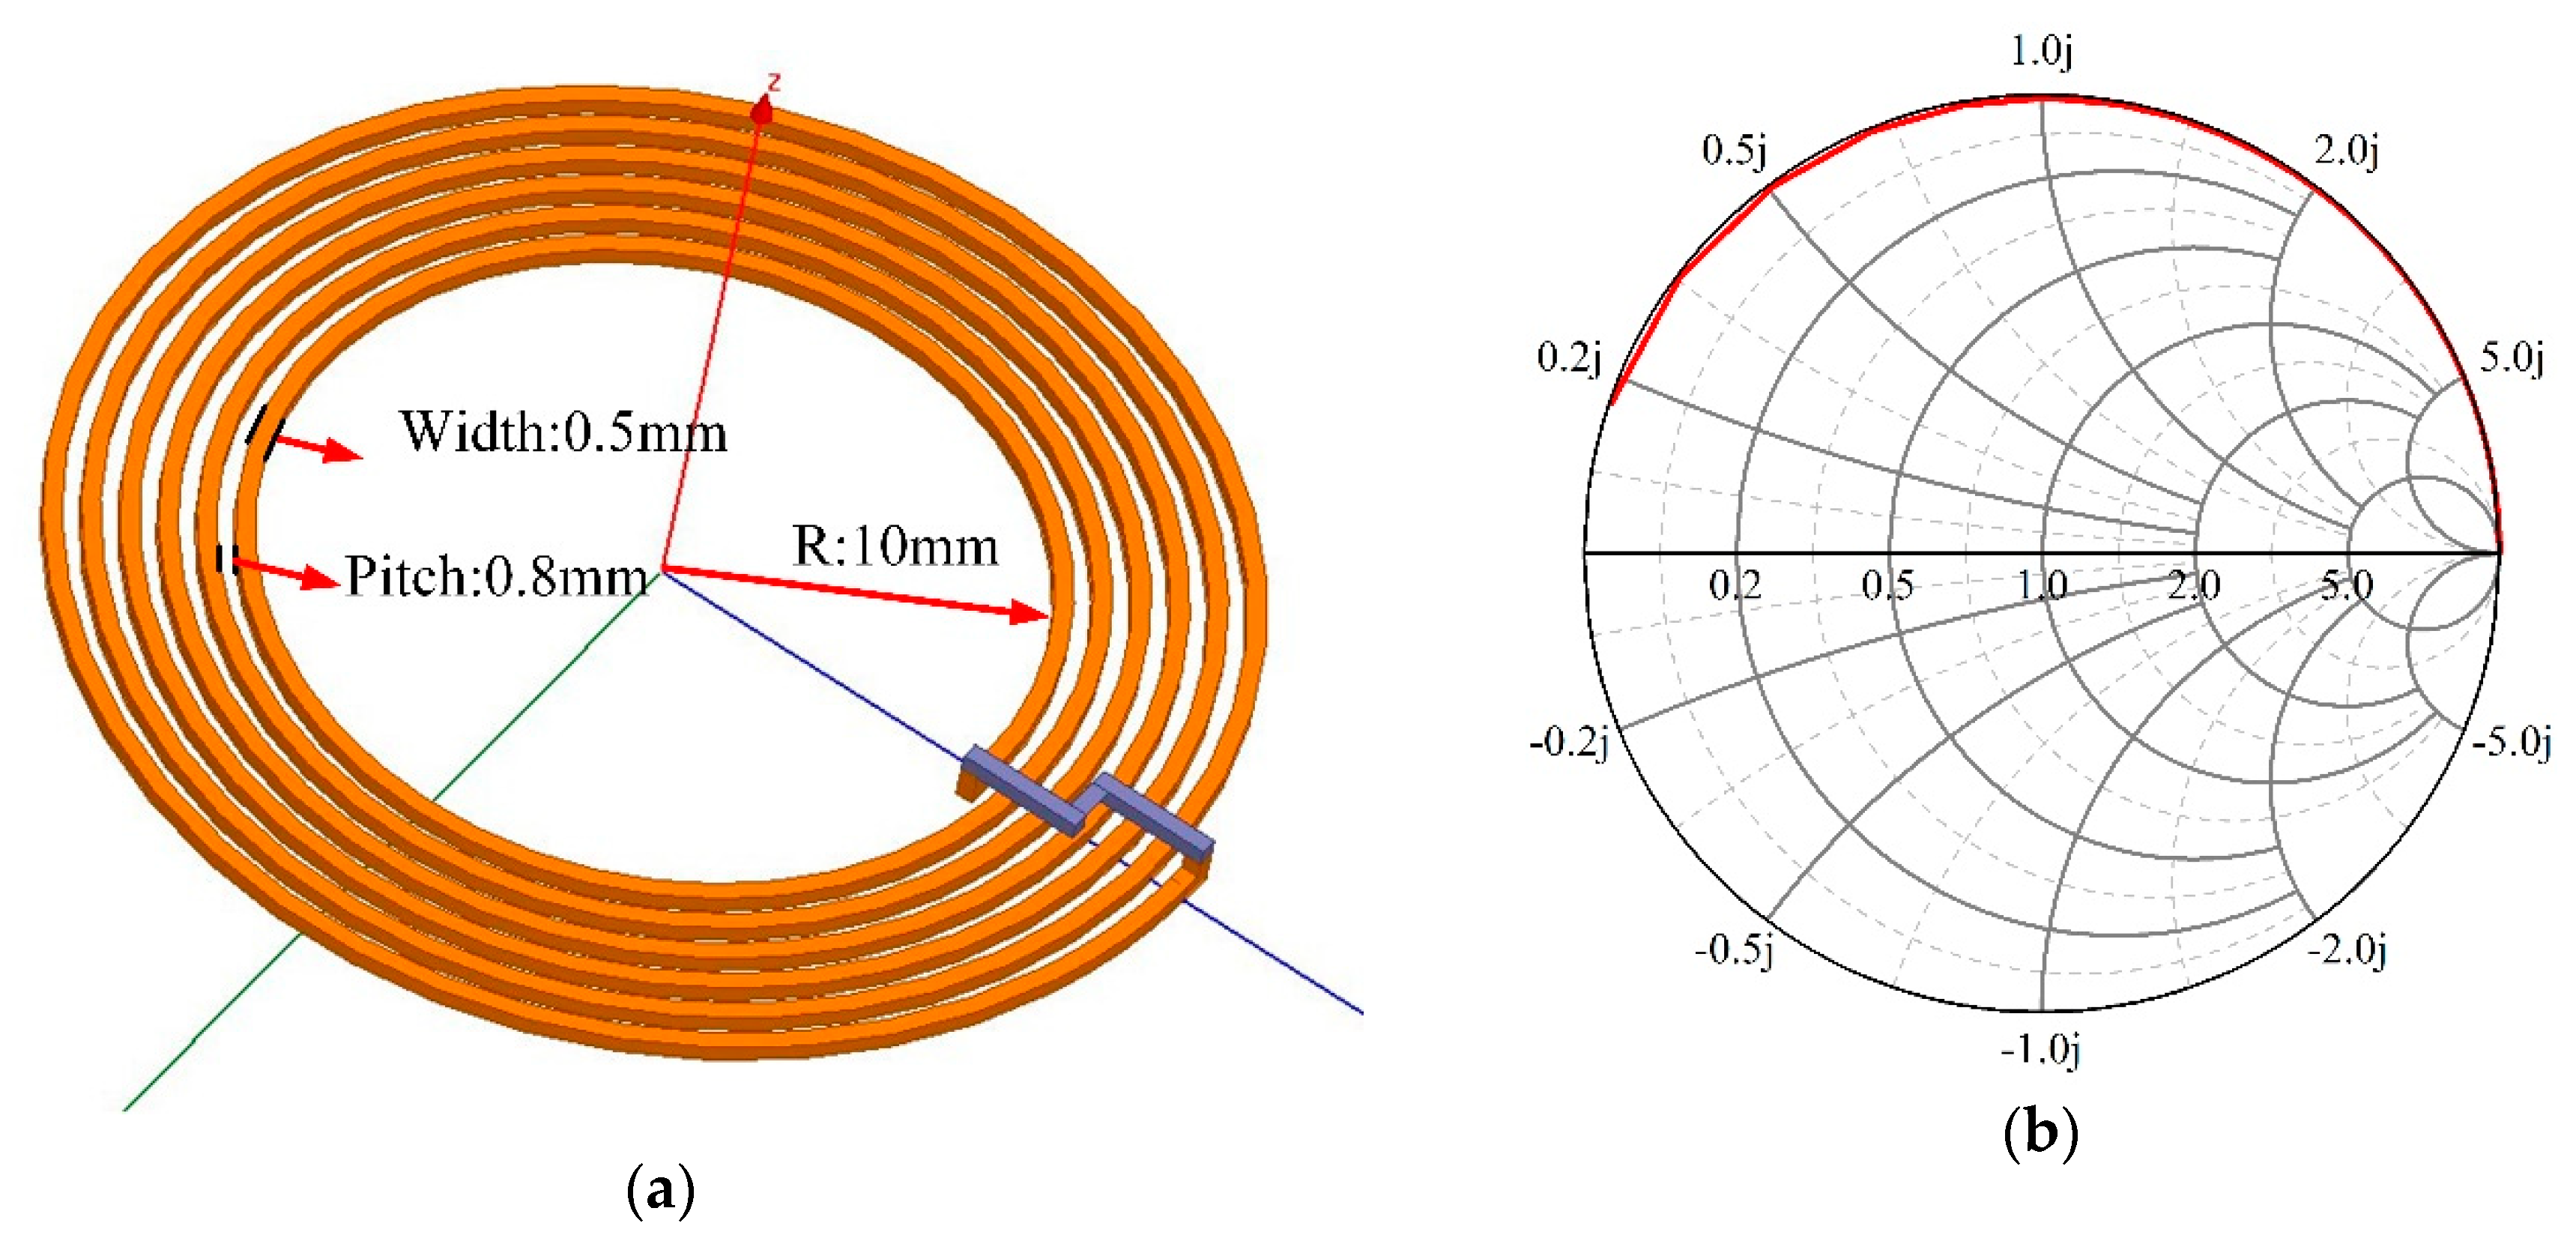
3.1. Coil Structural Parameter Optimization

The mutual inductance between the coils and the coil quality factor are pivotal factors affecting the transfer performance, and these key elements are determined by the coil structure parameters. Therefore, comprehensive optimization on coil structure parameters is considered as an appropriate approach to improve system performance.
The coil parametric model created in HFSS (High Frequency Structure Simulator) is shown in Figure 3a, and the coil impedance versus frequency is depicted with Smith chart in Figure 3b. Impedance curves against the upper semi-circumference, and the performance as a combination of the inductive impedance and AC resistance. The effects of coil turns, coil radius, wire width, and turn pitch on the coil performance were simulated and analyzed.

3.1.1. Simulation of Coil Turns

The principle of wireless power transmission is based on the magnetic field coupling generated by the coil. The received energy is proportional to the magnetic flux variation, and the coil inductance is an intuitive measure of the induced magnetic field. The magnetic field intensity generated inside the coil directly affects the induced voltage, and the multi-turn coil can effectively increase magnetic field intensity and boost the induced electromotive force.
The relationship between the coil inductance and turns is:
L = N 2 μ 0 4 π C 2 C 1 d l 1 d l 2 R
If other structural parameters are kept unchanged, the inductance is quadratic with the coil turns, and the simulation results in Figure 4a can also be verified. Increasing the coil turns is the most effective way to improve the inductance.
With the increase of the coil turns, coil inductance value also increased, and the coil equivalent resistance also increases as the wire length increases simultaneously. When the turns are less than 5, the increase in the inductance value is very close to the relevant resistance, so the quality factor does not increase much in Figure 4b. In the simulation process, the inductance value is calculated by the impedance real part and the imaginary part. When the turns are greater than 5 and less than 8, the quality factor is greatly increased, which means that the coil impedance imaginary part grows greater than the real part. When the turns are greater than 8, the impedance imaginary part dominates the quality factor.

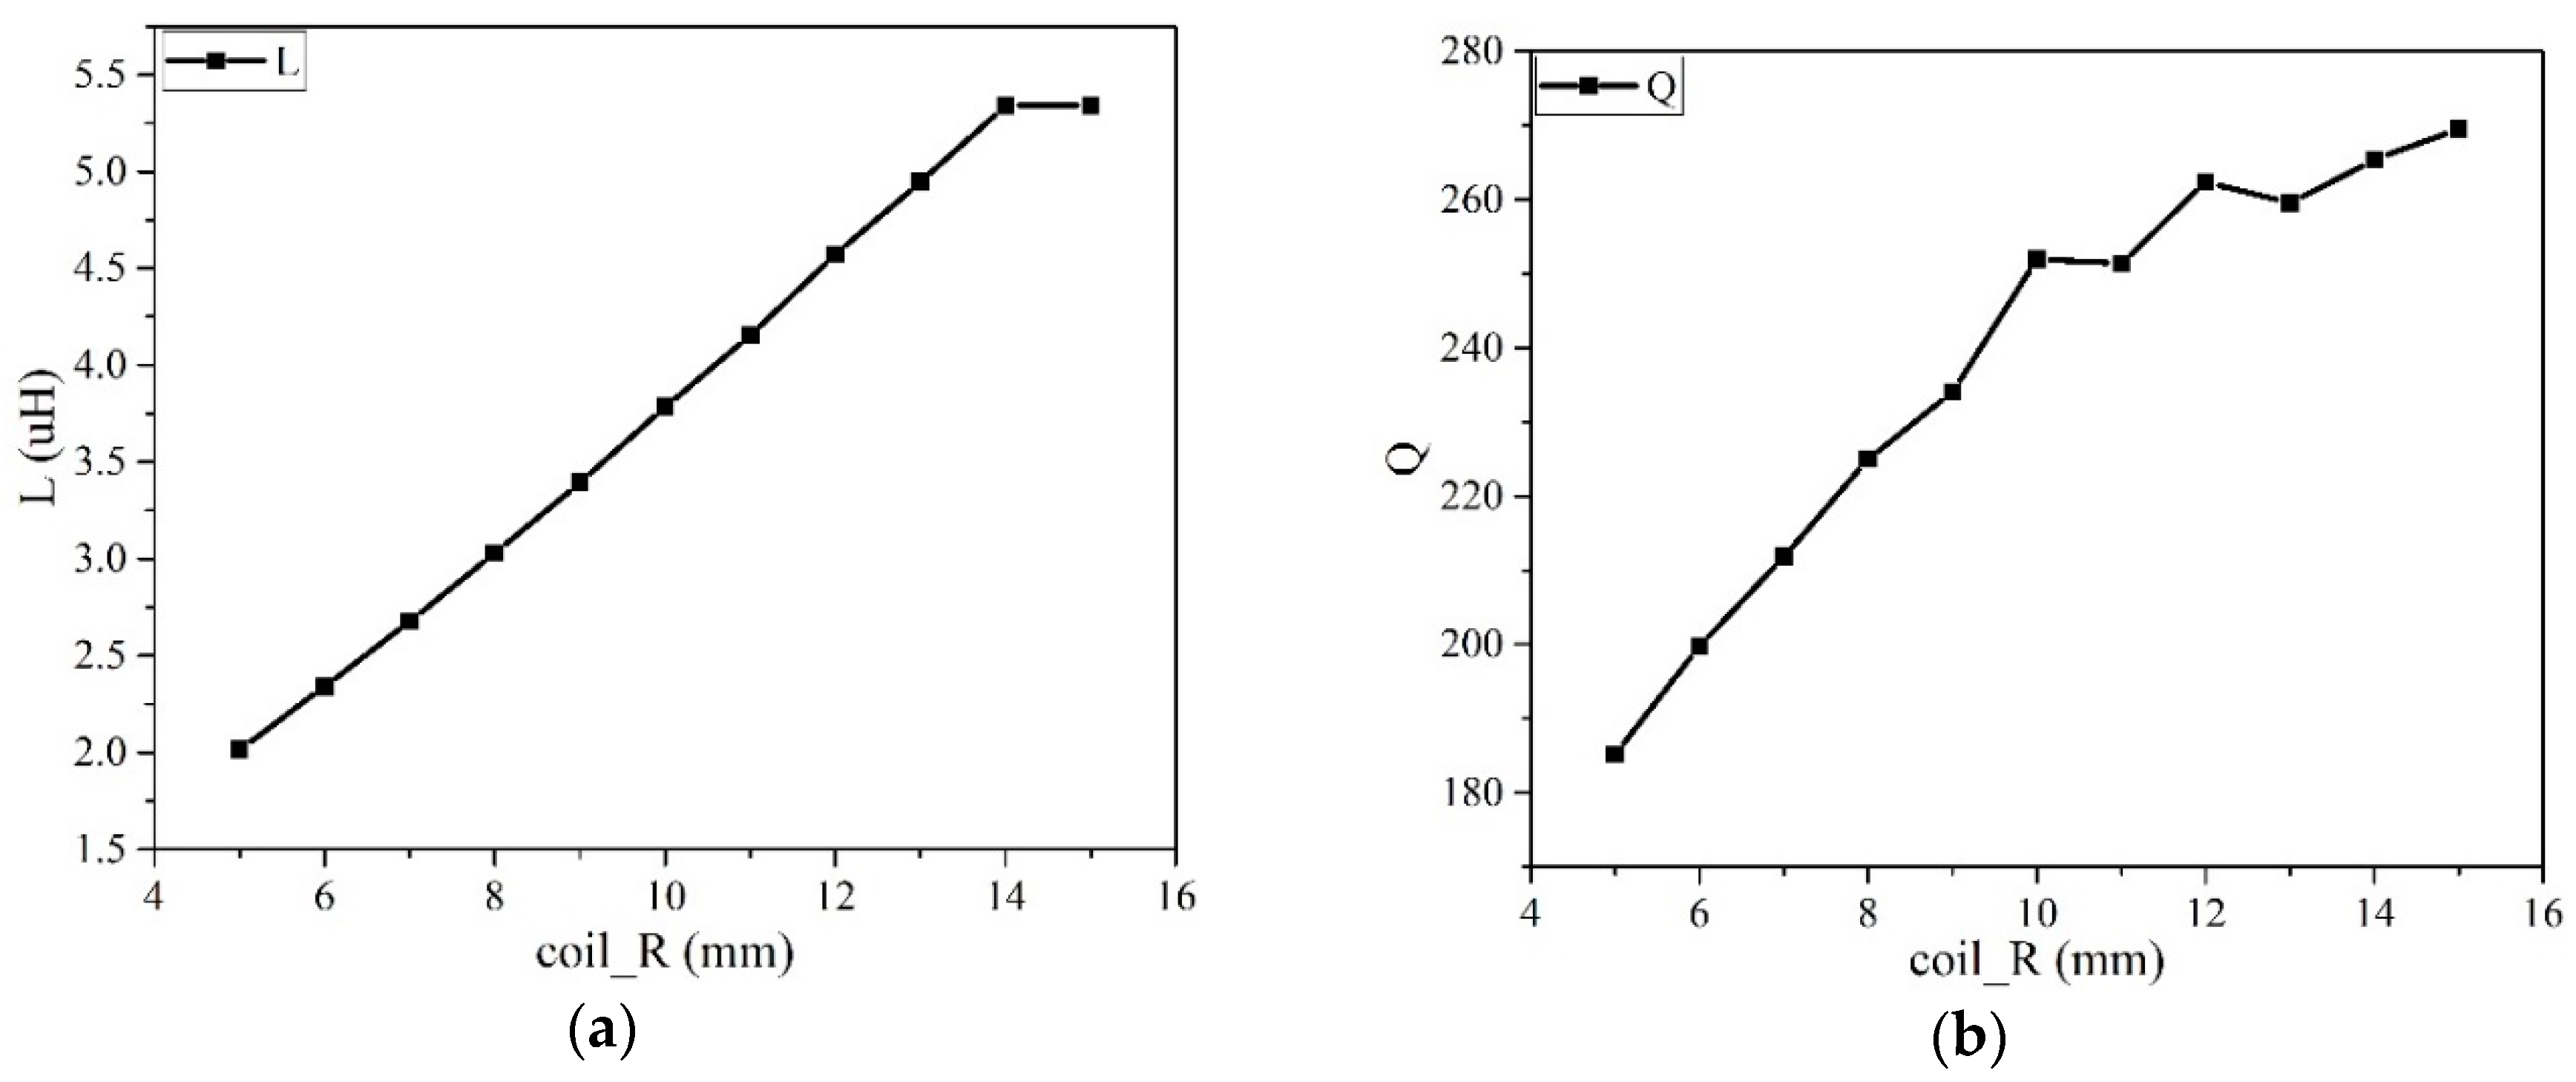
3.1.2. Simulation of Coil Radius

The coil inductance increases as the coil radius increases in Figure 5a. For a coil of a specified shape, article [37] indicates that the corresponding inductance is closely related to the coil turns, the spacing of the turns, the inner and outer radii of the coil, and the average diameter. Therefore, the inductance calculation formula of different shapes is also given:
L = μ 0 N 2 d a v g c 1 2 ( ln ( c 2 ρ ) + c 3 ρ + c 4 ρ 2 )
where N is the turns, d a v g is the average diameter of the coil, μ 0 is the permeability in vacuum, C 1 - C 4 are the parameters dependent on the coil shape, and ρ is the fill ratio of the coil, given by the following formula:
ρ = d o u t d i n d o u t + d i n
The d i n and d o u t in Formula (17) are the inner and outer diameters of the coil, respectively. The coil shape dependent parameters previously mentioned C 1 - C 4 are in Table 1 below:
With increasing coil radius, the quality factor is also significantly increased. The above analysis demonstrates that the inductance is a monotonic function of the coil radius, and the quality factor is also a monotonically increasing function. The coil radius and the turns are the two factors that have the greatest influence on the coil performance among many structural parameters.

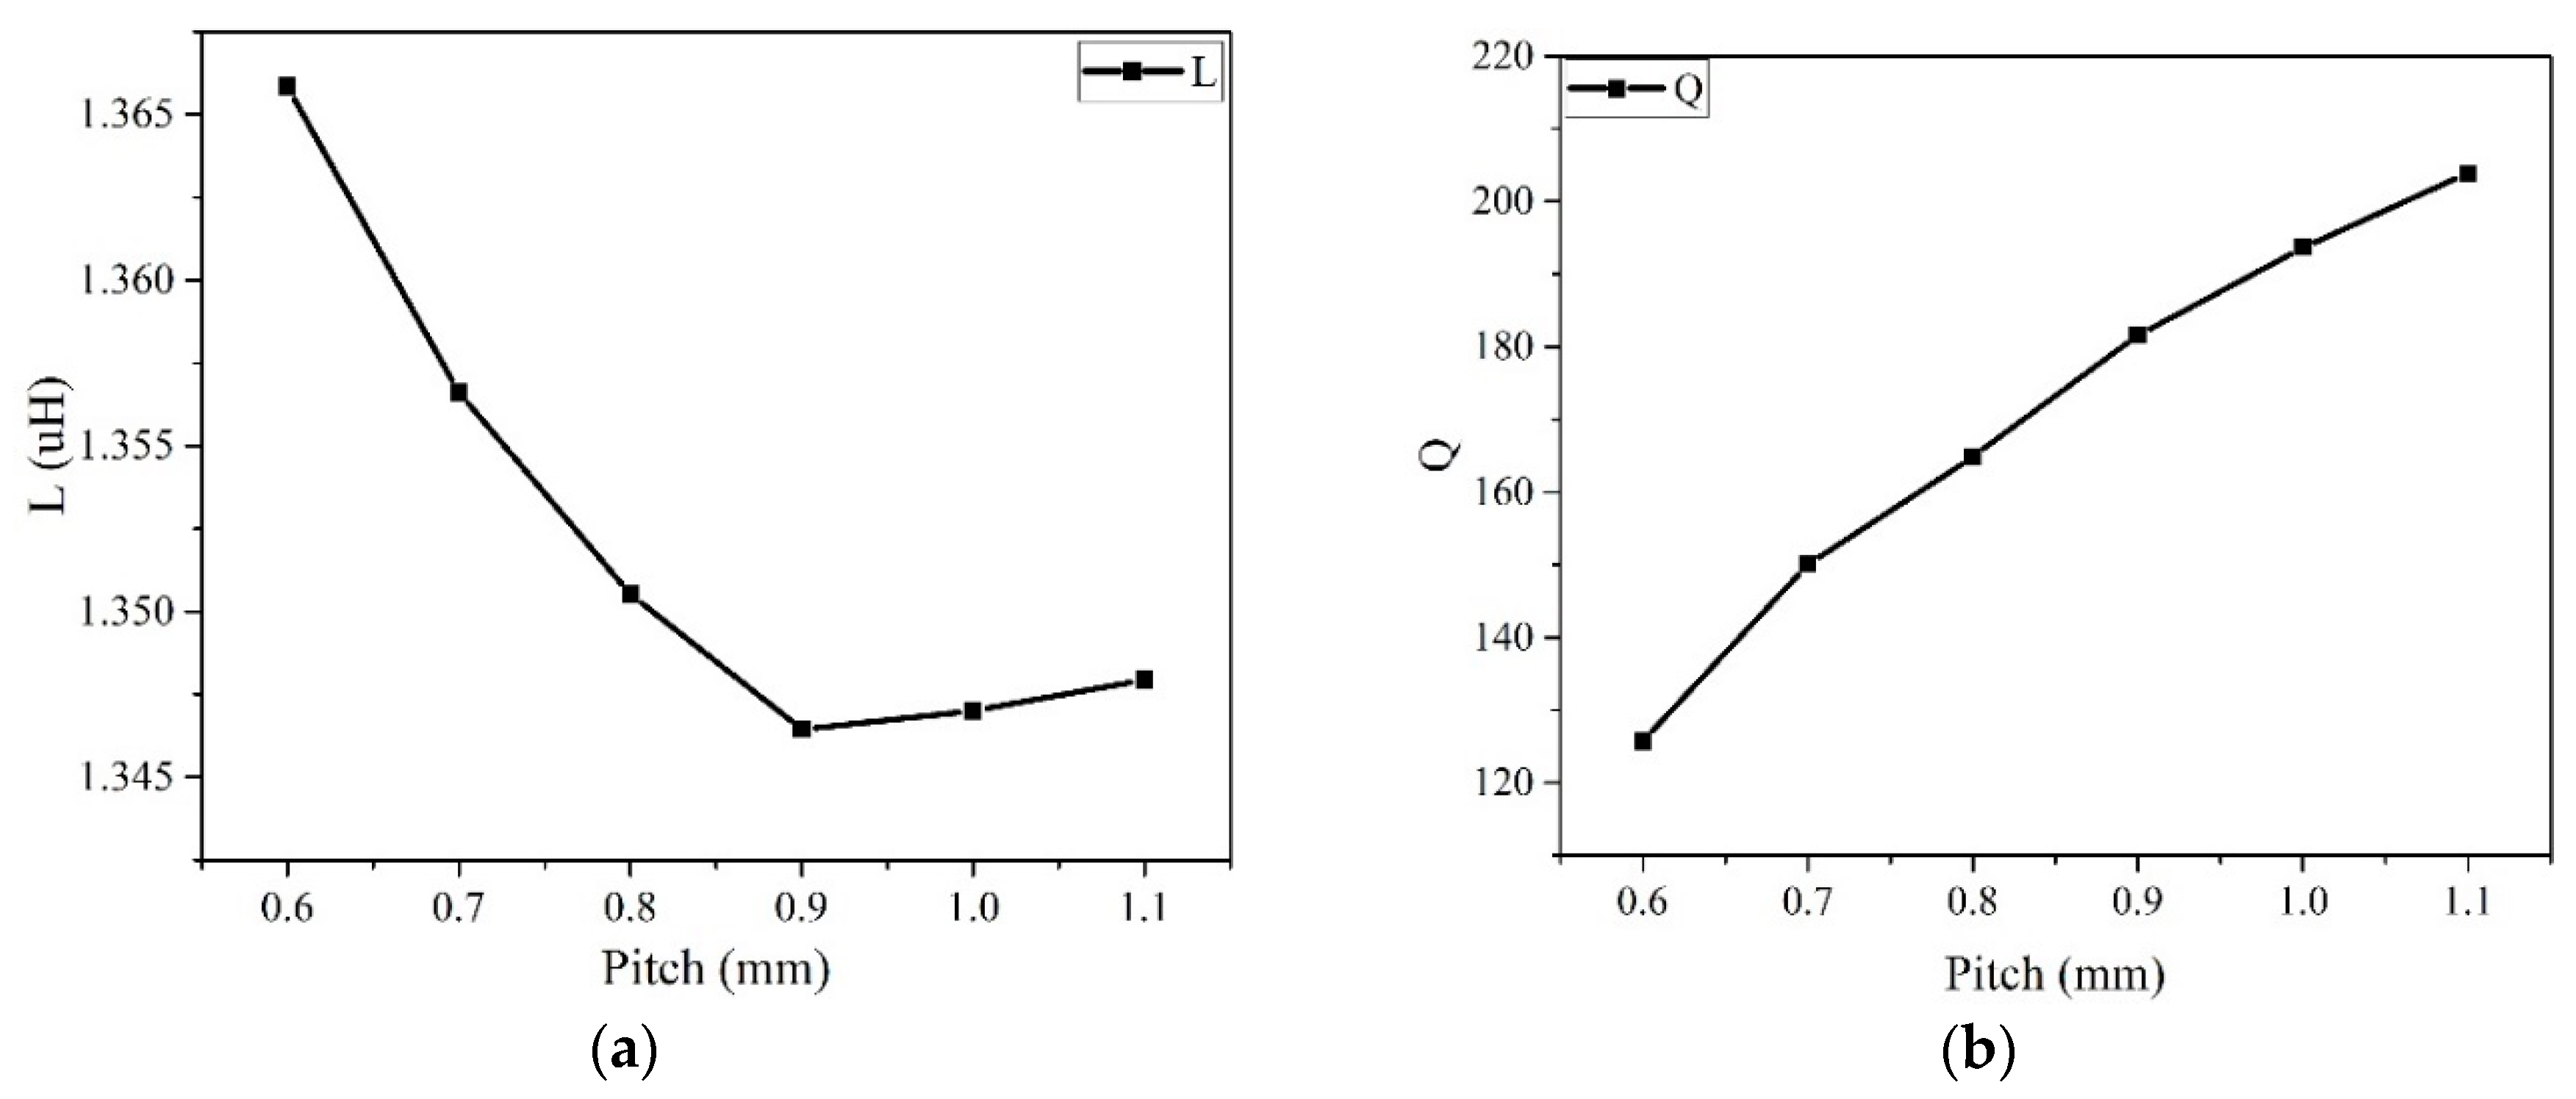
3.1.3. Simulation of Turn Pitch

As the turn spacing increases, the inter-layer capacitance decreases, and the capacitive reactance contributed by the parasitic capacitance increases, and the impedance imaginary part decreases. Therefore, the coil turn pitch should be optimized in order to reduce losses and thus maximize transfer efficiency [38]. The inductance value decreases as the pitch increases in Figure 6a, which is why many off-chip inductors are chosen to be closely wound.
However, the quality factor increases as the wire spacing increases. As the capacitive reactance contributed by the parasitic capacitance mentioned above increases, the coil impedance real part is reduced. The speed at which the coil impedance real part decreases due to the influence of parasitic capacitance is greater than the falling speed of the imaginary part. From the formula Q = ω L / R , the coil quality factor still increases. Therefore, on the basis of ensuring the coil inductance, appropriately increasing the wire spacing will increase the coil quality factor, but this will also increase the coil area.

3.1.4. Simulation of Wire Width

The inductance decreases as the wire width increases in Figure 7a. When analyzing the influence of the wire width on the coil inductance, it is necessary to keep other structural parameters stable. When the coil radius remains constant, the wire width increases, and the overall wire length decreases, so the coil inductance decreases. Therefore, reducing the wire width under the condition that other parameters are kept constant can increase the coil inductance.
The quality factor increases first and then decreases with the increase of the wire width in Figure 7b. When the wire width is less than 300 um, the quality factor increases as the wire width increases, which is exactly the opposite of the coil inductance change.
Since the wire width is small, increasing the wire width can effectively reduce the coil series resistance. At this time, the effect of the resistance value on the quality factor predominates, and the quality factor increases as the wire width increases. As the wire width continues to increase, resulting in an increase in the cross-sectional area of the metal layer, the parasitic capacitance between the coil and the substrate increases, and the loss of the substrate increases. Moreover, due to the skin effect, the current concentrates on the surface of the wire, and the influence of the wire width on the resistance becomes weak, so the quality factor decreases. When the wire width is greater than 300 um, the quality factor trend in Figure 7b just verifies the above analysis.
Based on the above simulation analysis, the coil structure parameters after optimization are obtained as shown in Table 2:

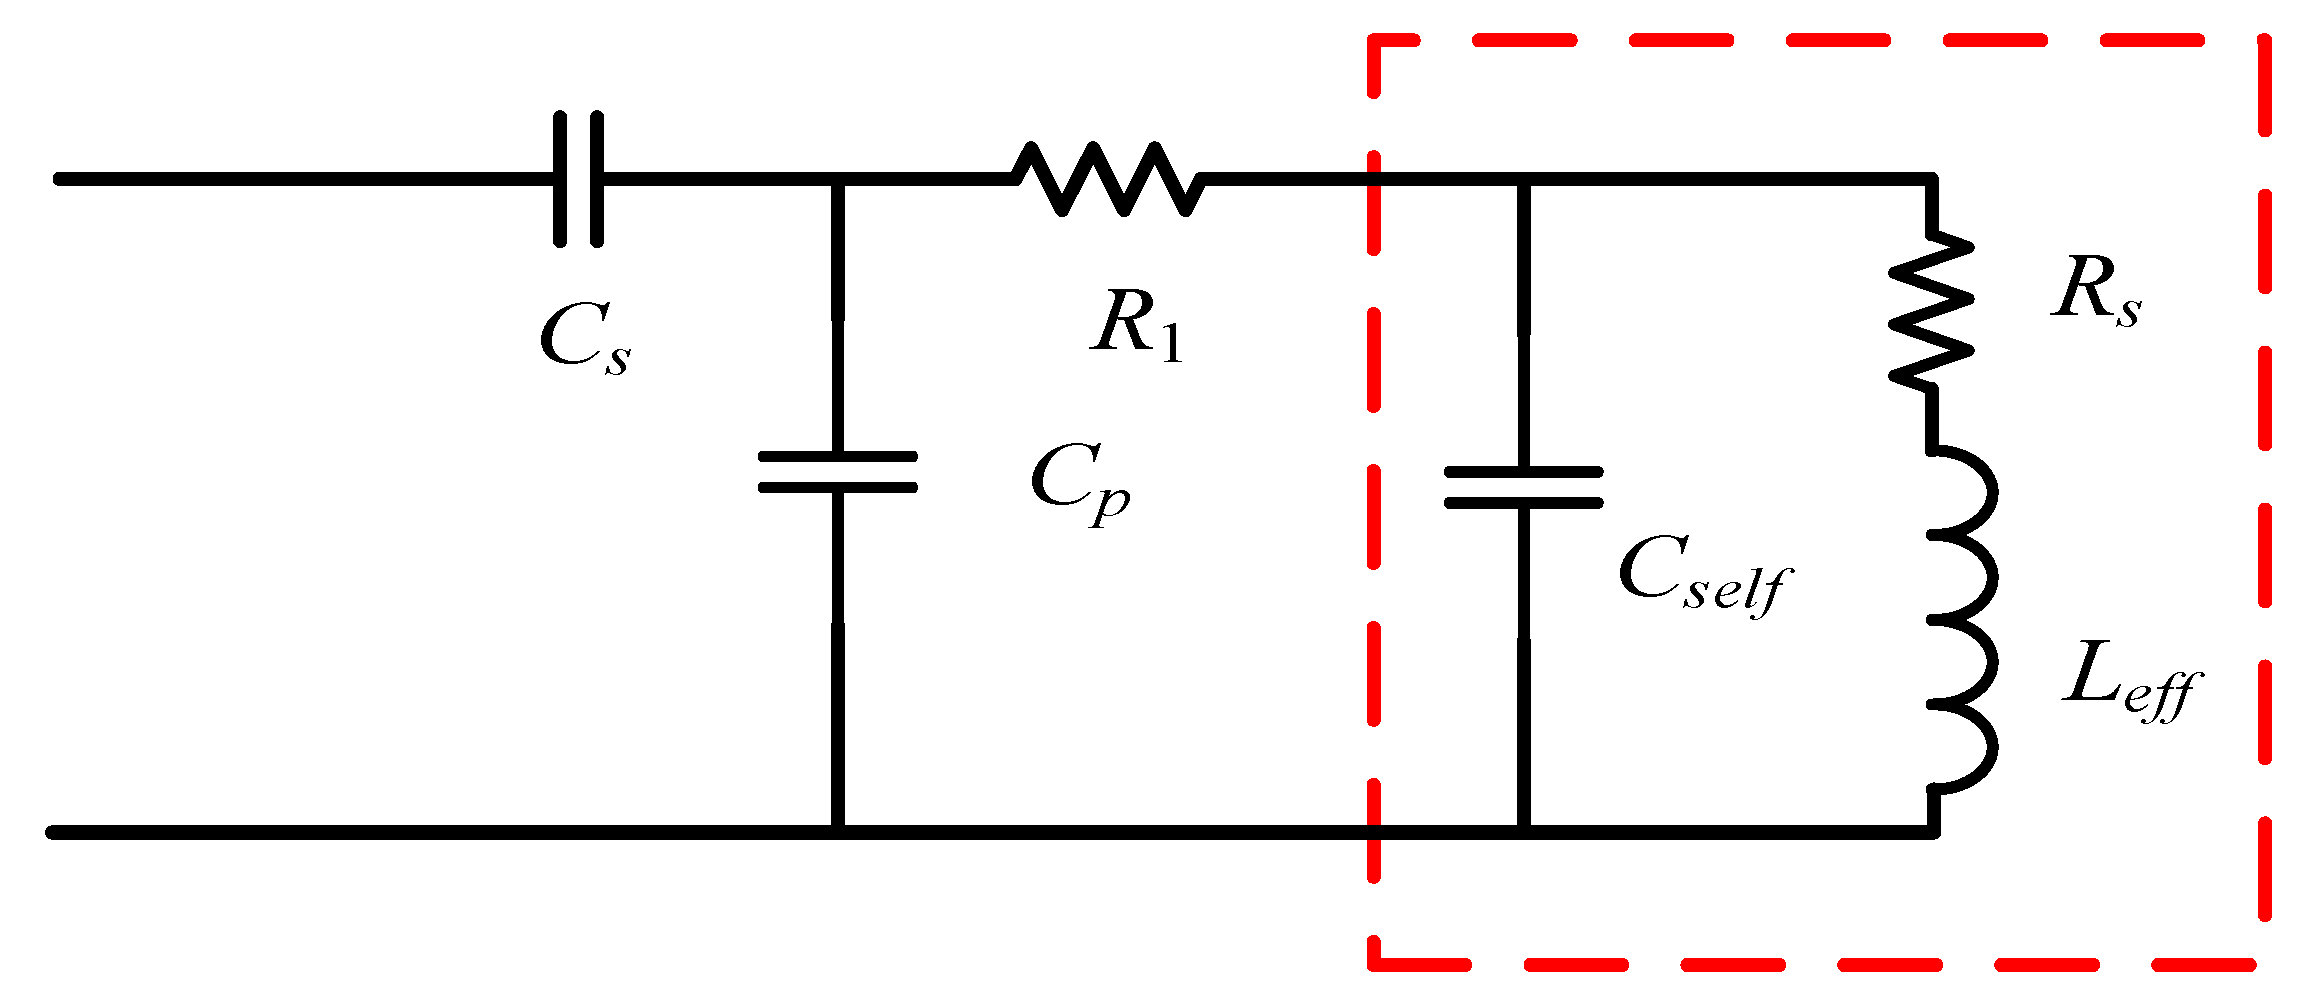
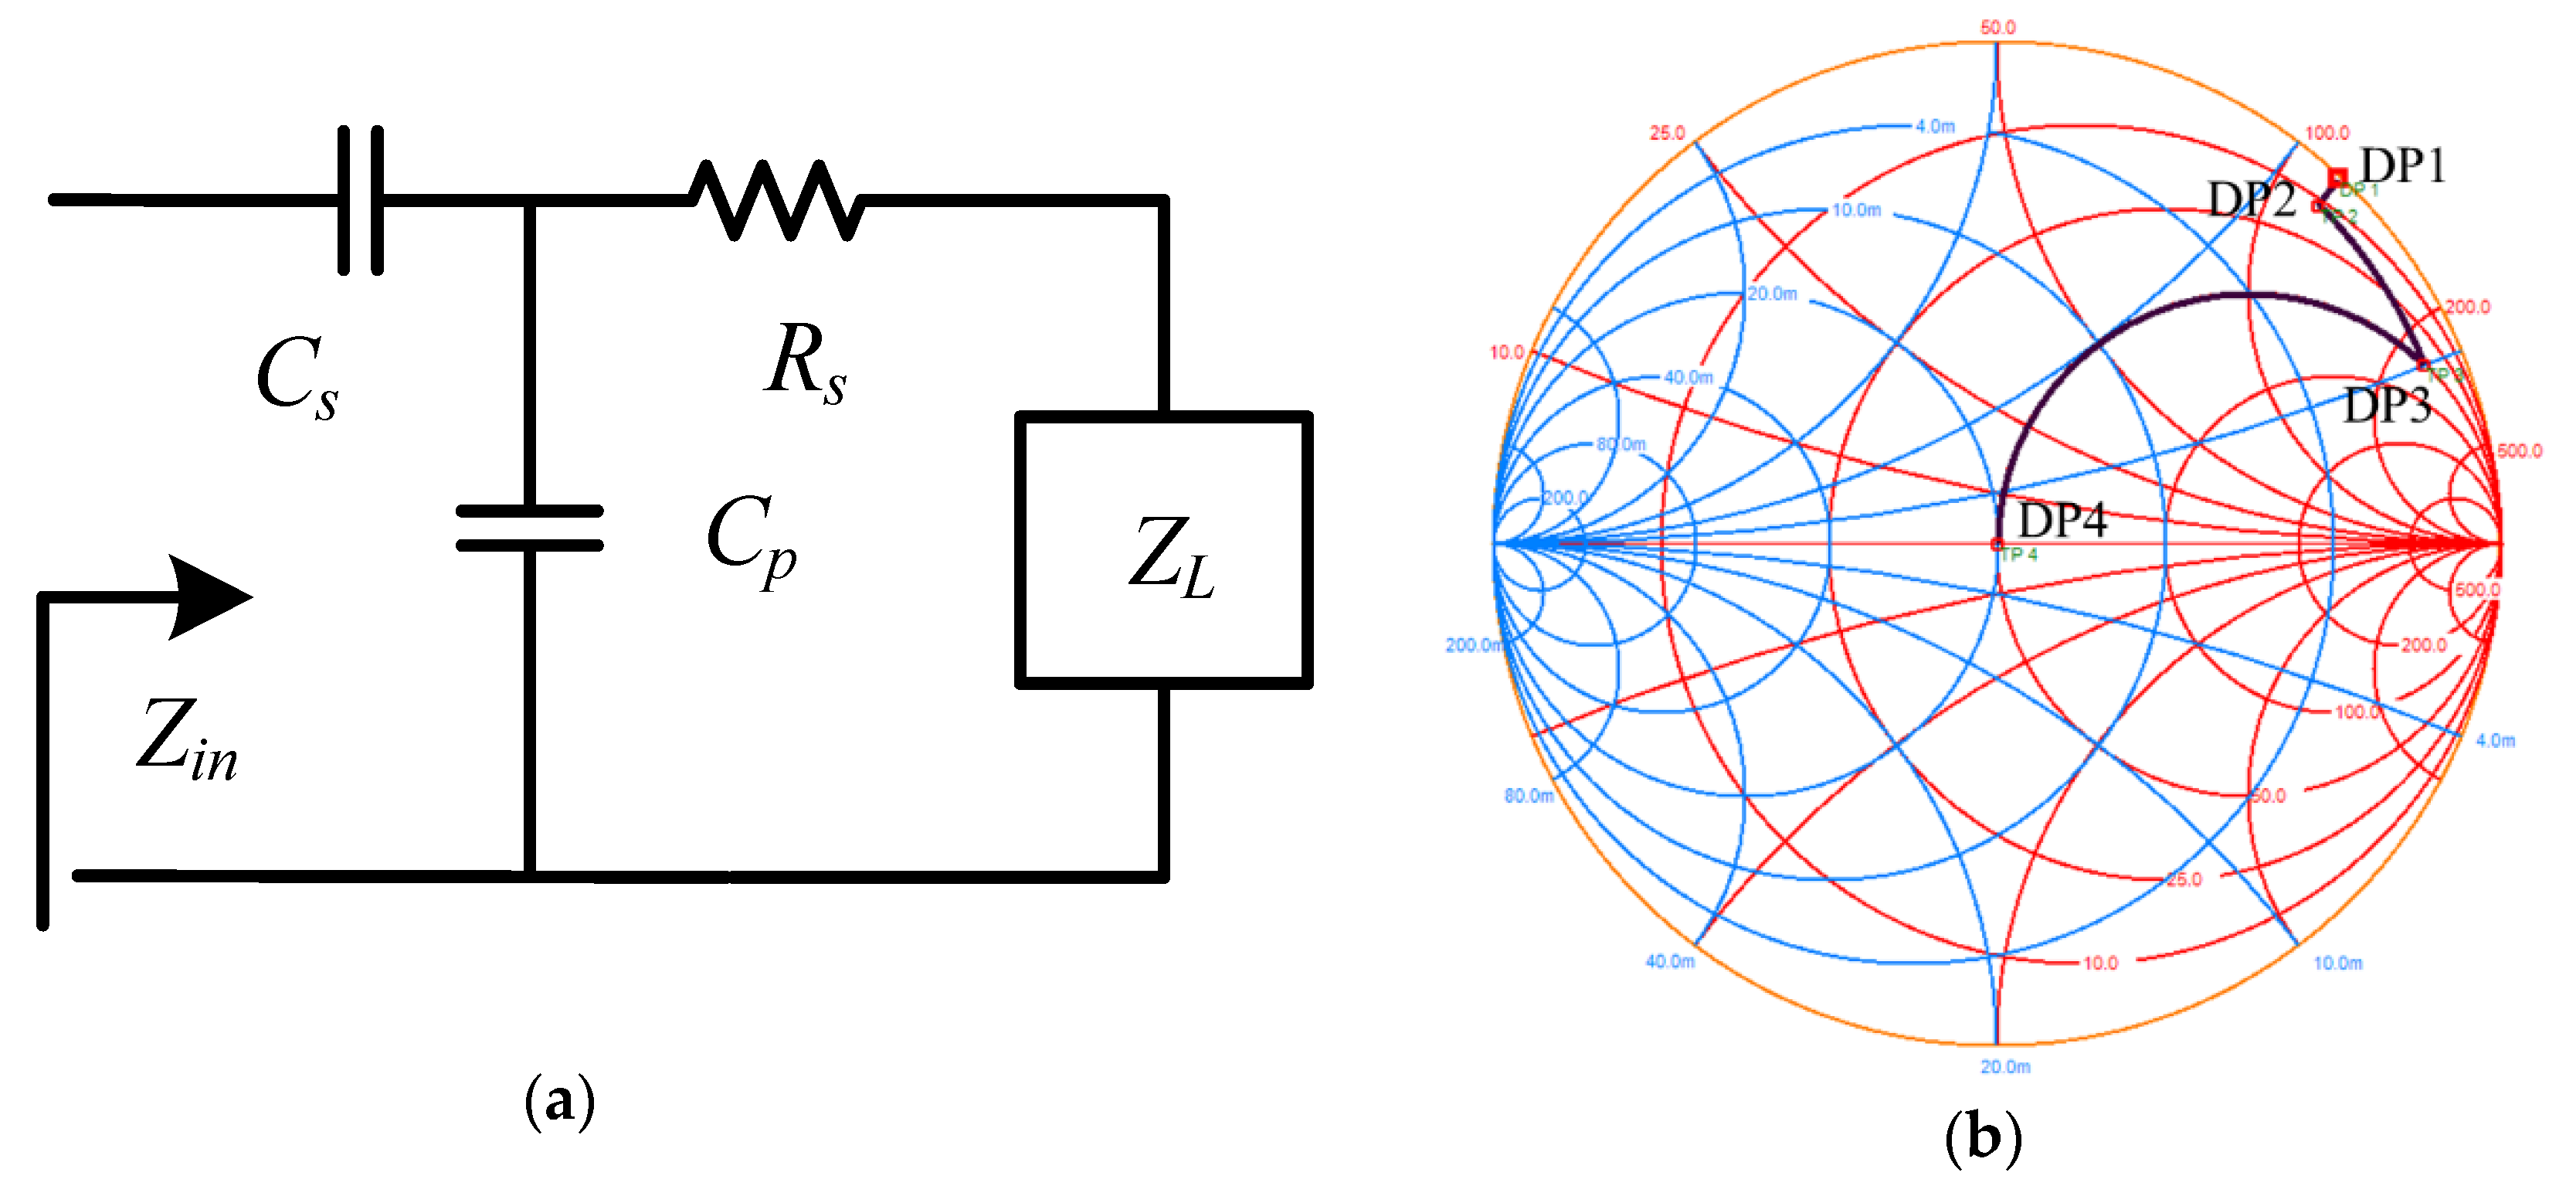
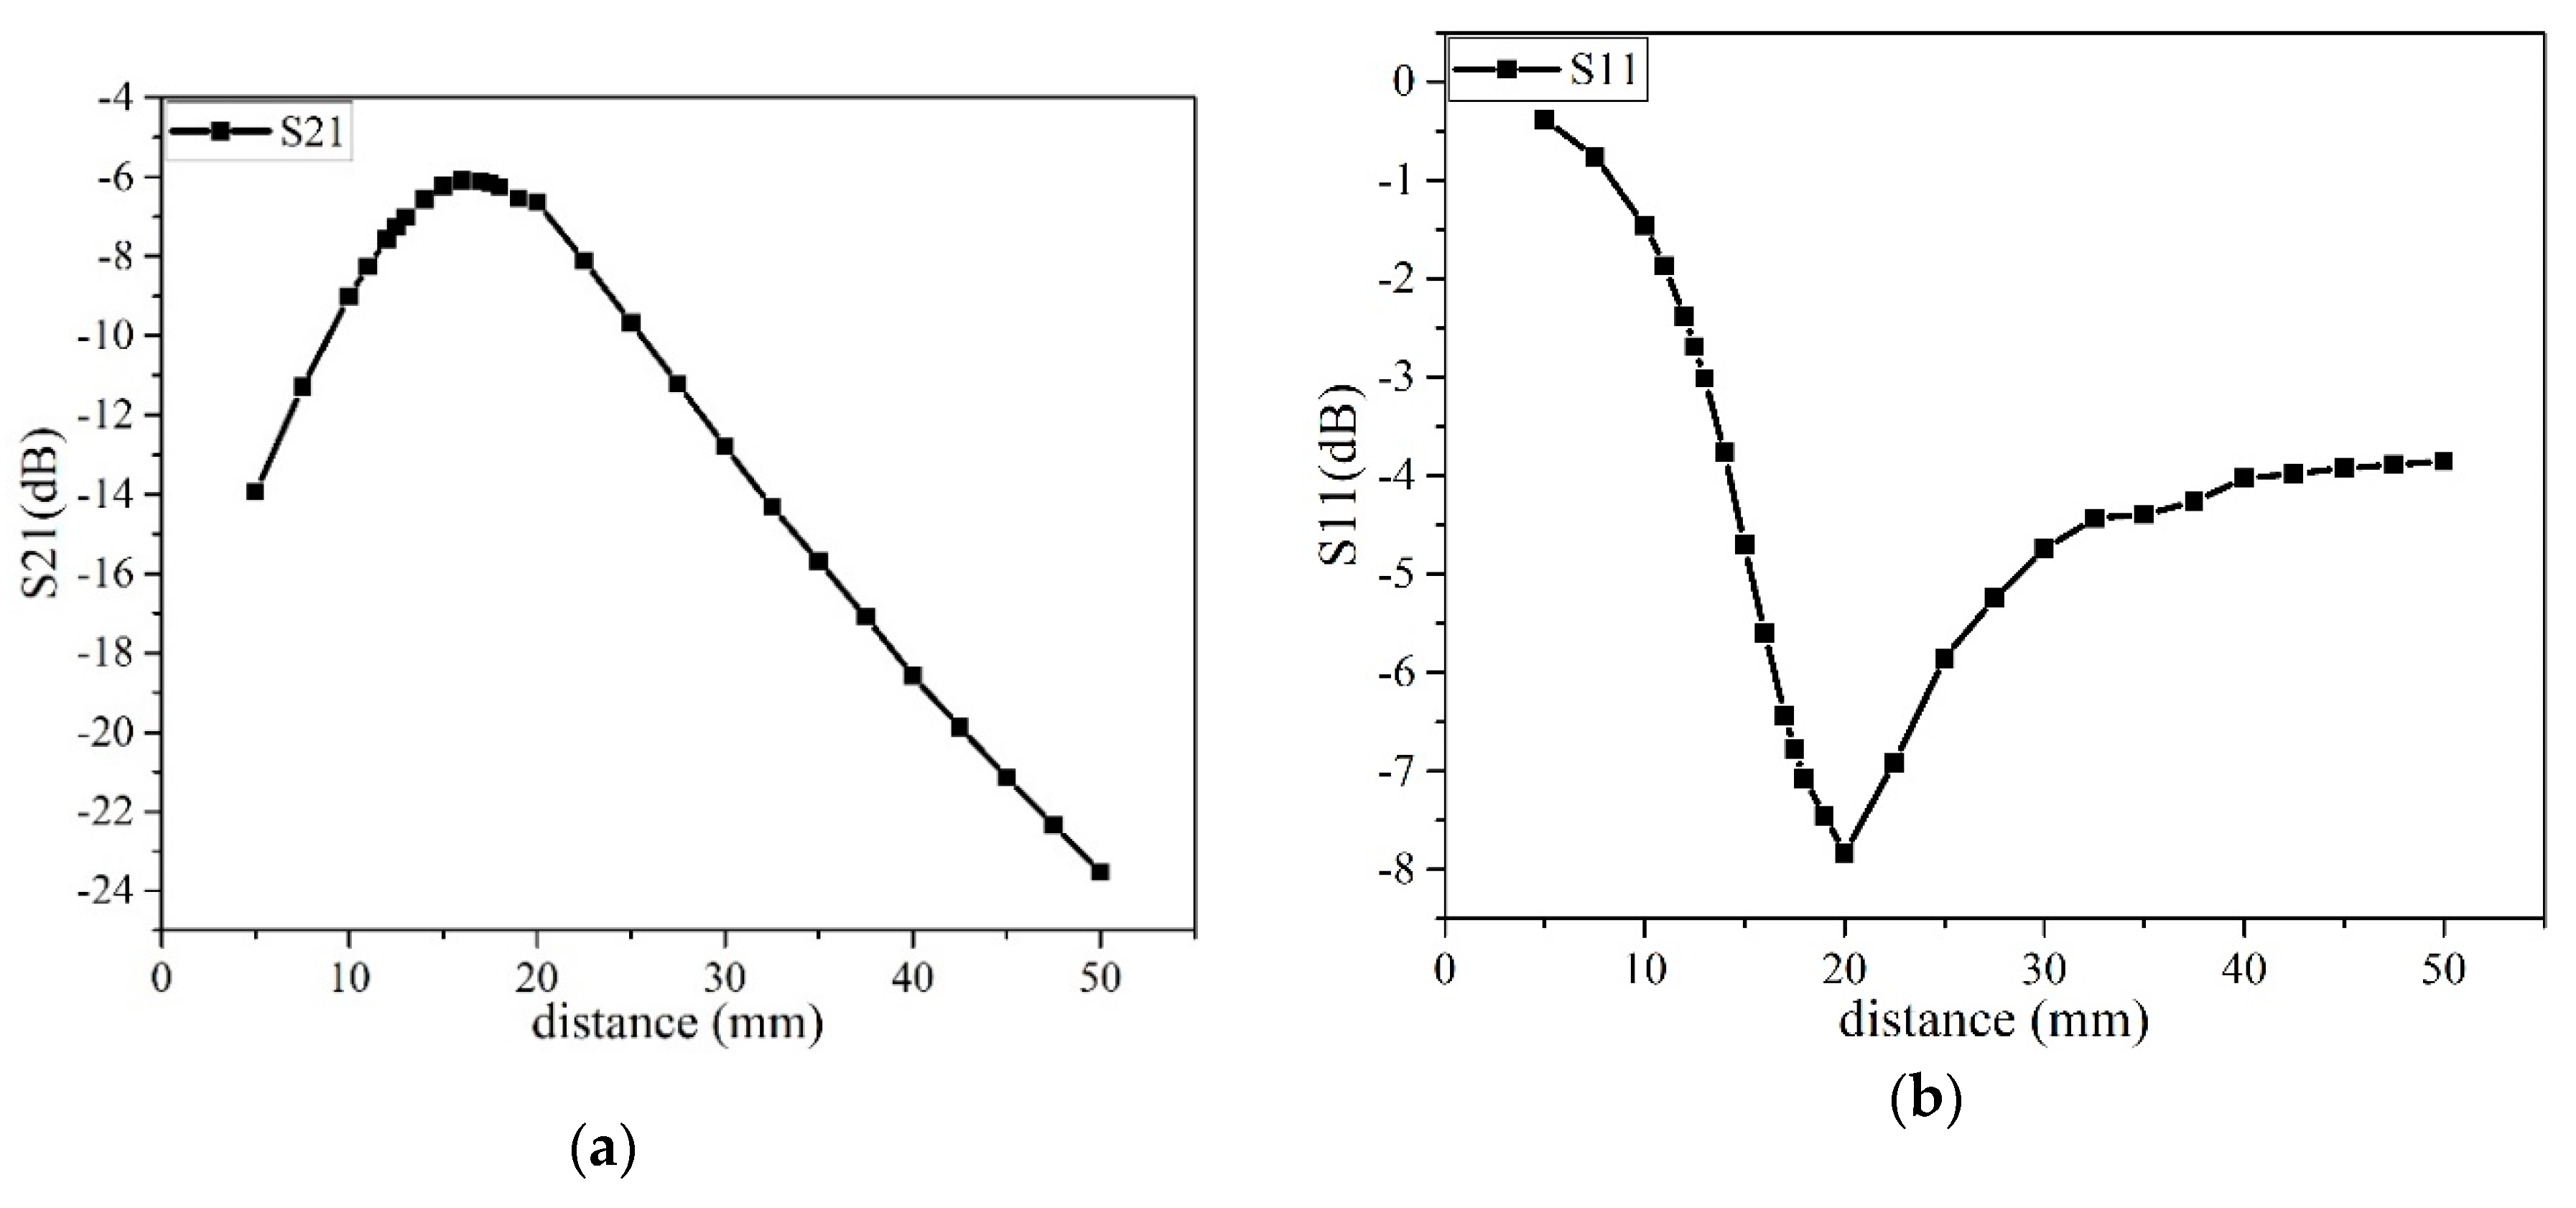
3.2. Impedance Matching Circuit Design

Impedance matching refers to a state in which the load impedance and the signal source satisfy a special coordination relationship, and finally the maximum output power can be obtained on the load. Compared with the wavelength of the low-frequency signal, the length of the transmission line is negligible, and the signal reflection has little effect. Therefore, in the low-frequency circuit, only the matching network between the power supply and the load needs to be considered, that is, the load impedance is adjusted to match the source internal resistance. However, when the signal wavelength is comparable to the length of the transmission line, the matching between the transmission line and the load needs to be considered. If the characteristic impedance of the transmission line does not match the load impedance, reflection will occur at the load. The reflected signal superimposed on the input signal will change the original input signal, which leads to energy loss, reduced efficiency, and even damage to the transmitting equipment.
Since the wavelength at the resonant frequency is much larger than the transmission line, only the match between the signal source and the load needs to be considered. Here, an impedance matching network in series is employed, as shown in Figure 8. The red dashed box in Figure 8 is the coil equivalent model.
Due to the loss resistance and the parasitic capacitance, the coil cannot be equivalent to a simple inductance model. The equivalent series loss resistance and parasitic capacitance of the coil can be obtained from the Smith chart of the previous coil simulation. The left side of the dashed box is the real part of the transform network, where the resistors and capacitors have their corresponding effects. The resistance is used to adjust the system bandwidth. The system bandwidth is an important indicator to measure the system performance. The bandwidth and quality factor of the circuit have the following relationship:
B W ω 0 = 1 R C ω 0 = L C R C = L / C R = 1 Q
According to the above equation, the quality factor is inversely proportional to the bandwidth, and high-quality factor means narrower bandwidth. Although the high-quality factor is beneficial for improving transfer efficiency, simply increasing the quality factor will lead to reduced system bandwidth. If the quality factor is simply increased to improve the energy transfer efficiency, when the input signal deviates from the resonant frequency, the previously designed impedance matching will be drastically reduced, resulting in a large energy reflection and a reduction in the transfer efficiency. It needs to make a compromise between bandwidth and quality factor.
Designing an impedance matching circuit is desirable to achieve maximum power transfer, reducing energy reflection. Since the source internal resistance or the output impedance of the power amplifier is typically 50 Ω, a more specific explanation is to adjust the input impedance of the resonant tank to 50 Ω at the resonant frequency point. Here, the Smith chart is used to determine the circuit parameters in the impedance transformation network and the movement of the impedance points.
The Z L in Figure 9 indicates the coil equivalent impedance, that is, the starting impedance point, which can be obtained from the Smith chart previously simulated in HFSS. The quality factor after adding the impedance transformation network is determined by:
Q = ω L R s _ t o t
where R s _ t o t represents the equivalent resistance of the entire resonant tank. After determining the quality factor of the circuit, the equivalent series resistance of the entire loop can be calculated. The resistance R 1 in the transform network is determined by:
R 1 = R s _ t o t R s = ω L Q R s
The starting point DP1 of the impedance transformation is marked in the Smith chart, and then the impedance point is adjusted to DP2 through the resistance R s calculated above. Then, the parallel capacitor C p shifts the impedance point to 50 Ω equal impedance circle, and finally, the impedance point is adjusted to the center of the impedance circle (the DP4 point) by the series capacitor C s , thus achieving an equivalent input impedance of 50 Ω at 13.56 MHz. The actual adjustment process is shown in Figure 9b.
After determining the circuit parameters in the series impedance transformation network by the Smith chart, the circuit model of the RLC lumped parameters is built in Figure 10. When the frequency is 13.56 MHz, S11 reaches −30 dB, achieving good impedance matching. In addition, a −10 dB bandwidth can be observed in Figure 10b, about 1.5 MHz. In the actual impedance matching process, the impedance transformation network parameters obtained by the Smith chart are often not accurate and reliable. It is necessary to establish a circuit model in HFSS for simulation to see if the center frequency is offset and whether it has the minimum return loss at the operating frequency point.
In addition to the transmitter impedance matching, it is necessary to model and simulate the coupled resonant circuit. As shown in Figure 11, it is a two-coil coupled resonance model designed and built in HFSS. The model is mainly used to analyze the coupling performance when the two coils are placed coaxially, and the discipline of the coupling signal with the distance between the coils.
The mutual inductance between the coils is affected by factors such as the coil structure, relative position, and space medium. In general, the closer the distance between the coils is, the larger the coupling coefficient is, and the mutual inductance is also increased, and the transfer efficiency is further increased [39]. On the contrary, the farther the transfer distance is, the smaller the coupling coefficient is, the mutual inductance is reduced, and the efficiency is also reduced. However, the transfer efficiency increases first and then decreases with the increase of the distance in Figure 12a.
The reason is that the distance between the coils is too close, resulting in over-coupling [40]. If the distance between the two coils is too close, the other coil is equivalent to a load, which changes the input impedance of the resonant tank. Because the load impedance changes, the previously designed conjugate matching circuit is destroyed, and the existing resonant circuit cannot be matched to the conjugate matching point, resulting in a large loss of the coil. Therefore, although the distance between the two coils is very close, not all signals are transmitted to the receiver coil due to the large loss between the coils. The coupling coefficient between the two coils is increased, but the signal transmitted to the receiving coil becomes smaller, which can be confirmed from the variation curve of S11 in Figure 12b.

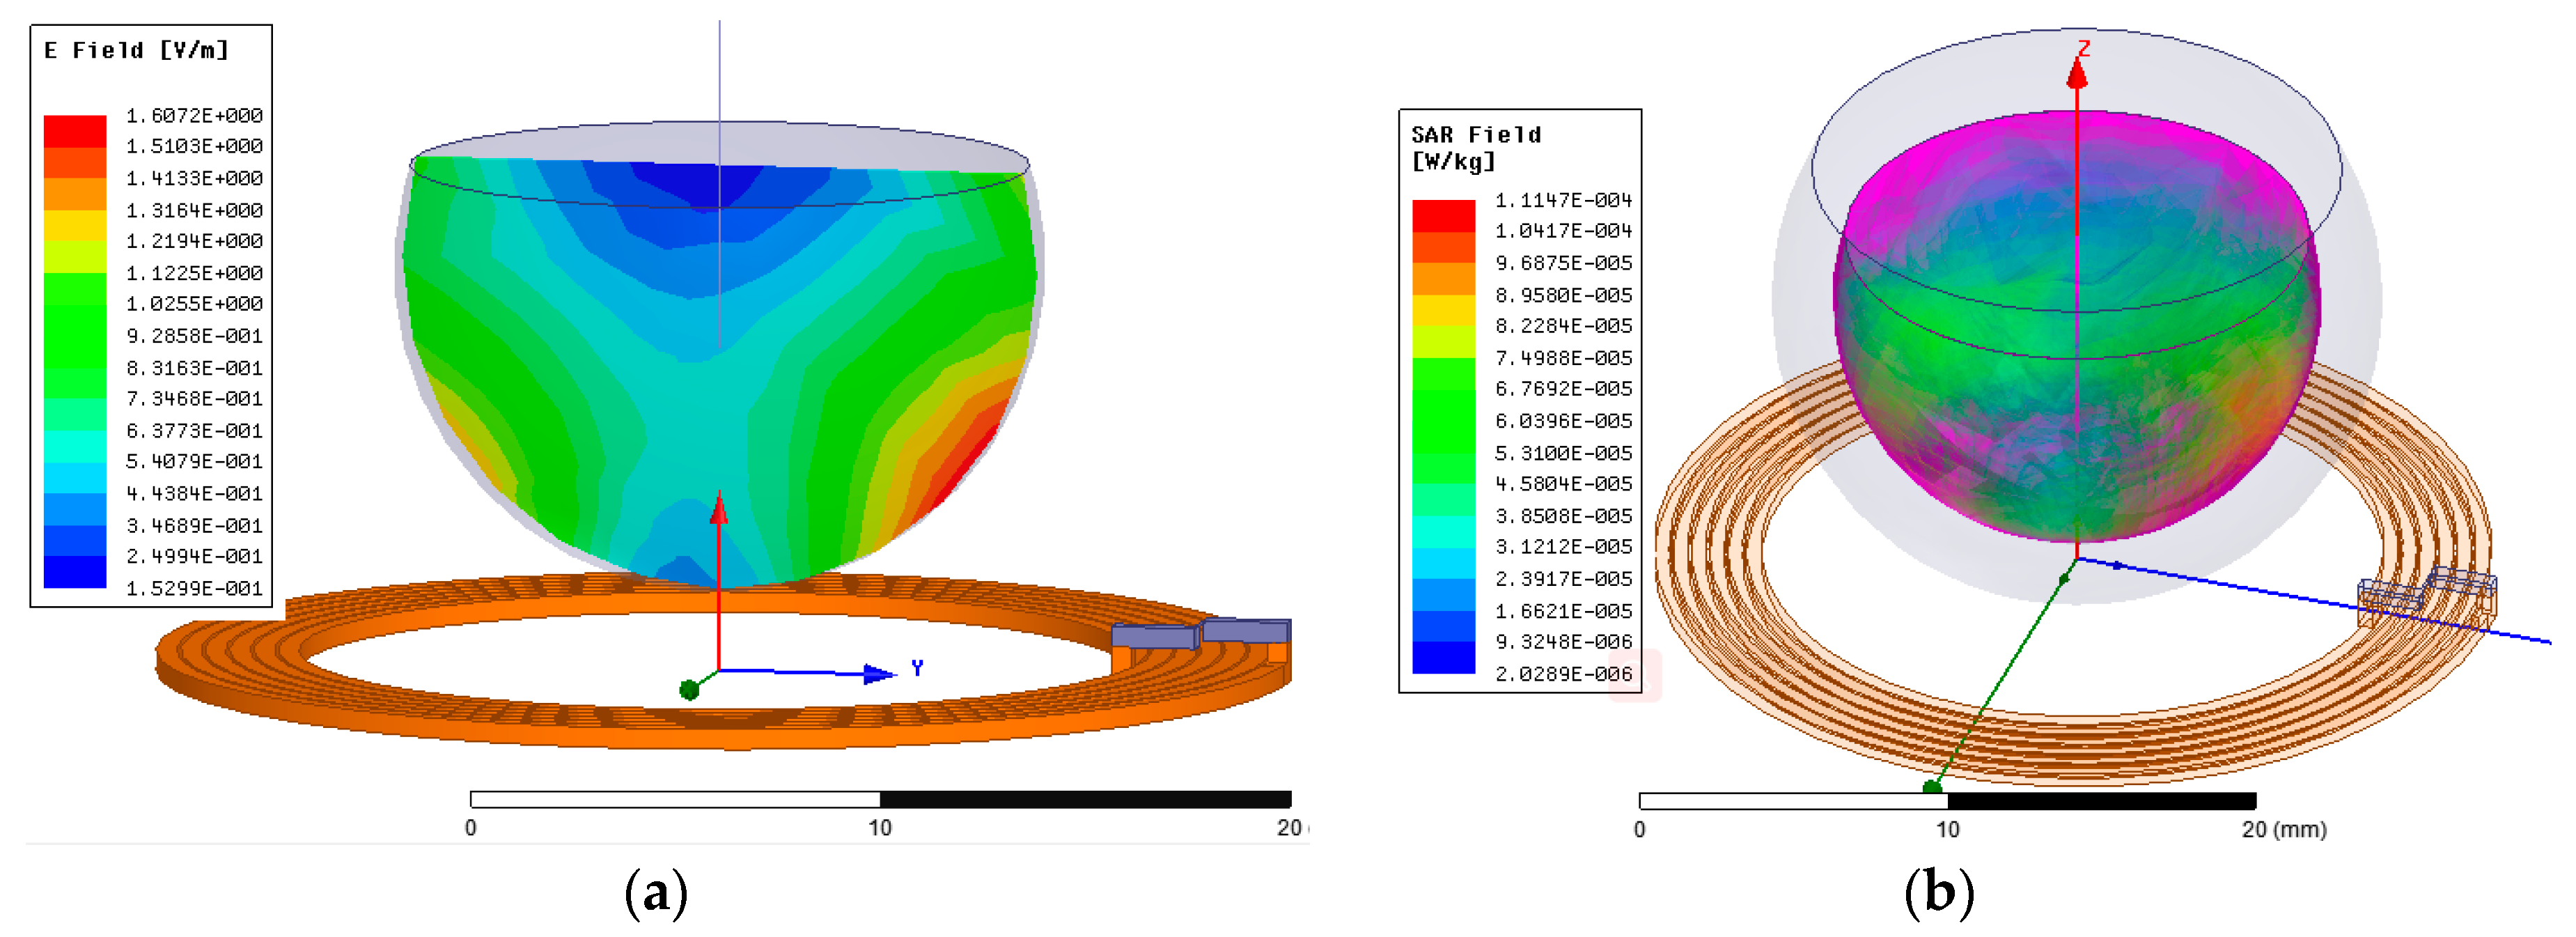
3.3. SAR Simulation Analysis

Implantable medical devices work in vivo environment, and as a result, the human body will inevitably absorb the radiation energy from the vitro antenna. Excessive radiation will lead to damage on tissue, which endangers human health. In order to estimate the influence of electromagnetic radiation on tissue, SAR (Special Absorption Rate) is used to measure the amount of electromagnetic radiation absorbed, defined as the RF energy consumed per unit of biological mass per unit time. If the electric field distribution on human tissues is derived, the SAR value can be calculated as:
S A R = d d t ( d W d m ) = d d t ( d W ρ d V ) = σ ρ | E | 2
where σ is the conductivity of human tissue, E represents the average electric field intensity, ρ is tissue density. A smaller SAR value indicates lower RF energy absorbed by biological tissue, and a lower risk to human health.
In order to evaluate the radiation effect of the proposed WPT system, a SAR simulation model is created in HFSS to analyze the radiation absorption of human brain tissue when the WPT system is operating normally. The relative permittivity and dielectric loss tangent of brain tissue fluid in the model are 41.5 and 0.9, respectively. The parameters of the shell material swelled with brain tissue are 4.6 and 0.01, respectively. The brain tissue simulated electric field and SAR value distribution illustrated in Figure 13.
Figure 13a displays the electric field distribution of the brain tissue section. According to the above formula, the SAR value of each position can be calculated. The closer to the coil, the greater the electric field strength, and the stronger the electromagnetic radiation. Figure 13b depicts the SAR value of the entire brain tissue. The bottom of the spherical tissue is the closest to the extracorporeal coil, and the corresponding SAR value is also the largest. According to the IEEEC95.1-2005 standard, it is specified that the average SAR in any cubic biological tissue with a mass of 10 g cannot exceed 2 W/kg. The SAR value obtained by simulation analysis is far lower than the standard specified value. Therefore, the proposed power transfer system has little effect on human tissues.

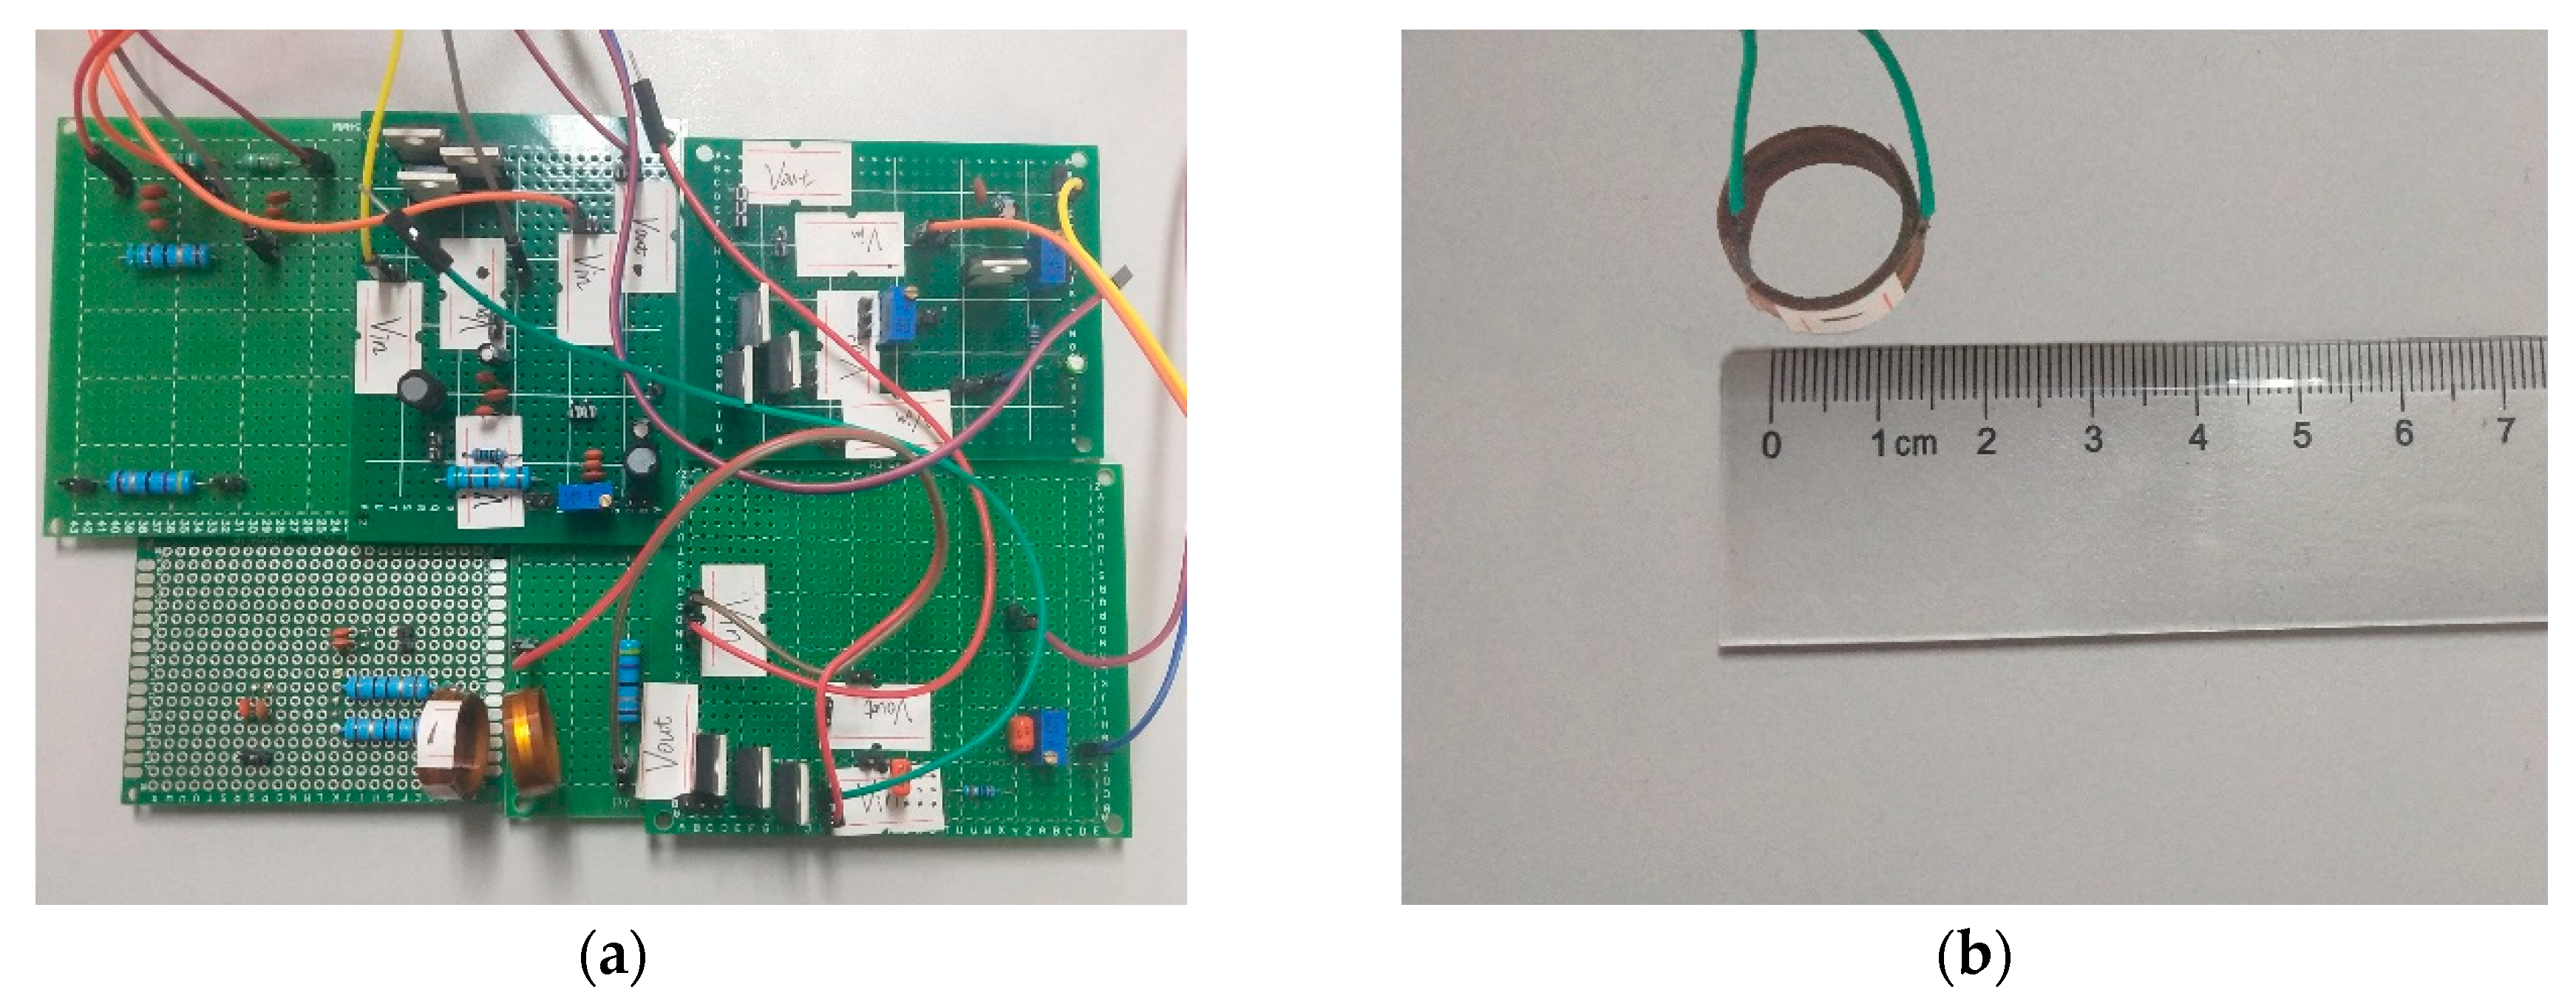
4. Experimental Performances

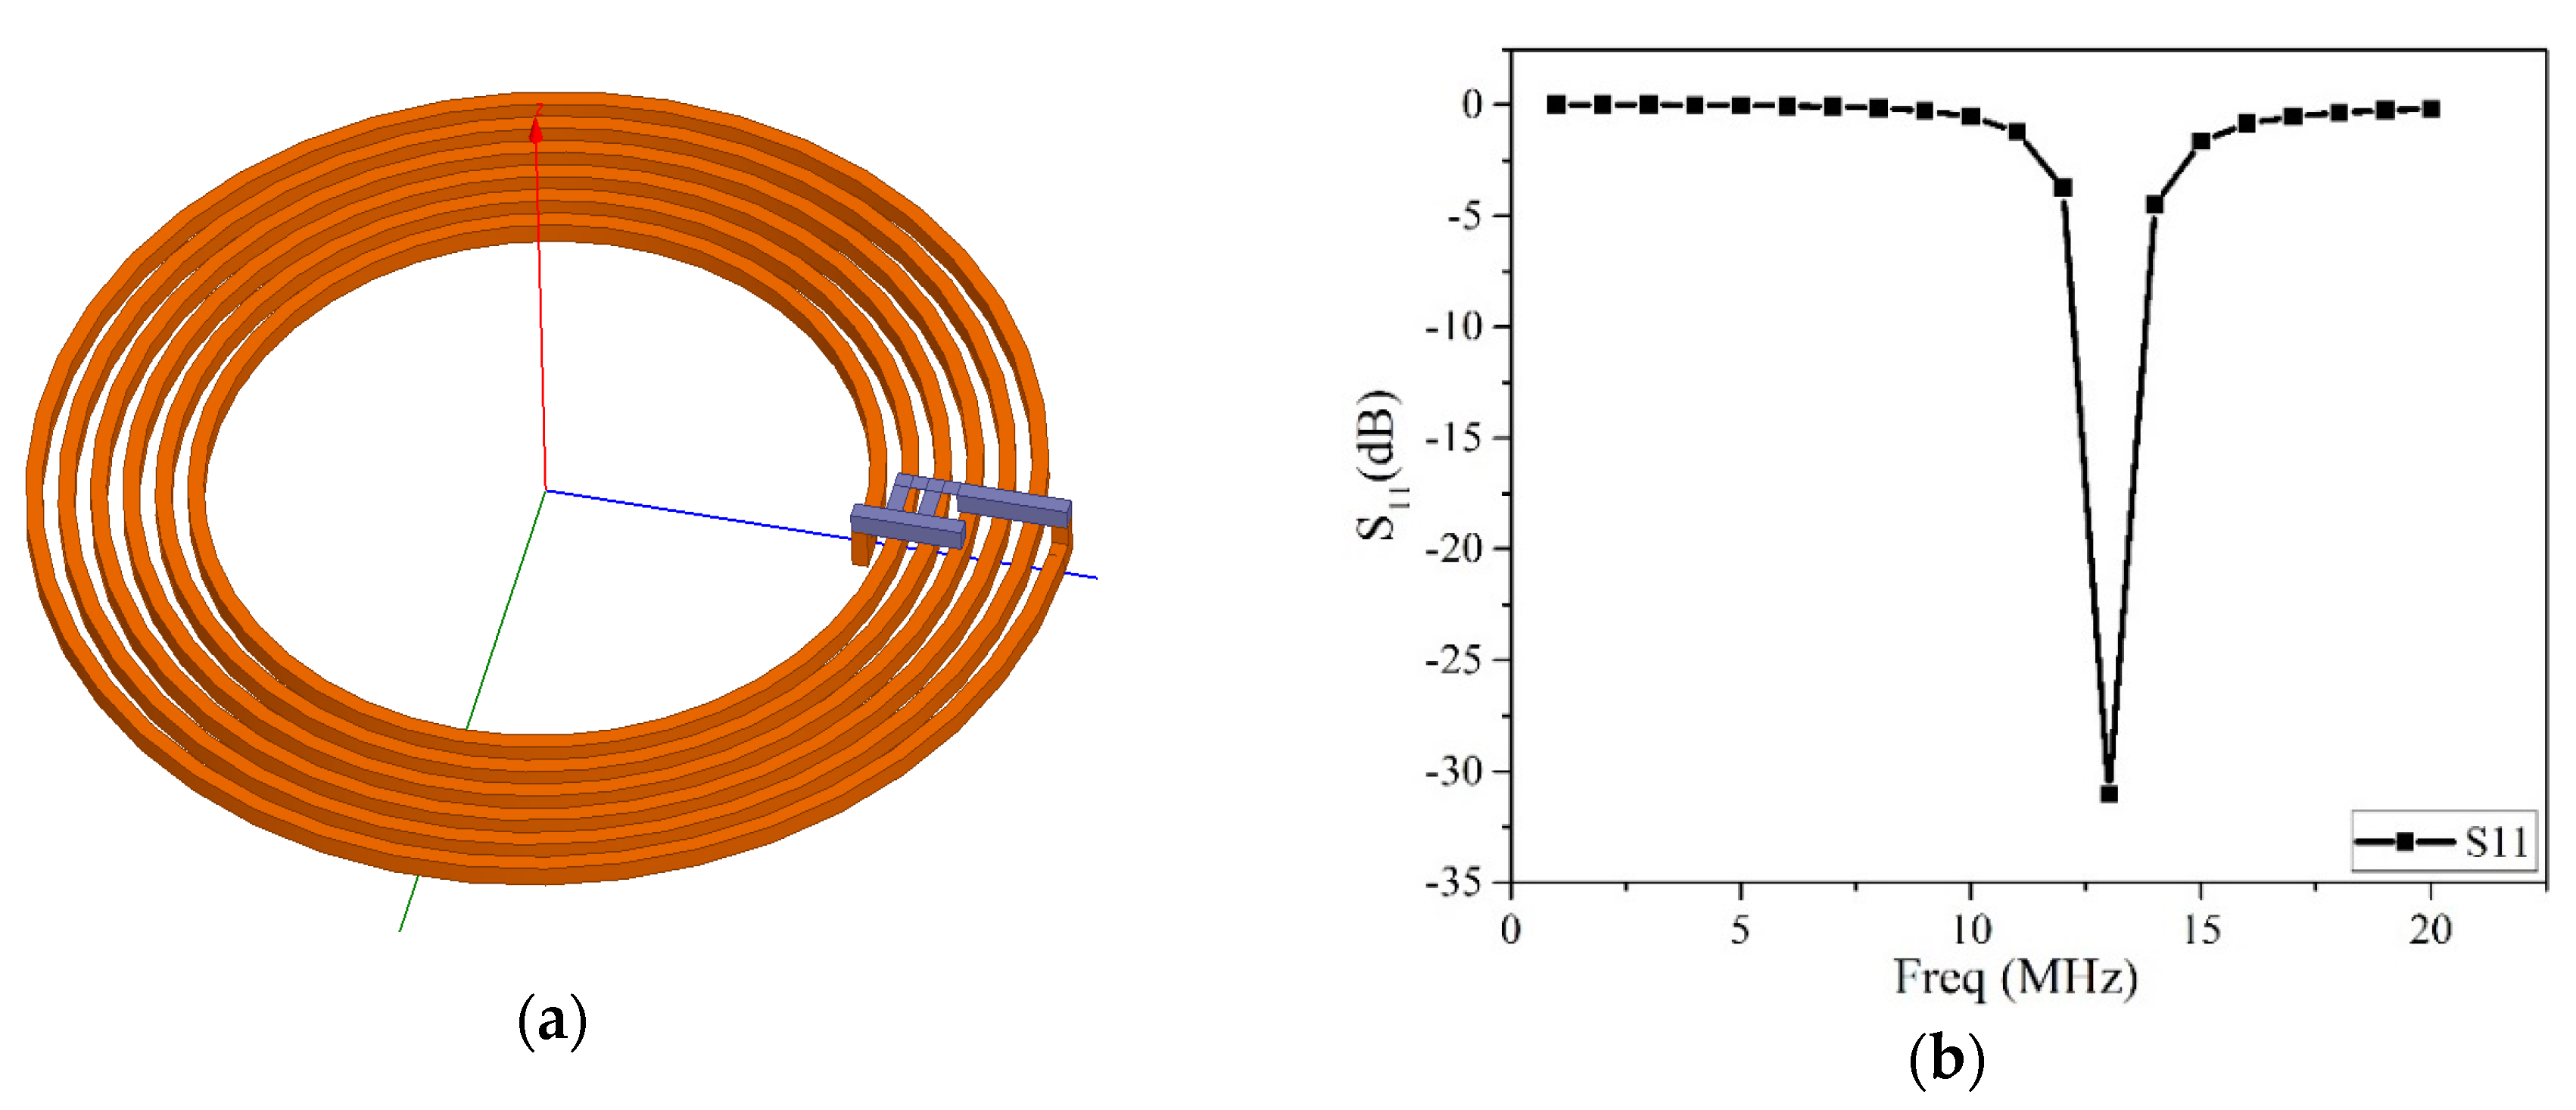
4.1. Coupling Resonant Loop Measurement after Impedance Matching

Based on the optimized coil structure parameters in Table 2 and impedance matching network parameters determined in Section 3, respectively, the coupled resonant tank consists of two flexible resonant coils with a radius of 10 mm. The input excitation uses the Agilent function signal generator 33120A, and the received output voltage is measured through Keysight digital oscilloscope MSO9254A, which can provide up to 10G/s sampling frequency. The input signal is a sine wave with 13.56 MHz and Vrms = 1 V. The Figure 14a shows the output voltage at the receiver when the transfer distance (the distance between the centers of the two coils) is 8 mm, and the Vrms is 3.36 V.
In order to analyze the influence of the transfer distance on the coupling between the coils, the voltage received at different transfer distances is measured in Figure 14b. When the transfer distance is 6 mm, the receiver has the highest induced voltage 3.56 V. When the transfer distance is greater than 6 mm, the output voltage received decreases as the transfer distance increases. As the distance between the coils increases, the coupling between the two coils decreases, and the mutual inductance between the coils decreases, which results in reduced induced voltage.

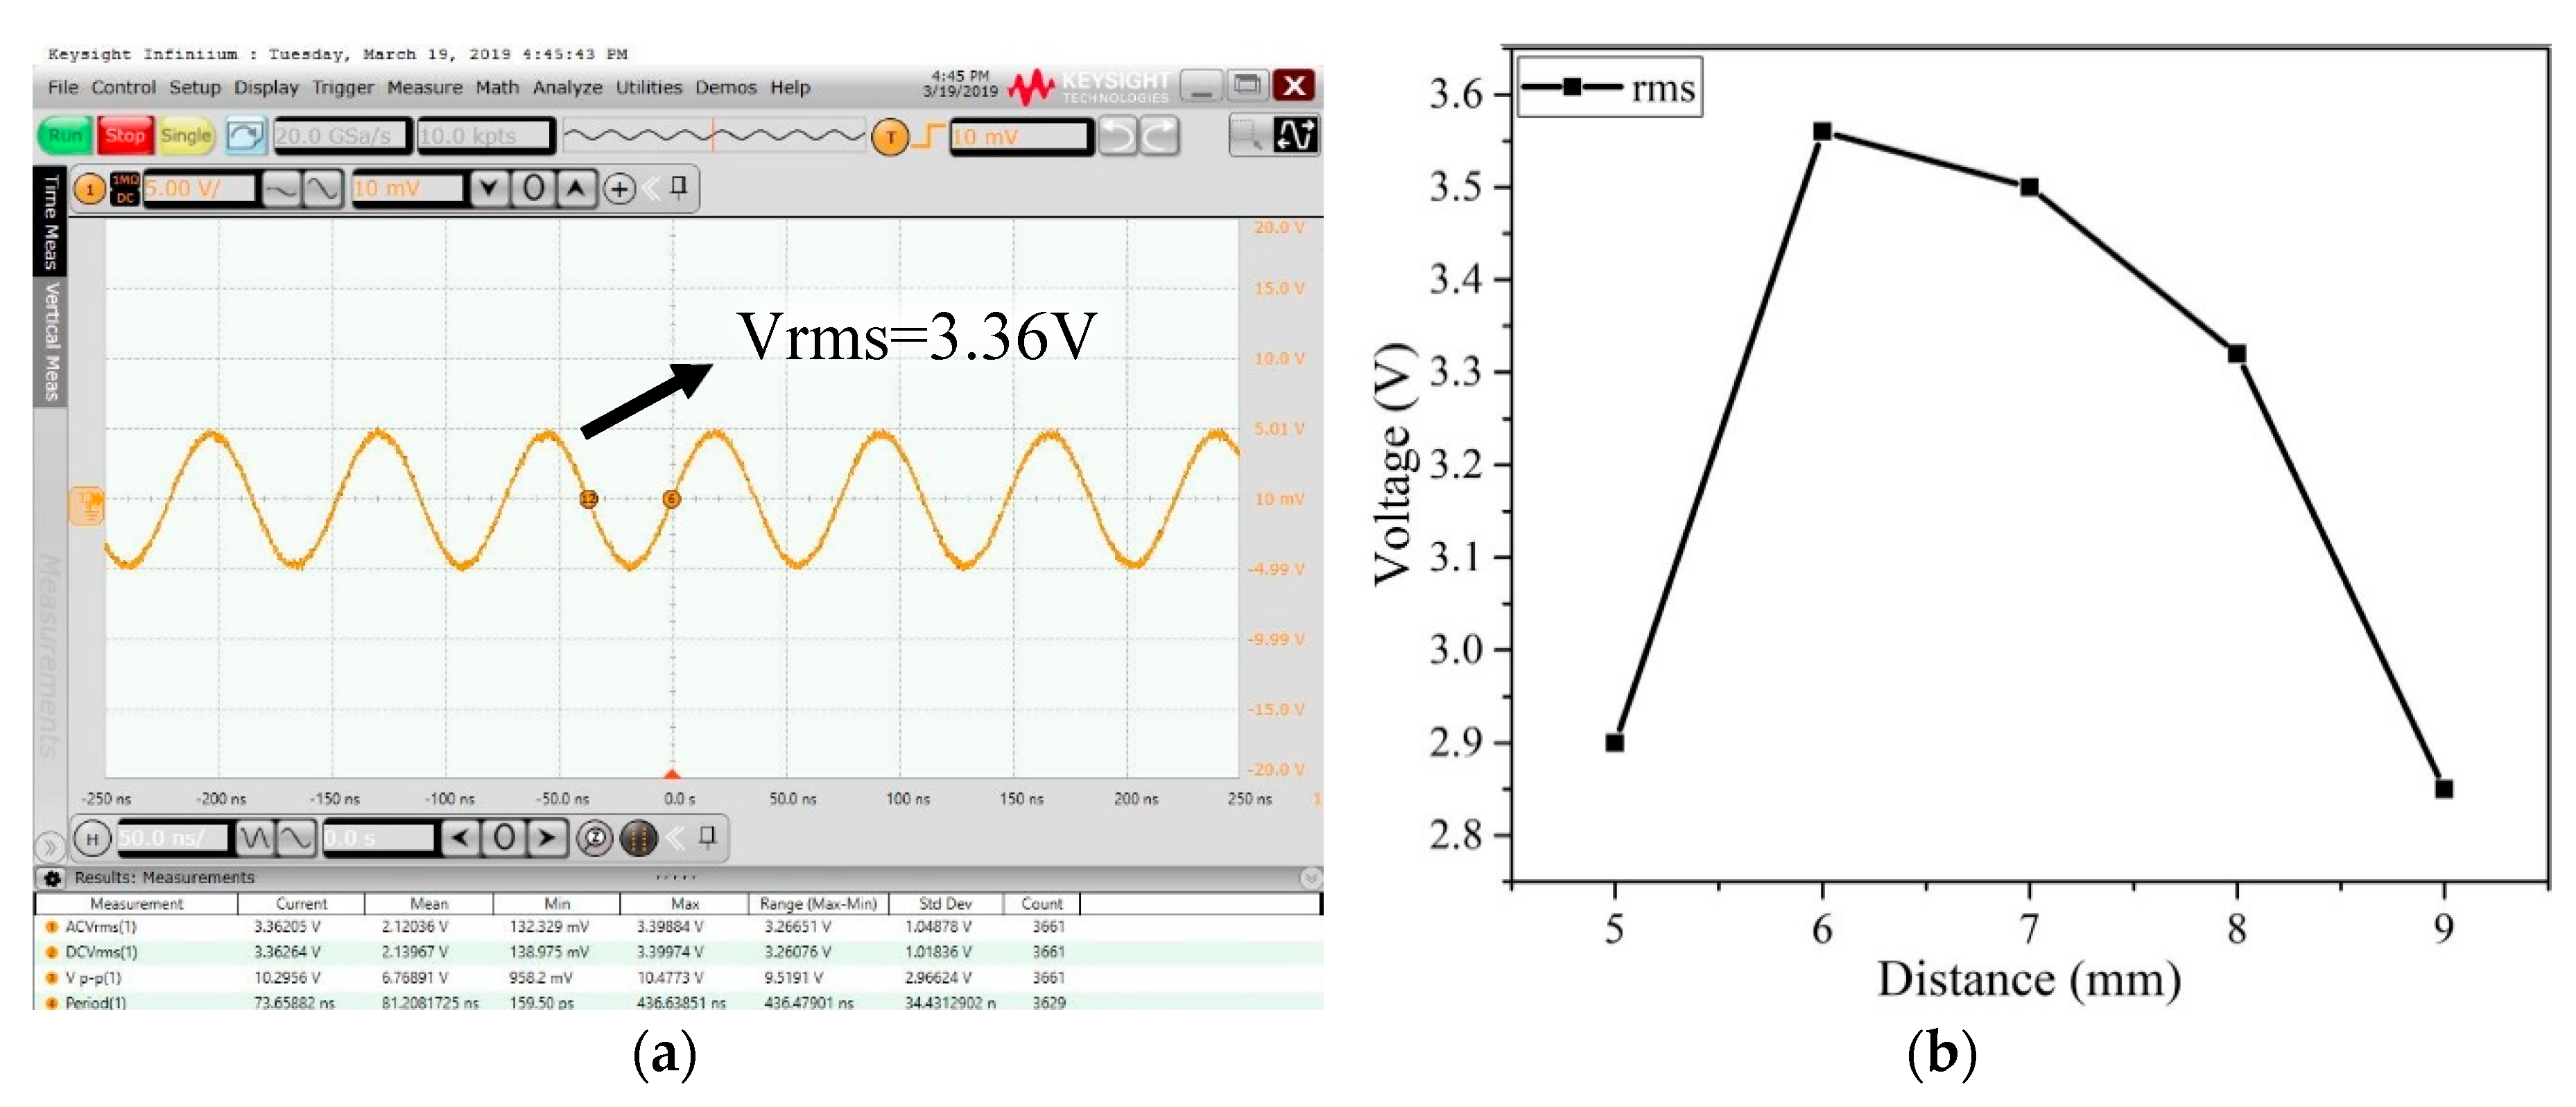
4.2. Wireless Power Transfer System Measurement

The implemented wireless power transfer system circuit is composed of a coupling module, rectification, low-pass filter, and voltage regulator module. The lower left corner of Figure 15a is the coupled resonant module after impedance matching. The upper left corner is the rectifier module, the lower right corner is the CRC filter module, and the upper right corner is the voltage regulator module. Figure 15b is a resonant coil with a radius of 10 mm, which exhibits good flexibility and biocompatibility, comparable to a typical implantable electronic device.
Section 3.2 has demonstrated the effect of the transfer distance on the output voltage. The analysis shows that the maximum output voltage is obtained when the transfer distance is 6 mm. The transfer distance remains invariable, and the output power under different loads is measured. The measuring results are in Figure 16.
The receiver loop, excepting the load, can be regarded as a source when the system is operating normally. When the load impedance is less than the source internal resistance, the output power increases as the load impedance increases, consistent with the trend of the output power in Figure 16. When the load impedance is approximately equal to the source internal resistance, particularly the load increase from 500 to 1000 Ω, the output power reaches the maximum and remains substantially stable, close to 70 mW. Once the load impedance is greater than the source internal resistance, the output power will decrease, which is why the output power decreases when the load is greater than 1000 Ω. When the load is 1000 Ω, the maximum output power is 70 mW and the transmission efficiency is 35%.
A comparative analysis of the performance evaluation performed in current proposals is summarized in the Table 3. Proposed WPTS are compared with respect to different evaluation parameters, such as magnetic core, coil diameter, power transfer efficiency, wearable. Compared to previous contributions, the coil designed in our work is only a little larger than theirs, but our transfer efficiency has been greatly improved. What’s more, the coil is more flexible and wearable.

5. Conclusions

In this work, a novel improved implanted wireless power transfer system was presented. The dual-coil coupled resonance model was established and the factors affecting transmission efficiency were analyzed. The influence of coil structure parameters on the coil performance was analyzed by HFSS simulation, and the optimized coil structure parameters were obtained. Then the impedance matching circuit and the SAR estimation were implemented. Finally, the overall wireless power transfer system link was built, and the measuring results showed the relationship between the output power and the load. When the transfer distance is 6 mm, the load is 1 kΩ, the system operating frequency is 13.56 MHz, the input signal power is 200 mW, and the output power is 70 mW. At this point, the system has the highest transfer efficiency of 35%.

Author Contributions

Conceptualization, D.X., X.L.; methodology, D.X.; data curation, D.X., Q.Z.; investigation, Q.Z.; resources, X.L.; writing—review and editing, D.X.; funding acquisition, X.L.; supervision, X.L. All authors have read and agreed to the published version of the manuscript.

Funding

This research was funded by National Key Research and Development Program of China (No.2016YFB1200203), National Natural Science Foundation of China (60706031 and 61574015), Beijing; National Science Foundation (4122058, 4172051).

Acknowledgments

This work is supported by National Key Research and Development Program of China (No.2016YFB1200203), National Natural Science Foundation of China (60706031 and 61574015), Beijing; National Science Foundation (4122058, 4172051).

Conflicts of Interest

The authors declare no conflict of interest.

References

  1. Dai, Z.; Wang, J.; Jin, L.; Jing, H.; Fang, Z.; Hou, H. A Full-Freedom Wireless Power Transfer for Spheroid Joints. IEEE Access 2019, 7, 18675–18684. [Google Scholar] [CrossRef]
  2. Basar, M.R.; Ahmad, M.Y.; Cho, J.; Ibrahim, F. An improved wearable resonant wireless power transfer system for biomedical capsule endoscope. IEEE Trans. Ind. Electron. 2018, 65, 7772–7781. [Google Scholar] [CrossRef]
  3. Yang, C.L.; Chang, C.K.; Lee, S.Y.; Chang, S.J.; Chiou, L.Y. Efficient four-coil wireless power transfer for deep brain stimulation. IEEE Trans. Microw. Theory Tech. 2017, 65, 2496–25071. [Google Scholar] [CrossRef]
  4. Manoufali, M.; Bialkowski, K.; Mohammed, B.; Abbosh, A. Wireless power link based on inductive coupling for brain implantable medical devices. IEEE Antennas Wirel. Propag. Lett. 2017, 17, 160–163. [Google Scholar] [CrossRef]
  5. Shekarforoush, M.; Barton, K.I.; Atarod, M.; Heard, B.J.; Sevick, J.L.; Martin, R.; Hart, D.A.; Frank, C.B.; Shrive, N.G. An explicit method for analysis of three-dimensional linear and angular velocity of a joint, with specific application to the knee joint. J. Med Biol. Eng. 2018, 38, 273–283. [Google Scholar] [CrossRef] [Green Version]
  6. Xiao, C.; Cheng, D.; Wei, K. An LCC-C compensated wireless charging system for implantable cardiac pacemakers: Theory, experiment, and safety evaluation. IEEE Trans. Power Electron. 2017, 33, 4894–4905. [Google Scholar] [CrossRef]
  7. Mashhadi, I.A.; Pahlevani, M.; Hor, S.; Pahlevani, H.; Adib, E. A New Wireless Power Transfer Circuit for Retinal Prosthesis. IEEE Trans. Power Electron. 2019, 34, 6425–6439. [Google Scholar] [CrossRef]
  8. Fernandez, C.; Garcia, O.; Cobos, J.A.; Uceda, J. A simple dc-dc converter for the power supply of a cochlear implant. In Proceedings of the IEEE 34th Annual Conference on Power Electronics Specialist, Acapulco, Mexico, 15–19 June 2003; Volume 4, pp. 1965–1970. [Google Scholar]
  9. Sugino, M.; Kondo, H.; Takeda, S. Linear motion type transfer robot using the wireless power transfer system. In Proceedings of the 2016 International Symposium on Antennas and Propagation (ISAP), Okinawa, Japan, 24–28 October 2016; pp. 508–509. [Google Scholar]
  10. Ayisire, E.; El-Shahat, A.; Sharaf, A. Magnetic Resonance Coupling Modelling for Electric Vehicles Wireless Charging. In Proceedings of the 2018 IEEE Global Humanitarian Technology Conference (GHTC), San Jose, CA, USA, 18–21 October 2018; pp. 1–2. [Google Scholar]
  11. Dong, S.; Li, X.; Yu, X.; Dona, Y.; Cui, H.; Cui, T.; Wang, Y.; Liu, S. Hybrid Mode Wireless Power Transfer for Wireless Sensor Network. In Proceedings of the 2019 IEEE Wireless Power Transfer Conference (WPTC), London, UK, 17–23 June 2019; pp. 561–564. [Google Scholar]
  12. Kesler, M. Wireless Charging of Electric Vehicles. In Proceedings of the 2018 IEEE Wireless Power Transfer Conference (WPTC), Montreal, QC, Canada, 3–7 June 2018. [Google Scholar]
  13. Samal, S.K.; Kar, D.P.; Sahoo, P.K.; Bhuyan, S.; Das, S.N. Analysis of the effect of design parameters on the power transfer efficiency of resonant inductive coupling based wireless EV charging system. In Proceedings of the 2017 Innovations in Power and Advanced Computing Technologies (i-PACT), Vellore, India, 21–22 April 2017; pp. 1–4. [Google Scholar]
  14. Corti, F.; Reatti, A.; Pierini, M.; Barbieri, R.; Berzi, L.; Nepote, A.; Magneti, P.D.L.P. A Low-Cost Secondary-Side Controlled Electric Vehicle Wireless Charging System using a Full-Active Rectifier. In Proceedings of the 2018 International Conference of Electrical and Electronic Technologies for Automotive, Milan, Italy, 9–11 July 2018; pp. 1–6. [Google Scholar]
  15. Sato, N.S.; Jodoi, D. Basic Study for Wireless Power Transfer to a Pipeline Inspection Robot. In Proceedings of the 2018 IEEE Wireless Power Transfer Conference (WPTC), Montreal, QC, Canada, 3–7 June 2018; pp. 1–4. [Google Scholar]
  16. Anyapo, C. Development of Long Rail Dynamic Wireless Power Transfer for Battery-Free Mobile Robot. In Proceedings of the 2019 10th International Conference on Power Electronics and ECCE Asia (ICPE 2019—ECCE Asia), Busan, Korea (South), 27–30 May 2019; pp. 1–6. [Google Scholar]
  17. Allotta, B.; Pugi, L.; Reatti, A.; Corti, F. Wireless power recharge for underwater robotics. In Proceedings of the 2017 IEEE International Conference on Environment and Electrical Engineering and 2017 IEEE Industrial and Commercial Power Systems Europe (EEEIC/I&CPS Europe), Milan, Italy, 6–9 June 2017; pp. 1–6. [Google Scholar]
  18. Chen, J.; Yu, C.W.; Ouyang, W. Efficient Wireless Charging Pad Deployment in Wireless Rechargeable Sensor Networks. IEEE Access 2020, 8, 39056–39077. [Google Scholar] [CrossRef]
  19. Wang, N.; Wu, J.; Dai, H. Bundle Charging: Wireless Charging Energy Minimization in Dense Wireless Sensor Networks. In Proceedings of the 2019 IEEE 39th International Conference on Distributed Computing Systems (ICDCS), Dallas, TX, USA, 7–10 July 2019; pp. 810–820. [Google Scholar]
  20. Krikidis, I. Average Age of Information in Wireless Powered Sensor Networks. IEEE Wirel. Commun. Lett. 2019, 8, 628–631. [Google Scholar] [CrossRef] [Green Version]
  21. Ke, Q.; Luo, W.; Yan, G.; Yang, K. Analytical model and optimized design of power transmitting coil for inductively coupled endoscope robot. IEEE Trans. Biomed. Eng. 2016, 63, 694–706. [Google Scholar] [CrossRef]
  22. Shadid, R.; Noghanian, S. Hybrid power transfer and wireless antenna system design for biomedical implanted devices. In Proceedings of the International Applied Computational Electromagnetics Society Symposium (ACES), Beijing China, 29 July–1 August 2018; pp. 1–2. [Google Scholar]
  23. Delhaye, T.P.; André, N.; Gilet, S.; Gimeno, C.; Francis, L.A.; Flandre, D. High-efficiency wireless power transfer for mm-size biomedical implants. IEEE Sens. 2017. [Google Scholar] [CrossRef]
  24. Kim, D.; Park, J.; Park, H.H.; Ahn, S. Generation of magnetic propulsion force and torque for microrobot using wireless power transfer coil. IEEE Trans. Magn. 2015, 51, 1–4. [Google Scholar] [CrossRef]
  25. Narayanamoorthi, R.; Juliet, A.V.; Chokkalingam, B. Frequency splitting-based wireless power transfer and simultaneous propulsion generation to multiple micro-robots. IEEE Sens. J. 2018, 18, 5566–5575. [Google Scholar] [CrossRef]
  26. Kim, D.; Hwang, K.; Park, J.; Park, H.H.; Ahn, S. High efficiency wireless power and force transfer for micro-robot using 3-axis AC/DC magnetic coil. In Proceedings of the IEEE Conference on Electromagnetic Field Computation, Miami, FL, USA, 13–16 November 2016; p. 1. [Google Scholar]
  27. Kim, D.; Park, J.; Kim, K.; Park, H.H.; Ahn, S. Propulsion and control of implantable micro-robot based on wireless power transfer. In Proceedings of the IEEE Wireless Power Transfer Conference (WPTC), Boulder, CO, USA, 13–15 May 2015; pp. 1–4. [Google Scholar]
  28. Smith, S.; Tang, T.B.; Stevenson, J.T.M.; Flynn, B.W.; Reekie, H.M.; Murray, A.F.; Gundlach, A.M.; Renshaw, D.; Dhillon, B.; Ohtori, A.; et al. Miniaturised drug delivery system with wireless power transfer and communication. MEMS Sens. Actuators Inst. Eng. Technol. Semin. IET 2007. [Google Scholar] [CrossRef]
  29. Basar, M.R.; Ahmad, M.Y.; Cho, J.; Ibrahim, F. A 3-coil wireless power transfer system with fine tuned power amplifier for biomedical capsule. In Proceedings of the 2017 IEEE Asia Pacific Microwave Conference (APMC), Kuala Lumpur, Malaysia, 13–16 November 2017; pp. 142–145. [Google Scholar]
  30. Seo, Y.S.; Nguyen, M.Q.; Hughes, Z.; Rao, S.; Chiao, J.C. Wireless power transfer by inductive coupling for implantable batteryless stimulators. In Proceedings of the 2012 IEEE/MTT-S International Microwave Symposium Diges, Montreal, QC, Canada, 17–22 June 2012; pp. 1–3. [Google Scholar]
  31. Khalifa, A.; Karimi, Y.; Wang, Q.; Garikapati, S.; Montlouis, W.; Stanaćević, M.; Thakor, N.; Etienne-Cummings, R. The microbead: A highly miniaturized wirelessly powered implantable neural stimulating system. IEEE Trans. Biomed. Circuits Syst. 2018, 12, 521–531. [Google Scholar] [CrossRef]
  32. Li, L.; Liu, H.; Zhang, H.; Xue, W. Efficient wireless power transfer system integrating with metasurface for biological applications. IEEE Trans. Ind. Electron. 2017, 65, 3230–3239. [Google Scholar] [CrossRef]
  33. Du, S.; Chan, E.K.; Wen, B.; Hong, J.; Widmer, H.; Wheatley, C.E. Wireless power transfer using oscillating magnets. IEEE Trans. Ind. Electron. 2017, 65, 6259–6269. [Google Scholar] [CrossRef]
  34. Raju, S.; Wu, R.; Chan, M.; Yue, C.P. Modeling of mutual coupling between planar inductors in wireless power applications. IEEE Trans. Power Electron. 2013, 29, 481–490. [Google Scholar] [CrossRef]
  35. Liu, H.; Shao, Q.; Fang, X. Modeling and optimization of class-E amplifier at subnominal condition in a wireless power transfer system for biomedical implants. IEEE Trans. Biomed. Circuits Syst. 2016, 11, 35–43. [Google Scholar] [CrossRef]
  36. Liu, C.; Jiang, C.; Song, J.; Chau, K.T. An effective sandwiched wireless power transfer system for charging implantable cardiac pacemaker. IEEE Trans. Ind. Electron. 2019, 66, 4108–4117. [Google Scholar] [CrossRef]
  37. Jow, U.M.; Ghovanloo, M. Design and optimization of printed spiral coils for efficient transcutaneous inductive power transmission. IEEE Trans. Biomed. Circuits Syst. 2007, 1, 193–202. [Google Scholar] [CrossRef]
  38. Corti, F.; Grasso, F.; Paolucci, L.; Pugi, L.; Luchetti, L. Circular Coil for EV Wireless Charging Design and Optimization Considering Ferrite Saturation. In Proceedings of the 2019 IEEE 5th International forum on Research and Technology for Society and Industry (RTSI), Florence, Italy, 9–12 September 2019; pp. 279–284. [Google Scholar]
  39. Chen, B.; Li, X.; Li, B.; Li, Y.; Guo, W. Wireless energy transfer system based on 3D wearable litz double coils. Microsyst. Technol. 2017, 23, 959–966. [Google Scholar] [CrossRef]
  40. Lee, W.S.; Son, W.I.; Oh, K.S.; Yu, J.W. Contactless energy transfer systems using antiparallel resonant loops. IEEE Trans. Ind. Electron. 2013, 60, 350–359. [Google Scholar] [CrossRef]
  41. Sun, T.; Xie, X.; Li, G.; Gu, Y.; Deng, Y.; Wang, Z. A two-hop wireless power transfer system with an efficiency-enhanced power receiver for motion-free capsule endoscopy inspection. IEEE Trans. Biomed. Eng. 2012, 59, 3247–3254. [Google Scholar]
  42. Na, K.; Jang, H.; Ma, H.; Bien, F. Tracking optimal efficiency of magnetic resonance wireless power transfer system for biomedical capsule endoscopy. IEEE Trans. Microw. Theory Tech. 2014, 63, 295–304. [Google Scholar] [CrossRef]
  43. Basar, M.R.; Ahmad, M.Y.; Cho, J.; Ibrahim, F. Stable and high-efficiency wireless power transfer system for robotic capsule using a modified Helmholtz coil. IEEE Trans. Ind. Electron. 2016, 64, 1113–1122. [Google Scholar] [CrossRef]
Figure 1. Schematic diagram of wireless power transfer system.
Sustainability 12 04149 g001
Figure 2. Energy transfer model based on dual-coil resonance.
Sustainability 12 04149 g002
Figure 3. Coil modeling and simulation: (a) Parametric coil model created in HFSS. (b) Coil impedance changes with frequency.
Sustainability 12 04149 g003
Figure 4. Effect of coil turns on coil performance: (a) Coil inductance change with the coil turns and (b) quality factor change with the coil turns.
Sustainability 12 04149 g004
Figure 5. Effect of coil radius on coil performance: (a) Coil inductance change with the coil radius and (b) quality factor change with the coil radius.
Sustainability 12 04149 g005
Figure 6. Effect of wire pitch on coil performance: (a) Coil inductance change with the wire pitch and (b) quality factor change with the wire pitch.
Sustainability 12 04149 g006
Figure 7. Effect of wire width on coil performance: (a) Coil inductance change with the wire width and (b) quality factor change with the wire width.
Sustainability 12 04149 g007
Figure 8. Series impedance transformation network topology.
Sustainability 12 04149 g008
Figure 9. Impedance matching design: (a) Impedance matching in series and (b) impedance point shift on Smith chart.
Sustainability 12 04149 g009
Figure 10. Modeling and simulation of impedance matching circuit: (a) Lumped parameter model after impedance matching build in High Frequency Structure Simulator (HFSS) and (b) S11 variation with frequency.
Sustainability 12 04149 g010
Figure 11. Dual coil coupled resonance model and its magnetic field distribution.
Sustainability 12 04149 g011
Figure 12. Simulation S parameter changes with transfer distance: (a) S21 variation with transfer distance and (b) S11 variation with transfer distance.
Sustainability 12 04149 g012
Figure 13. Simulation analysis of radiation from vitro antenna to brain tissue: (a) Electric field distribution of brain tissue; (b) SAR (Special Absorption Rate) value distribution of brain tissue.
Sustainability 12 04149 g013
Figure 14. (a) Resonant coupling loop output waveform after impedance matching. (b) Induced output voltage (Vrms) changes with the transfer distance.
Sustainability 12 04149 g014
Figure 15. (a) Wireless energy transfer system circuit. (b) Resonant coil size.
Sustainability 12 04149 g015
Figure 16. Output power with load curve (transfer distance is 6 mm).
Sustainability 12 04149 g016
Table 1. Inductance calculation parameters of different shapes.
Coil TypeC1C2C3C4
Quadrilateral1.272.070.180.13
Hexagon1.092.2300.17
Octagon1.072.2900.19
Circle12.4600.2
Table 2. Coil structure parameters list after optimization.
Coil Structure ParametersValueUnits
Coil radius10mm
Wire width0.5mm
Wire thickness0.5mm
Coil turns6turns
Wire pitch0.6mm
Table 3. The comparison between our work and previous works.
Ref.Magnetic CoreReceiver Coil Diameter (cm)PTE (%)Wearable
[41] 2012with1.13.04not
[42] 2015without0.90.02not
[21] 2016with0.953.55not
[43] 2017with1.144.9not
[2] 2018with1.28.21not
[2] 2018with1.25.4not
This workwithout2.035flexible

