Article

Heating Temperature Prediction of Concrete Structure Damaged by Fire Using a Bayesian Approach

1
Department of Architectural Engineering, University of Seoul, 163 Siripdae-ro, Dongdaemun-gu, Seoul 02504, Korea
2
Korea Institute of Civil Engineering & Building Technology (KICT), 182-64 Mado-ro, Mado-myeon, Hwaseong 18544, Korea
3
Centre for Infrastructure Engineering, Western Sydney University, Locked Bag 1797, Penrith South DC NSW 2751, Australia
*
Author to whom correspondence should be addressed.
Sustainability 2020, 12(10), 4225; https://doi.org/10.3390/su12104225
Submission received: 31 March 2020 / Revised: 13 May 2020 / Accepted: 18 May 2020 / Published: 21 May 2020

Abstract

:
A fire that occurs in a reinforced concrete (RC) structure accompanies a heating temperature, and this negatively affects the concrete material properties, such as the compressive strength, the bond between cement paste and aggregate, and the cracking and spalling of concrete. To appropriately measure the reduced structural performance and durability of fire-damaged RC structures, it is important to accurately estimate the heating temperature of the structure. However, studies in the literature on RC structures damaged by fire have focused mostly on structural member tests at elevated temperatures to ensure the fire resistance or fire protection material development; studies on estimating the heating temperature are very limited except for the very few existing models. Therefore, in this study, a heating temperature estimation model for a reinforced concrete (RC) structure damaged by fire was developed using a statistical Bayesian parameter estimation approach. For the model development, a total of 77 concrete test specimens were utilized; based on them, a statistically highly accurate model has been developed. The usage of the proposed method in the framework of the 500 °C isotherm method in Eurocode 2 has been illustrated through an RC column resistance estimation application.

1. Introduction

When a reinforced concrete (RC) structure is damaged by fire, the concrete generally deteriorates, which results in the degradation of the structural performance and durability. Calcium-silicate-hydrate (C-S-H) in concrete paste decomposes at high temperatures, and this weakens the bond between the cement and aggregate, reduces the concrete compressive strength, and generates micro-pores and micro-cracks [1]. Furthermore, when water vapor pressure in micro-pores exceeds the tensile strength of concrete, cracking and spalling occur on the surface of concrete. As the reduced structural performance and durability due to fire directly affect the safety of a structure, they should be accurately assessed to check the reusability of a structure after fire suppression. In most fire resistance assessments, the heating temperature can be roughly estimated based on the standard fire curves in ISO 834-1 [2] and ASTM E119 [3]. Eurocode 2 [4] provides the 500 °C isotherm method, which can assess the structural performance of RC structures damaged by fire—in which, if the heating temperature has exceeded 500 °C, the concrete compressive strength is regarded as being reduced to below 50% of its original value, as shown in Table 1. Based on this table, the 500 °C isotherm method estimates the temperature gradation from the surface to the internal part of a structural member section, and the sectional areas that have temperatures higher than 500 °C are considered to have no effective structural resistance. The internal temperatures of a structural member section are estimated based on the heating temperature, and, therefore, the heating temperature is a key parameter in assessing the post-fire structural performance of an RC structure damaged by fire.
An RC structure damaged by fire requires a fire inspection to make decisions on its reuse, repair, and/or reinforcement. The Architectural Institute of Japan (AIJ) [5] and Korea Concrete Institute (KCI) [6] provide guidelines to determine a fire damage grade considering various parameters, such as the crack width, concrete carbonation depth, spalling scale, concrete residual strength, and heating temperature, as illustrated in Figure 1. Among these parameters, the heating temperature is the most important factor, as it affects other fire inspection criteria, such as crack, spalling, and carbonation. However, studies on estimating the heating temperature are limited in the literature, and existing studies of RC structures damaged by fire have mainly focused on conducting structural member tests to check the fire resistance performance or on developing fire-resistant/protection materials to minimize pre-fire damage [7,8,9,10,11,12]. Although these studies are important to minimize the loss of properties and lives, they mainly focused on pre-fire prevention, rather than post-fire remedial efforts, such as structural performance assessment and fire inspection. Therefore, a study on the development of heating temperature prediction models is required.
There are non-destructive test methods to estimate the heating temperature, such as visual inspection by observing the discoloration of concrete, the UV spectrum method, the ultrasonic spectroscope method, the X-ray diffraction method, and the carbon dioxide reabsorption amount measurement method [5,6,13,14]. However, the visual inspection based on discoloration of the concrete surface is often not reliable, as it is subjective to the inspector’s decision. Furthermore, the methods that use non-destructive test equipment often provide a limited temperature estimation range, or a specific type of chemical admixture used in a concrete mix sometimes prevents the estimation of heating temperature.
This study aims to overcome the limitations in the existing methods by proposing a statistical model that can more accurately and reliably estimate the heating temperature. For this purpose, a total of 77 experimental results of concrete test specimens were utilized, as shown in Table 2, and these data were statistically utilized based on the Bayesian parameter estimation method to develop a heating temperature estimation method.

2. Literature Review

Conventional heating temperature estimation methods include (i) the visual inspection of concrete discoloration, and (ii) a non-destructive test to check the change of the concrete material properties. The visual inspection method, which checks the discoloration of the concrete surface damaged by fire to infer the heating temperature range, is simple and the most widely used. However, the inspection outcome can be highly dependent on the inspector’s personal experience or subjective judgment [14]. Non-destructive tests to check the concrete material properties include the UV spectrum method [5], ultrasonic spectroscopy [5,16], and the X-ray diffraction [13] method. However, these methods have the following problems: (i) the measurable range of temperature is limited and subject to types of admixtures; (ii) a specific type of chemical admixture in concrete can interfere with estimating the heating temperature.
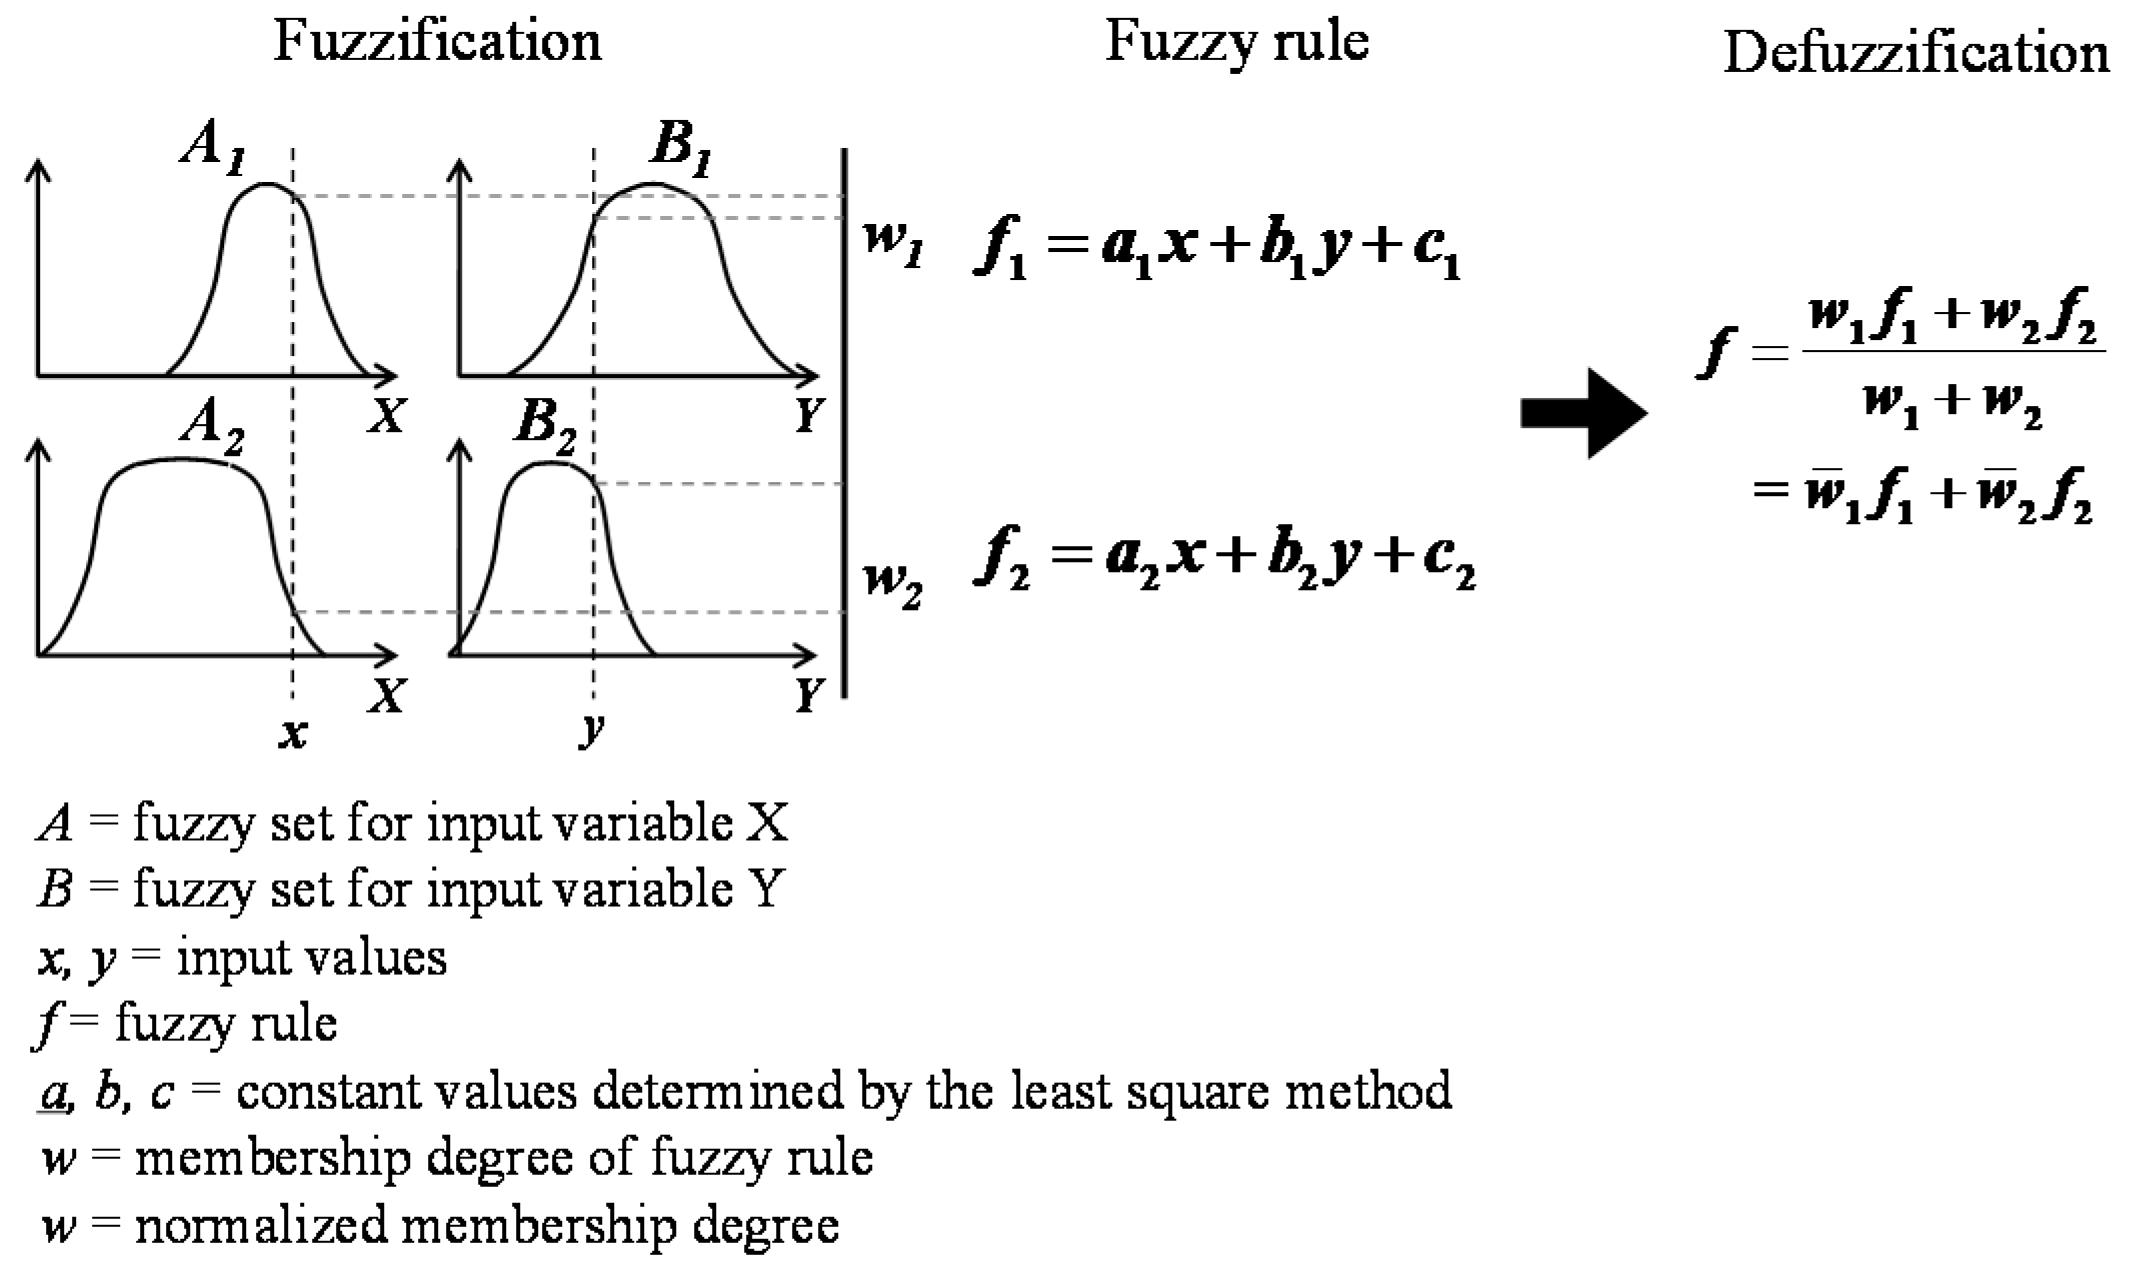
To overcome the limitations of the existing techniques, Kang et al. [15] recently developed a method using an adaptive neuro-fuzzy inference system (ANFIS) to estimate the heating temperature. ANFIS is a statistical algorithm that applies backpropagation to the Sugeno fuzzy model [17]. The Sugeno fuzzy model is a fuzzy model that consists of fuzzy sets, membership degrees, and fuzzy rules, as seen in Figure 2. The process of Sugeno fuzzy inference is as follows: (i) it fuzzifies all input values into membership functions to assess the membership degree of each input value. (ii) Then, it estimates fuzzy output functions, using assumed rule-bases. (iii) These output functions are defuzzified to output crisp values. Figure 2 illustrates this process. One advantage of the Sugeno fuzzy inference over conventional fuzzy inferences is that the output functions are assembled from input membership functions instead of assuming the form of the output functions, and the estimation accuracy is improved accordingly. ANFIS uses the concept of backpropagation in an artificial neural network (ANN) [17] and iterates the Sugeno fuzzy inference by successively updating the input membership functions until the estimation error is minimized against the test data. Kang et al. [15] made a total of 126 concrete test specimens with the compressive strength of 24–80 MPa and heated them in the temperature range of 25–800 °C to collect test data. The input parameters to estimate the heating temperature were the reflectance of concrete, the concrete’s compressive strength, and the ultrasonic pulse velocity of concrete. Their proposed ANFIS model’s estimations were compared with the test data, and the mean ratio between the test data and the ANFIS estimations was 1.15 and the coefficient of variation (c.o.v.) was 0.39. Here, the mean ratio represents the bias of the estimation (where 1.0 means non-bias), and the c.o.v. represents the inaccuracy of the estimation (where the smaller the c.o.v., the better the accuracy). This method has the following limitations: (i) the inaccuracy of around 40 % is quite high; (ii) the ANFIS model does not provide an explicit mathematical equation form, but needs to run a complex algorithm; and (iii) the reflectance of concrete is needed as an input parameter value, but this parameter is usually not obtainable in a fire inspection.
Heating temperature is an important factor to assess a concrete structure damaged by fire to determine its fire damage grade and to make a corresponding decision for repair and reinforcement. Therefore, it is important to accurately and reliably estimate the heating temperature to properly assess the degree of damage to a structure. However, the aforementioned visual inspection and equipment-based methods have many limitations and uncertainties, and Kang et al.’s model does not have physical limitations, but it has limitations in the estimation accuracy.
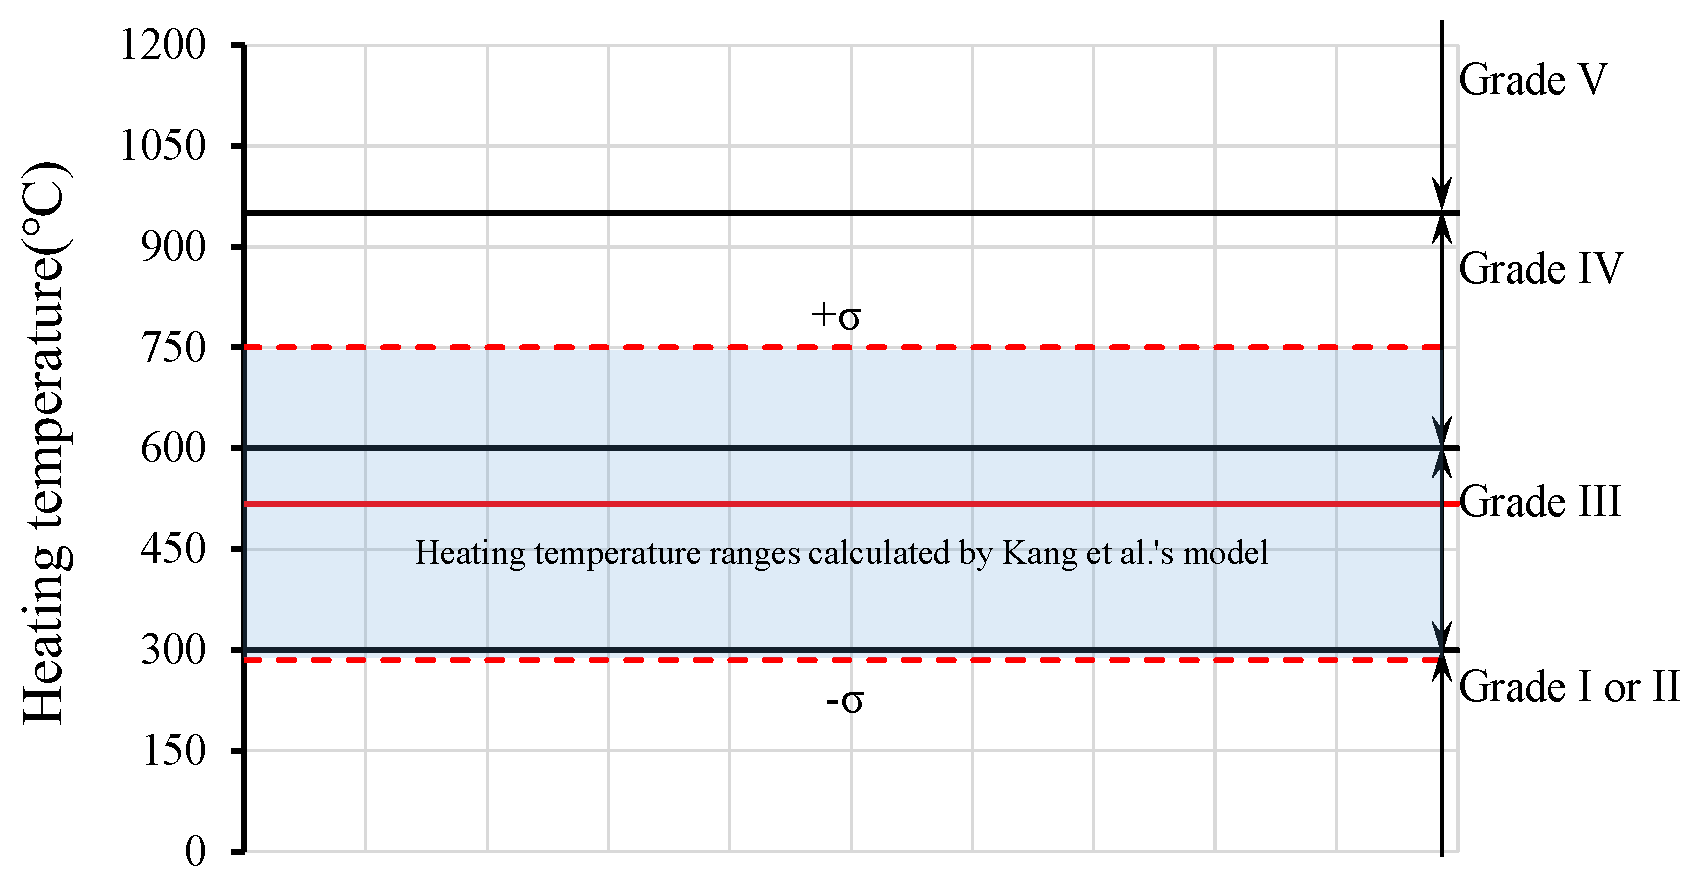
Table 3 shows the five fire damage grades that the Architectural Institute of Japan [5] and the Korea Concrete Institute [6] recommend. In this grading system, a careful and accurate grading is important. For example, Grade III refers to no steel damage, and only concrete surface repair is needed. However, Grade IV refers to steel damage occurrence, and significant reinforcement is required, although it has one grade difference from Grade III. The assessment of a fire damage grade is obviously dependent on the accurate estimation of the heating temperature. For example, if the heating temperature that has a true value of 450 °C is estimated using Kang et al.’s model, considering that Kang et al.’s model has a bias of 1.15 and c.o.v. of 39%, the estimated temperature can have a significant error. In Figure 3, a ±1 standard deviation (σ) range is presented around the biased estimation for the 450 °C heating temperature. This means that although the true value (450 °C) of the temperature was within Grade II, the estimated temperature could result in Grades I–III, which will significantly alter the decisions. This example clearly shows that the development of a more reliable method is required.

3. Bayesian Parameter Estimation

The Bayesian parameter estimation method can be used to develop a new probabilistic prediction model by using collected data on input and output parameters. Gardoni [18,19] first introduced the Bayesian parameter estimation to develop capacity models for RC columns and seismic demand models for RC bridges. In this study, this method was used to develop the heating temperature estimation model, and it has the mathematical form, as shown in Equation (1):
C ( x , Θ ) = c d ( x ) + γ ( x , θ ) + σ ε
where x = a vector of input parameters; Θ = (θ, σ) is a set of unknown parameters that provide the best fit to the collected output data; cd (x) is a deterministic function if this function exists; γ (x, θ) is a bias correction term to minimize the bias and scatter of the overall model, which has x and θ = [θ1, θ2, …, θp]T; ε is an error term after the bias correction and follows a standard normal random variable; and σ represents the magnitude of the remaining error. This model assumes the following two conditions: (i) homoscedasticity, which assumes that the model variance σ is constant over the whole input parameter ranges; and (ii) normality, which assumes that the error term ε follows the standard normal distribution. This study assumes that the bias correction function γ (x, θ) is a linear function of a suitable set of p explanatory functions hi (x), i = 1, …, p, as shown in Equation (2):
γ ( x , θ ) = i = 1 p θ i h i ( x )
As many prediction models used in engineering have a form of multiplication of input parameters, Equation (2) is modified accordingly by applying the natural logarithms to the output value, deterministic function, and the explanatory function terms, satisfying the homoscedasticity assumption presented in the following Equation (3) [20]:
ln [ C ( x , Θ ) ] = ln [ c d ( x ) ] + i = 1 p θ i h i ( x ) + σ ε
where the explanatory terms hi (x) are now the lognormal functions of input parameters. This transformation does not change the assumption that the error measure is a normal random variable. This model is consistently used in the prediction model development in this study. To estimate the model parameters Θ = (θ, σ), the following Equation (4), called “Bayesian updating rule,” is used [21]:
f ( Θ ) = κ L ( Θ ) p ( Θ )
where p(Θ) is the prior function of Θ, L(Θ) is the likelihood function, and κ = [∫ L(Θ)p(Θ)d(Θ)]−1 is the normalizing constant. When there is no information about the prior function, the non-informative function presented in Equation (5) can be used [18]:
p ( σ ) 1 σ
The likelihood function can be defined, as shown in Equation (6) [18,20].
L ( Θ ) Observed   data { 1 σ ϕ [ ln [ C i ] ln [ C d ( x i ) ] γ ( x i , θ ) σ ] }
The calculations of the normalizing constant in Equation (4), the posterior mean vector MΘ, and the covariance matrix ∑ΘΘ = ∫ΘΘT f(Θ)d(Θ) − MΘMΘT all need to implement multifold integral, which is computationally demanding. This study adopted an importance sampling technique for this multifold integral calculation, in which samples were generated around the maximum likelihood point to accelerate the convergence [18].
The Bayesian parameter estimation method provides a stepwise removal process for unimportant explanatory terms to simplify the equation form. The unimportant explanatory terms are selected when the term has a high posterior c.o.v. value compared to the other explanatory terms. By comparing the equation before and after removing the unimportant term, if the change of the equation error is negligible, the unimportant term can be dropped from the equation. This process can be repeated until the equation is fully simplified.

4. Proposed Model

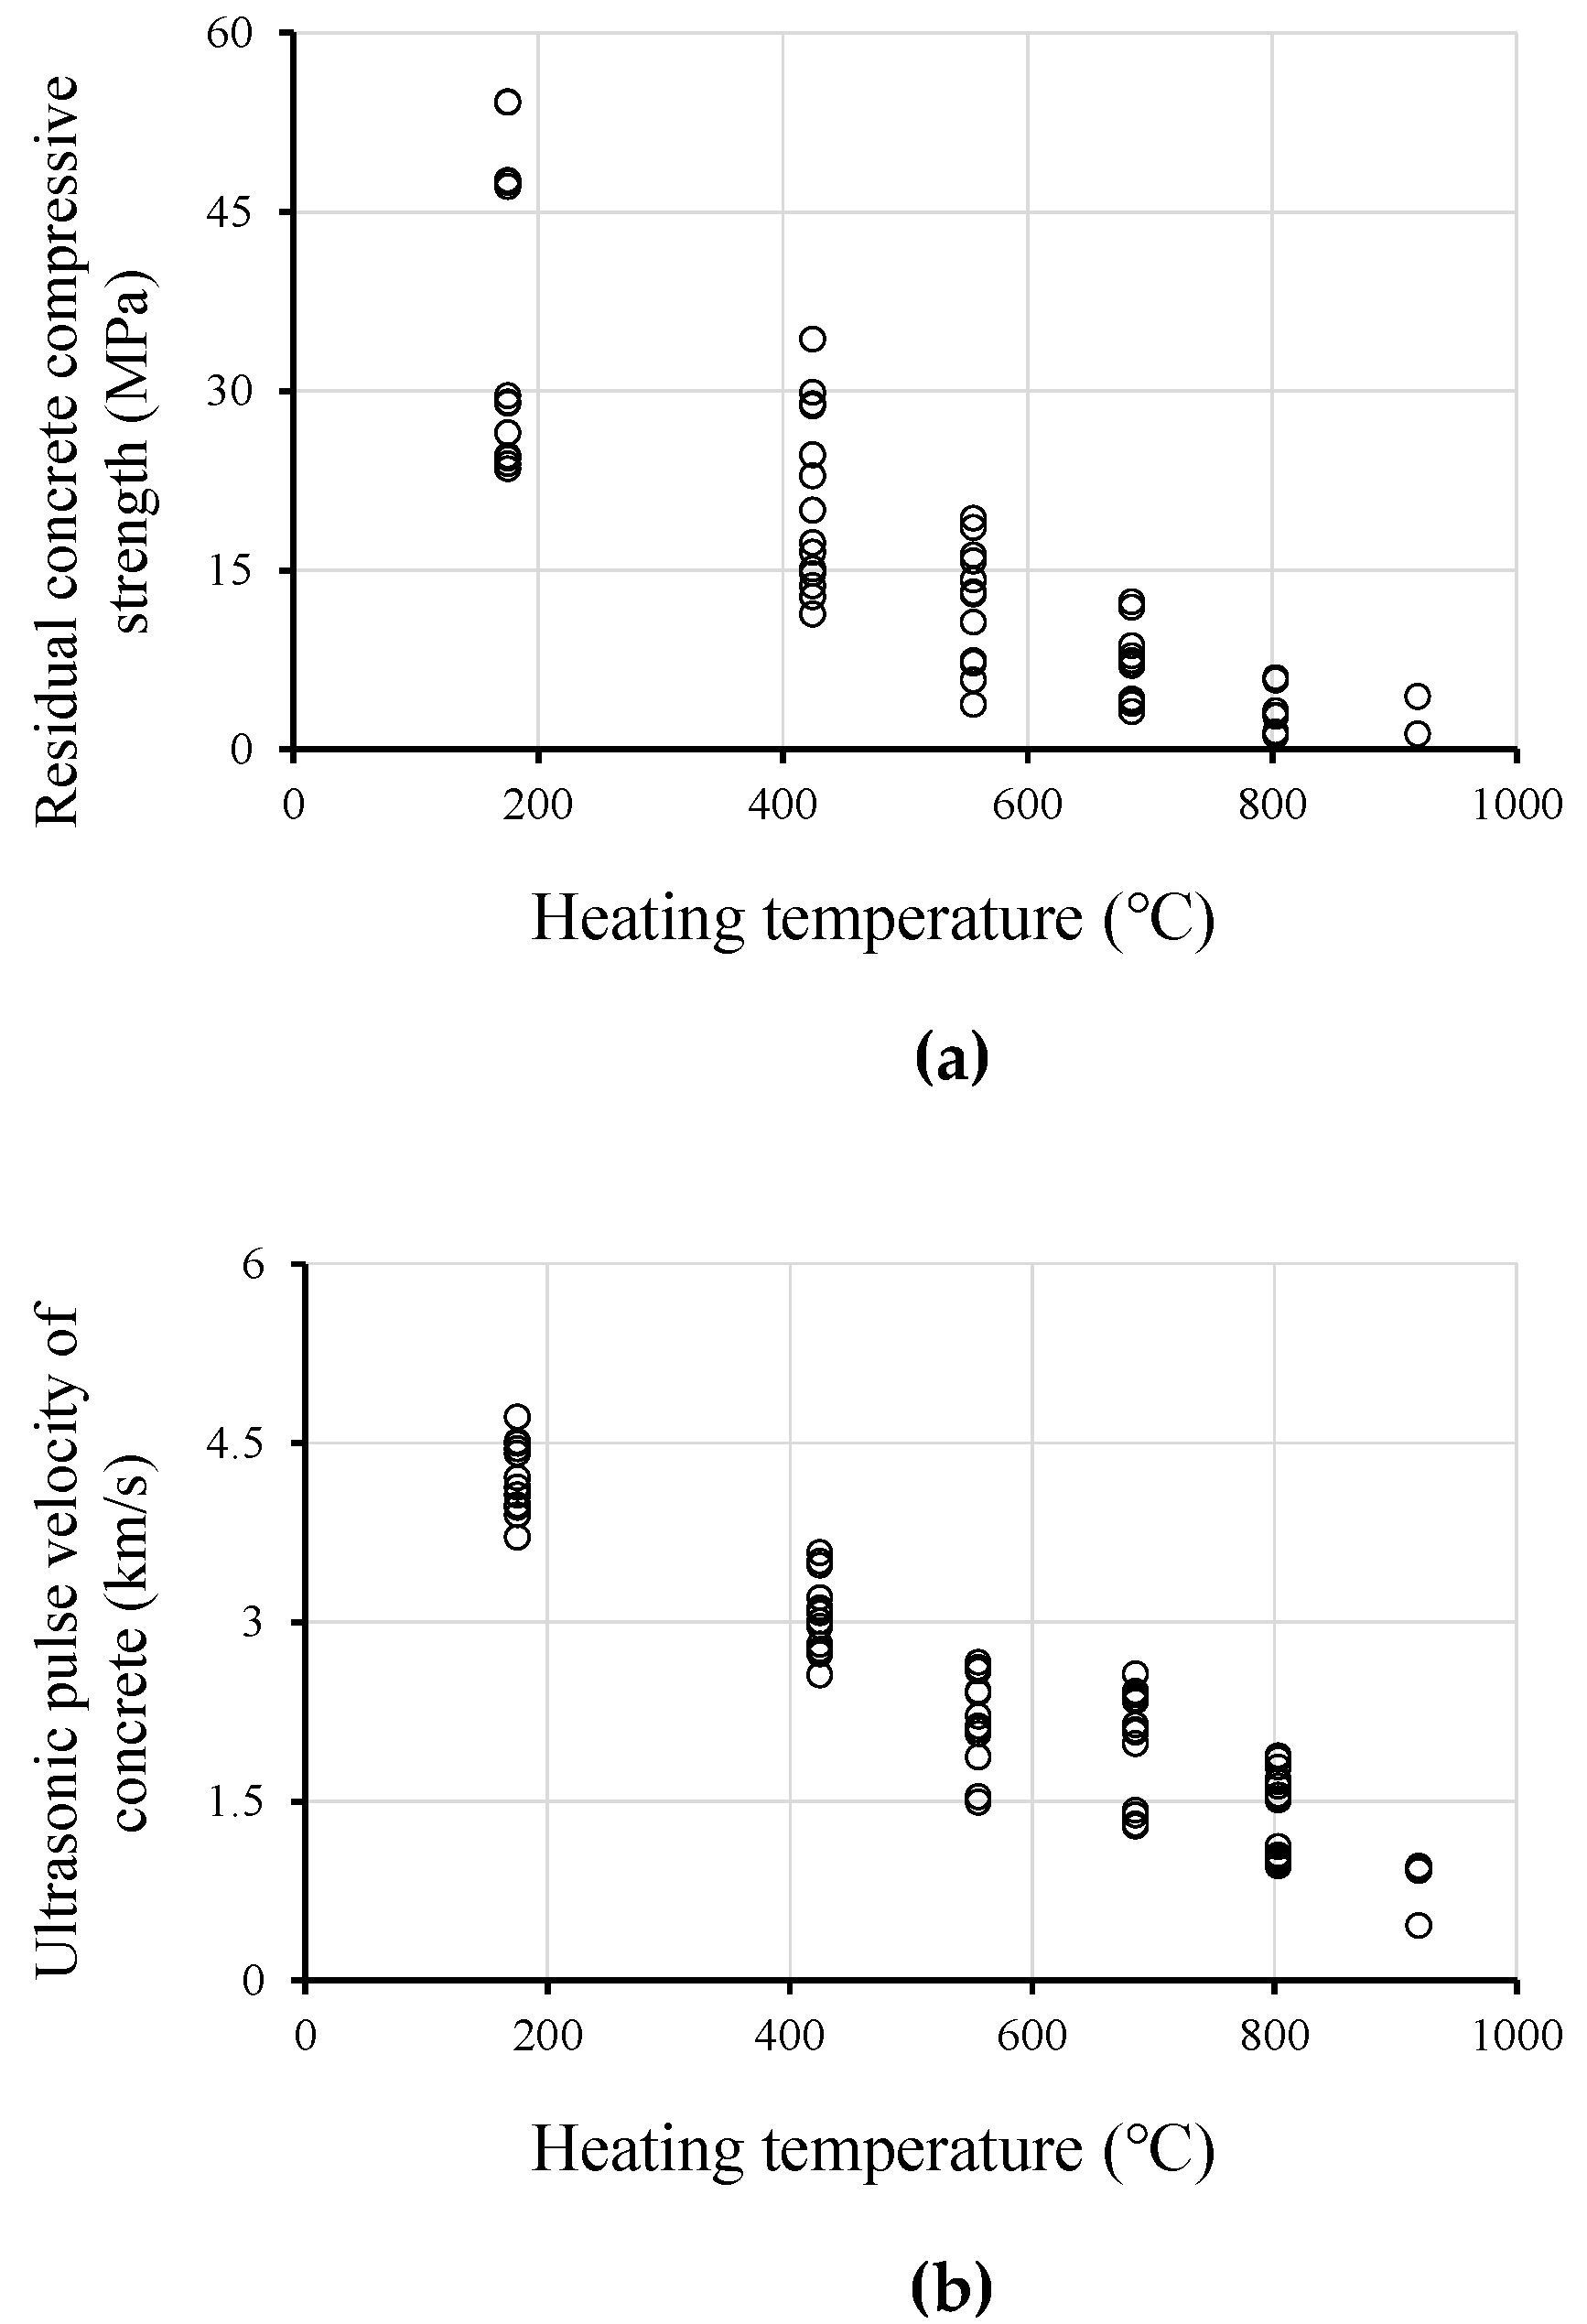
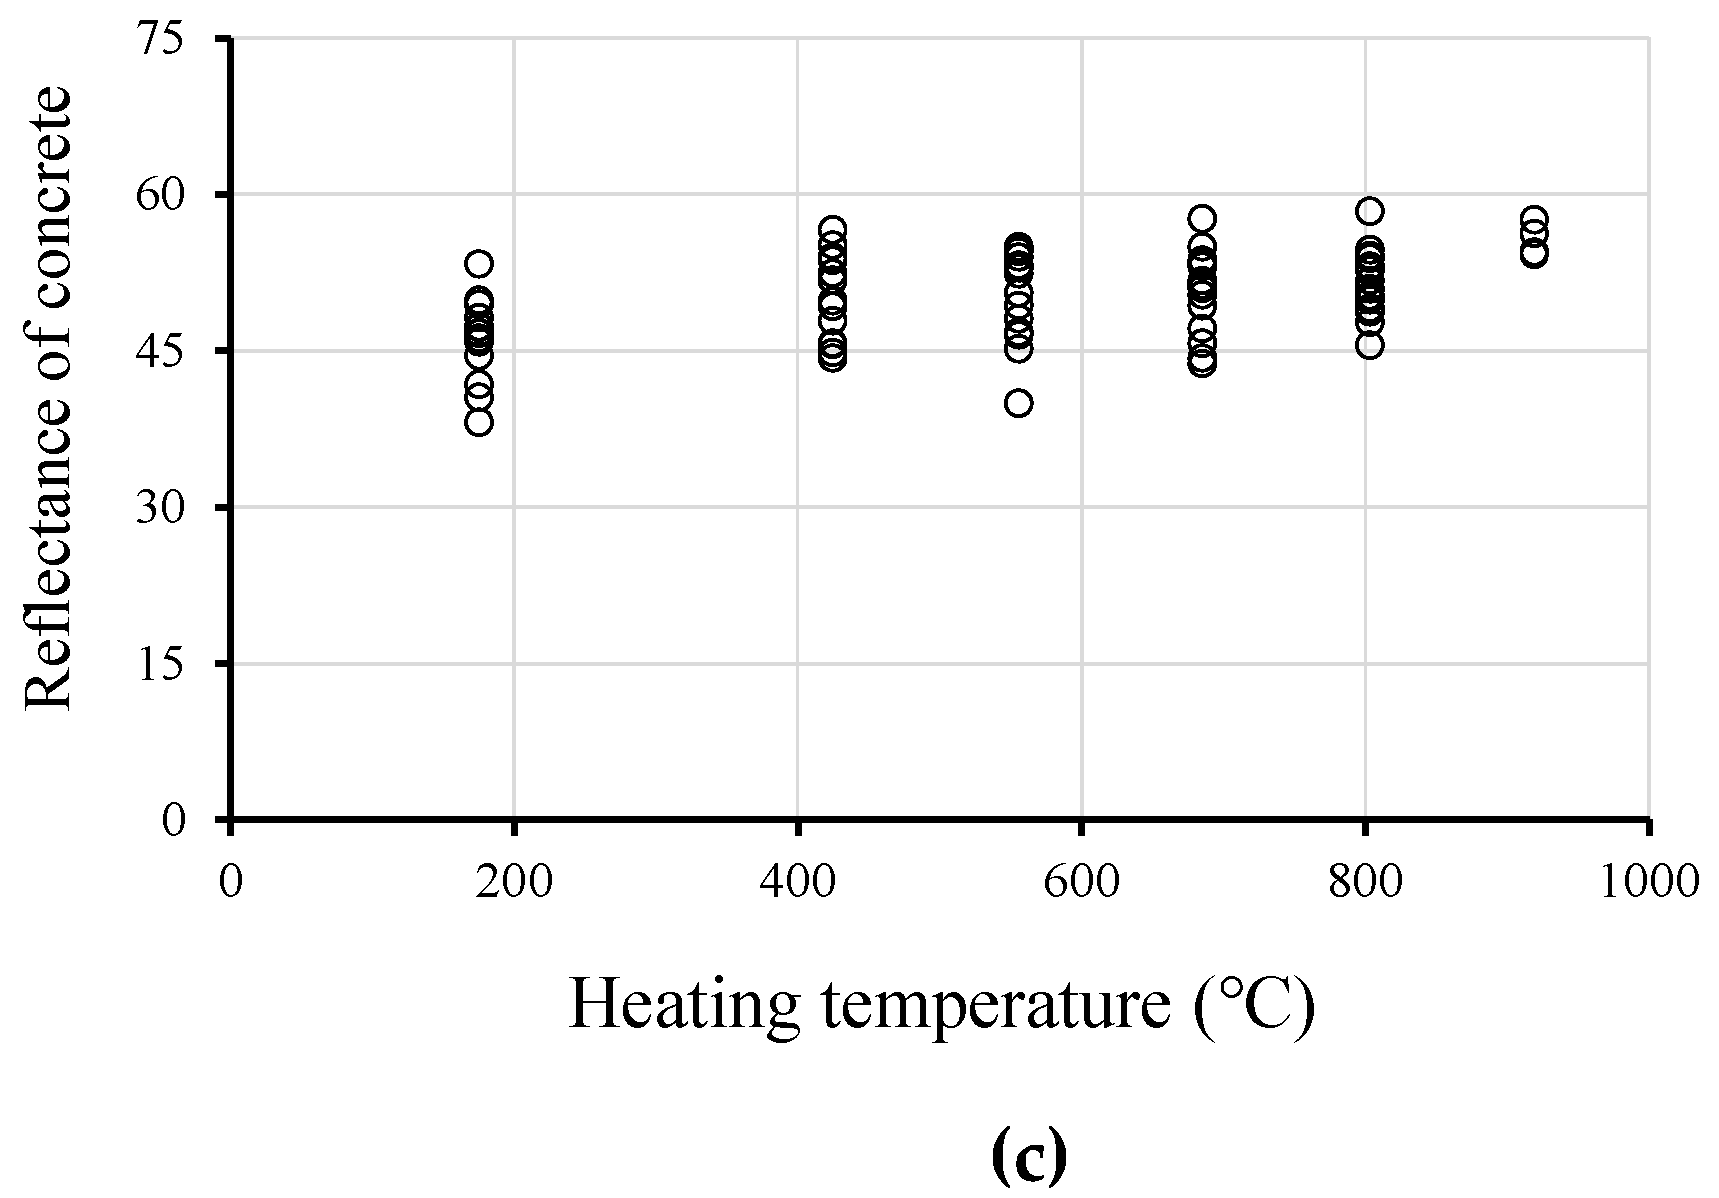
An experimental database generated by Kang et al. [15] was used in this study for the utilization of the Bayesian parameter estimation method [18,20]. Kang et al. [15] made a total of 126 concrete test specimens with the compressive strength of 24–80 MPa and heated them in the temperature range of 25–800 °C. Among them, some specimens with a compressive strength of 80 MPa showed spalling failure during the heating tests with target temperatures of 600 °C, 700 °C, and 800 °C, and, thus, they, as well as the specimens under an ambient temperature, were excluded from the database shown in Table 2. As a result, the remaining 77 data were utilized to develop heating temperature estimation models. For these specimens, the reflectance of concrete, the residual concrete compressive strength, and the ultrasonic pulse velocity of concrete were recorded. Figure 4 shows that the residual concrete compressive strength and the ultrasonic pulse velocity of concrete showed a decreasing trend with respect to the increasing heating temperature. The reflectance of concrete showed a slightly increasing trend with respect to the heating temperature, but this was not significant.
The first trial form of the equation for the Bayesian parameter estimation method was, therefore, decided as shown in Equation (7), considering the trend of the data:
T f . t = 2 θ 1 ( 1 f c ) θ 2 ( 1 v p ) θ 3 R θ 4
where f′c is the concrete compressive strength under no fire damage, vp is the ultrasonic pulse velocity, and R is the reflectance ratio of concrete. The partial descriptors for the unknown power terms were determined using the Bayesian parameter estimation. By plugging the mean values into the unknown power terms, the first proposed equation can be represented as follows for a deterministic use:
T f . t = 2 4.23 ( 1 f c ) 0.15 ( 1 v p ) 0.51 R 1.02
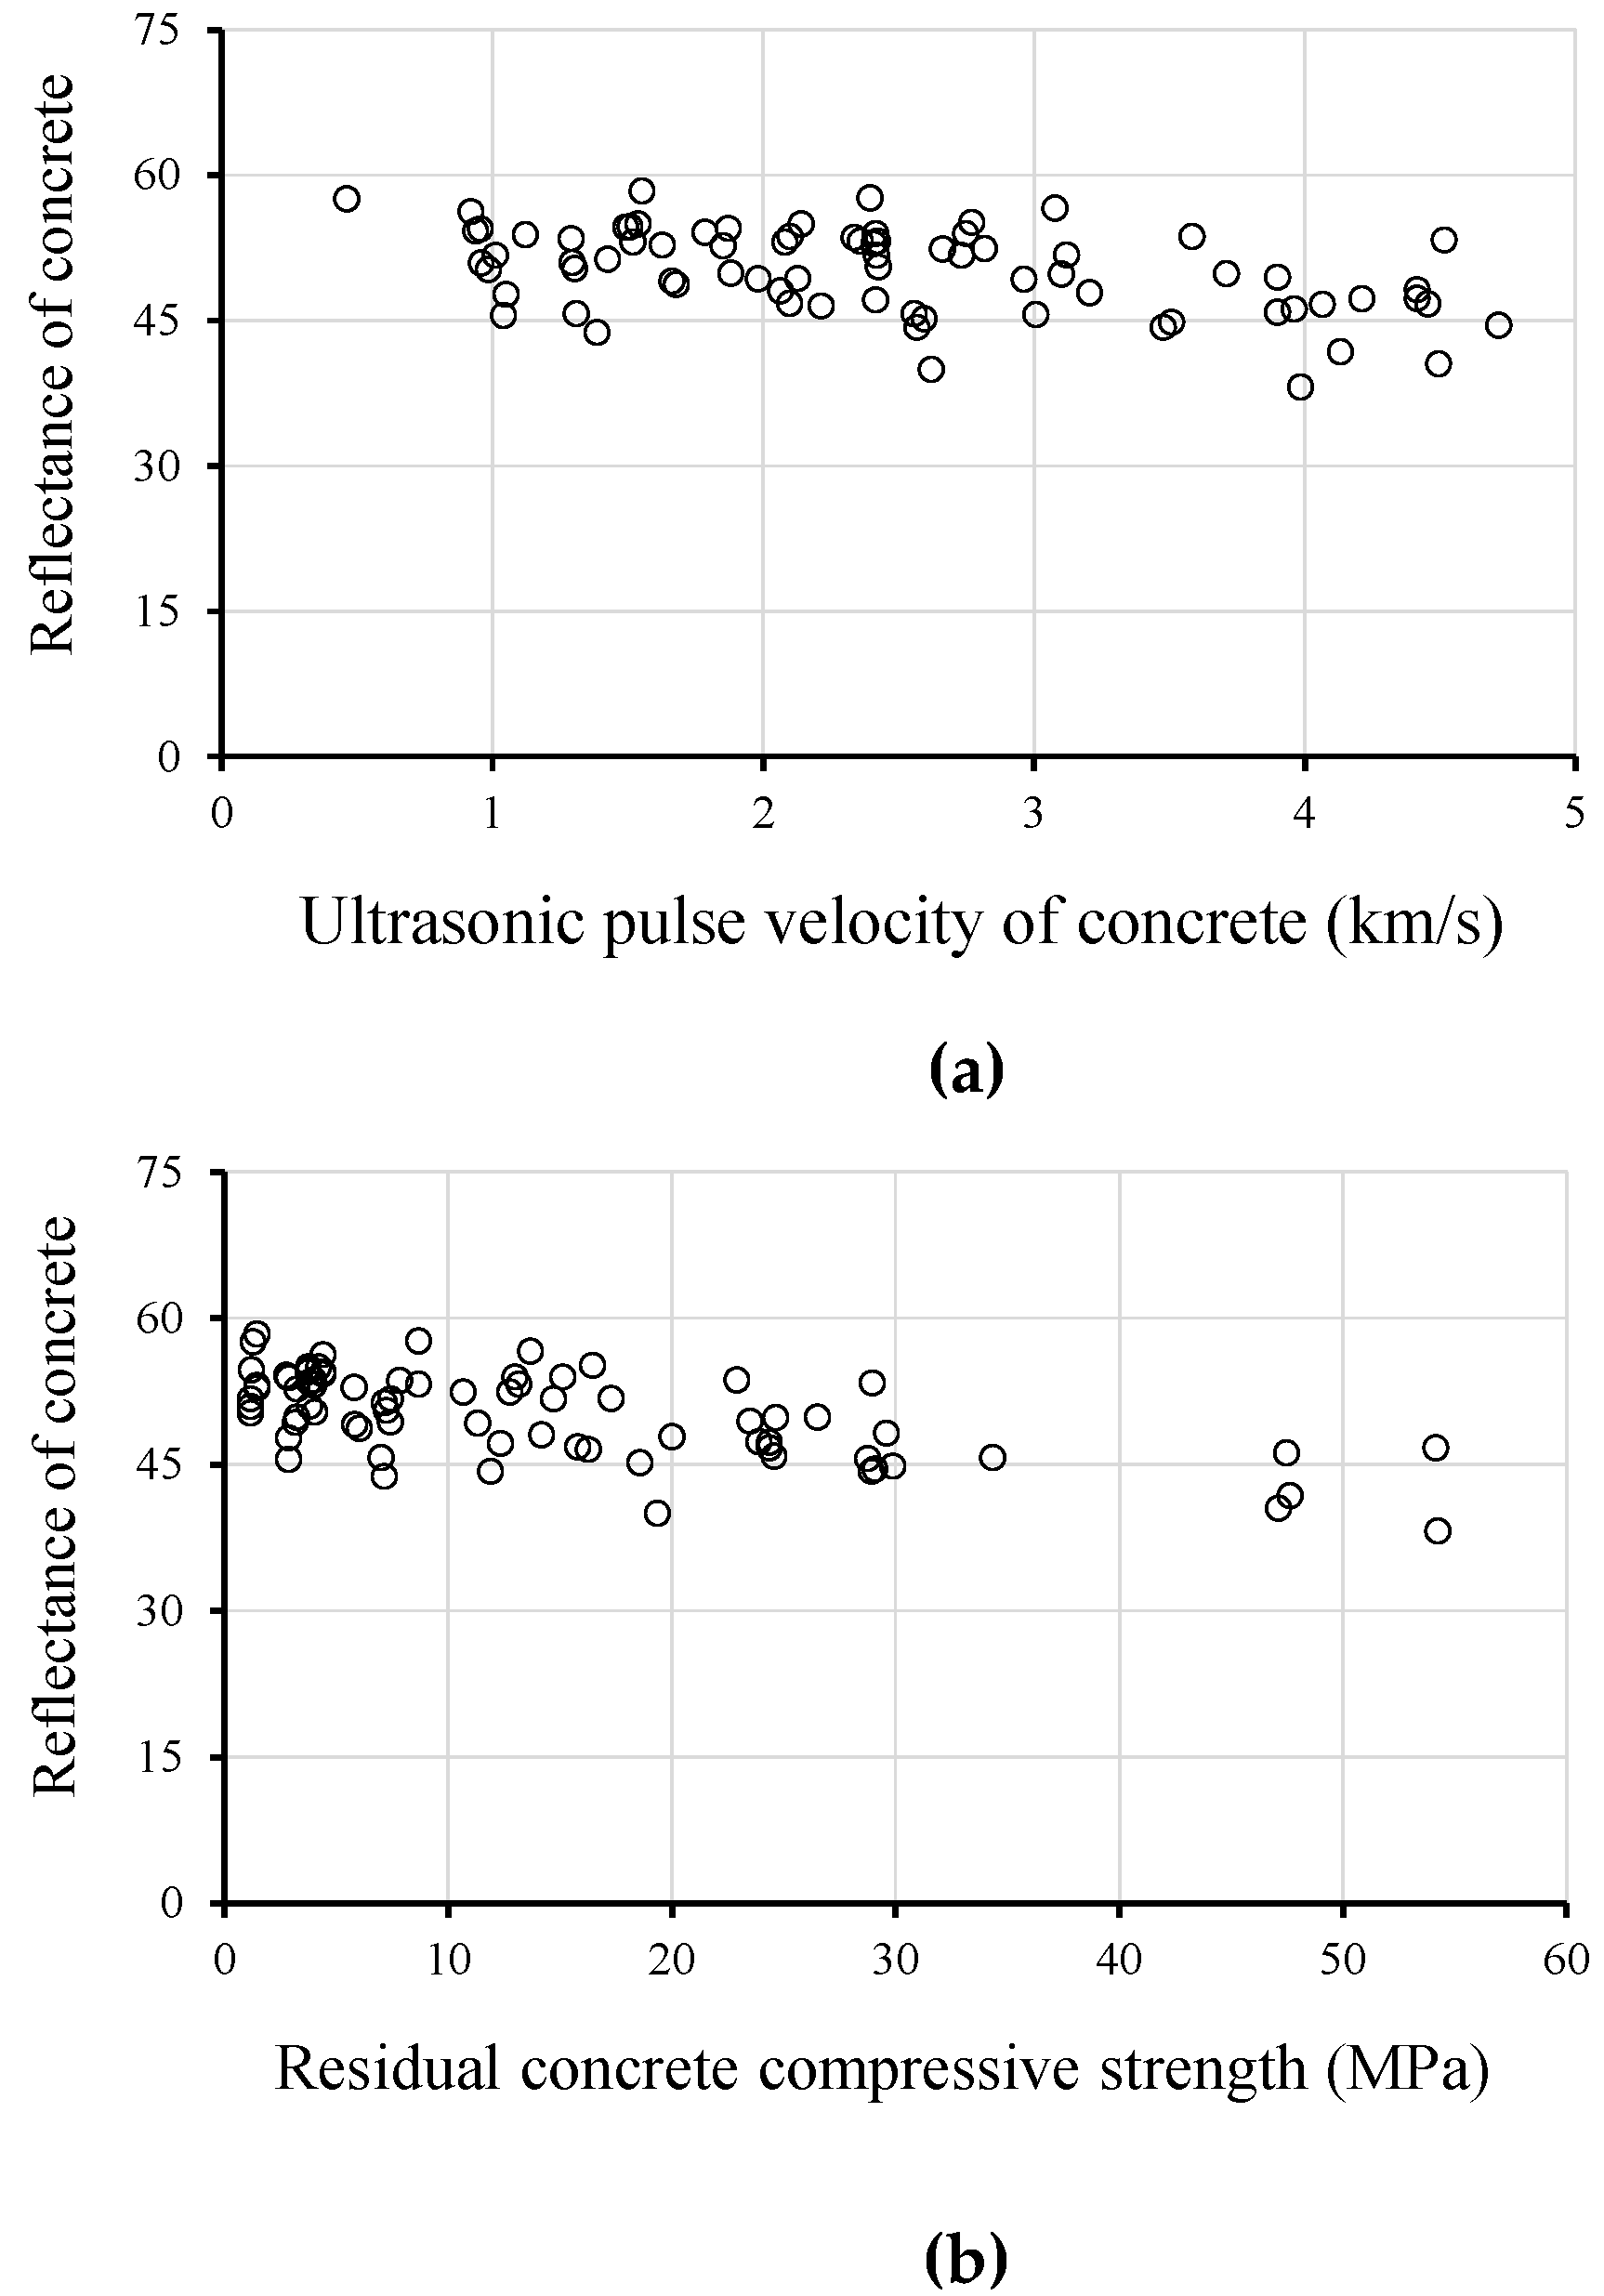
In Figure 5, the accuracy of this equation is represented by the bias and the c.o.v. against the experimental data, and these values are 1.03 and 0.30, respectively. Note that the c.o.v. was reduced by around 10% from that of Kang et al.’s model. However, as seen in Figure 5, although the overall accuracy was improved, for the temperatures below 200 °C and above 800 °C, the estimations were quite biased compared to the unbiased line represented by a solid horizontal line. Furthermore, as in Table 4, the c.o.v. value of the reflectance of concrete was greater than those of the other parameters. This means that the reflectance of concrete was the least informative parameter, and it could be a candidate to be dropped from the equation to further simplify the equation without sacrificing the accuracy by very much. While the reflectance of concrete changed according to the fire temperature from the test data, Figure 6 shows that the change was not significant compared to the compressive strength and the ultrasonic pulse velocity of concrete. In addition, the unit of the outcome of Equation (8) was not °C, and, therefore, further modification is required.
The second trial form of the equation was determined by removing the reflectance of concrete. In addition, because the concrete compressive strength decreases on being exposed to fire, the residual strength (fre) can be represented, as shown in Equation (9).
f r e = f c α f c ( T β )
where T is the heating temperature, α is a constant value introduced to correct a constant bias, and β is a temperature limit constant introduced to make the temperature term unitless. Table 1 shows that, as in Eurocode 2 [4], the concrete compressive strength could be estimated according to the heating temperature. If the heating temperature exceeded 1000 °C, the concrete compressive strength became 4% of that of undamaged concrete. In the current study, we assumed the value of β to be 1000 °C so that there was no residual strength above 1000 °C. The equation was formed to show the decreasing trend of the concrete compressive strength according to the increasing temperature by using the term of the ratio between the heating temperature and β. Using Equation (9), the heating temperature can be represented with two unknown power terms, as shown in Equation (10).
T = 2 θ 1 β ( 1 f r e f c ) θ 2
By plugging the mean values into the unknown power terms and replacing β by 1000 °C, the second proposed equation is represented as follows:
T p r o = 730 ( 1 f r e f c ) 0.70
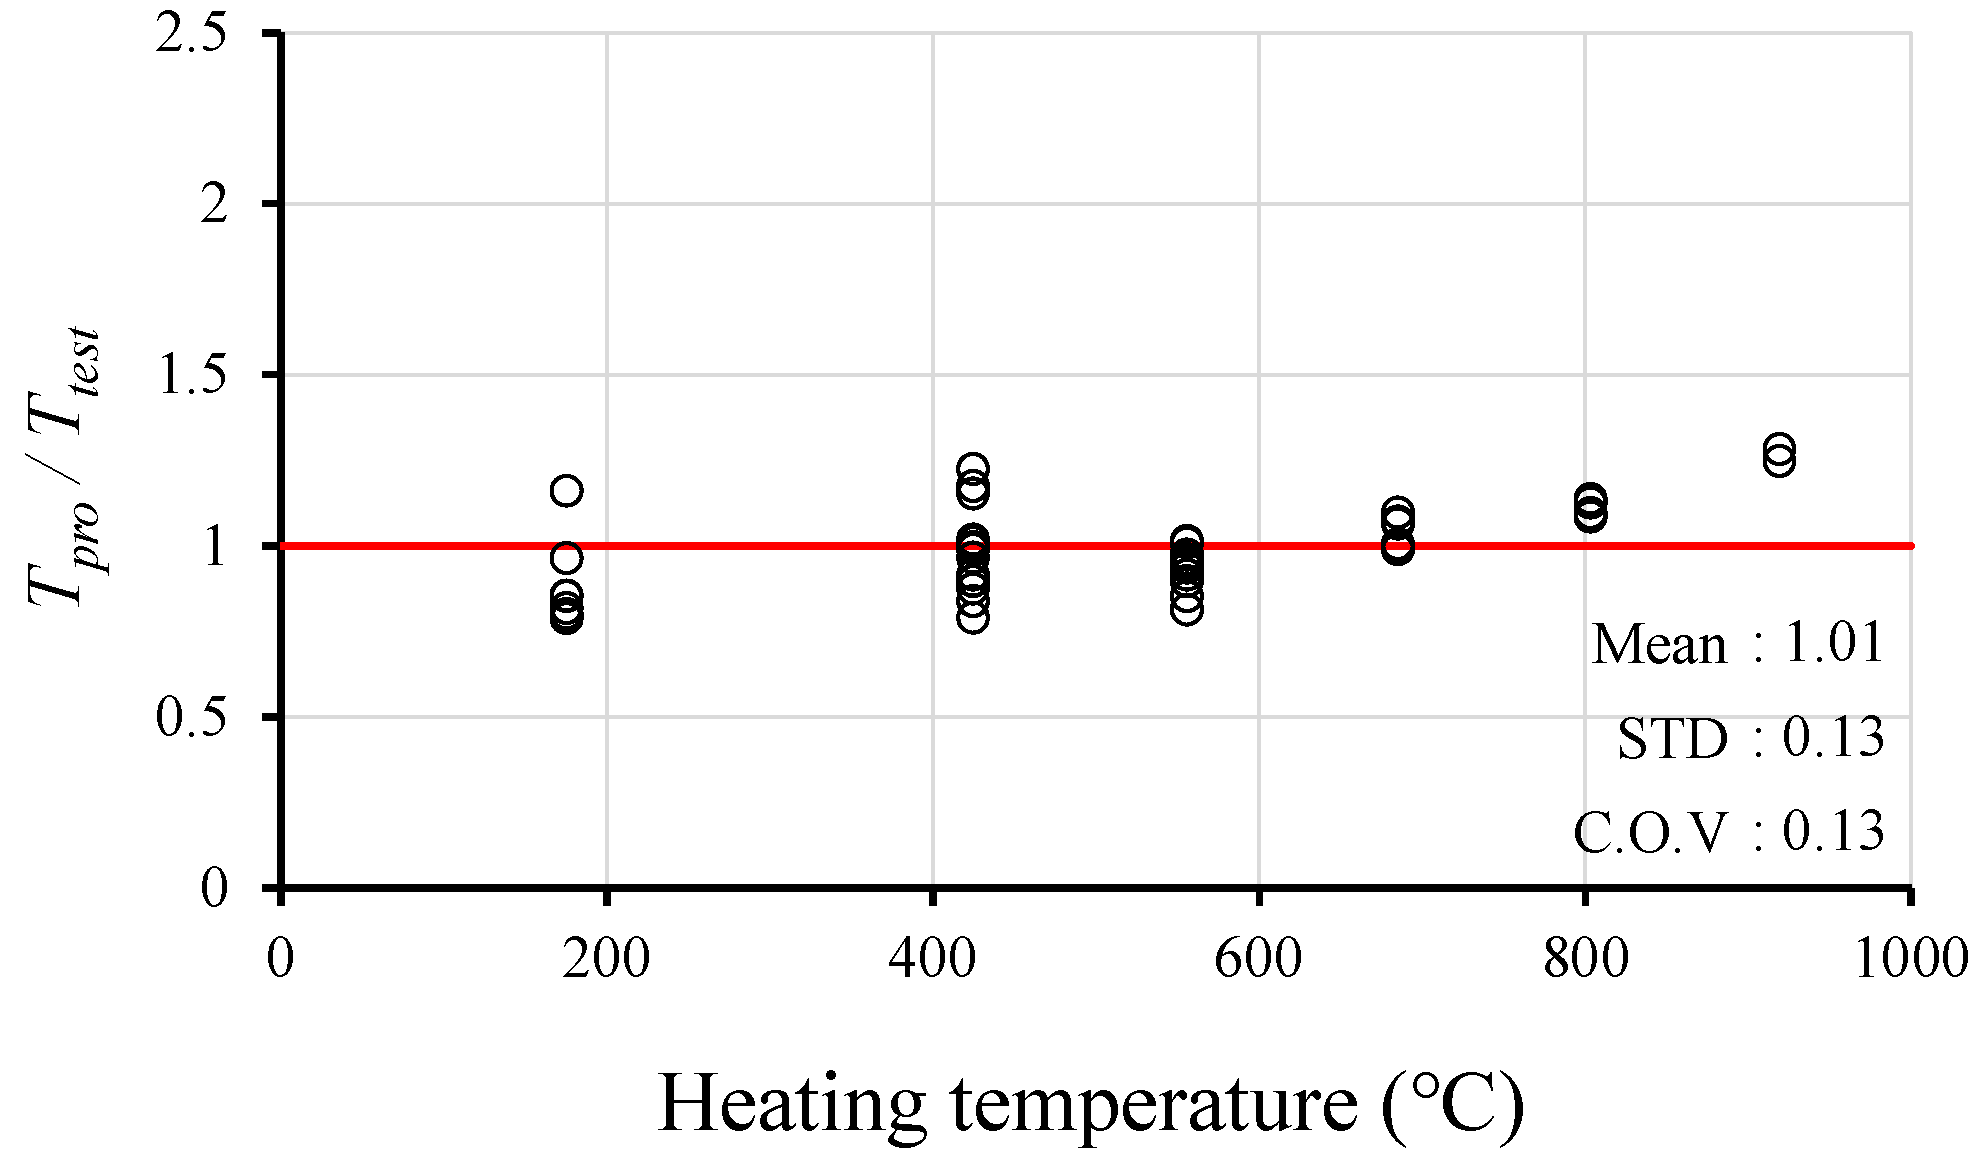
Figure 7 shows that the accuracy of Equation (11) was represented by the average bias of 1.01 and c.o.v. of 0.13, which showed a huge improvement from Kang et al.’s model and Equation (8).
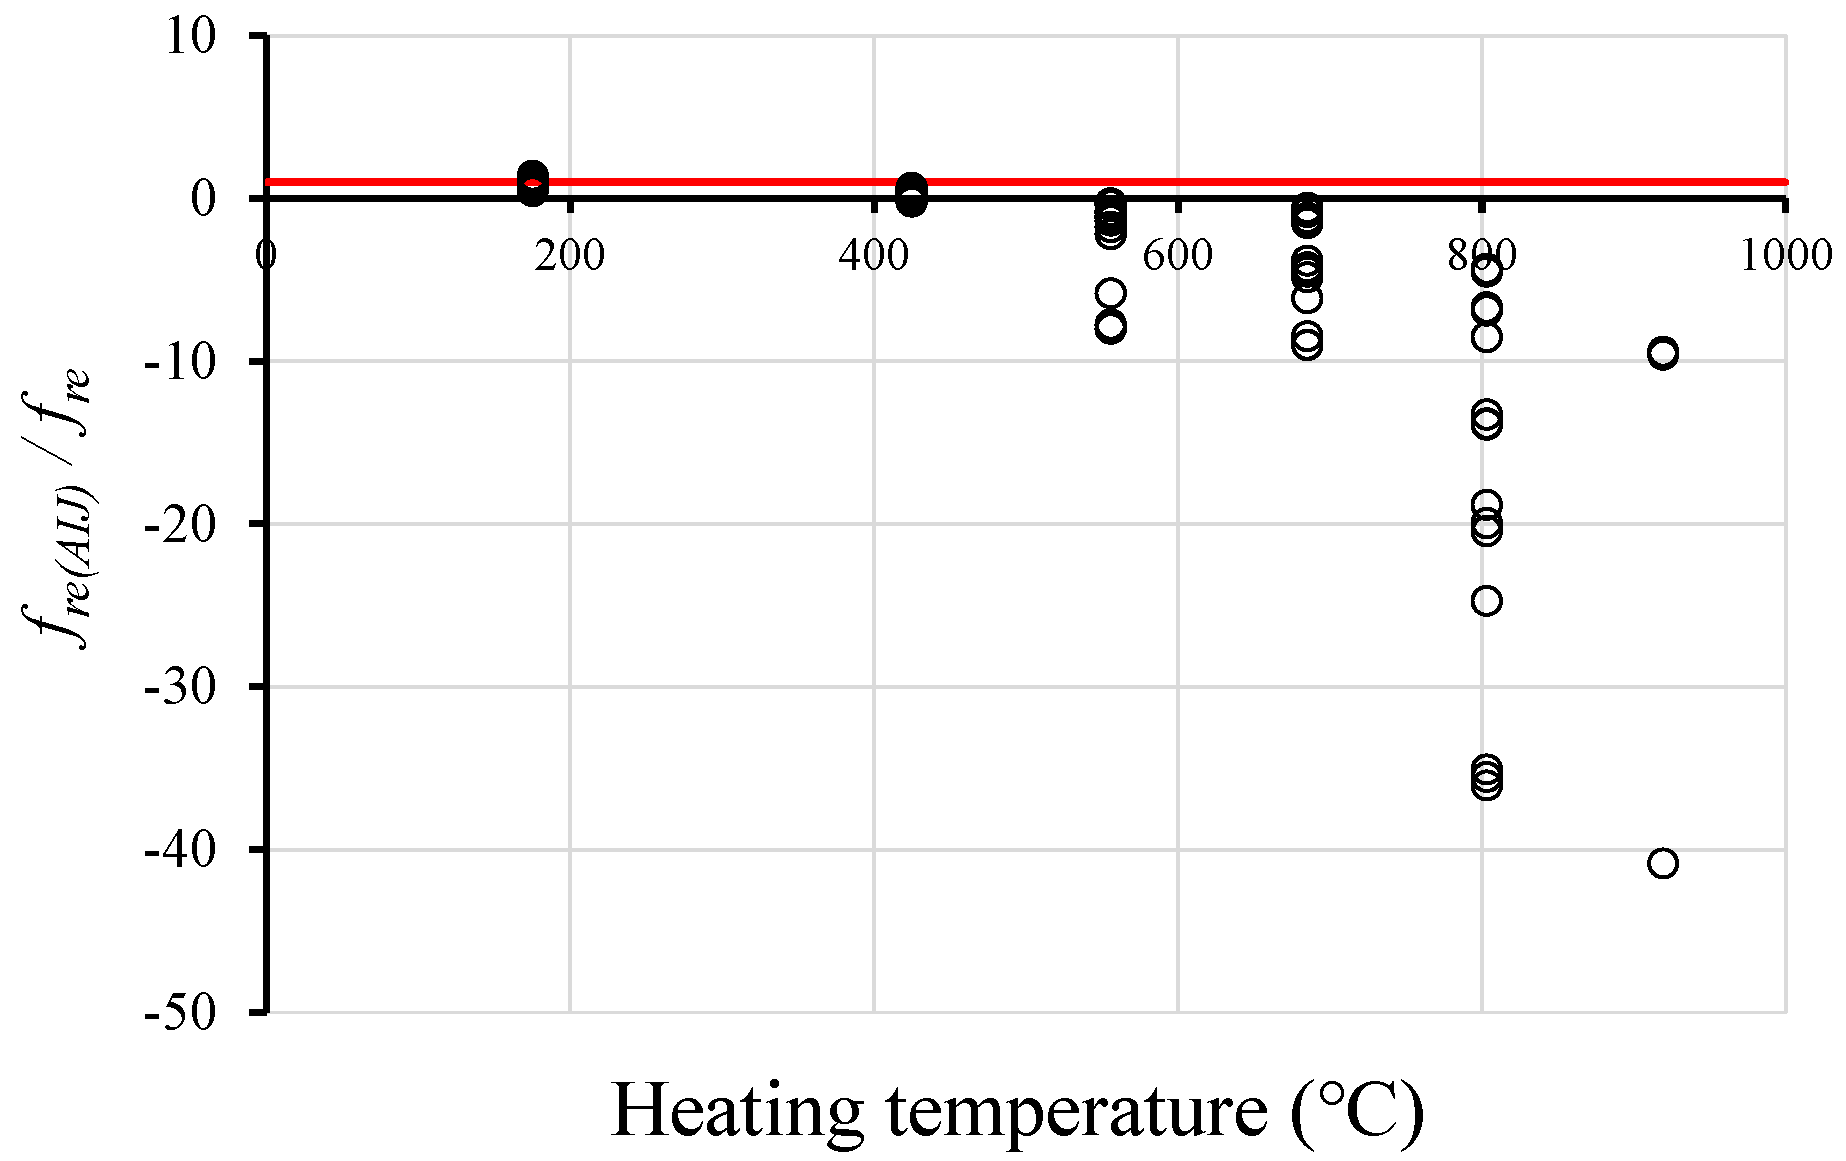
Although Equation (11) showed very accurate estimation results, the residual concrete compressive strength required as an input parameter in this equation is sometimes difficult to measure from a concrete structure damaged by fire. Generally, the residual concrete compressive strength is measured as rebound strength using a Schmidt hammer, but this is difficult to accurately measure on the spalled surface of concrete damaged by fire. Instead, concrete samples need to be collected and a strength test needs to be conducted, but sometimes, this is impractical. As an alternative, the concrete compressive strength can be measured by using ultrasonic pulse velocity, which is also widely used like a rebound test. Table 5 shows that the Architectural Institute of Japan [22], the Materials Research Society of Japan [23], and the Korea Research Institute of Standards and Science [24] suggest equations to estimate the concrete compressive strength using the measured ultrasonic pulse velocity. Furthermore, Atici [25], Del Rio [26], Han and Kim [27], Im [28], Khan [29], Kim et al. [30], Lee et al. [31], Mohammed et al. [32], Qasrawi [33], Trtnik et al. [34], Won et al. [35], and Kim et al. [36] proposed concrete compressive strength estimation equations based on experiments, as shown in the same table (Table 5). However, these equations are limited in their estimation of concrete compressive strength damaged by fire, because they were all developed with no consideration of a fire occurrence. When concrete is damaged by fire, C-S-H in concrete paste is decomposed, and micro-pores and micro-cracks occur inside the concrete. This prevents the penetration of ultrasonic pulse velocity, and for this reason, the equations in Table 5 cannot be used directly. For example, if we use the equation suggested by the Architectural Institute of Japan to estimate the concrete compressive strength, as seen in Figure 8, the estimation is accurate for low temperatures up to around 400 °C, but the estimated value becomes negative for higher temperatures, which is unrealistic. Therefore, it is required to develop a new estimation model that properly explains the relationship between the ultrasonic pulse velocity and the residual strength of concrete damaged by fire to overcome the limitations of the existing models.
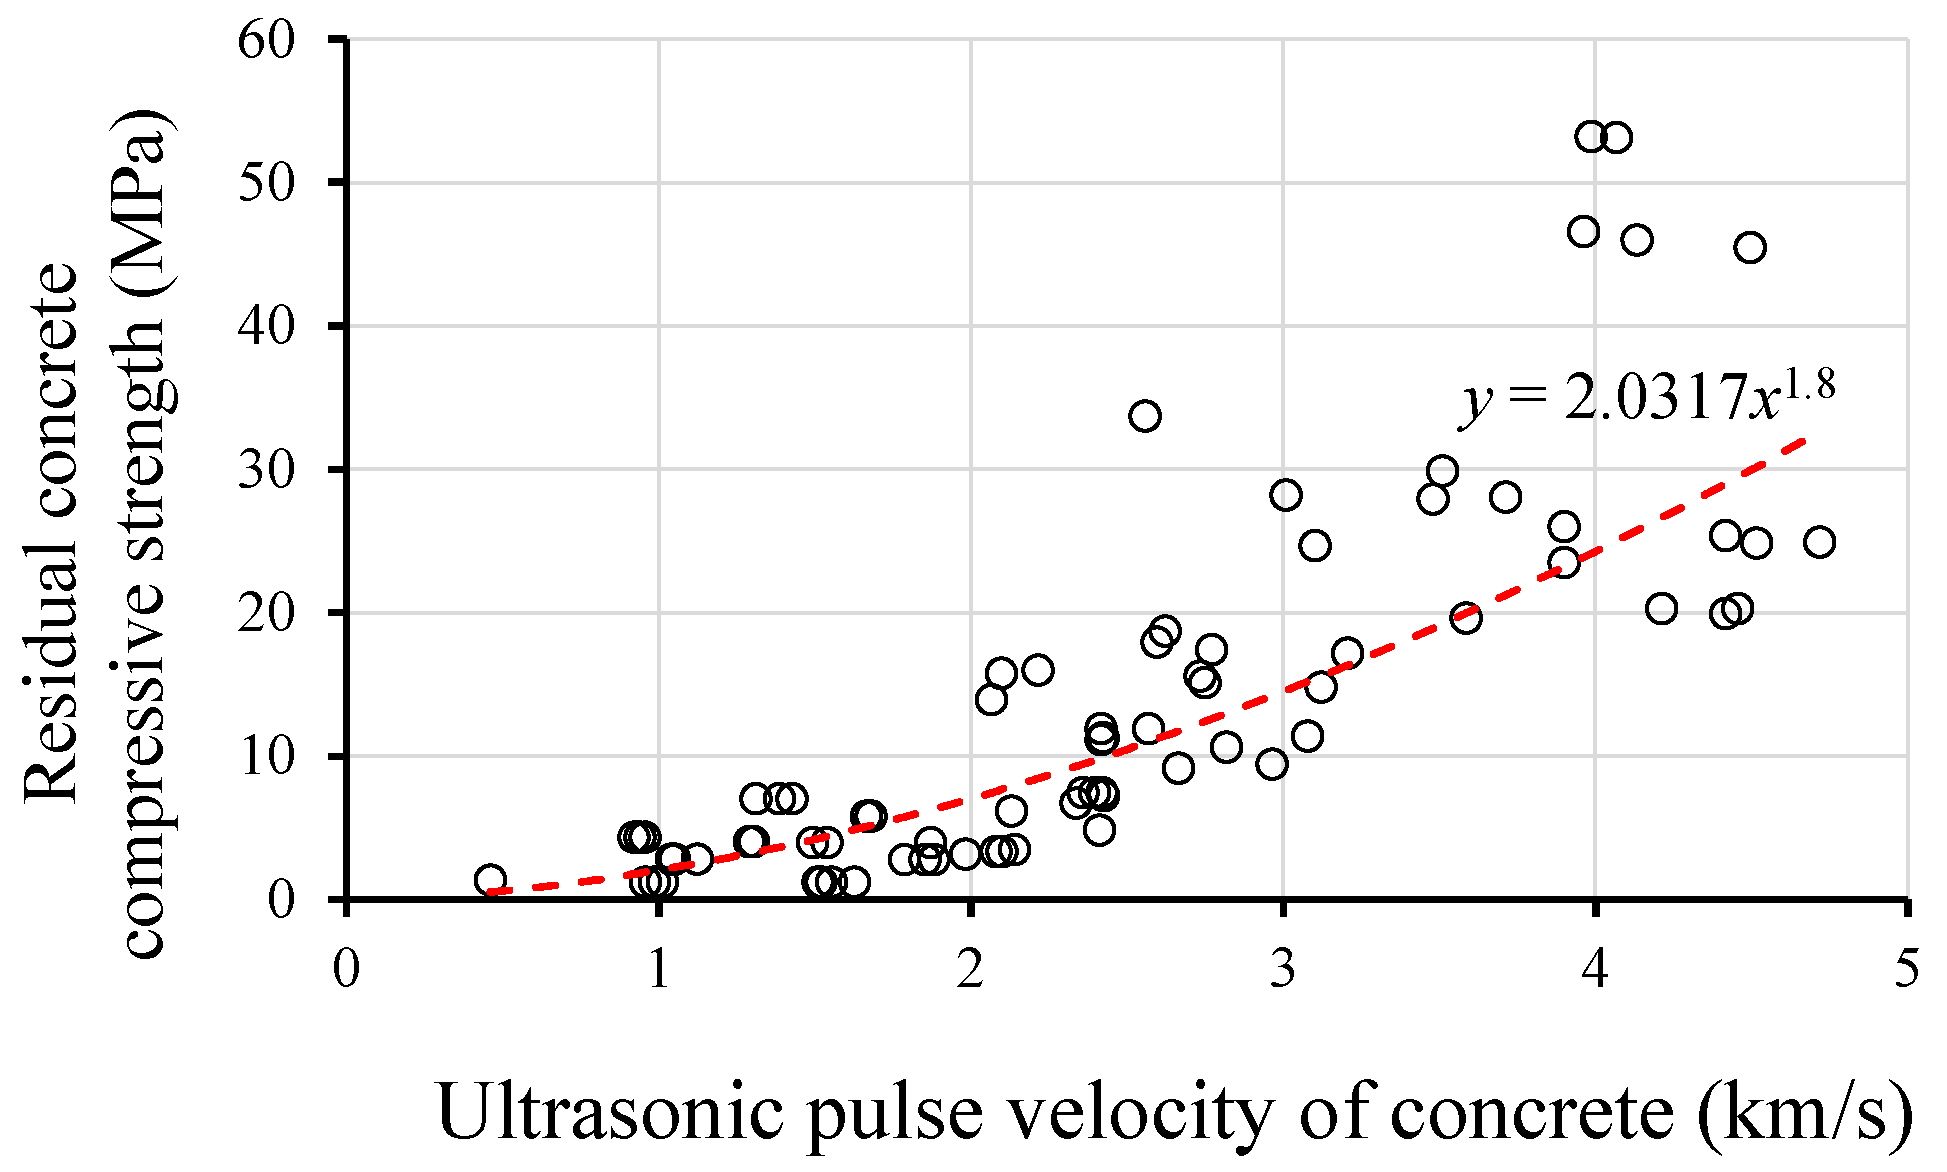
Figure 9 illustrates that the residual strength had an increasing trend with respect to the ultrasonic pulse velocity, and a regression model could be developed to estimate the residual strength of concrete damaged by fire with respect to the ultrasonic pulse velocity. This has the following form:
f r e . U = 2 v p 1.8
If the residual strength in Equation (11) is replaced by Equation (12), the following equation can be obtained:
T p r o . U = 730 ( 1 2 v p 2 f c ) 0.70 where   ( 2 v p 2 f c ) 0.9
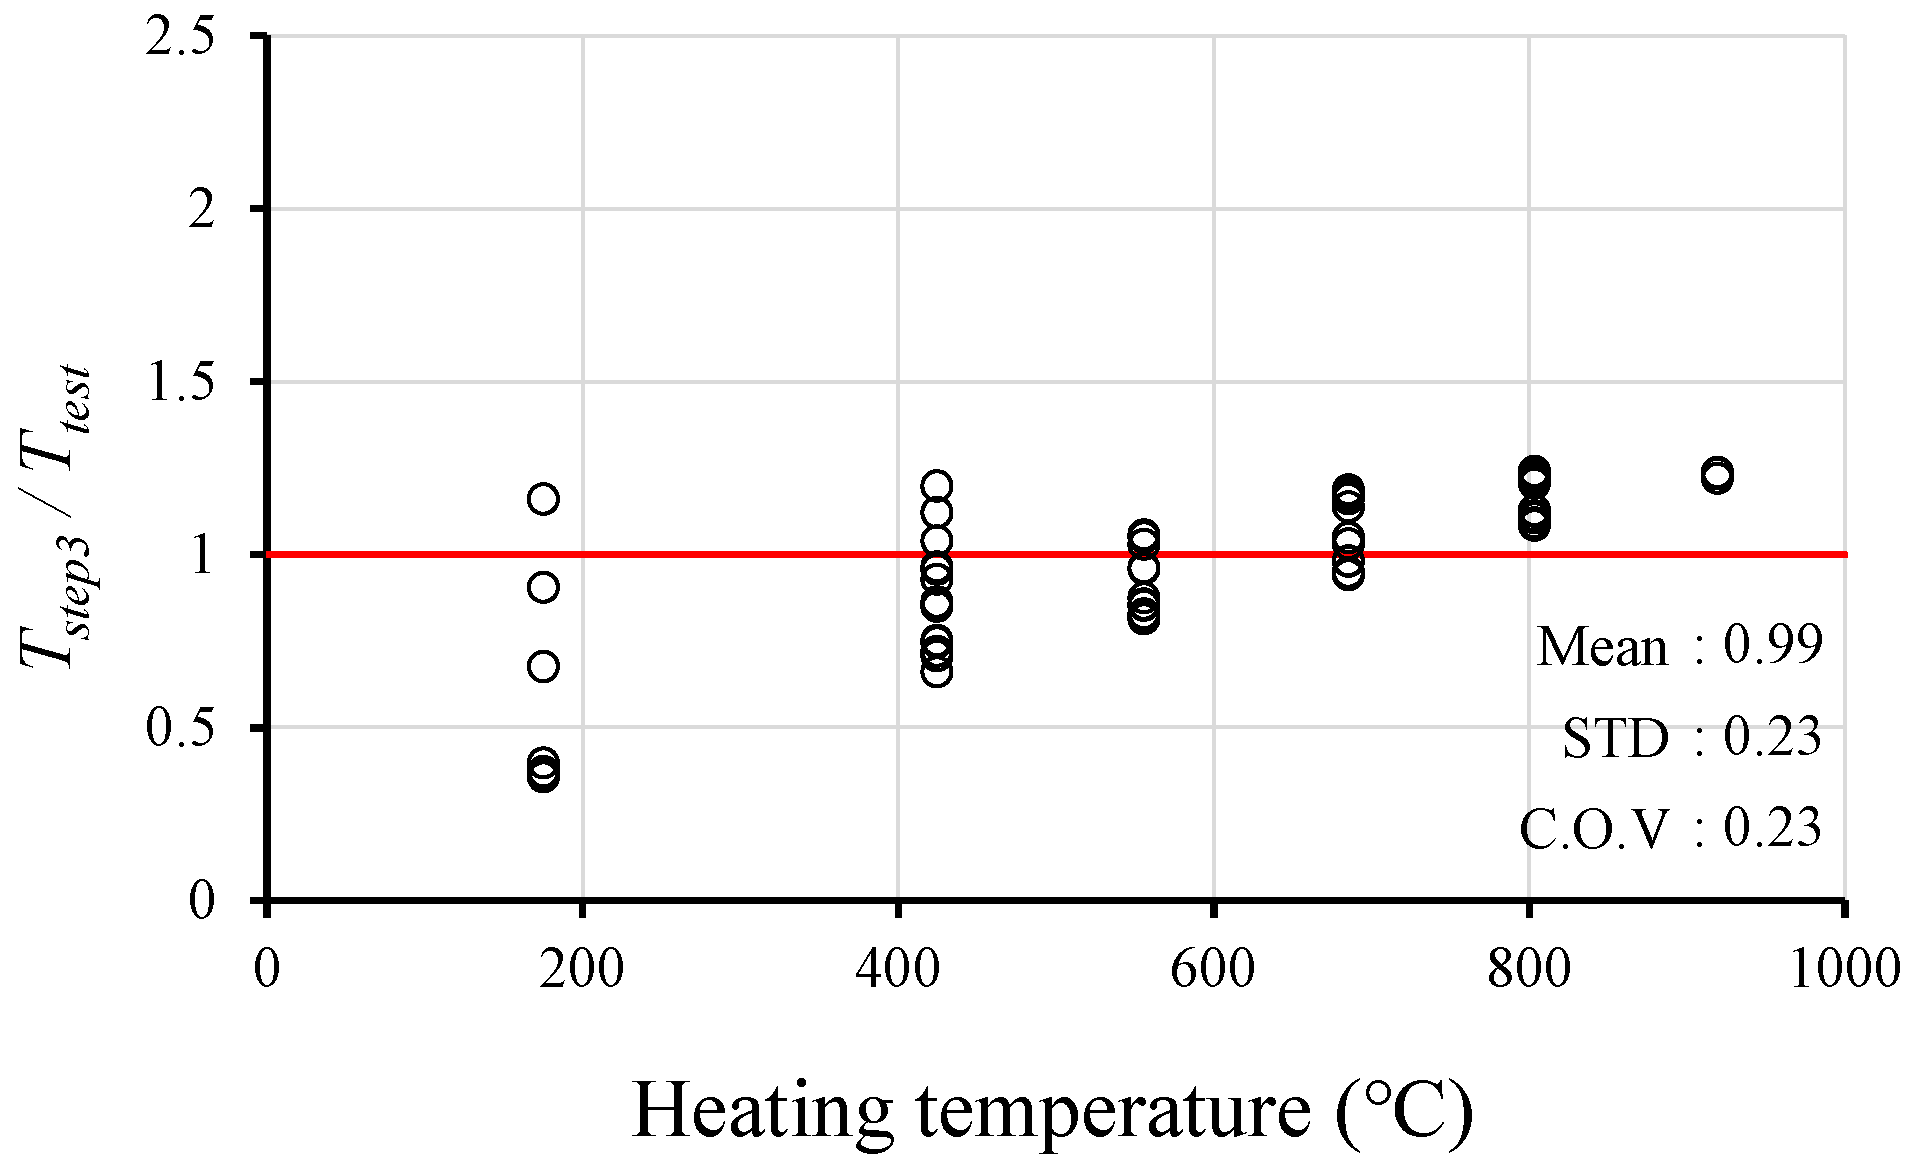
It should be noted that even when the concrete residual strength cannot be directly measured using a rebound test or experiments of specimens, this equation can be used. The condition 2vp2/fc ≤ 0.9 was derived based on the following reasons: Equation (13) may yield a residual strength value that exceeds the compressive strength of fire-undamaged concrete due to a regression error, but obviously the residual strength of fire-damaged concrete cannot exceed that of undamaged concrete. In other words, the ratio (2vp2/fc) cannot exceed 1.0. In this study, a threshold limit of this ratio was determined through a parametric study by varying the threshold value from 0.5 to 1.0 and evaluating the c.o.v. values of Equation (13) against the experimental results (Tstep3/Ttest), which represented the inaccuracy of Equation (11), as shown in Figure 10. In this parametric study, when the threshold value was 0.88—i.e., 2vp2/fc ≤ 0.88—the c.o.v. value had the minimum value of 0.226. In this study, the threshold value was taken as 0.9 by rounding off 0.88, which showed a c.o.v. value that was very similar to that for 0.88. Figure 11 shows that the heating temperature estimated using Equation (13) showed the average temperature ratio against the database of 0.99 and the c.o.v. of 0.23. These values showed that due to the uncertainties in the use of ultrasonic pulse velocity, Equation (13)’s estimation was slightly less accurate than that of Equation (11), but still much more accurate than Kang et al.’s machine-learning based model, and, therefore, showed practical benefit.

5. Application

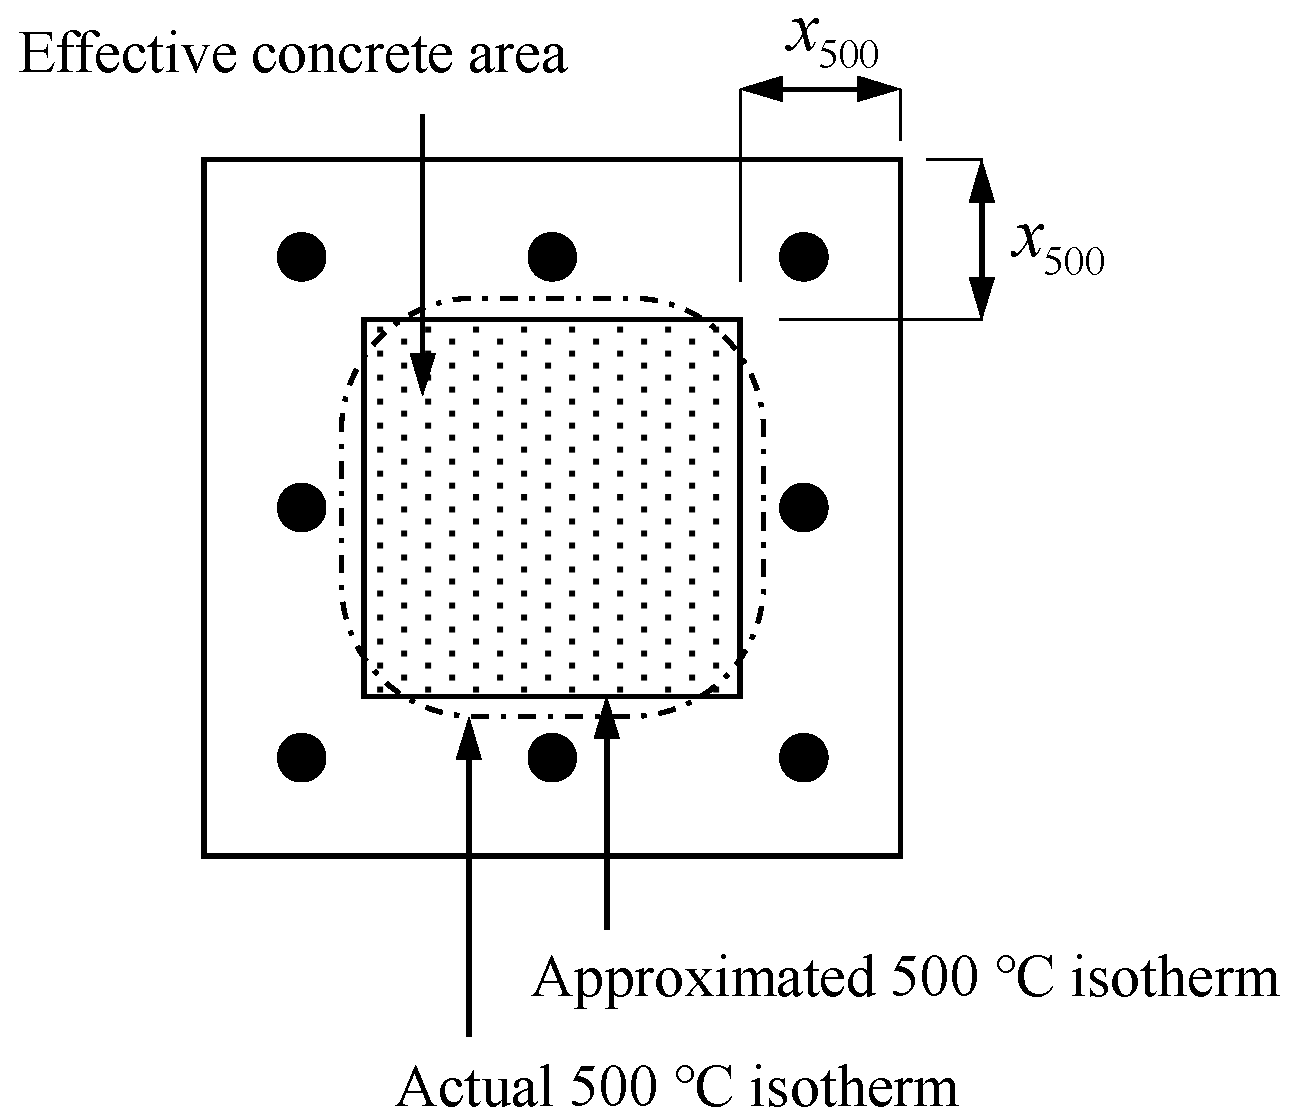
This study proposed a heating temperature method for RC members damaged by fire using the Bayesian parameter estimation method. The proposed method can be used for fire inspection and the structural performance assessment for RC members damaged by fire. This section shows the application of the proposed heating temperature estimation model to the 500 °C isotherm method in Eurocode 2 to calculate the axial strength of an RC column without eccentricity (P0). As mentioned before, the 500 °C isotherm method considers that a part of a concrete section exposed to a temperature higher than 500 °C has no structural resistance [7]. Figure 12 illustrates this concept by defining the effective concrete area.
The neglected sectional area is calculated based on the following equation for the calculation of a penetration depth (x500):
x 500 = [ 1 exp ( 4.5 + Δ T x 0.18 n w Δ T f ) ] 0.5
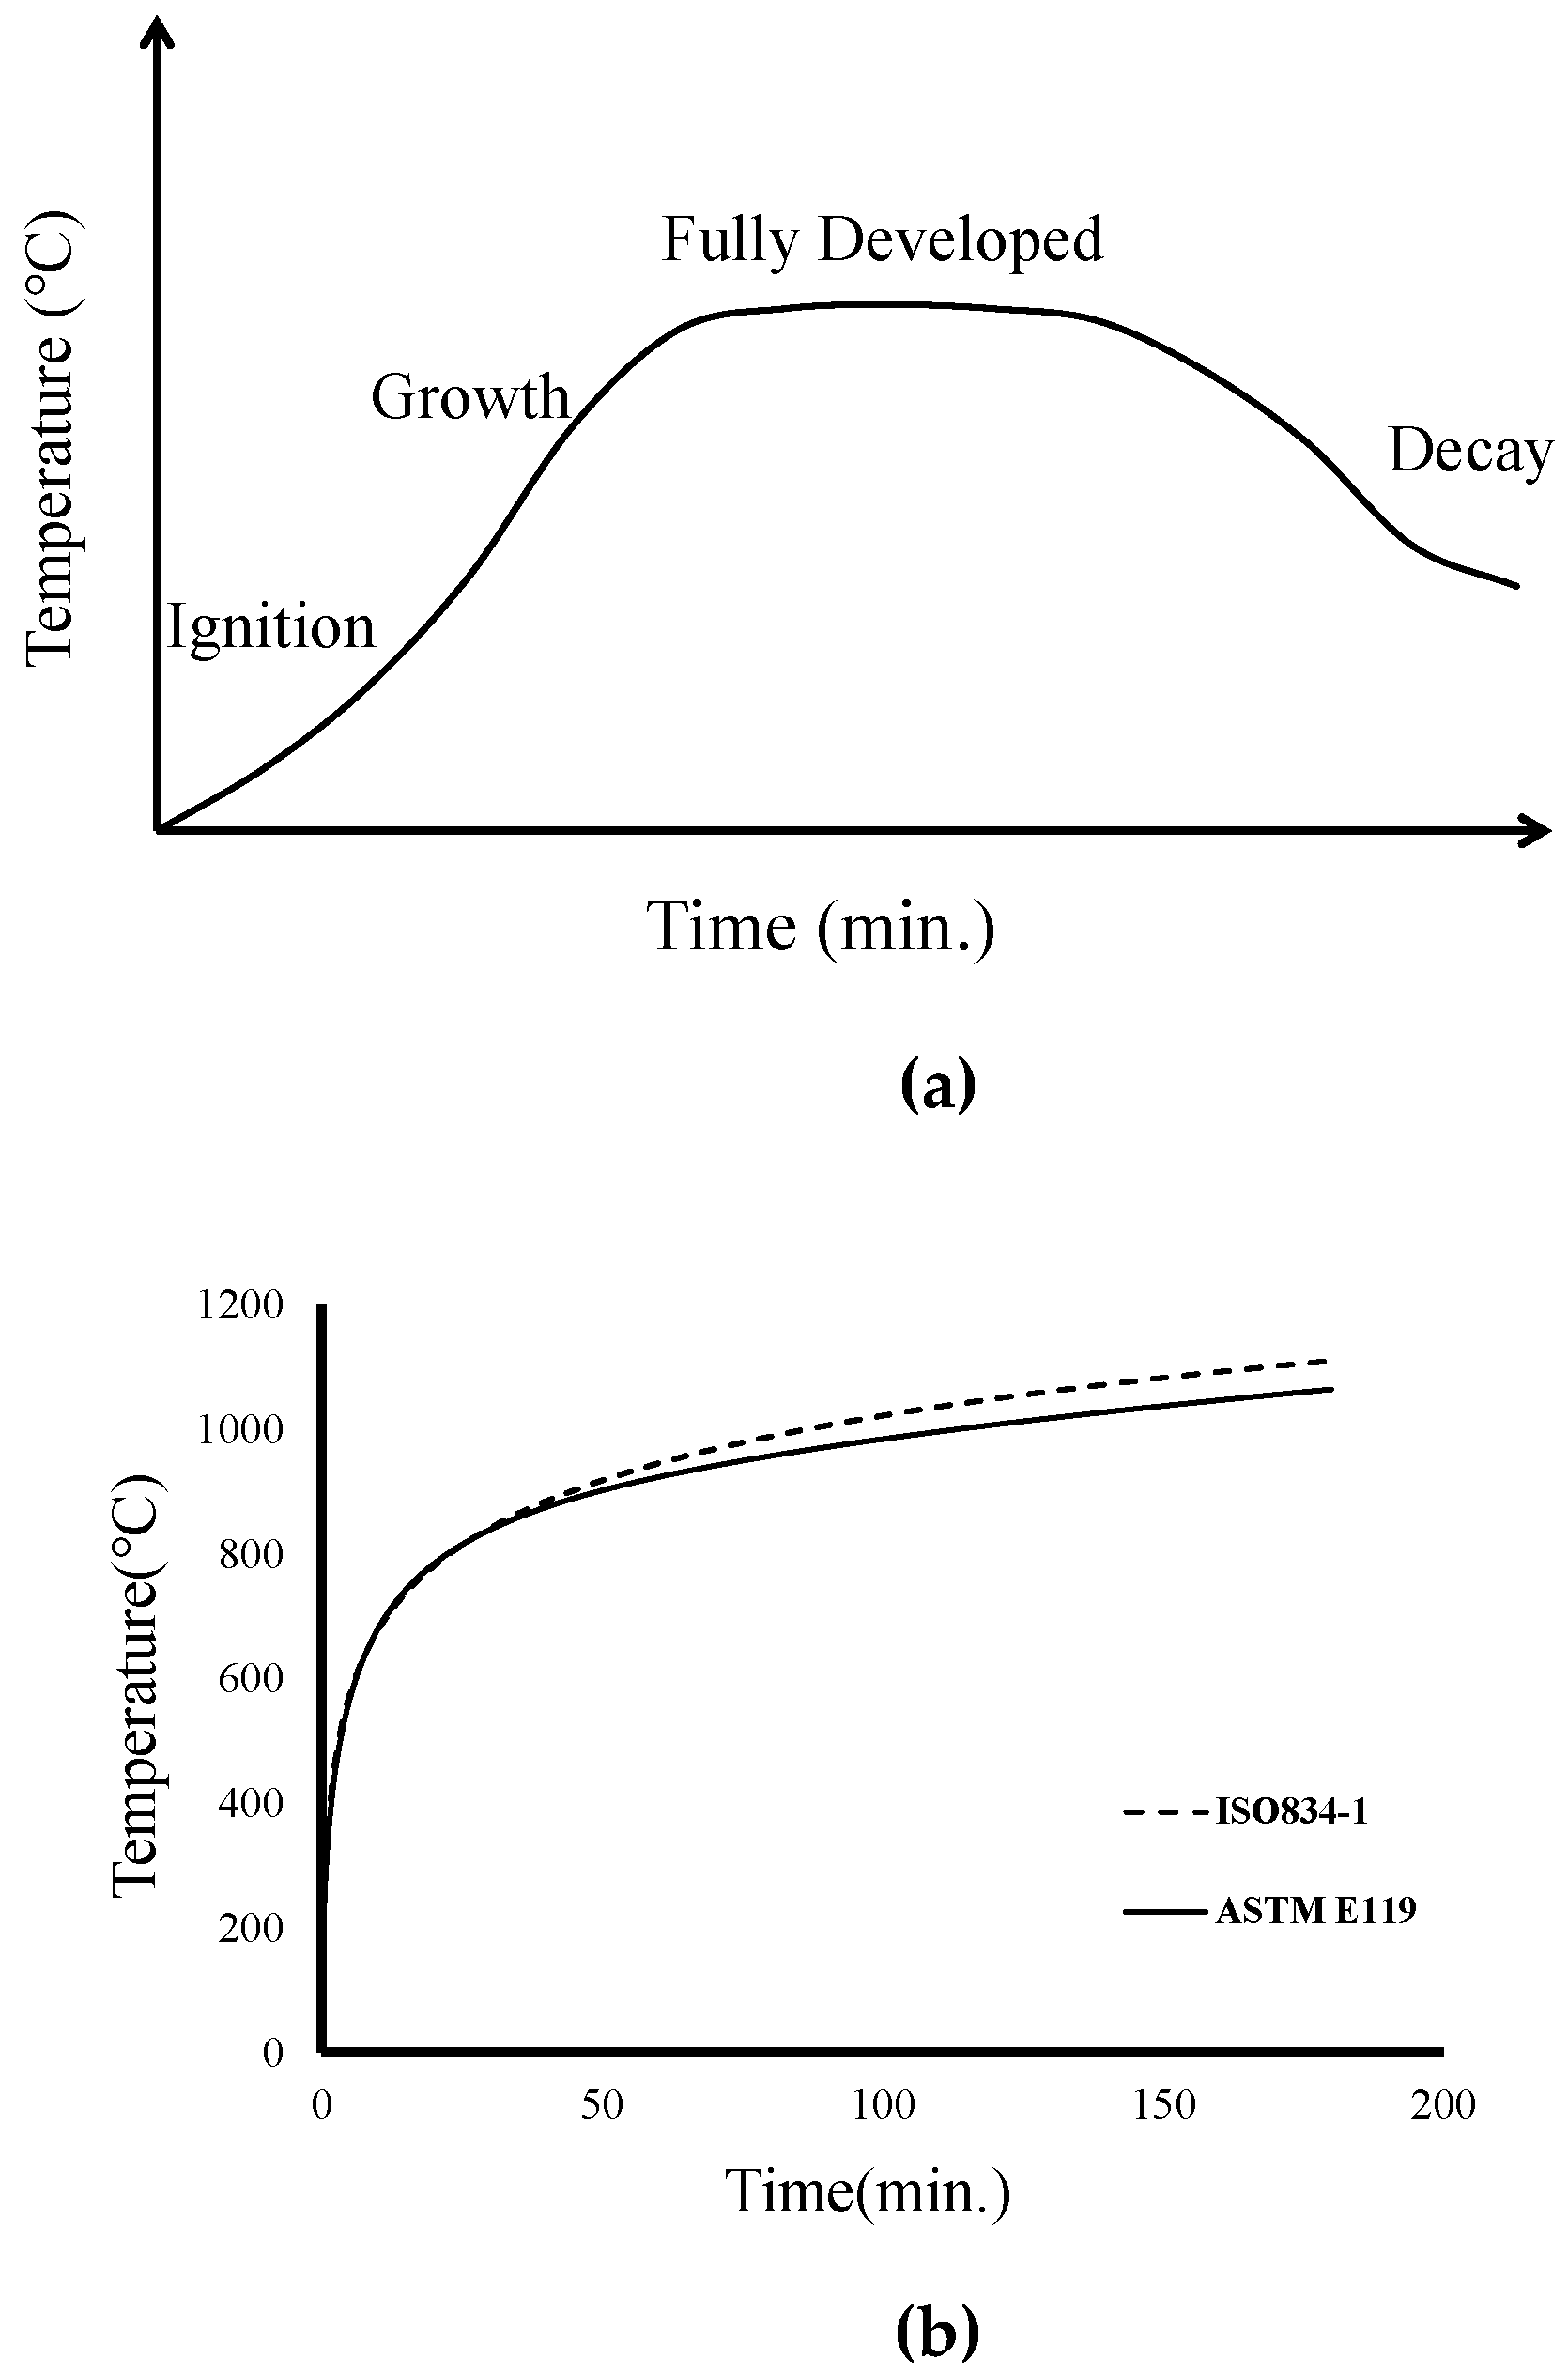
where ΔTx is the temperature increase at x500, which can be assumed to be 480 °C [37]; nw is the factor for calculating the surface temperature of the concrete section that is taken to be 1–0.0616 t−0.88; t is the fire exposure time; and ΔTf is the temperature rise of the fire that is taken as 345∙log(8t + 1) based on the standard fire curve [2]. In the 500 °C isotherm method, the temperature is estimated based on the standard fire curve. The actual fire curve can be represented as Figure 13a with the following four stages: ignition, growth, full development, and decay, but as shown in Figure 13b, the standard fire curve in the 500 °C isotherm method only considers the temperature after flashover. In the standard fire curve, the temperature rapidly increases after ignition and reaches the fully developed stage, but the decay process is not considered. This standard curve in the 500 °C standard curve is appropriate for experiments for fire resistance performance, but it is not suitable for post-fire residual strength assessment for structural members. In addition, as mentioned before, it is difficult to directly measure the fire temperature in the structure, and in order to determine the temperature similar to the actual fire temperature, fire simulations, such as the Fire Dynamics Simulator (FDS) developed by the National Institute of Standards and Technology (NIST), may be used. However, the fire simulation has uncertainties in the determination of the parameter values, such as fire exposure time and ventilation, which might be quite different from the actual fire-damaged structure properties. To overcome this, the heating temperature estimation models developed in this study in Equations (11) and (13) are used to calculate ΔTf, because the proposed models can realistically estimate the actual structure’s heating temperature. If we assume the ambient temperature to be 20 °C [37], ΔTf can be calculated as Tpro or pro.U − 20 (from Equations (11) or (13)) and then Equation (14) becomes the following equation:
x 500 = [ 1 exp ( 4.5 + 480 0.18 n w ( T p r o   or   p r o . U 20 ) ) ] 0.5
The effective sectional area of concrete damaged by fire (Areduced) can be calculated as follows:
A r e d u c e d = ( b 2 x 500 ) ( h 2 x 500 )   for   x 500 > ( c c + d b ) A r e d u c e d = ( b 2 x 500 ) ( h 2 x 500 ) A s   for   x 500 ( c c + d b )
where cc is the concrete cover depth and db is the diameter of the reinforcing bar. The yield strength of the reinforcing bar (fy(T)) exposed to the temperature (Ts) can be calculated by adopting the following equation in Eurocode 2 [4]:
f y ( T s ) = K s ( T s ) f y
where Ks(Ts) is the reduction factor of the yield strength of the steel reinforcing bar exposed to the temperature (Ts), as shown in Table 6. Based on Wickström’s research [38], Ts is calculated as follows:
T s = n x n w Δ T f + 20
where nx is the factor to take into account for heat transfer through the concrete section, and it is calculated as 0.18 ln(γn/x2) − 0.81, where x is the depth of the reinforcing bar from the fire exposure surface and γ is the ratio of the thermal diffusivity of concrete, which is 1.0 for normal weight concrete. As ΔTf can be estimated as Tpro or pro.U − 20, Equation (18) becomes the following equation:
T s = n x n w ( T p r o   or   p r o . U 20 ) + 20
Based on Equations (16) and (17), the structural performance of a concrete member damaged by fire and the axial strength without the eccentricity (P0) of an RC column can be estimated as follows:
P 0 = 0.85 f c A r e d u c e d + A s f y ( T s )
The flexural and shear strength of RC members can be estimated similarly. The combination of the heating temperature estimation model developed in this study and the 500 °C isotherm method in Eurocode 2 is useful when examining the structural performance of RC members, as it adopts a realistic estimation of heating temperature.

6. Conclusions

In this study, a total of 77 heating test results on concrete specimens were collected from the literature, and the correlations between heating temperature and the residual strength of concrete and between heating temperature and ultrasonic pulse velocity were analyzed in detail. In addition, new heating temperature estimation models were developed based on the Bayesian parameter estimation approach. From this study, the following conclusions were derived:
  • This study used the Bayesian parameter estimation method and developed a method to statistically estimate the heating temperature by including a term represented as the ratio of the concrete compressive strength and the residual strength. The accuracy of this method was estimated as the c.o.v. of 13%, which showed significant improvement from the recent Kang et al.’s machine-learning based model.
  • The residual concrete compressive strength is usually measured as a rebound strength using a Schmidt hammer, but after fire damage, this can be difficult to apply to an uneven spalled concrete surface. For this situation, this study proposed an alternative way to estimate the residual concrete compressive strength using ultrasonic pulse velocity, and the developed model with the use of ultrasonic pulse velocity had the estimation c.o.v. of 23%. This method also showed better accuracy than Kang et al.’s model.
  • The proposed equations, based on the Bayesian parameter estimation approach, are very practical because they provide an accurate estimation of heating temperatures by using the ultrasonic pulse velocity and residual compressive strength of concrete that can be typically obtained by simple measurements during safety diagnosis.
  • The developed heating temperature estimation models can be used for fire inspection and the structural performance assessment of RC members damaged by fire. For example, the proposed method can replace the standard fire curve provided in the 500 °C isotherm method in Eurocode 2 by providing a more realistic heating temperature estimation.

Author Contributions

Original draft manuscript, H.-C.C.; Validation, I.H., S.-J.H.; Investigation, H.K., W.-H.K.; Supervision and Review Writing, K.S.K. All authors have read and agreed to the published version of the manuscript.

Funding

This research was funded by Urban Architecture Research Program funded by Ministry of Land, Infrastructure and Transport of Korean government grant number 20AUDP-B100356-06. Also, the sixth author, Kang Su Kim, would like to acknowledge that this research was supported by the Basic Study and Interdisciplinary R&D Foundation Fund of the University of Seoul (2020).

Conflicts of Interest

The authors declare no conflict of interest.

References

  1. Georgali, B.; Tsakiridis, P.E. Microstructure of fire-damaged concrete. A case study. Cem. Concr. Compos. 2005, 27, 255–259. [Google Scholar] [CrossRef]
  2. ISO 834-1:1999(E). Fire-Resistance Tests-Elements of Building Construction-Part 1: General Requirements; ISO: Geneva, Switzerland, 1999. [Google Scholar]
  3. ASTM E119, Standard Methods of Fire Tests of Building Construction and Materials; American Society for Testing and Materials: Philadelphia, PA, USA, 2000.
  4. EN 1992-1-2, Eurocode 2: Design of Concrete Structures, Part 1-2: General Rules-Structural Fire Design; European Committee for Standardization: Brussels, Belgium, 2004.
  5. Architectural Institute of Japan (AIJ). Diagnosis and Repair Methods of Fire-Damaged Buildings; Architectural Institute of Japan: Tokyo, Japan, 2004. [Google Scholar]
  6. Korea Concrete Institute (KCI). Fire Resistance of Reinforced Concrete Structures; Korea Concrete Institute: Seoul, Korea, 2005. [Google Scholar]
  7. Anderberg, Y. Analytical Fire Engineering Design of Reinforced Concrete Structures Based on Real Fire Characteristics. In Proceedings of the 8th Congress of the Federation Internationale de la Precontrainte, London, UK, 30 April–5 May 1978. [Google Scholar]
  8. Buchanan, A.H. Structural Design for Fire Safety; Wiley: London, UK, 2002. [Google Scholar]
  9. El-Fitiany, S.F.; Youssef, M.A. Assessing the flexural and axail behaviour of reinforced concrete members at elevated temperatures using sectional analysis. Fire Saf. J. 2009, 44, 691–703. [Google Scholar] [CrossRef]
  10. Caldas, R.B.; Sousa, J.B.M., Jr.; Fakury, R.H. Interaction diagrams for reinforced concrete sections subjected to fire. Eng. Struct. 2010, 32, 2382–2838. [Google Scholar] [CrossRef]
  11. Heo, I.W.; Kang, H.; Lee, D.H.; Oh, J.Y.; Lee, J.M.; Kim, K.S. Performance-based fire behaviour analysis for underground parking structures. J. Urban Sci. 2016, 20, 90–100. [Google Scholar] [CrossRef]
  12. Kang, H.; Cheon, N.R.; Lee, D.H.; Lee, J.M.; Kim, K.S.; Kim, H.Y. PM interaction curve for reinforced concrete columns exposed to elevated temperature. Comput. Conc. 2019, 19, 537–544. [Google Scholar] [CrossRef]
  13. Alqassim, M.A.; Jones, M.R.; Berlouis, L.E.A.; Nic Daeid, N. A thermoanalytical, X-ray diffraction and petrographic approach to the forensic assessment of fire affected concrete in the United Arab Emirates. Forensic Sci. Int. 2016, 264, 82–88. [Google Scholar] [CrossRef] [Green Version]
  14. Kang, H. Assessment for Fire Damaged Reinforced Concrete Structures Based on Fuzzy Theory. Ph.D. Thesis, Department of Architectural Engineering, University of Seoul, Seoul, Korea, 2018. [Google Scholar]
  15. Kang, H.; Cho, H.C.; Choi, S.H.; Heo, I.; Kim, H.Y.; Kim, K.S. Estimation of Heating Temperature for Fire-Damaged Concrete Structures Using Adaptive Neuro-Fuzzy Inference System. Materials 2019, 12, 3964. [Google Scholar] [CrossRef] [Green Version]
  16. Shih, Y.F.; Wang, Y.R.; Lin, K.L.; Chen, C.W. Improving non-destructive concrete strength tests using support vector machines. Materials 2015, 8, 7169–7178. [Google Scholar] [CrossRef]
  17. Jang, J.S.R.; Sun, C.T.; Mizutani, E. Neuro-Fuzzy and Soft Computing: A Computational Approach to Learning and Machine Intelligence; Prentice Hall: Upper Saddle River, NJ, USA, 1997. [Google Scholar]
  18. Gardoni, P. Probabilistic Models and Fragility Estimates for Structural Components and Systems. Ph.D. Thesis, University of California, Berkeley, CA, USA, 2002. [Google Scholar]
  19. Gardoni, P.; Mosalam, K.M.; Kiureghian, A.D. Probabilistic seismic demand models and fragility estimates for RC bridges. J. Earthqu. Eng. 2003, 7, 79–106. [Google Scholar] [CrossRef]
  20. Song, J.h.; Kang, W.H.; Kim, K.S.; Jung, S.M. Probabilistic shear strength models for reinforced concrete beams without shear reinforcement. Struct. Eng. Mech. 2010, 11, 15–38. [Google Scholar] [CrossRef] [Green Version]
  21. Box, G.E.P.; Tiao, G.C. Bayesian Inference in Statistical Analysis, Wiley Classics Library Edition; John Wiley and Sons: New York, NY, USA, 1992. [Google Scholar]
  22. Architectural Institute of Japan (AIJ). Manual of Nondestructive Test Methods for the Evaluation of Concrete Strength; Architectural Institute of Japan: Tokyo, Japan, 1983. [Google Scholar]
  23. Akashi, T. Studies on nondestructive testings of concrete. J. JSCE 1988, 390, 1–22. [Google Scholar] [CrossRef] [Green Version]
  24. Korea Research Institute of Standards and Science. Standardization for Concrete Compressive Strength Estimation Equation by Experiment for Specimen and Wall Type Structure; Research Report; Korea Research Institute of Standards and Science: Seoul, Korea, 1999. [Google Scholar]
  25. Atici, U. Prediction of the strength of mineral admixture concrete using multivariable regression analysis and an artificial neural network. Expert Syst. Appli. 2001, 38, 9609–9618. [Google Scholar] [CrossRef]
  26. Del Rio, L.M.; Jimenes, A.; Lopez, F.; Rufo, M.M.; Paniagua, J.M. Characterization and hardening of concrete with ultrasonic testing. Ultrasonics 2004, 42, 527–530. [Google Scholar] [CrossRef] [PubMed]
  27. Han, M.Y.; Kim, D.W. A study on the pull-out test for non-destructive evaluation of concrete strength. Proc. Korea Concr. Inst. 1999, 11, 639–642. [Google Scholar]
  28. Im, S.Y. A Study on the Estimation of Compressive Strength of Concrete by Non-Destructive Test. Master’s Thesis, Daegu University, Daegu, Korea, 2007. [Google Scholar]
  29. Khan, M.I. Evaluation of non-destructive testing of high strength concrete incorporating supplementary cementitious composites. Resour. Conserv. Recycl. 2012, 61, 125–129. [Google Scholar] [CrossRef]
  30. Kim, M.W.; Oh, H.; Oh, W.C. Estimating the compressive strength of high strength concrete using surface rebound value and ultrasonic velocity. J. Korea Inst. Struct. Maint. Insp. 2016, 20, 1–9. [Google Scholar] [CrossRef] [Green Version]
  31. Lee, H.K.; Lee, B.J.; Oh, K.C.; Kim, Y.Y. Reliability evaluation for prediction on concrete compressive strength through impact resonance method and ultra pulse velocity method. J. Korea Inst. Struct. Maint. Insp. 2016, 19, 18–24. [Google Scholar] [CrossRef] [Green Version]
  32. Mohammed, B.S.; Najwa, J.A.; Abdullahi, M. Evaluation of rubbercrete based on ultrasonic pulse velocity and rebound hammer tests. Constr. Build. Mater. 2011, 25, 1388–1397. [Google Scholar] [CrossRef]
  33. Qasrawi, H.Y. Concrete strength by combined nondestructive methods Simply and reliably predicted. Cem. Concr. Res. 2000, 30, 739–746. [Google Scholar] [CrossRef]
  34. Trtnik, G.; Franci, K.; Goran, T. Prediction of concrete strength using ultrasonic pulse velocity and artificial neural networks. Ultrasonics 2009, 49, 53–60. [Google Scholar] [CrossRef] [PubMed] [Green Version]
  35. Won, J.P.; Park, S.K.; Ahn, T.S. A study on the concrete strength prediction by ultrasonic pulse velocity method. Proc. Korea Soc. Civil. Eng. 2000, 1, 391–394. [Google Scholar]
  36. Kim, M.H.; Choi, S.J.; Kang, S.P.; Kim, J.H.; Jang, J.H. A study on the application of non-destructive testing equation for the estimation of compressive strength of high strength concrete. J. Korea Inst. Build. Constr. 2002, 2, 123–130. [Google Scholar] [CrossRef]
  37. Purkiss, J.A. Fire Safety Engineering: Design of Structures, 2nd ed.; Elsevier: Amsterdam, The Netherlands, 2007. [Google Scholar]
  38. Wickström, U. A very Simple Method for Estimating Temperatures in Fire Exposed Structures; Technical Report SP RAPP 1986:46; Swedish National Testing and Research Institute: Boras, Sweden, 1986. [Google Scholar]
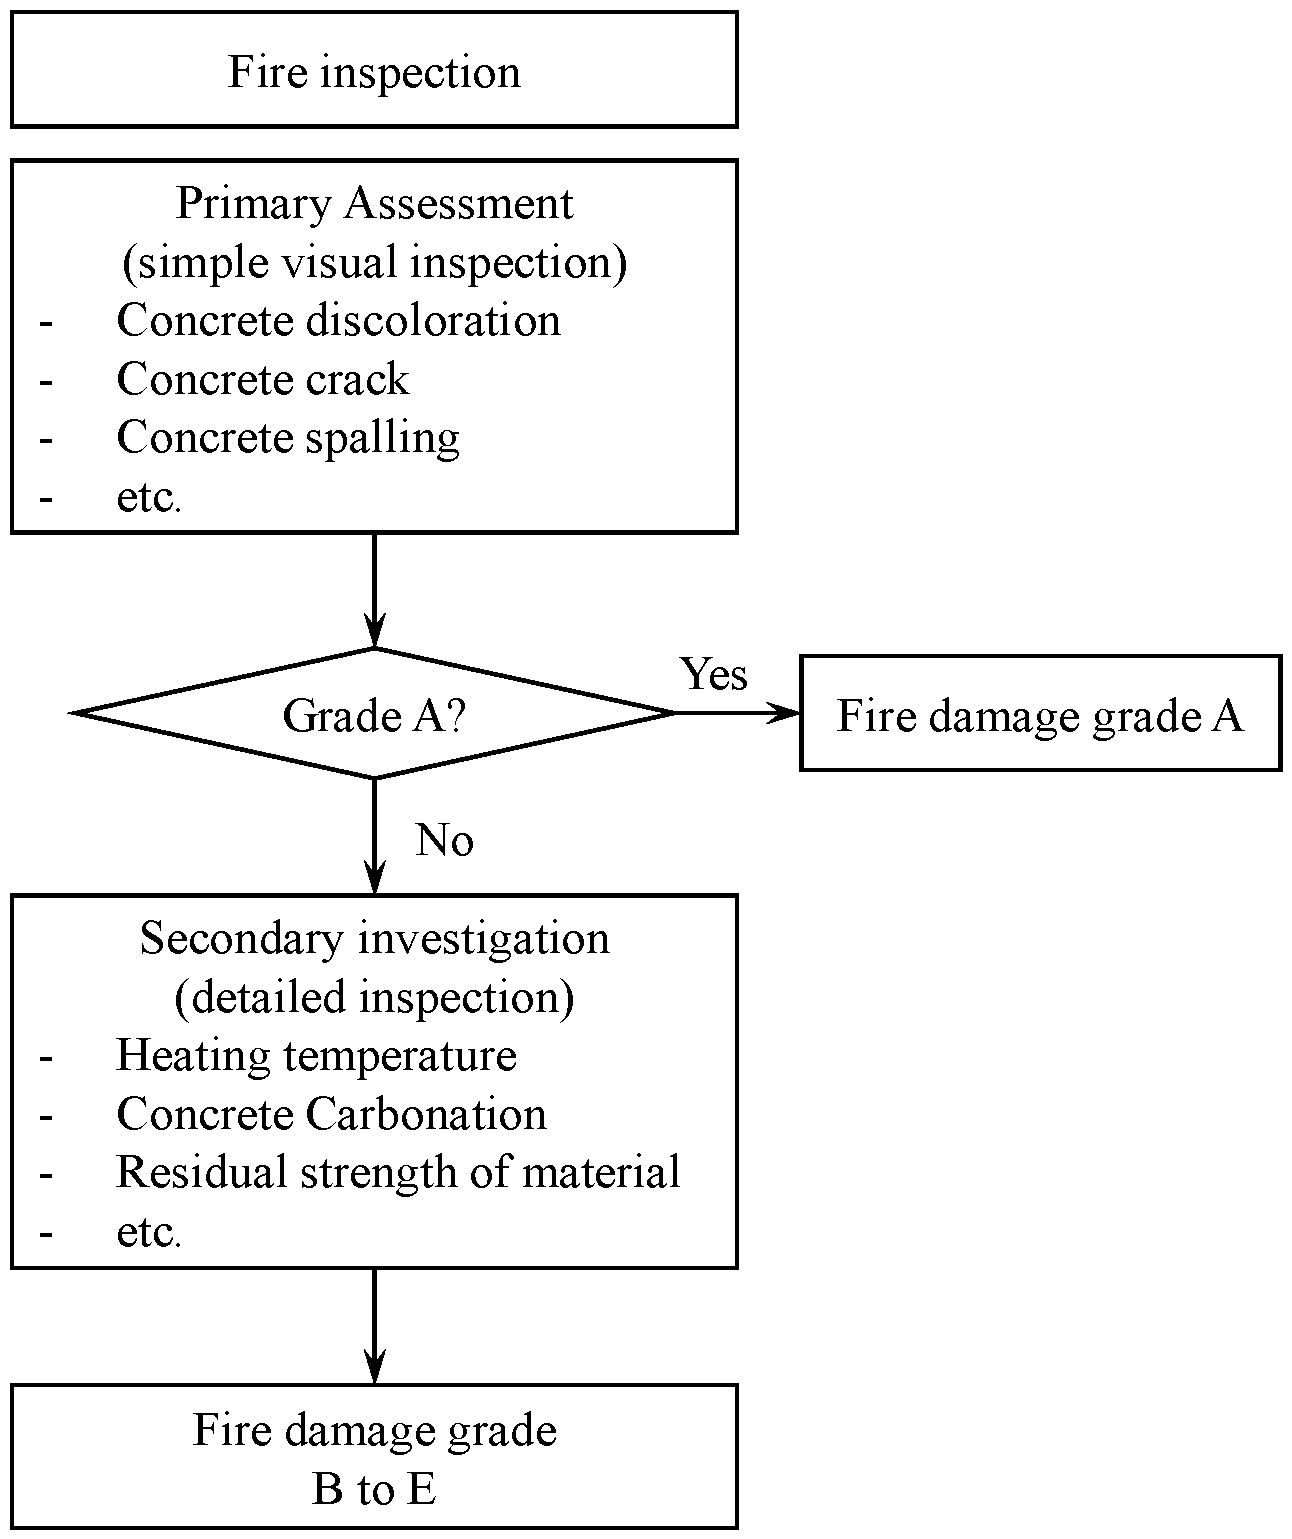
Figure 1. Fire inspection flow suggested by the Architectural Institute of Japan (AIJ) and Korea Concrete Institute (KCI) [5,6].
Sustainability 12 04225 g001
Figure 2. Sugeno fuzzy inference system.
Sustainability 12 04225 g002
Figure 3. Heating temperature ranges calculated by Kang et al.’s model [15].
Sustainability 12 04225 g003
Figure 4. Trend of variables with respect to the increased heating temperature. (a) Residual concrete compressive strength according to heating temperature; (b) ultrasonic pulse velocity of concrete according to heating temperature; (c) reflectance ratio of concrete according to heating temperature.
Sustainability 12 04225 g004aSustainability 12 04225 g004b
Figure 5. Heating temperature ratio between first trial equation and test result.
Sustainability 12 04225 g005
Figure 6. Residual compressive strength and the ultrasonic pulse velocity of concrete according to reflectance of concrete. (a) Reflectance ratio of concrete according to ultrasonic pulse velocity of concrete; (b) reflectance ratio of concrete according to residual strength.
Sustainability 12 04225 g006
Figure 7. Heating temperature ratio between proposed model and test result.
Sustainability 12 04225 g007
Figure 8. Residual concrete compressive strength ratio between AIJ equation and test result according to heating temperature.
Sustainability 12 04225 g008
Figure 9. Relation between residual strength and ultrasonic velocity represented by Kang et al. [15].
Sustainability 12 04225 g009
Figure 10. C.o.v ratio between Tpro.U and Ttest according to maximum of 2vp2/fc.
Sustainability 12 04225 g010
Figure 11. Heating temperature ratio between proposed model using ultrasonic pulse velocity of concrete and test result.
Sustainability 12 04225 g011
Figure 12. Concept of 500 °C isotherm method.
Sustainability 12 04225 g012
Figure 13. Difference between actual and standard fire curve. (a) Actual fire curve (Buchanan, 2002); (b) standard fire curve (ISO 834-1 1999).
Sustainability 12 04225 g013
Table 1. Concrete strength reduction factors according to temperature [4].
Temperature (°C)Strength Reduction Factor
201.00
1001.00
2000.95
3000.85
4000.75
5000.60
6000.45
7000.30
8000.15
9000.08
10000.04
11000.01
12000.00
Table 2. Parameters of heating temperature test data [15].
No.fcfc/frevpRNo.fcfc/frevpR
1240.834.4247.3240300.091.8849.85
2240.854.2147.2741300.091.8552.72
3240.854.4546.7242500.933.9646.19
4240.473.0856.6143501.063.9838.16
5240.442.8252.4244501.064.0746.7
6240.392.9649.2345500.672.5645.71
7240.202.4152.9146500.563.0145.61
8240.262.1349.3547500.322.2146.51
9240.152.1454.9748500.282.0648.04
10240.142.1053.6649500.141.3943.77
11240.142.0853.1150500.141.4351.32
12240.051.6352.851500.061.0547.71
13240.051.5558.3852500.061.1253.86
14240.051.5253.153500.061.0445.54
15270.963.9045.8354500.090.9256.25
16271.043.7149.8355500.090.9454.25
17270.582.7351.7456500.090.9654.46
18270.652.7755.1457550.834.4940.52
19270.151.8754.5158550.844.1341.77
20270.151.5454.9659550.513.4844.28
21270.151.4954.6460550.332.5945.18
22270.151.2950.9961550.342.6239.97
23270.151.2953.4462550.222.4247.14
24270.051.0151.7263550.111.6848.7
25270.050.9950.2664240.302.4250.52
26270.050.9650.9565240.131.9849.3
27270.050.4657.5566240.051.5154.71
28300.834.7244.5267270.873.9049.45
29300.834.5153.3368270.562.7553.96
30300.854.4248.1869270.151.3050.36
31300.653.5853.6770300.252.4251.73
32300.573.2147.8771300.091.7954.12
33300.493.1251.7672500.493.1049.77
34300.382.4253.273500.322.1046.78
35300.372.4253.9674500.141.3145.71
36300.302.6652.4175550.543.5144.83
37300.222.3453.676550.222.5744.28
38300.252.4057.6577550.111.6649.09
39300.252.3653.2
Notes: fc: concrete compressive strength, fre: residual compressive strength, vp: ultrasonic pulse velocity, R: reflectance ratio of concrete.
Table 3. Fire damage grade [5,6].
Temperature (°C)Damage LevelGrade
T < 300No damageI
Finishing material damage
(soot, surface exfoliation)
II
300 ≤ T < 600Concrete damage without steel damage
(small cracks in concrete or spalling)
III
600 ≤ T < 950Bond damage of steel bars
(large cracks in concrete or exposure of steel bars)
IV
950 ≤ T < 1200Damage or buckling of steel bars
(large damage or deformation of structural members, heavy exposure of steel bars in wide area)
V
1200 ≤ TConcrete melting
Table 4. C.o.v. of power terms in Equation (8).
Power TermsMean ValuesC.o.v.
ϴ14.340.36
ϴ20.140.47
ϴ30.540.22
ϴ41.011.13
Table 5. Compressive strength estimation models using ultrasonic pulse velocity.
ProposerCompressive Strength Equation (MPa)
AIJ [22] 21.5 v p 62.0
Materials Research Society of Japan [23] 10.2 v p 11.7
KRISS [24] 32.565 v p 113.5
Atici [25] 0.0316 e 1.3 v p
Del Rio [26] exp { ( 5.4 ± 0.8 ) + ( 1.85 ± 0.18 ) v p }
Han and Kim [27] 60.977 v p 234.2
Im [28] 18.7 v p 61.3551
Khan [29] ( 0.5208 v p ) 5
Kim et al. [30] 56.974 v p 206
Lee et al. [31] 0.06 e 0.0015 v p
Mohammed et al. [32] 0.7586 e 0.8 v p
Qasrawi [33] 36.72 v p 129.077
Trtnik et al. [34] 0.0854 e 1.2882 v p
Won et al. [35] 537.96 v p 2000
Kim et al. [36] 50.163 v p 178.2
Notes: v p : Ultrasonic pulse velocity (km/s).
Table 6. Reduction coefficients for yield strength of steel according to temperature.
Temperature Rage at Steel BarReduction Coefficient
20 °C ≤ Ts ≤ 100 °C K s ( T s ) = 1.0
100 °C < Ts ≤ 400 °C K s ( T s ) = 0.7 0.3 ( T 400 ) / 300
400 °C < Ts ≤ 500 °C K s ( T s ) = 0.57 0.13 ( T 500 ) / 100
500 °C < Ts ≤ 700 °C K s ( T s ) = 0.1 0.47 ( T 700 ) / 200
700 °C < Ts ≤ 1200 °C K s ( T s ) = 0.1 ( 1200 T ) / 500