Abstract
This study evaluated the influence of additional shear walls, constructed on the first floor, as strengthening methods for a piloti-type building subjected to earthquake loadings. Piloti-type buildings are commonly designed as urban structures in many cities of South Korea. The existence of just columns on the first floor of the building is a feature that is advantageous from an architectural viewpoint, and yet has potential structural disadvantages. Such columns usually exhibit shear–axial failure, due to inherent vertical and horizontal irregularities and insufficient seismic reinforcements. Among several retrofitting methods, including additional braces, carbon fiber reinforced polymers, dampers, and so forth, this research considered reinforced concrete shear walls to improve the seismic responses of piloti buildings. A parametric analysis of the location of the retrofitted shear walls in a typical piloti building was implemented using the Zeus-NL program. Nonlinear time history analysis and incremental dynamic analysis were performed to comparatively evaluate the structure’s seismic responses and fragility curves before and after retrofit.
1. Introduction
For decades, seismic response evaluations have been conducted on existing structures and their retrofitted versions. These seismic evaluations have become an essential requirement because of the tragic losses in human lives and economic cost resulting from earthquakes. The studies provide data about strengthening methods when the structures fail to meet current design provisions [1,2,3,4,5,6,7,8,9,10,11]. Since early in the century, numerous investigations have been carried out on the seismic responses of structures, analytically and experimentally considering structure types, analytical approaches, and seismic code implications. These topics are still being explored by seismic researchers.
Among other approaches, unconventional retrofitting methods to improve the seismic behavior of structures have been proposed and investigated. Choudhury and Kaushik [12] assessed the vulnerability of reinforced concrete (RC) buildings with open ground stories, considering wall openings. The research clarified the misperception that using openings in upper stories to reduce structure stiffness offsets the soft story effect, which is the main reason for the collapse of open ground story RC buildings. Syed and Gupta [13] considered the uncertainties in material parameters and their influence on the assessment of concrete shear wall fragility. Their results showed the importance of considering uncertainties at higher levels of intensity measurements, and vice versa. An aftershock fragility assessment was conducted by Poiani et al. [14] for a cast-in-place RC industrial structure with precast vaults. They performed fragility assessments of three finite element models using different probabilistic methods, and the model with the greatest probability of collapse was considered to have a seismic sequence effect afterward.
With the recent rapid developments in computer science, many researches have reported using advanced numerical models of structures to accurately capture structure behaviors, and have employed effective probabilistic methodologies to develop comprehensive fragility assessments [15,16,17,18,19,20].
Many retrofitting strategies to strengthen existing RC structures have been proposed, investigated, and validated through experimental and numerical analyses. Popular retrofitting methods, such as the insertion of RC column jackets (steel jacket and composite jacket), steel plates to confine column plastic hinge regions, dampers, base isolations, braces, and the insertion of shear walls, have been evaluated.
To effectively strengthen structures, the proper retrofitting method must be selected by evaluating the structure’s seismic response before and after retrofit [21,22,23,24,25,26,27,28]. Among retrofitting methods, the insertion of shear walls in existing structures is practical and economical, and efficiently increases structure stiffness while decreasing deformation demand. Honarparast and Chaallal [29] considered RC coupled shear walls using a seismic resistance system for medium- to high-rise buildings. Comparative results between the old and modern design were discussed to evaluate seismic behavior. In addition, an external fiber-reinforced polymer (FRP) retrofit to improve the seismic performance of deficient designs was proposed. Using wing walls as the strengthening method, Kim et al. [30] proposed an optimal seismic retrofit method for RC columns. The efficiency of the retrofitting method was determined via comparisons of pushover curves, interstory drift ratio, energy dissipation capacity, and failure modes.
Motivated by the mentioned research, this study conducted a fragility assessment of a piloti-type building before and after being retrofitted with shear walls on the first floor. Even though retrofitting shear walls are practical and can possibly bring structural advantages, few parametric studies can be found that address shear walls’ influence on the seismic behavior of structural buildings in general, and piloti-type buildings specifically.
In general, existing designs of reinforced concrete structures fail to meet the requirements of current seismic provisions and have been found vulnerable to severe seismic hazards. The piloti-type building is no exception. Although its structural configuration allows for the good use and distribution of space on the first floor, it is very hazardous from a seismic point of view. Existing vertical and horizontal irregularities and deficient reinforcements tend to concentrate intensive force on the first floor, which can lead to the collapse of columns and the entire building. Adding shear walls on the first floor of a piloti-type building is expected to increase structural stiffness and reduce lateral deformation.
However, due to subtle irregularities, the random insertion of shear walls can potentially increase the torsional effect, which is frequently attributed to the failure of corner columns. Though shear wall retrofitting strategies are often made based on intuition and experience of engineers, examinations of proposed retrofits are found necessary.
In this study, a typical piloti-type building, which was severely damaged during an earthquake in 2017 at Pohang, a coastal province of South Korea, was chosen as the research subject. Figure 1 illustrates the piloti-type building before and after the seismic event. Note that an existing elevator core wall was constructed in the lower-right corner of the building. The location of a core wall can inevitably result in structural torsion. Many studies have been conducted to investigate seismic behavior of irregular building structures. Stefano and Pintucchi [31] presented a study of seismic response of plan and vertically irregular building structures. Ferraioli [32] provided a useful contribution in the study of the torsional effect of real irregular buildings. The sensitivity of torsional inelastic response was deeply evaluated with respect to lateral force distribution, higher modes contribution, accidental eccentricity, and control point for displacement monitoring. Kreslin and Fajfar [33] presented a seismic evaluation of an existing complex RC building based on the N2 method. Such a simplified nonlinear method was proposed by the author previously and provided a feasible tool for the rational yet practical seismic evaluation of building structures for multiple performance objectives. Adding more shear walls to the opposite side of the core wall was expected to mitigate this torsional effect. Reinforced concrete shear walls greatly increase the strength of a building and its lateral resistance to lateral force from seismic events. However, because of the specific asymmetric plan of a piloti-type building, adding shear walls can significantly affect its seismic behavior. Therefore, to obtain the most appropriate retrofitting scheme, the piloti-type building was investigated with respect to variations in the locations of shear walls in the first story. Four different retrofitting plans were proposed based on architectural considerations and seismic evidence observed in the building. Numerical models of the original building and each of the retrofitted plans were implemented using the Zeus-NL program [34], a simulation platform for static and dynamic analysis, for seismic evaluation and fragility assessments. For future research, data collected from analytical simulations of piloti buildings will be utilized to develop a fragility generating model based on machine learning approaches. Recently, thanks to advances in computer technology, machine learning tools and their applications have been thriving and have been widely used in many fields of science engineering [35,36,37,38].
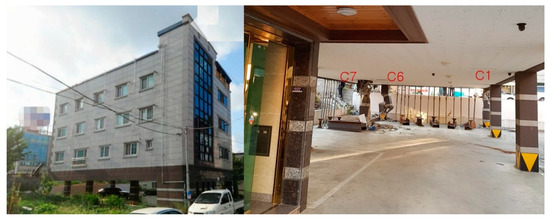
Figure 1.
Piloti-type building before and after the earthquake event.
1.1. Piloti-Type Building Numerical Model
A typical piloti-type building, located in Pohang Province of South Korea, was used as the reference to create the numerical model. Most piloti-type buildings are low-rise and are constructed with column components on the first floor to make space for parking and commercial services. The upper floors are constructed as moment-resisting frame and/or shear walls. This design creates structure irregularities vertically and horizontally. In addition, existing piloti buildings are typically designed with deficient amounts of reinforcements and lack seismic details, and as a result, fail to meet current standards. The columns on the first floor are extremely vulnerable and expected to experience significant force demand when hit by severe earthquakes.
In the target piloti building, it is worth noting the core wall in the corner of the first floor, which increases the vulnerability of the columns, especially corner columns, due to the torsional effect. Besides their practical advantage and simplicity, shear walls were intentionally used to mitigate the torsional effect existing in the target piloti building due to the corner core wall, rather than other retrofitting methods.
1.2. Numerical Model Description
For the column numerical model, the available fiber-based beam-column element and a zero-length shear spring in Zeus-NL were used to capture the flexural and shear responses of the column, respectively. For the shear wall model, many analytical models for shear wall systems have been suggested, including the three vertical line element model by Kabeyasawa et al. [39], the multi vertical line model by Charney [40], and the joint element model by Smith and Girgis [41]. Among these, the joint element model was adopted in this study for its simplicity and reasonable response, since it allows vertical and horizontal wall members to work together. The concrete material models for both the confined and unconfined cases were those proposed by Madas and Elnashai [42] while the model proposed by Martinez-Rueda and Elnashai [43] was used for concrete cyclic response. The reinforcement material model was a bilinear relationship model. Figure 2 presents numerical models of the column and shear wall used in this study, together with the building’s first-floor plan view and column sections. A three-dimensional model of the target piloti building was created using the above mentioned column and shear wall numerical models. More details about those numerical models can be found in Hoang Dang-Vu et al. [44,45].
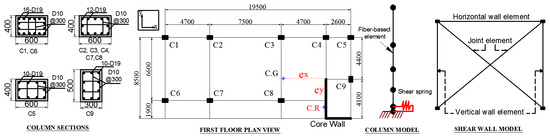
Figure 2.
Column, shear wall in the numerical model, and the target building’s first-floor plan view and column sections.
1.3. Retrofitting Strategies
Using additional shear walls on the first floor, four retrofitting plans were created. The locations of the retrofitting shear walls were determined based on architectural considerations, to maintain the parking function of the first floor and structural aspects. In terms of structural aspects, the shear walls were intentionally added adjacent to columns C1, C6, and C7 (see Figure 1 and Figure 2), which were severely damaged during the Pohang earthquake event. The proposed retrofitting plans were expected to mitigate the column damage and improve their seismic response.
Figure 3 shows four retrofitting strategies using additional shear walls, presented graphically. A three-dimensional piloti building model of strategy 1 is illustrated in Figure 4. The number of additional shear walls was fixed at three. It is noted that finding the most optimal retrofitting plan for the piloti building is beyond the scope of this study, since it requires examining several retrofit plans with different numbers and locations of shear wall. The present research provides a parametric analysis and evaluation using limited retrofitting plans, based on the architectural function and column site damage evidence that was collected.
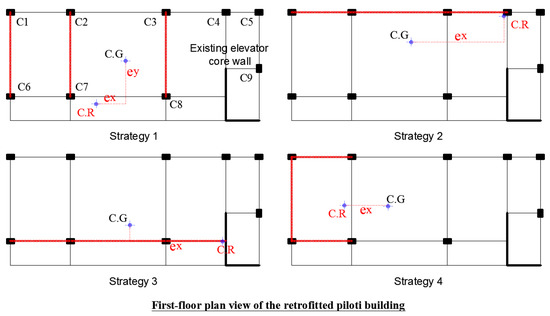
Figure 3.
Strategies for retrofitting the piloti-type building using additional shear walls.
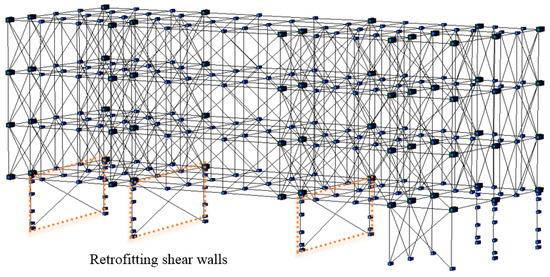
Figure 4.
Strategy 1: Numerical three-dimensional model of the piloti building.
The eccentricities of the original piloti building and the retrofitted buildings are not identical, since adding shear walls changes the building eccentricity in both horizontal directions. The center of gravity (C.G) and center of rigidity (C.R) were calculated and put in each floor plan (see Figure 2 for the original building and Figure 3 for the retrofitted building) for comparison. Table 1 presents the value of the eccentricity in each floor plan.

Table 1.
Eccentricities in both horizontal directions for each building floor plan.
It is noted that the Y-direction is the weak direction of the piloti building. Hence, the eccentricity in the X-direction ex is more influenced than its counterpart ey in causing torsional effects to the columns. In the original piloti building, the most vulnerable columns on the entire floor, C1 and C6, were severely damaged during the earthquake, which is consistent with the C.R calculation of the floor. According to the calculated eccentricities of the retrofit strategies, Plans 1 and 4 were expected to significantly improve the behavior of the columns, since the eccentricity in the x-direction ex was decreased by 47% and 21%, respectively. Plans 2 and 3 were less effective compared to Plans 1 and 4, since ex was increased by 70% in both cases and ey was decreased by 33% and 57%, respectively. The influence of each strategy on improving the columns’ seismic behavior will be examined further in the following sections.
1.4. Nonlinear Pushover Analysis
For seismic design and performance assessment of building structures, the nonlinear static procedure or so-called pushover analysis is recommended as the reference method. Colajanni et al. [46] proposed nonlinear and linearized combination coefficients for model pushover analysis. An adaptive version of the capacity spectrum method is proposed by Ferraioli et al. [47] to estimate deformation demands of steel moment-resisting frame subjected to seismic loads. In such a method, frequency content of response spectra, the higher mode effects, the progressive changes in the modal properties due to structural yielding and the interaction between modes in the inelastic range, and so forth, were deeply considered. The author also presented a multimode pushover procedure to predict the deformation demand of the steel moment-resisting frame [48]. In addition, for consideration of higher mode effects, Kreslin and Fajfar [49] proposed the extended N2 method.
A nonlinear pushover analysis was performed to obtain pushover curves for building frame C1–C6 (the frame in the plane of columns C1 and C6). Figure 5 depicts the frame C1–C6 pushover curves before and after the retrofit in the weak direction (Y-direction) of the building. Generally, additional shear walls provide strength and stiffness and reduce lateral deformation in the direction of their orientation. The initial stiffness of the frame was significantly increased in all cases of the retrofitting strategy except for Strategy 2, where no exceptional impact could be found compared to the original frame. Estimations of the frame’s shear strength and displacement at yield points and maximum points are presented in Table 2. Yield points were determined using an idealized force-displacement curve in accordance with FEMA 365 [50]. An improvement in frame C1–C6’s deformation capacity can also be found in Strategies 1, 3, and 4.
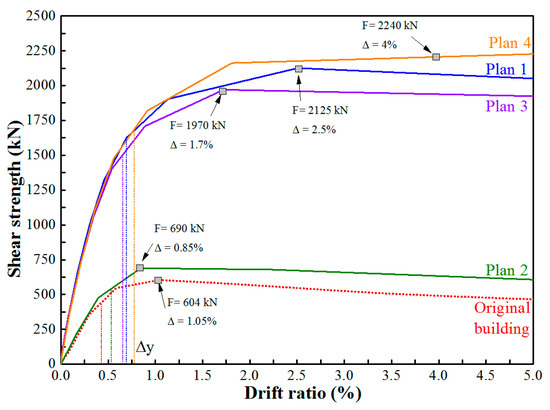
Figure 5.
Pushover curves of frame C1–C6 for original and retrofitted cases.
Table 2.
Estimation of frame C1–C6 yield and maximum points.
1.5. Input Ground Motions and Design Spectrum
A suite of 14 ground motions was selected and is presented in Table 3 for the nonlinear time history analysis (NTHA) of the piloti building. In this research, incremental dynamic analysis (IDA) was adopted to develop the fragility curve. Each earthquake excitation was scaled from a peak ground acceleration (PGA) of 0.05 g to 1 g with 0.05 g increments (g is gravity acceleration). Figure 6 illustrates the piloti building design spectrum and the response spectra of the input ground motions. The calculated response spectra were compared with the design spectrum of the building based on the Korean Building Code. To evaluate the retrofitted building’s seismic response in terms of hysteretic curves, stiffness degradation, interstory drift ratio, and so forth, the results from only one input ground motion are presented. Results obtained from a total of 280 ground motions were used to develop the fragility curves, which is the main scope of this research.
Table 3.
Earthquakes in the records set.
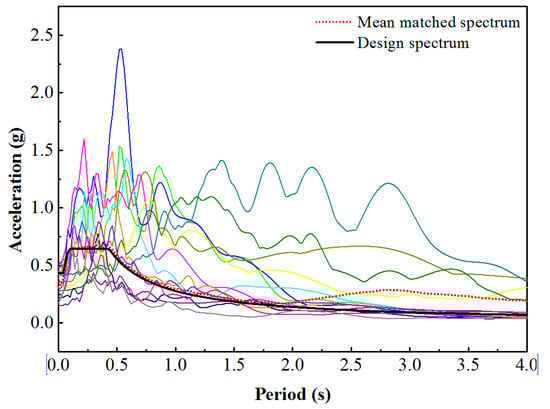
Figure 6.
Design spectrum and response spectra.
2. Seismic Evaluations
In order to investigate the impact of the proposed retrofitting methods using additional shear walls on the first floor of the original piloti building, a NTHA was conducted using one earthquake excitation from the suite of input ground motions (the first one from Table 3). Only the responses from the weak direction (Y-direction) of the structure are presented, since the damage was more severe in the Y-direction than its counterpart. In this study, NTHA was carried out using input ground motion applied in one direction only. In fact, the torsional effects caused by additional shear walls should be considered under the condition of bidirectional input ground motions. More details on such effects under the same piloti building model can be found in [45]. Subsequently, the seismic responses of the columns are presented and discussed in terms of hysteretic curves, stiffness degradation, and interstory first ratio.
2.1. Hysteretic Curves
Figure 7 shows a comparison of the hysteretic shear force–drift ratio responses of columns C1 and C6 in the original building with respect to the four retrofitting strategies. Columns C1 and C6 are the most vulnerable columns in the entire building, therefore, improving their seismic response was considered to be the main task of this research.
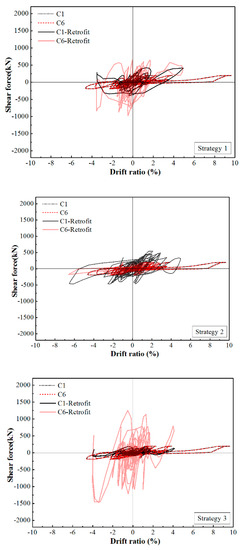
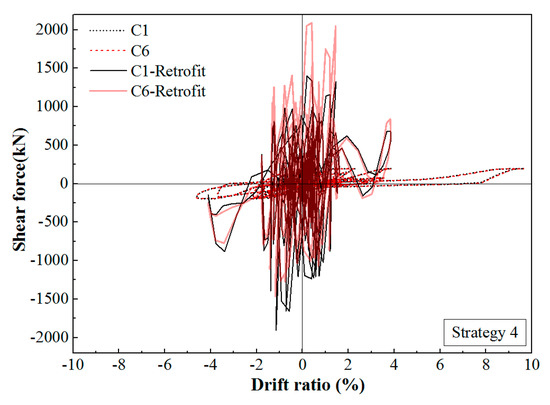
Figure 7.
Hysteretic curves of columns C1 and C6 before and after retrofit.
In general, the response indicated that the columns had a significant decrease in drift demand and an increase in maximum shear force. Based on the results obtained from the nonlinear static pushover analysis, there was agreement about the impact intensity of each retrofit method. In descending order, Plan 4 exhibited the most improved response, followed by Plans 1 and 3, while Plan 2 showed the least improvement among the four cases. Drift demand in the columns of the original building was degraded by 57% (from a drift of 9.6% to 4.1%) in Plans 3 and 4, by 48% (from a drift of 9.6% to 5%) in Plan 1, and by only 32% (from a drift of 9.6% to 6.5%) in Plan 2. This can be interpreted to mean that in Plan 2, the shear walls’ resistant orientation aligned with the strong direction (X-direction) of the building, therefore, the effect was less pronounced than in other retrofitting cases.
Like Plan 2, Plan 3 also designated shear walls oriented in the X-direction. However, the shear walls in Plan 3 were connected to the core walls, which resulted in a superior seismic response in the columns compared to Plan 2. In terms of maximum shear force, only Plans 1 and 4 exhibited an increase in maximum shear force, which was observed in both columns C1 and C6. Meanwhile, Plan 2 only increased the maximum shear force of column C1, while column C6 showed no improvement. The reverse case was true in Plan 3.
2.2. Stiffness Degradation
Figure 8 and Figure 9 depict the degradation in stiffness of columns C1 and C6, respectively. The variation in stiffness during the time-history analysis is complicated. Hence, degraded column stiffness is presented using transparent power function trendlines. In general, for both columns C1 and C6, a rapid degradation in initial stiffness was observed in both negative and positive directions. The most pronounced effect can be seen in Plan 4, where initial stiffness was increased. The intensity of influence decreased in the order of Plan 2 and Plan 1. In addition, no significant effect was found for Plan 3, where the stiffness degradation was similar to that of the original columns. As the drift ratio increased, the influence intensity decreased.
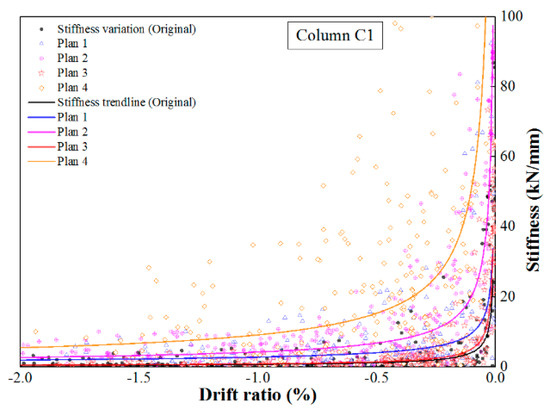
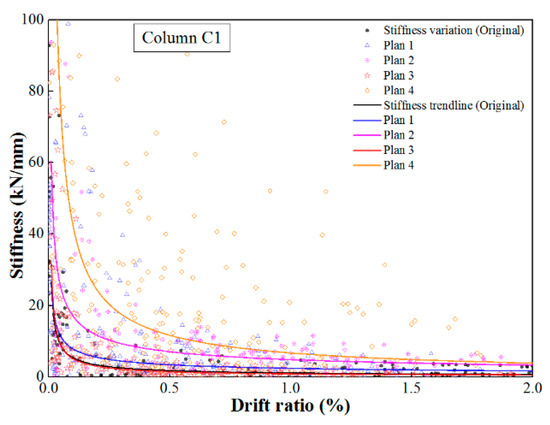
Figure 8.
Comparison of stiffness degradation in column C1.
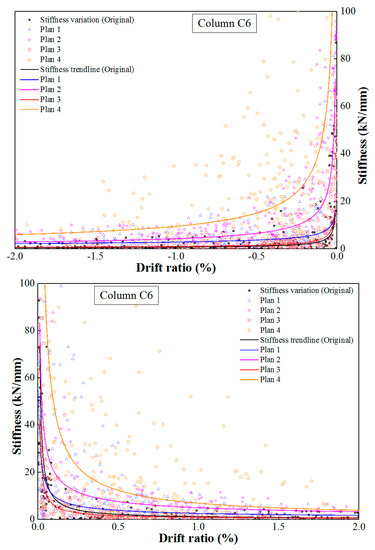
Figure 9.
Comparison of stiffness degradation in column C6.
2.3. Interstory Drift Ratio
Figure 10a illustrates the drift time-history response of column C1 in the weak direction of the building, while Figure 10b presents the maximum interstory drift ratio. The results from the previous section indicate that the drift ratio demand on the first floor significantly decreased, by 57%, for Plans 3 and 4, and by 48% and 32% in Plans 1 and 2, respectively. The beneficial effect diminished in the order of Plan 4, 3, 1, and 2. However, in the upper stories, Plan 1 exhibited a great increase in drift ratio of 50% and exceeded that of Plan 2 at roof level. Meanwhile, similar responses can be observed for Plans 3 and 4.
Figure 10.
(a) Drift time history; (b) interstory drift ratio. Drift time history and maximum interstory drift ratio.
3. Fragility Assessment of Retrofitting Building
Fragility curves, which represent the probability of meeting or exceeding certain different levels of damage conditions for a given intensity measure (IM), are used to predict the potential damage of structures subjected to earthquake ground motion. The conditional probability of failure is calculated using a cumulative lognormal distribution. The calculation of fragility curve needs a realistic prediction of structure behavior under seismic events, and considers the quantification and the propagation of uncertainties of seismic excitation and structural material properties. The uncertainties consist of aleatory and epistemic uncertainties. While aleatory uncertainties describe the inherent randomness of variables or stochastic processes, epistemic uncertainties are related to the lack of information in the model and provide a family of confidence interval curves for the fragility prediction.
In this study, incremental dynamic analysis was adopted to develop the fragility curve for the columns of the piloti-type building. The basic procedure used to develop fragility curves for a structure consists of the following steps: selection of a suite of n ground motions, each of which will be scaled m times; generation of demand models using the results obtained from the nonlinear time history analysis; determination of damage limit states models; and derivation of column fragility curves.
3.1. Derivation of Fragility Curves
Fragility assessment using the nonlinear dynamic analysis method generally requires a numerical building model capable of representing the structure during THAs for a certain range of earthquake excitations (or the so-called intensity measure, IM). Damage limit states are assumed for components. The seismic behavior of each component is evaluated by quantities called engineering demand parameters (EDP). An EDP is the seismic behavior of a specific component of interest which indicates structural damage. Reflecting the seismic hazards in the region, an appropriate suite of earthquake excitations was chosen for the numerical model to represent possible expected seismic events. Generally, structural responses such as displacement, drift ratio, ductility capacity, and so forth, in the form of multiple EDPs, can be plotted against the relative earthquake intensity measure IM that causes such responses. The relationship between the EDP and IM is called a probabilistic seismic demand model (PSDM). The PSDM illustrates the demand imposed on a particular component at a certain IM as defined by the regression of the individual seismic behavior of the EDP. PSDM can be directly compared to predefined limit states, which associate the probability of structural damage to levels of structure response in terms of the EDP. The fragility curve, which shows the probability of meeting or exceeding a certain damage limit state, can be generated by comparing the demand model and capacity model.
Following the procedure to develop the fragility curve, this study selected a suite of 14 ground motions, each of which was scaled from 0.05 g to 1 g at increments of 0.05 g (g is gravity acceleration). Altogether, a total of 280 ground motions were adopted to perform the NTHAs for the piloti-type building model. Here, column maximum interstory drift was chosen to be the engineering demand parameter (EDP). EDPs were used to create a demand model that defined a linear regression model of EDP-IM in the logarithmic space, as in Equation (1).
where SEDP: median value of the EDP conditioned on the IM, a and b: regression coefficients.
The dispersion of the demand model (the so-called logarithmic standard deviation) in the regression analysis is defined as follows:
where edpi is the demand for the ith ground motion and N is the number of simulations.
The fragility function can be computed using the closed form:
where the median SC and dispersion βC are a two-parameter lognormal distribution by assuming the limit state model (Capacity, C). Generally, the four states of damage level are: slight, moderate, extensive, and complete damage state. Table 4 presents the assumption for each damage limit state.
Table 4.
Structural performance levels in the fragility analysis.
3.2. Column Fragility Curves
Figure 11 illustrates the fragility curves of all the columns in the original piloti building. In all of the limit states cases, columns C1 and C6 were the most vulnerable among all building columns due to the superior probability. This was in good agreement with the site damage evidence collected after the Pohang earthquake. It is worth mentioning that column C5, another corner column in the building besides C1 and C6, was predicted with higher probability to exceed the damage limit, compared with the others.
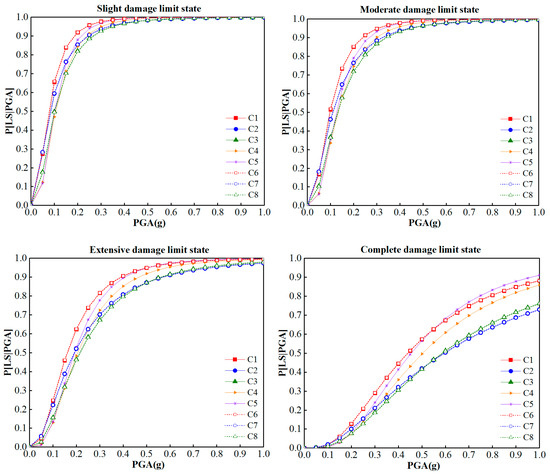
Figure 11.
Fragility curves of the original building’s columns.
In order to evaluate the beneficial effect from each retrofitting strategy, the fragility curves of column C1 are depicted in Figure 12. In all cases of limit states, Plan 4 clearly reduced the probability of exceeding the damage threshold with respect to the original fragility curves. The influence intensity decreased in the order of Plan 1, 3, and 2. The results indicated that Plans 4 and 2 were the most and least effective retrofitting strategies, respectively, among the proposed plans. Plans 1 and 3 exhibited a similar improvement in vulnerability, while Plan 3 probability slightly exceeded that of Plan 1. As the probability decreased, the median value of the fragility curve, which is defined as the PGA associated with a 50% probability of exceeding the damage state (median PGA), increased.
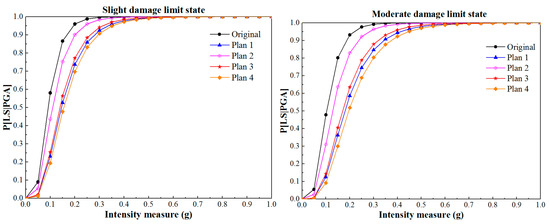
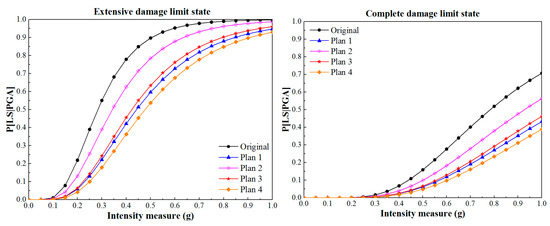
Figure 12.
Comparison of fragility curves for the retrofitting strategies.
In detail, for Plan 4, the median PGA increased from 0.1 g to 0.2 g (100%) in the Moderate state and from 0.28 g to 0.47 g (68%) in the Extensive state. For Plans 1 and 3, the median PGA increased 60% and 50%, respectively, while Plan 2 only increased by 25%, as was observed in both the Moderate and Extensive limit states. It is worth noting that a similar trend in fragility curves was exhibited by column C6.
It was assumed that the probabilities of the responses of columns C1 and C6 exceeding the damage threshold were independent, joint distribution and cumulative probabilities, which reflect the likelihood that such events occur at the same time, and are calculated and presented in Figure 13, Figure 14, Figure 15, Figure 16 and Figure 17.
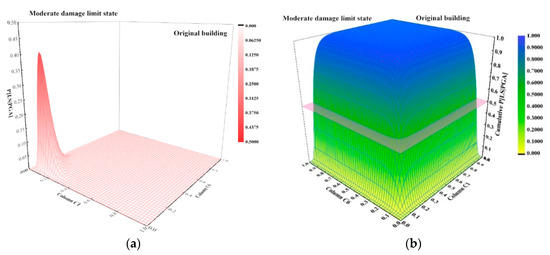
Figure 13.
Original building joint density probability of columns C1 and C6. (a) Distribution probability; (b) cumulative probability.
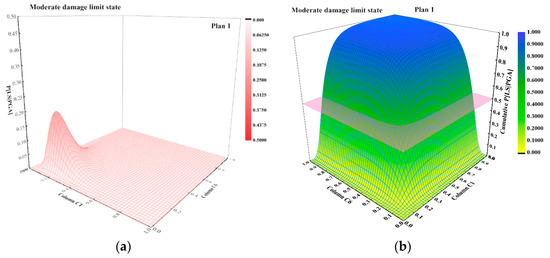
Figure 14.
Plan 1 joint density probability of columns C1 and C6. (a) Distribution probability; (b) cumulative probability.
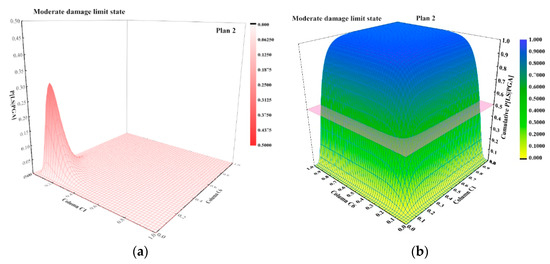
Figure 15.
Plan 2 joint density probability of columns C1 and C6. (a) Distribution probability; (b) cumulative probability.
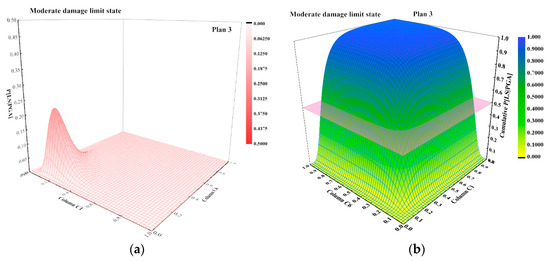
Figure 16.
Plan 3 joint density probability of columns C1 and C6. (a) Distribution probability; (b) cumulative probability.

Figure 17.
Plan 4 joint density probability of columns C1 and C6. (a) Distribution probability; (b) cumulative probability.
Figure 13 illustrates the joint probabilities of the event when columns C1 and C6 in the original building both exceeded the Moderate limit state. Those of the retrofit Plans 1–4 are presented in Figure 14, Figure 15, Figure 16 and Figure 17, respectively. The relationship between Figure 13a,b is that the cumulative probability (see Figure 13b) at a given IM (IM is identical for both C1 and C6) is determined by the volume created by the surface over the relative IM region (see Figure 13a). In general, observing the surfaces (see Figure 13a, Figure 14a, Figure 15a, Figure 16a, Figure 17a), it indicates the narrow ridge shape associated with a more vulnerable response since the maximum probability was reached within a narrow range of IM (in columns C1 and C6). The plane where the cumulative probability reached a value of 50% was used to determine the median PGA. In the original building, the median PGA was 0.14 g, and it increased by 71% to 0.24 g, 0.17 g (21%), 0.22 g (57%), and 0.26 g (85%) for retrofit Plans 1, 2, 3, and 4, respectively.
4. Conclusions
This research attempted to evaluate the seismic fragility of columns in a piloti building retrofitted with additional shear walls on the first floor using several strategies. Additional shear walls are expected to increase column stiffness and decrease maximum demand deformation. However, the existence of a corner core wall and inherent irregularities in the piloti building can cause torsional effects, resulting in severe damage to the corner columns.
Four specific retrofitting strategies to improve the seismic response of such columns and the entire building were proposed and evaluated, based on engineering intuition and site damage evidence obtained after the earthquake event. On the basis of this study, the following conclusions can be drawn.
Among the proposed retrofitting plans, Plan 4 had the most effective impact, improving the seismic response of columns C1 and C6, while Plan 2 exhibited the least beneficial effect. The influence intensity decreased in the order of Plan 4, 1, 3, and 2. In the Moderate limit state, the median PGA of columns C1 and C6 (0.1 g in original building) increased by 100%, 60%, 60%, and 25% in the retrofitted plans, respectively. Furthermore, application of Plan 4 as a retrofitting strategy is practical and can be considered prior to others for buildings that share similar design since the piloti-type buildings are very common in urban cities.
- (1)
- The joint probabilities of an event when both columns C1 and C6 would exceed the Moderate limit state were calculated and presented. A similar trend in the influence of the retrofitting strategies was observed. The mean PGA of such an event, which indicates a probability of 50% that both columns C1 and C6 would exceed the damage threshold, increased from 0.14 g (the original building) by 85%, 71%, 57%, and 21% for Plans 4, 1, 3, and 2, respectively.
- (2)
- The results also indicated that changes in the building’s eccentricity were associated with the influence intensity of each retrofit plan. In this study, retrofit Plan 4 resulted in a significant decrease in both X and Y eccentricity compared to the original building, and resulted in a significant improvement of the columns’ seismic response and fragilities. This was consistent with the common engineering principle of reducing structural eccentricities to mitigate torsional effect. However, due to the complex eccentricity changes in both directions, a fragility assessment was required to accurately evaluate a certain retrofitting strategy.
Author Contributions
Conceptualization, K.L.; Supervision, J.S. and K.L.; Writing―original draft preparation, H.D.-V. All authors have read and agreed to the published version of the manuscript.
Funding
This research was supported by Basic Science Research Program through the National Research Foundation of Korea (NRF) funded by the Ministry of Education (2020R1A2C2007195).
Conflicts of Interest
The authors declare no conflict of interest.
References
- Hueste, M.B.D.; Bai, J.W. Seismic retrofit of a reinforced concrete flat-slab structure: Part I—Seismic performance evaluation. Eng. Struct. 2007, 29, 1165–1177. [Google Scholar] [CrossRef]
- Hueste, M.B.D.; Bai, J.W. Seismic retrofit of a reinforced concrete flat-slab structure: Part II—Seismic fragility analysis. Eng. Struct. 2007, 29, 1178–1188. [Google Scholar] [CrossRef]
- Memari, A.; Motlagh, A.; Scanlon, A. Seismic evaluation of an existing reinforced concrete framed tube building based on inelastic dynamic analysis. Eng. Struct. 2000, 22, 621–637. [Google Scholar] [CrossRef]
- Bento, R.; Lopes, M.; Cardoso, R. Seismic evaluation of old masonry buildings. Part II: Analysis of strengthening solutions for a case study. Eng. Struct. 2005, 27, 2014–2023. [Google Scholar] [CrossRef]
- Kalkan, E.; Kunnath, S.K. Assessment of current nonlinear static procedures for seismic evaluation of buildings. Eng. Struct. 2007, 29, 305–316. [Google Scholar] [CrossRef]
- Kim, N.; Hong, S.G.; Chang, S.P. Computer-supported evaluation for seismic performance of existing buildings. Adv. Eng. Softw. 2003, 34, 87–101. [Google Scholar] [CrossRef]
- Bardakis, V.; Dritsos, S.E. Evaluating assumptions for seismic assessment of existing buildings. Soil Dyn. Earthq. Eng. 2007, 27, 223–233. [Google Scholar] [CrossRef]
- Lignos, D.G.; Chung, Y.; Nagae, T.; Nakashima, M. Numerical and experimental evaluation of seismic capacity of high-rise steel buildings subjected to long duration earthquakes. Comput. Struct. 2011, 89, 959–967. [Google Scholar] [CrossRef]
- Masi, A.; Vona, M. Vulnerability assessment of gravity-load designed RC buildings: Evaluation of seismic capacity through non-linear dynamic analyses. Eng. Struct. 2012, 45, 257–269. [Google Scholar] [CrossRef]
- Mehanny, S.; El Howary, H. Assessment of RC moment frame buildings in moderate seismic zones: Evaluation of Egyptian seismic code implications and system configuration effects. Eng. Struct. 2010, 32, 2394–2406. [Google Scholar] [CrossRef]
- Lagaros, N.D.; Fragiadakis, M.; Papadrakakis, M.; Tsompanakis, Y. Structural optimization: A tool for evaluating seismic design procedures. Eng. Struct. 2006, 28, 1623–1633. [Google Scholar] [CrossRef]
- Choudhury, T.; Kaushik, H.B. Seismic fragility of open ground storey RC frames with wall openings for vulnerability assessment. Eng. Struct. 2018, 155, 345–357. [Google Scholar] [CrossRef]
- Syed, S.; Gupta, A. Seismic fragility of RC shear walls in nuclear power plant part 2: Influence of uncertainty in material parameters on fragility of concrete shear walls. Nucl. Eng. Des. 2015, 295, 587–596. [Google Scholar] [CrossRef]
- Poiani, M.; Gazzani, V.; Clementi, F.; Lenci, S. Aftershock fragility assessment of Italian cast–in–place RC industrial structures with precast vaults. J. Build. Eng. 2020, 29, 101206. [Google Scholar] [CrossRef]
- Nazari, Y.R.; Saatcioglu, M. Seismic vulnerability assessment of concrete shear wall buildings through fragility analysis. J. Build. Eng. 2017, 12, 202–209. [Google Scholar] [CrossRef]
- Jiang, L.; Jiang, L.; Hu, Y.; Ye, J.; Zheng, H. Seismic life-cycle cost assessment of steel frames equipped with steel panel walls. Eng. Struct. 2020, 211, 110399. [Google Scholar] [CrossRef]
- Chieffo, N.; Clementi, F.; Formisano, A.; Lenci, S. Comparative fragility methods for seismic assessment of masonry buildings located in Muccia (Italy). J. Build. Eng. 2019, 25, 100813. [Google Scholar] [CrossRef]
- Pan, Y.; Ventura, C.E.; Tannert, T. Damage index fragility assessment of low-rise light-frame wood buildings under long duration subduction earthquakes. Struct. Saf. 2020, 84, 101940. [Google Scholar] [CrossRef]
- Hosseinzadeh, S.; Galal, K. System-level seismic resilience assessment of reinforced masonry shear wall buildings with masonry boundary elements. Structures 2020, 26, 686–702. [Google Scholar] [CrossRef]
- Xiong, C.; Lu, X.; Lin, X. Damage assessment of shear wall components for RC frame–shear wall buildings using story curvature as engineering demand parameter. Eng. Struct. 2019, 189, 77–88. [Google Scholar] [CrossRef]
- Al-Gemeel, A.N.; Zhuge, Y. Using textile reinforced engineered cementitious composite for concrete columns confinement. Compos. Struct. 2019, 210, 695–706. [Google Scholar] [CrossRef]
- Ghatte, H.F. External steel ties and CFRP jacketing effects on seismic performance and failure mechanisms of substandard rectangular RC columns. Compos. Struct. 2020, 248, 112542. [Google Scholar] [CrossRef]
- Chrysanidis, T.; Tegos, I.A. Axial and transverse strengthening of R/C circular columns: Conventional and new type of steel and hybrid jackets using high-strength mortar. J. Build. Eng. 2020, 30, 101236. [Google Scholar] [CrossRef]
- Vafaei, M.; Sheikh, A.M.O.; Alih, S.C. Experimental study on the efficiency of tapered strip dampers for the seismic retrofitting of damaged non-ductile RC frames. Eng. Struct. 2019, 199, 109601. [Google Scholar] [CrossRef]
- Xie, L.; Zhang, L.; Pan, C.; Zhang, R.; Chen, T. Uniform damping ratio-based design method for seismic retrofitting of elastoplastic RC structures using viscoelastic dampers. Soil Dyn. Earthq. Eng. 2020, 128, 105866. [Google Scholar] [CrossRef]
- Puthanpurayil, A.M.; LaVan, O.; Dhakal, R.P. Multi-objective loss-based optimization of viscous dampers for seismic retrofitting of irregular structures. Soil Dyn. Earthq. Eng. 2020, 129, 105765. [Google Scholar] [CrossRef]
- Javadi, P.; Tizchang, A.; GhafourianHesami, A.; Askari, M. A friction-based connection for retrofitting RC frames by steel braced frames. Structures 2020, 24, 627–639. [Google Scholar] [CrossRef]
- Rahimi, A.; Maheri, M.R. The effects of steel X-brace retrofitting of RC frames on the seismic performance of frames and their elements. Eng. Struct. 2020, 206, 110149. [Google Scholar] [CrossRef]
- Honarparast, S.; Chaallal, O. Non-linear time history analysis of reinforced concrete coupled shear walls: Comparison of old design, modern design and retrofitted with externally bonded CFRP composites. Eng. Struct. 2019, 185, 353–365. [Google Scholar] [CrossRef]
- Kim, Y.; Lim, S.A.; Park, H.S. Optimal seismic retrofit method for reinforced concrete columns with wing walls. Eng. Struct. 2020, 210, 110390. [Google Scholar] [CrossRef]
- De Stefano, M.; Pintucchi, B.L. A review of research on seismic behaviour of irregular building structures since 2002. Bull. Earthq. Eng. 2007, 6, 285–308. [Google Scholar] [CrossRef]
- Ferraioli, M. Case study of seismic performance assessment of irregular RC buildings: Hospital structure of Avezzano (L’Aquila, Italy). Earthq. Eng. Eng. Vib. 2015, 14, 141–156. [Google Scholar] [CrossRef]
- Kreslin, M.; Fajfar, P. Seismic evaluation of an existing complex RC building. Bull. Earthq. Eng. 2009, 8, 363–385. [Google Scholar] [CrossRef]
- Software MAE Center. Available online: http://mae.cee.illinois.edu/software/software_zeusnl.html (accessed on 4 April 2018).
- Nguyen, K.T.; Nguyen, Q.D.; Le, T.A.; Shin, J.; Lee, K. Analyzing the compressive strength of green fly ash based geopolymer concrete using experiment and machine learning approaches. Constr. Build. Mater. 2020, 247, 118581. [Google Scholar] [CrossRef]
- Luat, N.V.; Shin, J.; Lee, K. Hybrid BART-based models optimized by nature-inspired metaheuristics to predict ultimate axial capacity of CCFST columns. Eng. Comput. 2020. [Google Scholar] [CrossRef]
- Luat, N.V.; Nguyen, V.Q.; Lee, S.; Woo, S.; Lee, K. An evolutionary hybrid optimization of MARS model in predicting settlement of shallow foundations on sandy soils. Geomech. Eng. 2020, 21, 583–598. [Google Scholar] [CrossRef]
- Luat, N.V.; Lee, J.; Lee, D.H.; Lee, K. GS-MARS method for predicting the ultimate load-carrying capacity of rectangular CFST columns under eccentric loading. Comput. Concr. 2020, 25, 1–14. [Google Scholar] [CrossRef]
- Kabeyasawa, T.; Shiohara, H.; Otani, S.; Aoyama, H. Analysis of the full-scale seven story reinforced concrete test structure. J. Fac. Eng. Univ. Tokyo 1983, 37, 431–478. [Google Scholar]
- Charney, F.A. Correlation of the analytical and experimental inelastic response of a 1/5-scale seven-story reinforced concrete frame-wall structure. Spec. Publ. 1991, 127, 261–362. [Google Scholar] [CrossRef]
- Smith, B.S.; Girgis, A. Simple analogous frames for shear wall analysis. J. Struct. Eng. 1984, 110, 2655–2666. [Google Scholar] [CrossRef]
- Madas, P.; Elnashai, A.S. A new passive confinement model for the analysis of concrete structures subjected to cyclic and transient dynamic loading. Earthq. Eng. Struct. Dyn. 1992, 21, 409–431. [Google Scholar] [CrossRef]
- Martínez-Rueda, J.E.; Elnashai, A.S. Confined concrete model under cyclic load. Mater. Struct. 1997, 30, 139–147. [Google Scholar] [CrossRef]
- Dang, H.V.; Lee, K.; Han, S.W.; Kim, S.J. Experimental assessment of the effects of biaxial bending moment and axial force on reinforced concrete corner columns. Struct. Concr. 2018, 19, 1063–1078. [Google Scholar] [CrossRef]
- Dang-Vu, H.; Lee, D.H.; Shin, J.; Lee, K. Influence of shear-axial force interaction on the seismic performance of a piloti building subjected to the 2017 earthquake in Pohang Korea. Struct. Concr. 2019, 21, 220–234. [Google Scholar] [CrossRef]
- Colajanni, P.; Cacciola, P.; Potenzone, B.; Spinella, N.; Testa, G. Non linear and linearized combination coefficients for modal pushover analysis. Ing. Sismica 2017, 93–112. [Google Scholar]
- Ferraioli, M.; Lavino, A.; Mandara, A. An adaptive capacity spectrum method for estimating seismic response of steel moment-resisting frames. Ing. Sismica 2016, 33, 47–60. [Google Scholar]
- Ferraioli, M. Multi-mode pushover procedure for deformation demand estimates of steel moment-resisting frames. Int. J. Steel Struct. 2017, 17, 653–676. [Google Scholar] [CrossRef]
- Kreslin, M.; Fajfar, P. The extended N2 method considering higher mode effects in both plan and elevation. Bull. Earthq. Eng. 2011, 10, 695–715. [Google Scholar] [CrossRef]
- ASCE. FEMA 356 Prestandard and Commentary for the Seismic Rehabilitation of Buildings; ASCE: Washington, DC, USA, 2000; p. 519. [Google Scholar]


© 2020 by the authors. Licensee MDPI, Basel, Switzerland. This article is an open access article distributed under the terms and conditions of the Creative Commons Attribution (CC BY) license (http://creativecommons.org/licenses/by/4.0/).