Article

A Framework for Assessing Green Capacity Utilization Considering CO2 Emissions in China’s High-Tech Manufacturing Industry

1
Institutes of Science and Development, Chinese Academy of Sciences, Beijing 100190, China
2
School of Public Policy and Management, University of Chinese Academy of Sciences, Beijing 100049, China
3
School of Economics & Management, Beihang University, Beijing 100191, China
*
Author to whom correspondence should be addressed.
Sustainability 2020, 12(11), 4424; https://doi.org/10.3390/su12114424
Submission received: 29 April 2020 / Revised: 20 May 2020 / Accepted: 26 May 2020 / Published: 29 May 2020

Abstract

:
China’s high-tech manufacturing industry has become the mainstay of the country’s domestic industrial transformation and upgrading. However, in recent years, the industry has experienced huge blind expansion under policy stimulus, which is not good for long-term industrial development. Therefore, this article attempts to explore the extent to which such an important and critical industry in China utilizes its production capacity and provides a basis for future policymaking. Coupled with the country’s increasing emphasis on the green and low-carbon development of the industry, this article extends the green and low-carbon thinking based on capacity utilization, namely green capacity utilization (CU). On this basis, the study empirically investigates the green CU of the high-tech manufacturing industry in 28 provinces in mainland China from 2010 to 2015. In performing the investigation, the inputs were divided into (quasi-)fixed and variable inputs, and an assessment framework was established based on the data envelopment analysis (DEA) method. Moreover, optimal variable inputs are also available as by-products within the assessment framework. The results were as follows: First, China’s high-tech manufacturing industry showed an excellent overall performance in green CU. Moreover, half of the provinces were at fully utilized capacity, and half were under-utilized. On average, there was a slight deterioration in green CU. Second, the results showed regional differences. The western region had the highest green CU followed by the middle and northeastern regions, and the eastern region had the lowest green CU. Third, regarding the optimal variables inputs, the total amount of labor in China’s high-tech manufacturing industry met the demand, but the distribution was uneven. Fourth, the scale of traditional energy consumption needs to be reduced both in individual provinces and in general. These conclusions have implications for the formulation of policies to promote the green development of China’s high-tech manufacturing industry.

1. Introduction

As one of the most important industries in the knowledge economy, the high-tech manufacturing industry has gradually become a main economic growth point in China [1]. Because of high technical strength, added value, fast updates, effective savings of resources and energy, and the strong correlation with related industries, the rapid development of the high-tech manufacturing industry has had a significant effect on the adjustment, optimization, and upgrading of the industrial structure, as well as the transformation of the mode of economic development [2]. The high-tech manufacturing industry is so important that from the central government to the local government, various policies have been introduced to support and promote its development.
However, the construction of the high-tech manufacturing industry is actually in a blind expansion to a certain extent, which results in plenty of repeated construction and considerable wastes of the resource. For instance, 146 national high-tech industrial development zones have been distributed in large and medium-sized cities in Eastern, Central, and Western China [3]. After sorting out the “Twelfth Five-Year Plan” for more than 30 provinces and cities across mainland China, 28 provinces have focused on developing new energy industries, 30 provinces have focused on developing new materials and biomedicine, and more than 20 provinces have focused on developing information technology and modern equipment manufacturing. Such a large-scale blind expansion makes us consider whether the production capacity of China’s high-tech manufacturing is fully utilized, which is crucial information for policymakers.
Moreover, high technology does not mean clean technology. In the context of a low-carbon economy, considering the policy guidelines of climate change and energy transition, each industry needs to take into account the factors of green development in their planning and layout. The Ministry of Industry and Information Technology of China issued the “Industrial Green Development Plan (2016–2020)” in July 2016, which proposed to actively promote the green development of emerging industries in order to accelerate the overall industrial green development. This policy significantly emphasizes the green development orientation of the high-tech manufacturing industry. It requires maintaining a reasonable development scale and speed, optimizing the structure, and paying more attention to quality and efficiency on the premise of saving resources and protecting the environment. At the same time, this policy also emphasizes the low-carbon characteristics of socio-economic development, which requires the transformation of energy use to reduce greenhouse gas emissions. Therefore, when evaluating the capacity utilization of the high-tech manufacturing industry, it is necessary to consider environmental factors, such as carbon emissions, to achieve the sustainable development of this promising industry. In this context, the study attempts to assess the capacity utilization (CU) of the high-tech manufacturing industry considering environmental factors, which is defined as green CU in this article.
CU is defined as the ratio of actual output to capacity output [4]. Johansen [5] defined capacity output as the maximum potential output that can be produced with the existing installed (quasi-)fixed input. Therefore, green CU is assessed based on the difference between the actual output and the capacity output of the installed capacity in considering the undesirable output of a green production process. In particular, in the context of a low-carbon economy, the measurement of capacity output should consider the undesirable output of the industry, such as CO2 emissions. Green CU is a key economic indicator for industrial performance in the low-carbon economy.
China’s officially announced CU is not continued in time, and there is especially a lack of measurement research on sub-sectors and sub-regions. More than 50 countries have published CU monitoring data [6]. The United States Federal Reserve established a complete official CU measurement system about 50 years ago [7], which covers various industries and sectors of the national economy and releases the latest data on CU of macro and sub-sectors monthly. In 2013, the State Council of China announced CU in six industries: coal, steel, flat glass, aluminum electrolysis, and shipbuilding. This is the first official use of the CU indicator. However, China’s statistical department has not proposed a continuous and effective official CU monitoring system, so it has not been able to regularly supply specific industrial CU data like the United States.
Although there has been fruitful research on CU from the macro and micro perspectives, they mostly focus on the entire region [8,9], the whole manufacturing industry [10,11], and some individual industries [12,13,14], with no concern about CU in the high-tech manufacturing industry. The performance assessment of the high-tech manufacturing industry is mostly focused on the innovation efficiency or productivity [2,15,16,17,18,19,20,21,22,23]. To our knowledge, there are few studies have focused on the CU performance of the high-tech manufacturing industry without mentioning its different types in detail. In addition, due to data limitations on the undesirable output of the regional high-tech manufacturing industry, there is also a lack of attention paid to green CU, which is very significant for enhancing the competitiveness of enterprises and industries in a low-carbon economy.
Therefore, it is necessary to construct a framework for CU assessment that fully considers environmental effects and that can monitor the green CU of the high-tech manufacturing industry. For this purpose, we attempt to (1) propose an assessment framework for measuring the green CU of China’s high-tech manufacturing industry in 28 provinces in mainland China from 2010 to 2015 based on data envelopment analysis (DEA) and the directional distance functions (DDFs) using the joint weak disposability (JWD) assumption, which provide a benchmark for monitoring the industrial green development, and (2) measure the CO2 emissions of China’s high-tech manufacturing industry at the provincial level based on the China Emission Accounts and Datasets and incorporate CO2 emissions into the assessment framework for green CU.
This study makes two main contributions to the literature. First, we establish a general measurement framework to investigate CU performance and empirically apply it to China’s high-tech manufacturing industry at the level of industry-region. This framework can be used to assess the development of the high-tech manufacturing industry from the temporal and spatial dimensions. Second, we further integrate the undesirable output into the CU assessment framework of the high-tech manufacturing industry to form a green CU evaluation system, which addresses the issue of assessing CU performance in a low-carbon context at the regional level in this industry. The results of the present study are conducive to further research on environmental and sustainable development issues. In addition, this approach can be applied to a wide variety of evaluated objects. Monitoring the situation of green CU at different levels is useful to the government’s macro policy formulation in the low carbon economy.
The remainder of this paper includes the following sections. Section 2 reviews the existing studies on CU and its measurement, and the performance assessment of the high-tech manufacturing industry. Section 3 constructs the model and implications of the green CU indicator. Section 4 presents the data sources and variables. Section 5 discusses three aspects of the empirical results. Finally, Section 6 summarizes the main findings, provides policy suggestions, and concludes the paper.

2. Literature Review

2.1. Performance Assessment of the High-Tech Manufacturing Industry

The performance assessment of the high-tech manufacturing industry is widely studied in the previous literature. These studies mainly studied the innovation efficiency or productivity of the high-tech manufacturing industry from the industry, regional-industrial park, and firm level. From the industrial level, Zhang et al. [2] divided the whole innovation process into the research and development (R&D) stage and the commercialization stage, and provided a DEA framework to assess the innovation efficiency of China’s high-tech manufacturing industries from 2009 to 2013. Guan and Chen [17] proposed an innovation measurement framework using network DEA from a systemic perspective based on the innovation production process, empirically studying the innovation efficiency of China’s high-tech manufacturing industry. Furthermore, Zhang and Chen [22] developed a two-stage network DEA to calculate the system efficiency, division efficiency, and component efficiency of the high-tech manufacturing industry in mainland China from 2002 to 2015 from a hierarchical network system perspective. Moreover, Chen et al. [16] built a two-stage DEA assessment framework with shared resources to go into the innovation process in detail and gave some useful policy suggestions on how to improve the performance of the regional innovation system. Wang et al. [23] empirically assessed and decomposed the technological innovation efficiency of China’s high-tech manufacturing industry. Besides, Li et al. [19] combined the dynamic DEA and truncated regression model to evaluate the regional efficiency of the high-tech manufacturing industries in mainland China.
At the regional-industrial park level, applying the DEA evaluation approach to examine the development performance of the six high-tech manufacturing industries at Taiwan’s Hsinchu Science Park, Chen et al. [15] provided some policy implications. At the firm level, Wang et al. [21] established an R&D value chain framework with the DEA method to analyze the R&D efficiency and to explore the relationship between R&D, productivity, and market value. Tseng et al. [20] combined a DEA, an analytic hierarchy process, and a fuzzy multi-criteria decision-making approach and evaluated the business performance of large-sized thin-film-transistor liquid-crystal display panel companies in Taiwan.
To summarize, there has been a considerable amount of literature on the performance of China’s high-tech manufacturing industry in terms of innovation efficiency or productivity. These studies have provided us with significant analytic factors for establishing an assessment framework for the high-tech manufacturing industry. However, on the contrary, there is a lack of research on CU performance for this industry.

2.2. Capacity Utilization and Its Measurement

CU is defined as the ratio of actual outputs to potential outputs, which is a performance indicator that has attracted much attention and is widely used in the research of resource utilization, resource allocation, constraint management, and scale efficiency [9]. Potential outputs, also known as capacity outputs, can be calculated by using two mainstream approaches in the literature—the economic approach and the physical approach [4,24]. The most striking difference between these two approaches is that the former is grounded in cost, revenue, or profit functions to obtain potential outputs while the latter is based only on the number of inputs and outputs resources in the physical sense.
According to the different approaches used to measure capacity output, CU can be classified into two groups. One is the economic approach, which includes value-based functions. There are three definitions of financial capacity output [4]. The first definition is the output at the tangent point of the long-term average cost curve and the short-term cost curve. The economic approach involved the cost considerations and different economy sectors’ limitations and used a probit total cost function to define the capacity output [25]. Further, Segerson [26] was devoted to expanding alternative definitions of economic CU and applied them to the multi-product firm. The second definition refers to the output when the short-term cost curve reaches a minimum. Berndt and Morrison [27] purported that the capacity output and CU are inherently short-run concepts depending on the company’s quasi-fixed input stock. Cassels [28] also defined capacity output according to the lowest point of the average short-run cost curve. The third definition is the cost gap when the actual output is different from the capacity output. Morrison [27] established a cost-based function to measure the CU of the American auto industry. There are also a lot of application-oriented articles here. Sahoo and Tone [4] developed CU based on the value-based cost function and extended an application to banks in India. Lindebo et al. [29] defined economic capacity output based on revenue function and examined the CU of fisheries. Further, Ray [8] used an economic approach to define the capacity output and compared the CU of US manufacturing in 48 states.
The other is the physical approach: quantity-based distance functions. Johansen [5] first proposed that capacity output is the maximum potential output that can be produced with the existing installed (quasi-)fixed inputs. Fare et al. [30] followed the capacity output definition and proposed the CU indicator under the DEA framework with the output-oriented distance function, and a slight modification was also provided in Fare et al. [31]. This framework applies to the measurement of CU in the short run, denoted as the ratio of the actual output to the potential output at the existing fixed inputs if there is no limit to variable inputs. The optimal amount of variable inputs of each decision-making unit can be obtained simultaneously.
Some scholars have applied CU to research various industries. The physical CU in low-cost carriers with an input-oriented DEA method is estimated by Yu et al. [13]. Karagiannis [12] also used a DEA framework to assess the CU and the optimal variable inputs amount of 53 public hospitals in Greece in a single year. Liu et al. [32] estimated the efficiency and CU of state farms across 27 Chinese regions. Furthermore, based on the theory of weak disposability property, the ratio-form CU indicator in Fare et al. [30] and Fare et al. [31] has been extended into an additive-form in Yang and Fukuyama [8], which is applied to assess the CU performance of China regions.
Moreover, in the context of a low-carbon economy, some studies have incorporated carbon emissions into the study of the CU. Yang et al. [11] applied the general CU indicator considering undesirable output to estimate the CU of China’s manufacturing industries and compared the different CU levels of the light and heavy industries. Chen et al. [9] established the CU assessment framework considering CO2 emissions to investigate the CU of 30 China regions. Zhang et al. [14] explored the CU performance incorporating CO2 emissions of the construction industry in China.
To summarize, scholars have conducted extensive research activities on CU; however, it is mainly concentrated on the regional level, the entire manufacturing industry, and other individual industries such as construction, with no concern for the high-tech manufacturing industry.

2.3. A Summary of the Literature Review

In conclusion, most of the previous studies of the high-tech manufacturing industry have focused on the innovation efficiency or productivity rather than CU performance. The current research on CU is from the perspective of the region, the entire manufacturing industry, and the individual industry. There is no research on the CU performance of the high-tech manufacturing industry. In the context of a low-carbon economy, some studies focusing on CU assessment at the regional level or in the individual industry, such as the healthcare industry and the construction industry, have begun to consider environmental factors, and CO2 emissions are mostly used as the proxy of the undesirable output. This effectively addresses the issue of assessing the green development of these sectors. Based on the research frontier, this study constructs a framework for CU assessment of China’s high-tech manufacturing industry and it further incorporates environmental factors, hoping to provide a basis for the government to make accurate decisions on the green development of the high-tech manufacturing industry.

3. Methodology

3.1. Green CU indicator

The green CU indicator represents the ratio of actual outputs to the potential outputs based on DDFs, considering the undesirable outputs, as shown in Figure 1.
Assuming that there are J DMUs ( j = 1 , , J ). Although the specific content of these activities is different, the purpose is to maximize the effectiveness of the activity. Such a unit is called a decision-making unit, which is partly virtual. The provincial high-tech manufacturing industry is treated as a DMU in this article. Each DMU transforms the variable inputs X L , X E , (quasi-) fixed input X A into desirable outputs Y P , Y S and undesirable output Y B , in which these input and output indicators correspond to the variables in the existing empirical research, respectively. Then, the production possibility set (PPS) is defined by.
P P S = { ( X L , X E , X A , Y P , Y S , Y B ) | ( X E , X L , X A ) c a n   produce   ( Y P , Y S , Y B ) }
DMUs produce some undesirable outputs while producing desirable outputs in the industrial production process [33]. Consistent with Shephard [34], Fare and Grosskopf [35], and Yang et al. [11], weak disposability properties are adopted in this study. The JWD concerning desirable outputs and the undesirable outputs can be expressed by the following:
J W D :   ( X L , X E , X A , Y P , Y S , Y B ) P P S   and   0 θ j 1   j   ( X L , X E , X A , θ j Y P , θ j Y S , θ j Y B ) P P S
Equation (2) shows that the increase (decrease) in the desirable outputs is related to the increase (decrease) in the undesirable outputs. It should be further clarified that each DMU has a specific value of the abatement factor θ j , which is also different across the DMUs. As Y P ,   Y S and Y B , are relative to each other, under the assumption of variable returns to scale (VRS), the PPS is written as follows:
P P S = { ( X L , X E , X A , Y P , Y S , Y B ) | j = 1 J X j L λ j X L , j = 1 J X j E λ j X E , j = 1 J X j A λ j X A , j = 1 J θ j Y j P λ j Y P , j = 1 J θ j Y j S λ j Y S , j = 1 J θ j Y j B λ j = Y B , j = 1 J λ j = 1 , λ j 0 , 0 θ j 1 , j }
where X L , X E , X A , Y P , Y S , Y B represent the observed input and output vectors of each DMU and the set of vectors of intensity variables are represented by λ = ( λ 1 , , λ J ) . Besides, g = ( g Y P , g Y S , g Y B ) 0 refers to the directional vector and adopt the PPS. Then, existing production activities can be optimized in the direction ( g Y P , g Y S , g Y B ) to increase desirable outputs while reducing undesirable outputs. The Chinese government’s original intention in industrial development is to expand output and to enhance its competitiveness instead of lowering investment. Therefore, it is more appropriate to consider a model based on output orientation. The directional output distance function of DMU K takes the following form:
D k ( X k L , X k E , X k A , Y k P , Y k S , Y k B ; g ) = m a x β s . t . { j = 1 J X j L λ j X k L , j = 1 J X j E λ j X k E , j = 1 J X j A λ j X k A , j = 1 J θ j Y j P λ j Y k P + β g Y P , j = 1 J θ j Y j S λ j Y k S + β g Y S , j = 1 J θ j Y j B λ j = Y k B β g B , j = 1 J λ j = 1 , λ j 0 , 0 θ j 1 , j ,   β   free
Equation (4) is a nonlinear program. Let u j = θ j λ j 0 and v j = ( 1 θ j ) λ j = λ j u j ; then v j 0 , λ j = u j + v j 0 and j = 1 J λ j = j = 1 J ( u j + v j ) = 1 . Therefore, model (4) can be converted to the following model (5):
D k ( X k L , X k E , X k A , Y k P , Y k S , Y k B ; g ) = m a x β s . t . { j = 1 J X j L ( u j + v j ) X k L , j = 1 J X j E ( u j + v j ) X k E , j = 1 J X j A ( u j + v j ) X k A , j = 1 J Y j P u j Y k P + β g Y P , j = 1 J Y j S u j Y k S + β g Y S , j = 1 J Y j B u j = Y k B β g B , j = 1 J ( u j + v j ) = 1 , u j + v j 0 , j = 1 J u j 1 , u j 0 , v j 0 , j ,   β   free
Based on the physical definition of CU [5] and drawing on the research framework in Fare et al. [30] and Yang et al. [11], the present study relaxes restrictions on the variable inputs and defines a non-restrictive production possibility set P P S as follows:
P P S = { ( X L , X E , X A , Y P , Y S , Y B ) | j = 1 J X j L ( u j + v j ) = ω L X L , j = 1 J X j E ( u j + v j ) = ω E X E , j = 1 J X j A ( u j + v j ) X A , j = 1 J Y j P u j Y P , j = 1 J Y j S u j Y S , j = 1 J Y j B u j = Y B , j = 1 J ( u j + v j ) = 1 ,   u j + v j 0 ,   j = 1 J u j 1 , ω L 0 ,   ω E 0 , u j 0 ,   v j 0 ,   j ,   β   free }
where ω L and ω E refer to the scaling factors of X L and X E , which express the expansion or contraction of variable inputs when the potential desirable output reaches its maximum. Based on Equation (6), the DDF independent of variable inputs is as follows:
D ^ k ( X k A , Y k P , Y k S , Y k B ; g ) = m a x β s . t . { j = 1 J X j E ( u j + v j ) = ω k E X k E , j = 1 J X j L ( u j + v j ) = ω k L X k L , j = 1 J X j A ( u j + v j ) X k A , j = 1 J Y j P u j Y k P + β g Y P , j = 1 J Y j S u j Y k S + β g Y S , j = 1 J Y j B u j = Y k B β g B , j = 1 J ( u j + v j ) = 1 , ω E 0 ,   ω L 0 , u j + v j 0 , j = 1 J u j 1 , u j 0 ,   v j 0 ,   j ,   β   free
where D ^ k ( X k A , Y k P , Y k S , Y k B ; g ) D k ( X k L , X k E , X k A , Y k P , Y k S , Y k B ; g ) for ( X L , X E , X A , Y P , Y S , Y B ) P P S . Consistent with the research of Yang et al. [11], we defined the CU indicator as the difference between (7) and (5):
G r e e n   C U = D ^ k ( X k A , Y k p , Y k S , Y k B ; g ) D k ( X k L , X k E , X k A , Y k p , Y k S , Y k B ; g ) .
Furthermore, the optimal variable inputs of the assessed DMU can be obtained from Equation (7).
X L = j = 1 J X j L ( u j + v j )
X E = j = 1 J X j E ( u j + v j )

3.2. Implications of the Green CU Indicator

The green CU indicator shows the inefficiency of each DMU, which implies that the larger green CU indicator value is in line with the lower green CU level. Thus, green   CU 0 because of D ^ k ( X k A , Y k P , Y k S , Y k B ; g ) D k ( X k L , X k E , X k A , Y k P , Y k S , Y k B ; g ) . Following the research of Klein [25], Yang and Fukuyama [8], and Yang et al. [11], this study defines five possibilities when the value of the green CU indicator is obtained.
Definition 1.
If the indicator green   CU > 0 :
ω L 1 and ω E 1 hold simultaneously. Then, the assessed DMU can be said to be at under-utilized capacity and the variable inputs are absolutely insufficient.
ω L 1 and ω E 1 ω E 1 do not hold simultaneously. Then, the assessed DMU can be said to be at under-utilized capacity, and the variable inputs are insufficient.
Definition 2.
If the indicator green   CU = 0 :
ω L = 1 ω L = 1 and ω E = 1 hold simultaneously. Then, the assessed DMU can be said to be at fully utilized capacity and the variable inputs are in optimum condition.
ω L < 1 and ω E < 1 hold simultaneously. Then, the assessed DMU can be said to be at fully utilized capacity and the variable inputs are absolutely redundant.
ω L < 1 and ω E < 1 do not hold simultaneously. Then, the assessed DMU can be said to be at fully utilized capacity and the variable inputs are redundant.
The specific judgment process is shown in Figure 2 below.

4. Data and Indicators

4.1. Data Set

The data used in the study were collected from the China Statistics Yearbook of the High Technology Industry [36], the China Statistical Yearbook [37], the China Energy Statistical Yearbook [38], and the China Emission Accounts and Datasets (CEAD).In this study, green CU was measured by considering the desirable and undesirable outputs simultaneously using the green CU indicator. The provincial high-tech manufacturing industry is treated as a DMU. There are a total of 28 DMUs in this study. Taiwan, Hong Kong, Macao, Tibet, Xinjiang, and Qinghai are excluded because their data were incomplete. The total sample can meet the required number of DMUs in the DEA method [39].

4.2. Input and Output Variables

Table 1 shows the input and output indicators used in the previous studies on the performance assessment of the manufacturing industry. Labor, assets, and energy consumption are frequently used as input indicators. In addition, sales revenue and CO2 emissions are the most commonly used desirable and undesirable output indicators in studies on China’s manufacturing industry performance. In the general DEA model, the input-orientation DEA model emphasizes how to minimize inputs without decreasing outputs, the output orientation DEA model emphasizes how to maximize outputs without increasing input. However, because the measurement of green CU involves both positive outputs (the more, the better) and negative outputs (the fewer, the better), it is necessary to use DDFs to measure inefficiency. However, to the best of our knowledge, only a few studies have assessed CU based on CO2 emissions in China’s high-tech manufacturing industry.
Based on the conceptual model and the findings of the literature review, three inputs (labor, energy consumption, and assets), two desirable outputs (patent and sales revenue), and one undesirable output (CO2 emissions) were selected to measure the capacity of China’s high-tech manufacturing industry. Unlike previous research, this study treats input variables differently: that is, labor and energy consumption are regarded as variable inputs, and assets are regarded as a (quasi-) fixed input. Table 2 shows the following definition of input and output variables used in this study.
(i)
Labor: the annual average number of employed personnel in the high-tech manufacturing industry. In this study, labor is used as an input variable.
(ii)
Energy consumption: the total consumption of all energy types in China’s high-tech manufacturing industry during a certain period. It is not easy to directly obtain data on energy consumption directly from the high-tech manufacturing industry. However, it cannot be ignored that the classification criteria for different types of statistical yearbooks in China are based on national economic industry classifications. Hence, according to the specific description of each industrial sector in the National Economic Industry Classification Notes 2017, we selected industrial sectors that are very similar to the high-tech manufacturing industry from the China Energy Statistical Yearbook [38] and CEAD. We used the data on energy consumption as the proxy for energy consumption by the high-tech manufacturing industry. The industrial sectors include medical and pharmaceutical products, chemical fibers, ordinary machinery, equipment for a special purpose, electrical equipment and machinery, electronic and telecommunications equipment, instruments, meters, and cultural and office machinery. The guidelines issued by the Intergovernmental Panel on Climate Change (IPCC) regarding the allocation of greenhouse gas (GHG) emissions [43] include 20 types of energy. This study follows this approach. Different types of energy consumption were converted into uniform unit standard coal equivalents (SCEs) [44]. The conversion coefficients used in this study are shown in Table A1 in Appendix A.
(iii)
Assets: economic resources that are owned by the enterprise and that can be assessed in monetary terms, including various capitals, claims, and other rights. In this study, assets are used as a (quasi-)fixed input variable that cannot change quickly in the short term. The Consumer Price Index (CPI) is used to deal with inflation to ensure the continuity and comparability of data, which are shown in Table A2 in Appendix A.
(iv)
Patent: the number of patent applications filed by China’s high-tech manufacturing industry for a certain period, which is the sum of the number of invention patent applications, utility model patent applications, and design patent applications. As a relevant carrier of knowledge output, patents reflect the contribution of industry development to knowledge growth. Furthermore, the number of patents may be the most applicable proxy for knowledge growth [1,16,22,45]. In this study, the patent is used as a desirable output.
(v)
Sales revenue: the sales revenue of new products is a continuous source of capital and development, reflecting the growth potential of the industry’s economic output. In this study, sales revenue is also used as a proxy for desirable output. The CPI is used to deflate the data to ensure the comparability of continuous data.
(vi)
CO2 emissions: the average GHG emissions generated by China’s high-tech manufacturing industry during the life cycle of certain products. CO2 emissions are the undesirable output in this study. However, CO2 emission data could not be obtained directly from any of China’s statistical yearbooks. Therefore, these data are estimated based on the different types of energy consumption. IPCC provides a general method for estimating CO2 emissions in the 2006 Guidelines for National Greenhouse Gas Inventories [46]. The technique is widely used by national governments, research institutions, and researchers [47,48].
C E =   C E j =   ( E j × N C V j × E F j × O E j ) , j = 1 , 2 , , 20
In Equation (11), C E j represents the carbon emissions of different energy types. E j , N C V j , E F j and O E j represent the energy consumption (E), the net calorific value (NCV), the emission factors (EF), and the oxygenation efficiency (OE) of different energy types. Table A3 in Appendix A shows the data for NCV, EF, and OE, which were collected from Shan et al. [49] and Liu et al. [50].
Table A3 in Appendix A shows that the CO2 emissions from heat and electricity were zero. However, the CO2 emissions from heat and electricity cannot be zero, and their emissions cannot be ignored. The reason that this phenomenon occurred is that several adjustments were performed on energy consumption to avoid double counts or missing counts. The CO2 emissions from heat and electricity were put into specific energy production sectors, so the CO2 emissions from the heat and electricity used by the energy consumption sectors were not counted. Because China’s high-tech manufacturing industry does not include the production and supply of electric power, steam, and hot water, the CO2 emissions from heat and electricity are calculated separately and added to the total amount. The heat and electricity emission factors are shown in Table A4 in Appendix A. Hence, the CO2 emissions data for each year of China’s high-tech manufacturing industry can be calculated. Table 2 provides a summary of all the indicators used in this study.

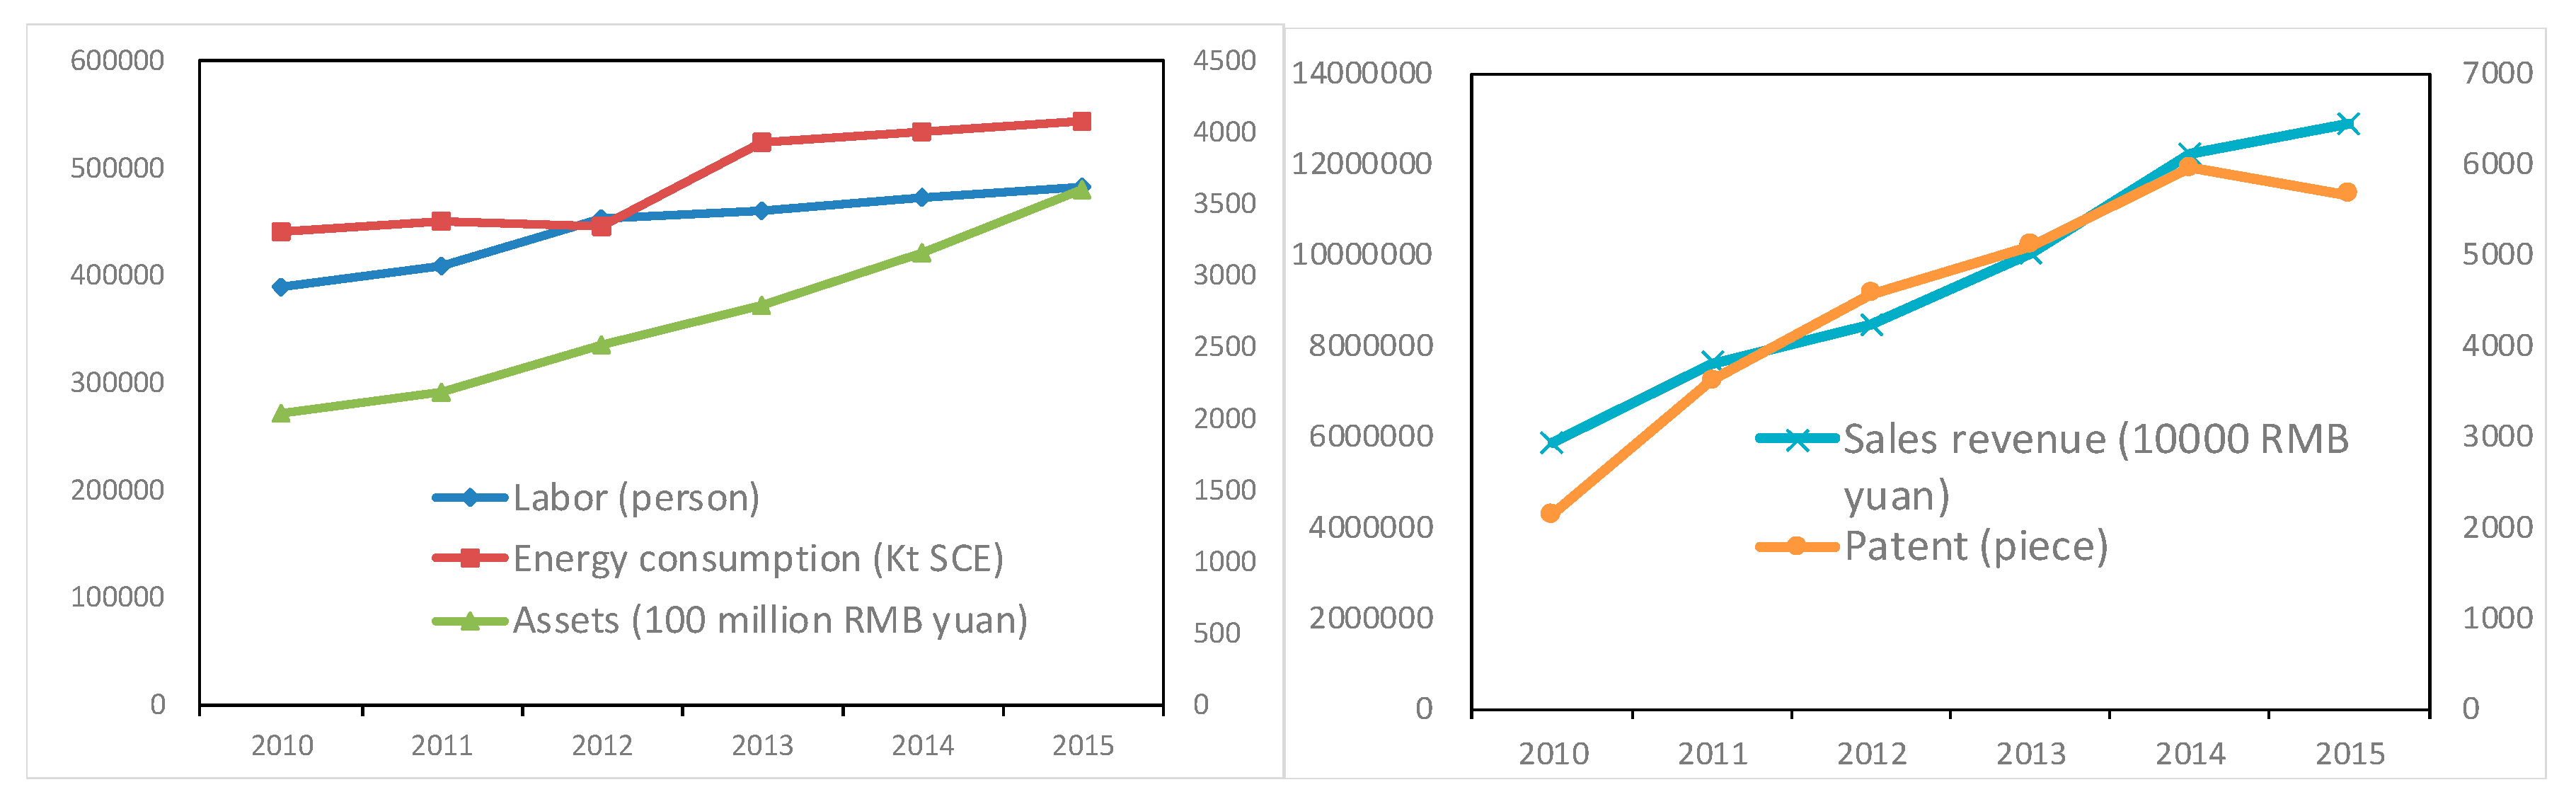
4.3. Descriptive Statistics of the Variables

Table 3 provides the descriptive statistics of the variables used in the study from 2010 to 2015. The average of the six variables reflects the trend in the data during the investigated period. As shown in Figure 3, all six variables used in the present study showed increases in varying degrees, especially labor, energy consumption, assets, patents, and sales revenue.
The trend in the data on CO2 emissions is shown in Figure 4. Because of the vital position of the CO2 emissions data in this study, it was necessary to explore them further. As shown in Figure 4, the CO2 emissions indicated a rising and fluctuating trend from 2010 to 2015, and the average CO2 emissions increased from 10.6045 Mt to 11.7413 Mt, which was an increase of about 10.72% over the CO2 emissions in 2010.

5. Empirical Results and Discussion

The model presented in this study was used to assess the green CU of the high-tech manufacturing industry in 28 provinces of mainland China from 2010 to 2015, which was the period of China’s 12th National Five-Year Plan (2011–2015). The findings of this empirical study are of great significance in assessing the green CU of China’s high-tech manufacturing industry in the previous stage and in guiding the next phase of work.

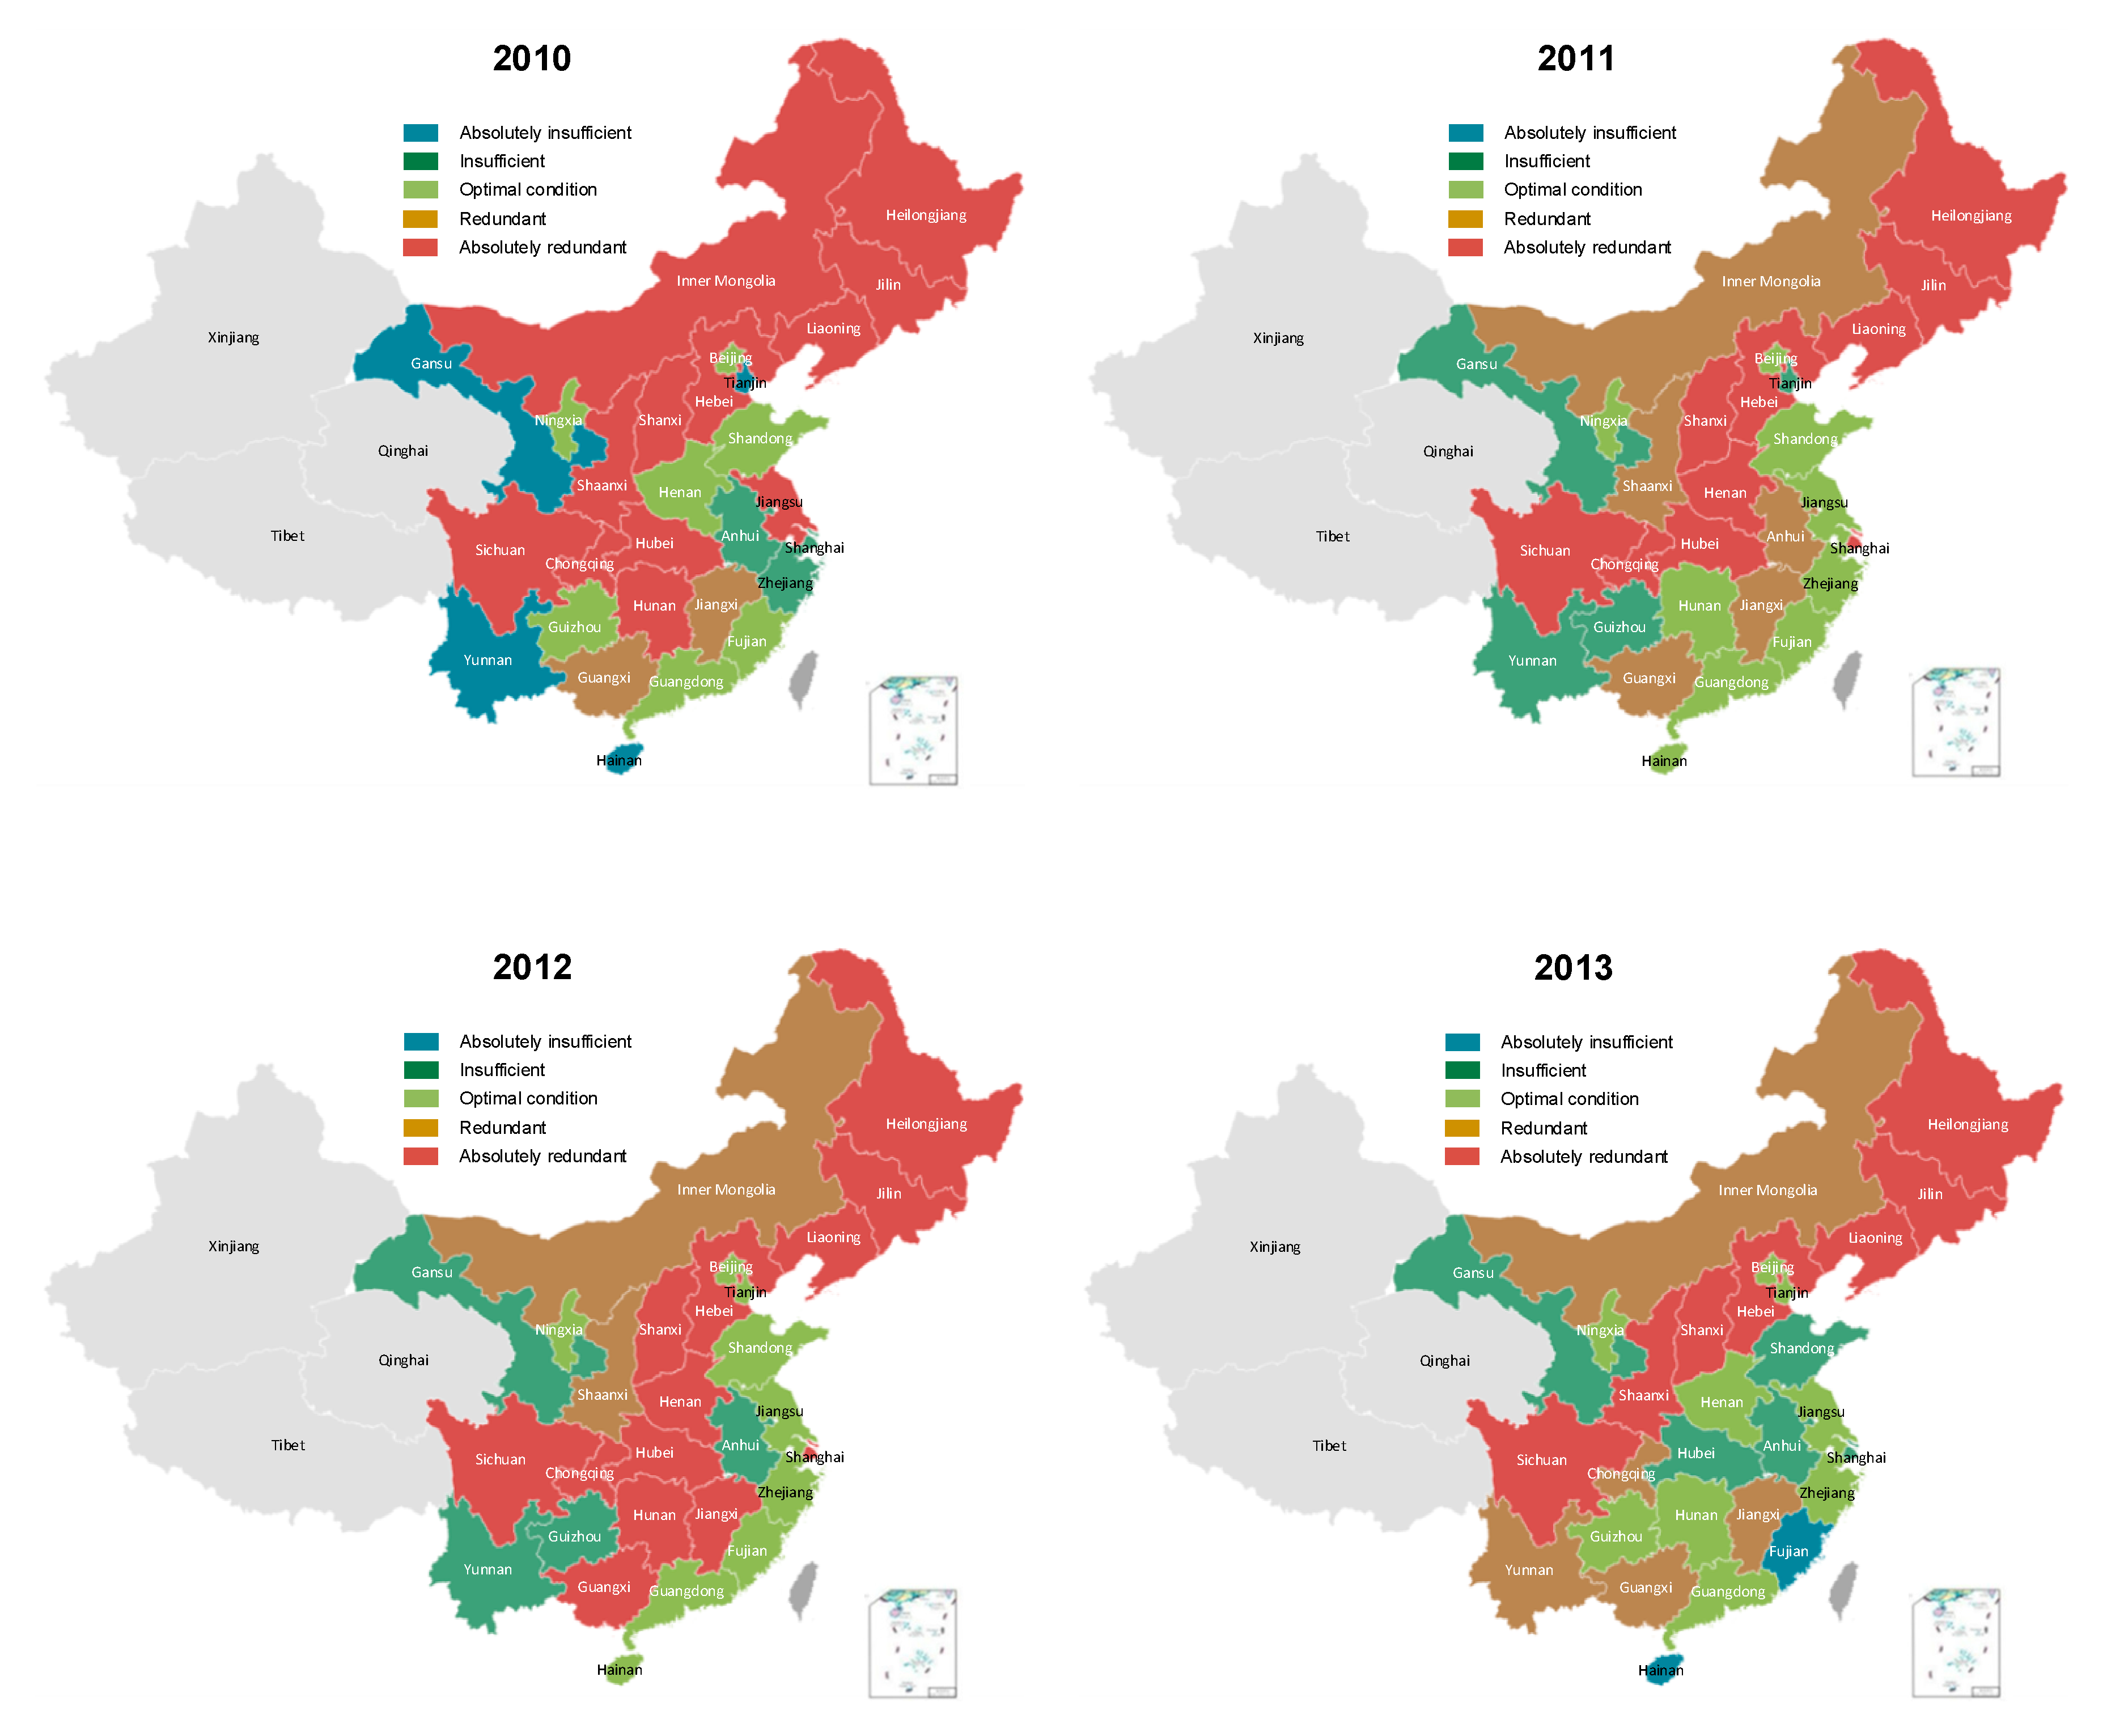
5.1. Provincial Green CU indicator

Based on a previous study [11], g = ( g Y P , g Y S , g Y B ) = ( Y k P , Y k S , Y k B ) was used to represent the directional vector, where ( Y k P , Y k S , Y k B ) were the outputs of the evaluated D M U k .
Table 4 shows the values of the green CU indicators in China’s high-tech manufacturing industry from 2010 to 2015. Fourteen provinces had a zero value in the green CU indicator, which means that half of the provinces were at full capacity. The remaining 14 provinces had positive green CU indicators, indicating that in half of the provinces in mainland China, the capacity was under-utilized.
In addition, the provinces were sorted based on the average value of green CU. As shown in Figure 5, the average green CU in the provinces was divided into three groups. The average green CU indicators in Anhui and Hainan were higher than 0.1, indicating that the optimal output of these two provinces was much higher than the current actual level; moreover, there was a large gap between the real output and the optimal output. By contrast, except the provinces with a green CU value of zero, the average green CU value in Tianjin, Liaoning, Heilongjiang, Shanghai, Zhejiang, Fujian, Shandong, Hubei, Sichuan, Guizhou, Yunnan, and Gansu was less than 0.1, indicating that these provinces were close to full capacity. The following analytical section will discuss time series, regional differences, and the scale of the optimal variable inputs. The possible interpretations will be provided in the discussion section.

5.2. Analysis from a Time Perspective

Figure 6 shows the changes in the average value of the green CU indicator in 28 provinces from 2010 to 2015. From 2010 to 2012, the green CU increased significantly to approximately 0.0040 in 2012, which was very close to zero, indicating that China’s high-tech manufacturing industry almost reached full capacity. Between 2012 and 2014, the green CU value decreased continually. There was a slight rebound to 0.0213 in 2015. Furthermore, the value of the green CU indicator in 2015 was 34.97% of the indicator in 2010. Therefore, these results indicate that during the study period, China’s high-tech manufacturing industry performed well in CU.
The average green CU indicator was approximately 2.11% > 0 during the study period, which indicates that there is little room for China’s high-tech manufacturing industry to improve its green CU. Table 5 shows the corresponding values of D k and D ^ k for each year.
From a numerical point of view, the changes in green CU from 2010 to 2015 were analyzed. From a quantitative point of view, we also counted the number of provinces with under-utilized capacity and fully utilized capacity in each of the six years. As shown in Figure 7, the number of provinces with fully utilized capacity decreased gradually. By contrast, the number of provinces with under-utilized capacity increased significantly, which suggests that green CU in China’s high-tech manufacturing industry has deteriorated.

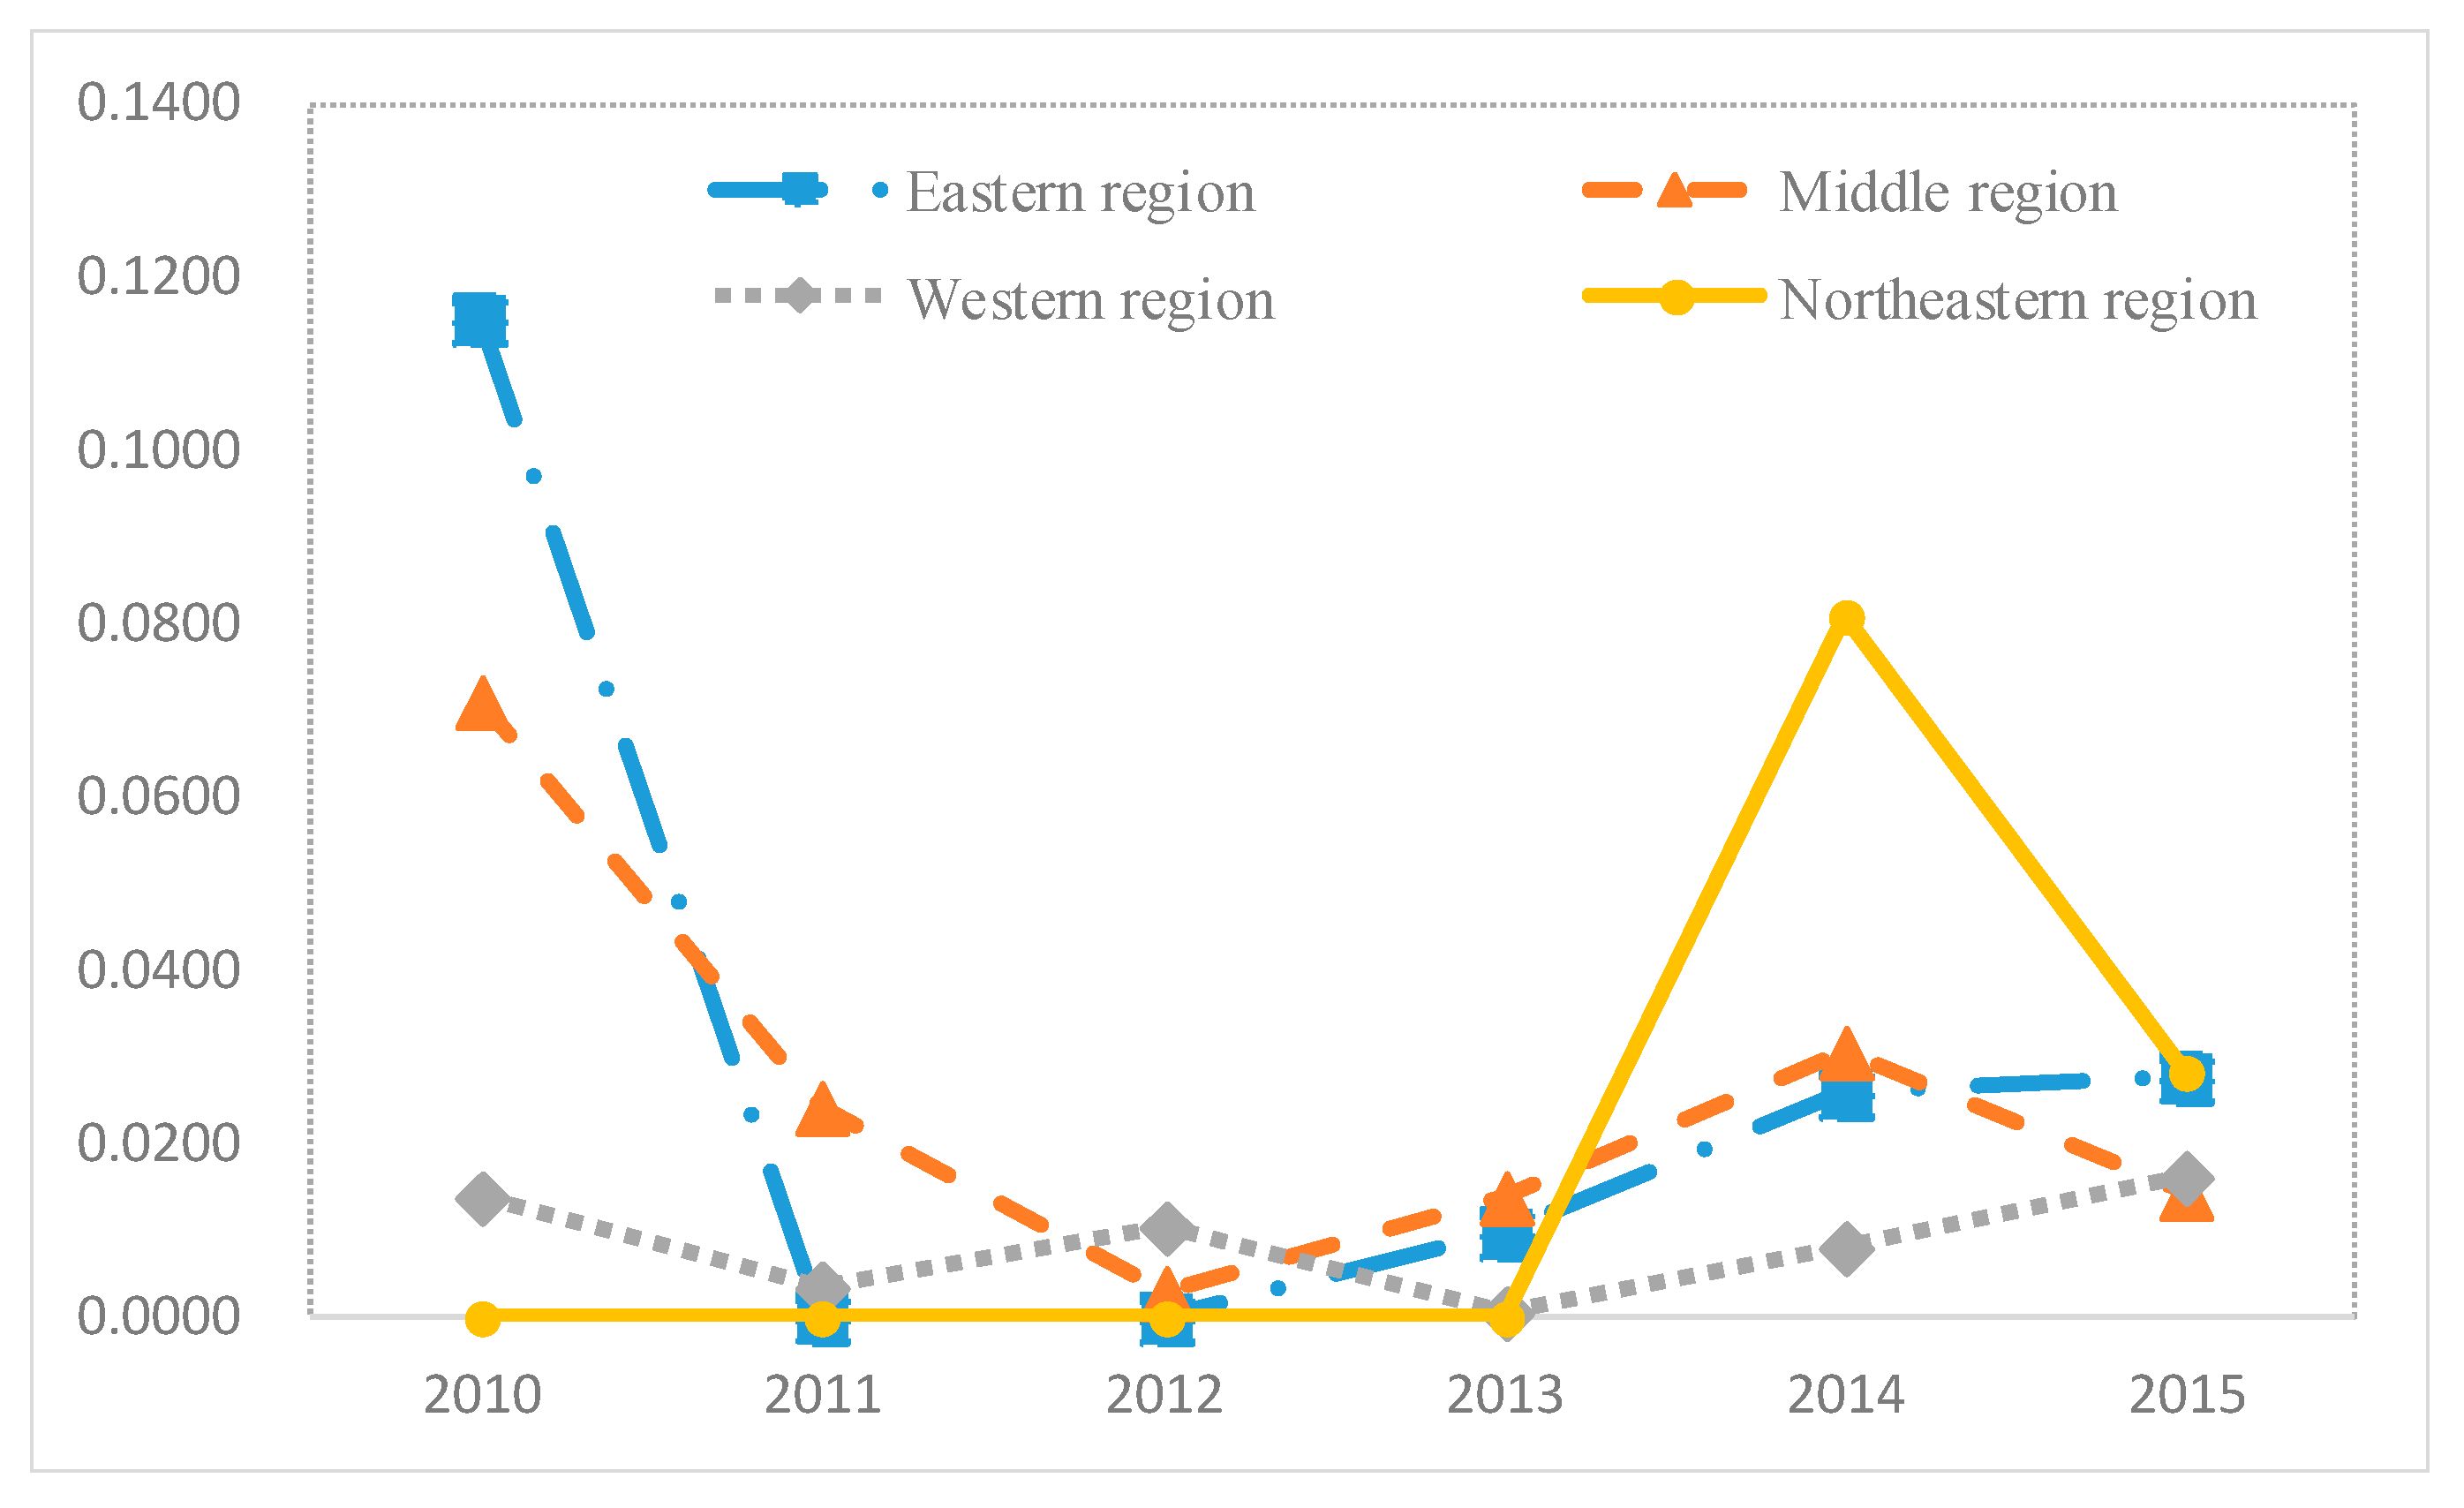
5.3. Analysis from the Regional Perspective

Since the 1980s, the Chinese government has implemented a gradual development strategy to prioritize the eastern region. This strategy was effective in improving the economic development of the eastern region, but it created imbalances and disparities in regional development. Besides, there were significant differences in population size, location distribution, resource endowment, industrial structure, and production factors in the four economic-geographic regions. Hence, a regional analysis was carried out to determine the green CU in China’s high-tech manufacturing industry during the study period.
As shown in Figure 8, the green CU indicator value in the eastern region was the highest, indicating that the eastern region had the most significant potential to increase the green CU among the four regions. By contrast, the green CU in the western region was the lowest, which means that among the four regions, it almost reached fully utilized capacity. The green CU of the middle and the northeastern regions were in the middle order.
Figure 9 shows the changes in the green CU indicators in the four regions in mainland China from 2010 to 2015. In the eastern region, the average value of green CU decreased drastically and reached the fully utilized capacity condition, which continued into 2012. However, the average amount of green CU showed a gradual upward tendency. In the middle region, the average value of the green CU declined sharply from 2010 to 2012, increased until 2014, and then decreased in 2015. At its lowest point in 2012, it was very close to fully utilized capacity. In the western region, the average value of the green CU indicator was relatively small, fluctuating between 0 and 0.02. In the northeastern region, the value of the green CU indicator was zero, which indicated that capacity was fully utilized over this period. However, the value changed dramatically change from 2013 to 2015 in a trend shown in a reverse U-shape.

5.4. Analysis Based on the Variable Inputs’ Scale

According to Equations (9) and (10), the optimal variable inputs for each DMU were obtained. Furthermore, compared with the optimal variable inputs, the current level of real variable inputs was optimal, sufficient, or redundant.
Figure 10 shows the trends in the provinces with variable inputs in different states from 2010 to 2015. According to Definition 1 and Definition 2, the five states of variable inputs were obtained: redundant, absolutely redundant, optimal conditions, insufficient, and absolutely insufficient. In the period from 2010 to 2015, when the production capacity was fully utilized, the number of provinces with sound fixed inputs and variable input ratios was unchanged. Insufficient variable inputs and variable input redundancy existed simultaneously, and the numbers of these two types of provinces were equal. However, the number of provinces with insufficient variable inputs continued to increase, and the number of provinces with variable input redundancy gradually decreased.
In addition, we investigated the overall size of the country’s optimal variable inputs (Table 6), which helped us identify whether it was necessary to change the number of variable inputs or adjust the structure of the variable inputs. Specifically, this study determined whether there was a significant difference in the total number of real variable inputs and optimal variable inputs per year. In the same year, the variable input in the same industry under different constraints is a paired sample problem. The results were not independent of each other and did not show the overall distribution. Therefore, the Wilcoxon signed-rank test was conducted to test the null hypothesis (i.e., the quantity of actual variable inputs was equal to that of optimal variable inputs).
Regarding labor, the p-value was 0.116 (> 0.05). Hence, there was no significant difference between the number of observations and the optimal condition. In other words, after relaxing the restrictions on the variable inputs, the overall demand for labor nationwide did not change significantly. Regarding energy consumption, the p-value was 0.028 (< 0.05). Hence, there was a significant difference between the number of actual variable inputs and the optimal variable inputs. After relaxing the restrictions on the variable inputs, the demand for energy was significantly reduced.
Furthermore, the Wilcoxon signed-rank test was also used to determine the number of actual variable inputs and optimal variable inputs in each province per year (Table 7). The labor force was analyzed in two stages. In the first stage, from 2010 to 2012, there was a significant difference between the actual quantity of labor and the optimal amounts required each year. In the second stage, from 2013 to 2015, there was no significant difference between the above two. Regarding energy consumption, there were substantial differences between the real amount of energy and the optimal amount of energy.
Figure A1 in Appendix A shows the variable inputs. In particular, Anhui, which had the highest green CU value, was selected to study the optimal scale of variable inputs using Equations (9) and (10) (see Table 8). The states of the variable inputs in each province per year are shown in Figure A1 in Appendix A. The specific value of the variable inputs of any province was generated by Equations (9) and (10).

5.5. Discussion

In the empirical research, the green CU of 28 provinces in mainland China during the period from 2010 to 2015 differentiated between the different states of variables inputs, and interprovincial and regional analysis were conducted. Three interesting findings emerged in this study.
First, the number of provinces with fully utilized capacity and under-utilized capacity were equal, which was determined separately from the perspective of the average green CU indicator value during the implementation of the last Five-Year Plan. However, during the study period (2010–2015), the green CU indicator in China’s high-tech manufacturing industry experienced a decline and then an increase, signaling under-utilized capacity. Compared to empirical results in Yang et al. [11], they showed the average CU value of the whole Chinese manufacturing industry and tried to utilize the capacity better. We found that the CU trends of the manufacturing industry and the high-tech manufacturing industry are different. Through monitoring the green CU of specific industries, industrial policies can be more targeted to promote their development. After further integrating the undesirable output into the CU assessment framework of the high-tech manufacturing industry a green CU evaluation system can be formed, which addresses the issue of assessing CU performance in a low-carbon context at the regional level in this industry. This means that in the process of industrial development, attention should be paid not only to desirable outputs, but also to undesirable outputs. For industrial sustainable development, the trade-off needs to be between these two. More specifically, the high-tech manufacturing industry is popular because of its technology-intensive nature, so it is prone to blind expansion in its development. Adding undesirable outputs to the monitoring indicators will also provide decision support for national and local decision makers to rationally deploy the high-tech manufacturing industry. The green CU monitoring indicator provides a benchmark for rational decision making while also promoting the sustainable development of the high-tech manuscript industry.
Second, the values of the green CU indicators from the largest to the smallest were the eastern region, the middle region, the northeastern region, and the western region. That is, the utilization of green capacity from the highest to the lowest included the western region, the northeastern region, the middle region, and the eastern region. Because of the superior geographical location and preferential policies, the development of the high-tech manufacturing industry in the eastern region is at the forefront of China’s development. The industrial base of the high-tech manufacturing industry in the eastern region far exceeded that in the western region. Therefore, the local government had more input resources, especially concerning fixed investment, a problem that cannot be resolved in the short term. In contrast, in the western region, the foundation of the high-tech manufacturing industry was found to be weak. In recent years, the utilization of construction capacity has gradually improved through the implementation of preferential policies. Therefore, the level of green CU in the eastern region is lower than that in the western and other regions. This finding is consistent with many studies on China, where regional differences are evident; for example, regional differences in innovation efficiency of China’s high-tech industries [51], regional differences in municipal solid waste collection quantities [52], and regional differences in environment performance [53]. This shows that regional differences have affected many aspects of China’s social and economic life. Fully considering the resource endowments of various provinces, it is the general trend to act locally.
Third, under the current fixed inputs level, the amount of labor input reached the optimal condition, but the findings showed that traditional energy consumption needed to be reduced. The actual variable inputs and optimal variable inputs were compared, and two results were obtained from the analysis. From 2010 to 2012, the supply and demand for labor were severely unbalanced. Some provinces were in short supply, while some provinces were oversupplied. From 2013 to 2015, the amount of labor met the needs of each province. This finding indicates that China’s talent policies have had an initial effect. The total number of qualified personnel in China’s high-tech manufacturing industry met the demand, but the crux of the problem is mainly the uneven distribution of labor. With the rapid development in China’s urbanization, local governments have successfully introduced various preferential policies regarding qualified personnel. These people are more inclined to return to their hometowns or to choose their favorite cultural environment instead of gathering in cities, which has improved the uneven distribution of qualified personnel across provinces. Another alternative explanation is that the development of high-speed rail shortens the space-time distances between cities, and high-speed rail provides a fast and convenient way for the flow of population [54]. This makes cross-provincial mobility of talent easier. In addition, traditional energy consumption requires not only a reduction in total volume but also a reduction in energy consumption in individual provinces. To ensure the better development of a low-carbon economy, the high-tech manufacturing industry must reduce its CO2 emissions [55], which requires a significant reduction in the consumption of traditional energy.
Based on these findings, the policy implications and suggestions are discussed. First, the central government should establish a monitoring and early warning mechanism to promote green CU in the high-tech manufacturing industry. Decision makers should consider preventing the blind layout and expansion of high-end industries effectively. Second, the central government should implement targeted regional policies. The high-tech manufacturing industry in the eastern, middle, northeastern, and western regions should adopt different development priorities and foster industries based on local characteristics. In particular, it is necessary to consider the industrial investment base and the utilization of the existing capacity in different regions. Only by making investment strategies responsive to local conditions could investment be effective. Third, the government should establish a mechanism to ensure the mobility of labor nationwide, especially high-tech labor. Different regions should formulate corresponding personnel policies, including the Northeast Talent Policy, the Western Talent Policy, Talent Flow, and the Talent Market Policy. At present, the total number of qualified personnel in China meets the needs of the high-tech manufacturing industry. However, because of the unbalanced distribution of qualified personnel, there is surplus talent in some places and a shortage of talent in others. Therefore, it is necessary to construct excellent facilities to support qualified personnel, enhance the attraction of talents in some areas, and promote the movement of qualified personnel. Fourth, it is necessary to increase industrial outputs and reduce CO2 emissions by improving production technology and energy efficiency to encourage the development of a low-carbon economy. This was verified in the article written by Xu and Lin [56]. In general, the current energy consumption mode is extensive and wasteful. Therefore, the amount of energy consumption should be based on improving the efficiency of energy use [57]. In summary, the government should play an authoritative role in resource allocation, especially concerning the optimal ratio of fixed inputs and variable inputs. The best way to invest resources in industrial development is through scientific planning. According to the different characteristics of input resources, a detailed classification should be carried out to improve the efficiency of resource use, thereby promoting the green development of the high-tech manufacturing industry.

6. Conclusions

In this study, the proposed green CU assessment framework divided inputs into fixed inputs and variable inputs, and into desirable outputs and undesirable outputs. The critical green CU indicator was defined as the difference between actual outputs and potential outputs. The purpose of establishing this indicator was to measure whether the green capacity of China’s high-tech manufacturing industry is fully utilized in the low-carbon economy. Then, this study applies the approach to assess the green CU of China’s high-tech manufacturing industry from 2010 to 2015.
The main results were as follows. First, although the provinces with full capacity utilization and under-utilized capacity were equal in number, the green CU in China’s high-tech manufacturing industry performed well overall from 2010 to 2015. Second, the performance of green CU also showed significant regional differences. The amount of labor required for the development of China’s high-tech manufacturing industry was shown to be optimal, but the quantity distribution of labor among the provinces was uneven. Finally, based on the results, to achieve optimal levels of green CU, the energy consumption in each province should be reduced.
Compared with previous research, this study makes the following contributions to the literature. First, based on panel data on 28 provinces in mainland China, we established a measurement framework using a nonparametric optimal method DEA with DDF to explore the green CU in the high-tech manufacturing industry considering economic and environmental benefits. Second, because the CO2 emission data were calculated explicitly for China’s high-tech manufacturing industry, the green CU determined in the present study was more accurate. Third, the optimal variable inputs size obtained from the results could be of great value to decision makers.
The results of this study highlight the need for future research. First, careful consideration should be given to the accurate measurement of undesirable outputs in the high-tech manufacturing industry, including not only CO2 emissions but also the harmful gases, solid wastes, and recycling. The great challenge of this study is that such regional-level data of the high-tech manufacturing industry is often unavailable. Another task for future studies would combine the DEA approach with spatial econometrics to analyze the differences in interprovincial and regional green CU accurately. Third, based on the established appropriate index system, the DEA and bootstrap method could be combined to obtain more robust measurement results. These three future research directions are essential and worthy of attention for the further accurate measurement and analysis of green CU.

Author Contributions

Conceptualization, Y.W. and G.Y.; data curation, B.Y. and Y.W.; formal analysis, J.P. and R.P.; writing—original draft preparation, Y.W., B.Y. and R.P.; writing—review and editing, Y.W., B.Y. and R.P.; funding acquisition, B.Y. All authors have read and agreed to the published version of the manuscript.

Funding

We would like to acknowledge the support of the National Natural Science Foundation of China (No. 71671181), the National Key Research and Development Program of China under Grant No. 2017YFE0101800.

Conflicts of Interest

The authors declare no conflict of interest.

Appendix A

Table A1. Conversion coefficients from different types of energy into SCE.
No.Energy TypesConversion Factors from Physical Units to Standard Coal EquivalentNo.Energy TypesConversion Factors from Physical Units to Standard Coal Equivalent
1 Raw coal0.714 11Kerosene1.471
2 Cleaned coal0.900 12Diesel oil1.471
3 Other Washed Coal0.286 13Fuel oil1.429
4 Briquettes0.714 14Liquefied petroleum gas1.714
5 Coke0.971 15Refinery Gas1.571
6 Coke oven gas0.614 16Other Petroleum Products1.429
7 Other Gas0.714 17Natural gas1.330
8 Other Coking Products0.714 18Heat0.034
9 Crude oil1.429 19Electricity0.123
10 Gasoline1.471 20Other Energy1.000
Table A2. The CPI data for China over the period 2010-2015.
Year201020112012201320142015
CPI value100.000 105.600108.300111.200113.300114.900
Note: The CPI values are collected from OECD and index 2010=100.
Table A3. CO2 emission factors for 20 energy types.
Energy TypesNCV (PJ/104t, 108m3,tec.)EF(Mt CO2/PJ)OE
Raw coal0.2090.0870.885
Cleaned coal0.2630.0870.885
Other Washed Coal0.1540.0870.885
Briquettes0.1780.0870.885
Coke0.2840.1040.970
Coke oven gas1.6310.0710.990
Other Gas0.8430.0710.990
Other Coking Products0.2840.0910.970
Crude oil0.4180.0730.980
Gasoline0.4310.0690.980
Kerosene0.4310.0720.980
Diesel oil0.4270.0740.000
Fuel oil0.4180.0770.980
Liquefied petroleum gas0.5020.0630.990
Refinery Gas0.4610.0730.990
Other Petroleum Products0.4180.0740.980
Natural gas3.8930.0560.990
Non-fossil heat0.0100.0000.000
Non-fossil electricity0.3600.0000.000
Other Energy0.2930.0000.000
Table A4. CO2 emission factors for heat and electricity.
Energy TypesUnit201020112012201320142015
HeatMt CO2/1010KJ0.0010.0010.0010.0010.0010.001
ElectricityMt CO2/108KWh0.0630.0640.0630.0620.0570.054
Note: according to the input and output of transformation data in the energy balance table of the China Energy Statistical Yearbook (NBS, 2011–2016a), we calculated the carbon dioxide emissions from various types of energy consumption in the national power generation and heating process and obtained the national average emission coefficient of electricity and heat.
Figure A1. Visualization of variable inputs of each province over the study period.
Sustainability 12 04424 g0a1aSustainability 12 04424 g0a1b

References

  1. Hong, J.; Feng, B.; Wu, Y.; Wang, L. Do government grants promote innovation efficiency in China’s high-tech industries? Technovation 2016, 57–58, 4–13. [Google Scholar] [CrossRef]
  2. Zhang, B.; Luo, Y.; Chiu, Y.-H. Efficiency evaluation of China’s high-tech industry with a multi-activity network data envelopment analysis approach. Socio Econ. Plan. Sci. 2019, 66, 2–9. [Google Scholar] [CrossRef]
  3. National Bureau of Statistics (NBS). China Statistical Yearbook on Science and Technology 2016; China Statistics Press: Beijing, China, 2017.
  4. Sahoo, B.K.; Tone, K. Decomposing capacity utilization in data envelopment analysis: An application to banks in India. Eur. J. Oper. Res. 2009, 195, 575–594. [Google Scholar] [CrossRef]
  5. Johansen, L. Production functions and the concept of capacity. Econ. Math. Econom. 1968, 2, 49–72. [Google Scholar]
  6. Sun, X. Industrial capacity utilization index survey and research—Take the United States as an example. China Stat. 2017, 5, 32–34. [Google Scholar]
  7. Board of Governors of the Federal Reserve System. Industrial production and Capacity Utilization. 2019. Available online: https://www.federalreserve.gov/feeds/g17.html (accessed on 20 November 2019).
  8. Yang, G.-L.; Fukuyama, H. Measuring the Chinese regional production potential using a generalized capacity utilization indicator. Omega 2018, 76, 112–127. [Google Scholar] [CrossRef]
  9. Chen, Z.; Zhang, X.; Ni, G. Decomposing capacity utilization under carbon dioxide emissions reduction constraints in data envelopment analysis: An application to Chinese regions. Energy Policy 2020, 139, 111299. [Google Scholar] [CrossRef]
  10. Ray, S.C. Nonparametric measures of scale economies and capacity utilization: An application to U.S. manufacturing. Eur. J. Oper. Res. 2015, 245, 602–611. [Google Scholar] [CrossRef] [Green Version]
  11. Yang, G.-L.; Fukuyama, H.; Song, Y.-Y. Estimating capacity utilization of Chinese manufacturing industries. Socio Econ. Plan. Sci. 2019, 67, 94–110. [Google Scholar] [CrossRef]
  12. Karagiannis, R. A system-of-equations two-stage DEA approach for explaining capacity utilization and technical efficiency. Ann. Oper. Res. 2015, 227, 25–43. [Google Scholar] [CrossRef]
  13. Yu, M.-M.; Chang, Y.-C.; Chen, L.-H. Measurement of airlines’ capacity utilization and cost gap: Evidence from low-cost carriers. J. Air Transp. Manag. 2016, 53, 186–198. [Google Scholar] [CrossRef]
  14. Zhang, J.; Cai, W.; Li, H.; Olanipekun, A.O.; Skitmore, M. Measuring the capacity utilization of China’s regional construction industries considering undesirable output. J. Clean. Prod. 2020, 252, 119549. [Google Scholar] [CrossRef]
  15. Chen, C.-J.; Wu, H.-L.; Lin, B.-W. Evaluating the development of high-tech industries: Taiwan’s science park. Technol. Forecast. Soc. Chang. 2006, 73, 452–465. [Google Scholar] [CrossRef]
  16. Chen, X.; Liu, Z.; Zhu, Q. Performance evaluation of China’s high-tech innovation process: Analysis based on the innovation value chain. Technovation 2018, 74–75, 42–53. [Google Scholar] [CrossRef]
  17. Guan, J.; Chen, K. Measuring the innovation production process: A cross-region empirical study of China’s high-tech innovations. Technovation 2010, 30, 348–358. [Google Scholar] [CrossRef]
  18. Han, C.; Thomas, S.R.; Yang, M.; Ieromonachou, P.; Zhang, H. Evaluating R&D investment efficiency in China’s high-tech industry. J. High Technol. Manag. Res. 2017, 28, 93–109. [Google Scholar] [CrossRef]
  19. Li, L.-B.; Liu, B.-L.; Liu, W.-L.; Chiu, Y.-H. Efficiency evaluation of the regional high-tech industry in China: A new framework based on meta-frontier dynamic DEA analysis. Socio Econ. Plan. Sci. 2017, 60, 24–33. [Google Scholar] [CrossRef]
  20. Tseng, F.M.; Chiu, Y.J.; Chen, J.S. Measuring business performance in the high-tech manufacturing industry: A case study of Taiwan’s large-sized TFT-LCD panel companies. Omega Int. J. Manag. Sci. 2009, 37, 686–697. [Google Scholar] [CrossRef]
  21. Wang, C.-H.; Lu, Y.-H.; Huang, C.-W.; Lee, J.-Y. R&D, productivity, and market value: An empirical study from high-technology firms. Omega 2013, 41, 143–155. [Google Scholar] [CrossRef]
  22. Zhang, L.; Chen, K. Hierarchical network systems: An application to high-technology industry in China. Omega 2019, 82, 118–131. [Google Scholar] [CrossRef]
  23. Wang, Y.; Pan, J.-F.; Pei, R.-M.; Yi, B.-W.; Yang, G.-L. Assessing the technological innovation efficiency of China’s high-tech industries with a two-stage network DEA approach. Socio Econ. Plan. Sci. 2020. [Google Scholar] [CrossRef]
  24. Morrison, C.J. Primal and Dual Capacity Utilization: An Application to Productivity Measurement in the U.S. Automobile Industry. J. Bus. Econ. Stat. 1985, 3, 312–324. [Google Scholar] [CrossRef]
  25. Klein, L.R. Some Theoretical Issues in the Measurement of Capacity. Econometrica 1960, 28, 272–286. [Google Scholar] [CrossRef]
  26. Segerson, K.; Squires, D. On the measurement of economic capacity utilization for multi-product industries. J. Econom. 1990, 44, 347–361. [Google Scholar] [CrossRef] [Green Version]
  27. Berndt, E.R.; Morrison, C.J. Capacity Utilization Measures: Underlying Economic Theory and an Alternative Approach. Am. Econ. Rev. 1981, 71, 48–52. [Google Scholar]
  28. Cassels, J.M. Excess Capacity and Monopolistic Competition. Q. J. Econ. 1937, 51, 426–443. [Google Scholar] [CrossRef]
  29. Lindebo, E.; Hoff, A.; Vestergaard, N. Revenue-based capacity utilisation measures and decomposition: The case of Danish North Sea trawlers. Eur. J. Oper. Res. 2007, 180, 215–227. [Google Scholar] [CrossRef]
  30. Fare, R.; Grosskopf, S.; Kokkelenberg, E.C. Measuring Plant Capacity, Utilization and Technical Change: A Nonparametric Approach. Int. Econ. Rev. 1989, 30, 655–666. [Google Scholar] [CrossRef]
  31. Fare, R.; Grosskopf, S.; Lovell, C.K. Production Frontiers; Cambridge University Press: New York, NY, USA, 1994. [Google Scholar]
  32. Liu, Z.-W.; Balezentis, T.; Song, Y.-Y.; Yang, G.-L. Estimating Capacity Utilization of Chinese State Farms. Sustainability 2019, 11, 4894. [Google Scholar] [CrossRef] [Green Version]
  33. Shephard, R.W.; Färe, R. The law of diminishing returns. Z. Natl. 1974, 34, 69–90. [Google Scholar] [CrossRef]
  34. Shephard, R.W. Dynamic Indirect Production Functions; Springer: Berlin/Heidelberg, Germany, 1977; pp. 418–434. [Google Scholar]
  35. Fare, R.; Grosskopf, S. A Comment on Weak Disposability in Nonparametric Production Analysis. Am. J. Agric. Econ. 2009, 91, 535–538. [Google Scholar] [CrossRef]
  36. National Bureau of Statistics (NBS). China Statistics Yearbook of the High Technology Industry-Variable Years; China Statistics Press: Beijing, China, 2011–2016c.
  37. National Bureau of Statistics (NBS). China Statistical Yearbook-Variable Years; China Statistics Press: Beijing, China, 2011–2016b.
  38. National Bureau of Statistics (NBS). China Energy Statistical Yearbook-Variables Years; China Statistics Press: Beijing, China, 2011–2016a.
  39. Cooper, W.W.; Seiford, L.M.; Tone, K. Data Envelopment Analysis: A Comprehensive Text with Models, Applications, References and Dea-Solver Software; Kluwer Academic Publishers: Boston, MA, USA, 2000. [Google Scholar]
  40. Shi, X.; Li, L. Green total factor productivity and its decomposition of Chinese manufacturing based on the MML index: 2003–2015. J. Clean. Prod. 2019, 222, 998–1008. [Google Scholar] [CrossRef]
  41. Kang, Y.-Q.; Xie, B.-C.; Wang, J.; Wang, Y.-N. Environmental assessment and investment strategy for China’s manufacturing industry: A non-radial DEA based analysis. J. Clean. Prod. 2018, 175, 501–511. [Google Scholar] [CrossRef]
  42. Emrouznejad, A.; Yang, G.-L. CO2 emissions reduction of Chinese light manufacturing industries: A novel RAM-based global Malmquist–Luenberger productivity index. Energy Policy 2016, 96, 397–410. [Google Scholar] [CrossRef] [Green Version]
  43. Intergovernmental Panel on Climate Change (IPCC). Guidelines for National Greenhouse Gas Inventories; Institute for Global Environmental Strategies: Hayama, Japan, 2006. [Google Scholar]
  44. National Bureau of Statistics (NBS). China Energy Statistical Yearbook 2015; China Statistics Press: Beijing, China, 2016.
  45. Bronzini, R.; Piselli, P. The impact of R&D subsidies on firm innovation. Res. Policy 2016, 45, 442–457. [Google Scholar] [CrossRef]
  46. Edenhofer, O.; Seyboth, K.; Intergovernmental Panel on Climate Change (IPCC). Encyclopedia of Energy, Natural Resource, and Environmental Economics; Shogren, J.F., Ed.; Elsevier: Waltham, MA, USA, 2013; pp. 48–56. [Google Scholar] [CrossRef]
  47. Shan, Y.; Liu, Z.; Guan, D. CO2 emissions from China’s lime industry. Appl. Energy 2016, 166, 245–252. [Google Scholar] [CrossRef]
  48. Zhou, W.; Zhu, B.; Li, Q.; Ma, T.; Hu, S.; Griffy-Brown, C. CO2 emissions and mitigation potential in China’s ammonia industry. Energy Policy 2010, 38, 3701–3709. [Google Scholar] [CrossRef]
  49. Shan, Y.; Liu, J.; Liu, Z.; Xu, X.; Shao, S.; Wang, P.; Guan, D. New provincial CO2 emission inventories in China based on apparent energy consumption data and updated emission factors. Appl. Energy 2016, 184, 742–750. [Google Scholar] [CrossRef] [Green Version]
  50. Liu, Z.; Guan, D.; Wei, W.; Davis, S.J.; Ciais, P.; Bai, J.; Peng, S.; Zhang, Q.; Hubacek, K.; Marland, G.; et al. Reduced carbon emission estimates from fossil fuel combustion and cement production in China. Nature 2015, 524, 335. [Google Scholar] [CrossRef] [Green Version]
  51. Chen, H.; Lin, H.; Zou, W. Research on the Regional Differences and Influencing Factors of the Innovation Efficiency of China’s High-Tech Industries: Based on a Shared Inputs Two-Stage Network DEA. Sustainability 2020, 12, 3284. [Google Scholar] [CrossRef] [Green Version]
  52. Zhou, A.; Wu, S.; Chu, Z.; Huang, W.-C. Regional Differences in Municipal Solid Waste Collection Quantities in China. Sustainability 2019, 11, 4113. [Google Scholar] [CrossRef] [Green Version]
  53. Guo, J.; Zhu, D.; Wu, X.; Yan, Y. Study on environment performance evaluation and regional differences of strictly-environmental-monitored cities in China. Sustainability 2017, 9, 2094. [Google Scholar] [CrossRef] [Green Version]
  54. Wang, F.; Wei, X.; Liu, J.; He, L.; Gao, M. Impact of high-speed rail on population mobility and urbanisation: A case study on Yangtze River Delta urban agglomeration, China. Transp. Res. Part A Policy Pract. 2019, 127, 99–114. [Google Scholar] [CrossRef]
  55. Fortuński, B. Sustainable Development and Energy Policy: Actual CO2 Emissions in the European Union in the Years 1997–2017, Considering Trade with China and the USA. Sustainability 2020, 12, 3363. [Google Scholar] [CrossRef] [Green Version]
  56. Xu, B.; Lin, B. Investigating the role of high-tech industry in reducing China’s CO2 emissions: A regional perspective. J. Clean. Prod. 2018, 177, 169–177. [Google Scholar] [CrossRef]
  57. Chiu, S.-H.; Lin, T.-Y.; Yang, H.-L. Measuring Energy Performance for Regional Sustainable Development in China: A New Framework based on a Dynamic Two-Stage SBM Approach. Sustainability 2020, 12, 2851. [Google Scholar] [CrossRef] [Green Version]
Figure 1. Conceptual model of green CU indicator.
Sustainability 12 04424 g001
Figure 2. The judgment flow chart of green CU results.
Sustainability 12 04424 g002
Figure 3. Trends in the input and output variables of China’s high-tech manufacturing industry.
Sustainability 12 04424 g003
Figure 4. Changes in data regarding CO2 emissions of China’s high-tech manufacturing industry.
Sustainability 12 04424 g004
Figure 5. The distribution of average green CU in China over the examined period.
Sustainability 12 04424 g005
Figure 6. The average green CU indicators of all provinces during the examined period.
Sustainability 12 04424 g006
Figure 7. Quantitative comparison of fully utilized and under-utilized capacity provinces.
Sustainability 12 04424 g007
Figure 8. Histogram chart of average green CU of four of China’s economic regions.
Sustainability 12 04424 g008
Figure 9. Changes in green CU of four regions over the research period.
Sustainability 12 04424 g009
Figure 10. Trends in the number of provinces with variable inputs in different states.
Sustainability 12 04424 g010
Table 1. Indicators used in studies of China’s manufacturing industry.
Authors (Year)China’s IndustriesInput IndicatorsOutput Indicators
Zhang and Chen [22]High-technology industriesStage 1: R&D personnel, R&D expenses
Stage 2: Patent applications, number of patents in force
Stage 1: patent applications, number of patents in force
Stage 2: prime operating revenue, sales revenue of new products, export delivery value
Zhang et al. [2]High-tech industryStage 1: intramural expenditure on R&D, R&D personnel
Stage 2: Patent applications, number of patents in force
Stage 1: patent applications, number of patents in force
Stage 2: sales revenue of new products and value of contract deals in domestic technical markets
Shi and Li [40]Manufacturing industryCapital stock, labor, and energyDesirable outputs: manufacturing output
Undesirable output: CO2 emissions
Yang et al. [11]Manufacturing industriesLabor, asset, and energyDesirable outputs: gross industrial output value
Undesirable output: CO2 emissions
Kang et al. [41]Manufacturing industryLabor, asset, and energy consumptionDesirable output: industrial value-added
Undesirable output: CO2 emissions
Emrouznejad and Yang [42]Light manufacturing industriesLabor, asset and energyDesirable outputs: Gross Industrial Output Value
Undesirable output: CO2 emissions
Table 2. Input and output indicators used in this study.
VariablesUnitsDefinitionsData Resource
Variable inputsLaborPersonThe annual average number of employed personnelChina Statistics Yearbook on High Technology Industry
Energy consumptionKt SCETotal consumption of all energy typesChina Energy Statistical Yearbook; http://www.ceads.net/data/
Fixed inputAssets100 million RMB yuanEconomic resources that can be measured in monetary termsChina Statistics Yearbook on High Technology Industry
Desirable outputsPatentPieceThe number of patent applicationsChina Statistics Yearbook on High Technology Industry
Sales revenue10,000 RMB yuanSales revenue of new productsChina Statistics Yearbook on High Technology Industry
Undesirable outputCO2 emissionsMtAverage GHG emissionshttp://www.ceads.net/data/
Table 3. Descriptive statistics for input and output variables during 2010–2015.
YearStatisticsLabor (person)Energy Consumption (Kt SCE)Assets (100 million RMB yuan)Patent (piece)Sales Revenue (10,000 RMB yuan)CO2 Emissions (Mt)
2015Mean482,950.036 4077.859 3602.437 5653.143 12,862,903.146 11.741
St.Dev.814,922.631 4498.175 5041.029 10,165.915 23,065,154.275 14.191
Max3,890,108.000 19,091.098 23,396.519 50,629.000 107,300,765.883 58.801
Min11,270.000 66.389 208.790 64.000 109,450.827 0.258
Median268,610.000 2497.846 2134.682 2400.500 5,395,556.571 7.184
2014Mean472,663.357 4014.042 3154.955 5951.643 12,210,364.046 11.515
St.Dev.810,213.032 4168.320 4529.664 11,551.278 20,957,089.708 14.424
Max3,872,690.000 17,194.896 20,926.831 58,119.000 95,829,398.941 60.281
Min7417.000 64.732 100.177 62.000 110,744.925 0.229
Median249,207.000 2574.036 1766.284 2112.500 4,416,525.596 6.335
2013Mean461,610.571 3926.611 2794.155 5104.643 10,028,263.489 11.895
St.Dev.802,099.366 4119.565 4059.598 9757.610 18,876,946.751 14.821
Max3,803,831.000 16,216.372 18,447.032 49,691.000 87,848,688.849 61.798
Min6726.000 52.269 77.158 58.000 126,353.417 0.229
Median224,917.000 2474.826 1483.138 2117.000 2,983,875.899 5.547
2012Mean452,714.357 3340.708 2521.541 4564.250 8,431,725.465 11.370
St.Dev.811,198.714 3701.806 3768.429 8918.651 17,326,078.498 14.508
Max3,842,156.000 14,221.251 17,085.780 45,449.000 78,666,235.457 58.542
Min7161.000 47.387 72.484 39.000 94,606.648 0.210
Median214,612.000 1848.413 1271.699 1689.000 1,959,469.067 5.443
2011Mean409,142.536 3383.951 2189.259 3615.071 7,596,671.672 11.661
St.Dev.763,903.207 3618.830 3453.653 7703.026 15,231,155.433 14.360
Max3,614,903.000 13,713.957 15,730.398 39,338.000 69,700,292.614 55.918
Min5612.000 42.001 56.723 54.000 61,770.833 0.199
Median204,627.000 2092.588 1041.572 1333.000 2,227,925.663 6.044
2010Mean389,591.429 3307.680 2046.279 2130.964 5,843,456.393 10.604
St.Dev.749,772.004 3645.856 3440.257 5089.295 12,195,594.898 13.348
Max3,547,488.000 13,288.428 16,273.900 26,740.000 60,464,340.000 50.501
Min6708.000 38.750 55.700 12.000 15,401.000 0.164
Median185,207.000 1961.722 900.250 691.000 1,354,860.500 5.815
Table 4. Green CU indicator during the six different years.
DMUs201020112012201320142015Average
ValueRank
Beijing0.000 0.000 0.000 0.000 0.000 0.000 0.000 1
Tianjin0.050 0.002 0.000 0.000 0.000 0.062 0.019 19
Hebei0.000 0.000 0.000 0.000 0.000 0.000 0.000 1
Shanxi0.000 0.000 0.000 0.000 0.000 0.000 0.000 1
Inner Mongolia0.000 0.000 0.000 0.000 0.000 0.000 0.000 1
Liaoning0.000 0.000 0.000 0.000 0.000 0.037 0.006 15
Jilin0.000 0.000 0.000 0.000 0.000 0.000 0.000 1
Heilongjiang0.000 0.000 0.000 0.000 0.243 0.049 0.049 24
Shanghai0.060 0.000 0.000 0.002 0.083 0.040 0.031 22
Jiangsu0.000 0.000 0.000 0.000 0.000 0.000 0.000 1
Zhejiang0.442 0.000 0.000 0.000 0.000 0.000 0.074 26
Anhui0.425 0.145 0.017 0.056 0.186 0.039 0.145 28
Fujian0.000 0.000 0.000 0.044 0.019 0.051 0.019 21
Jiangxi0.000 0.000 0.000 0.000 0.000 0.000 0.000 1
Shandong0.000 0.000 0.000 0.033 0.159 0.124 0.053 25
Henan0.000 0.000 0.000 0.000 0.000 0.000 0.000 1
Hubei0.000 0.000 0.000 0.029 0.000 0.049 0.013 18
Hunan0.000 0.000 0.000 0.000 0.000 0.000 0.000 1
Guangdong0.000 0.000 0.000 0.000 0.000 0.000 0.000 1
Guangxi0.000 0.000 0.000 0.000 0.000 0.000 0.000 1
Hainan0.599 0.000 0.000 0.022 0.000 0.000 0.104 27
Chongqing0.000 0.000 0.000 0.000 0.000 0.000 0.000 1
Sichuan0.000 0.000 0.000 0.000 0.076 0.038 0.019 20
Guizhou0.000 0.005 0.005 0.000 0.000 0.055 0.011 16
Yunnan0.018 0.009 0.050 0.000 0.000 0.000 0.013 17
Shaanxi0.000 0.000 0.000 0.000 0.000 0.000 0.000 1
Gansu0.110 0.016 0.039 0.005 0.000 0.053 0.037 23
Ningxia0.000 0.000 0.000 0.000 0.000 0.000 0.000 1
Eastern region0.115 0.000 0.000 0.010 0.026 0.028 0.030 -
Middle region0.071 0.024 0.003 0.014 0.031 0.015 0.026 -
Western region0.014 0.003 0.010 0.001 0.008 0.016 0.009 -
Northeastern region0.000 0.000 0.000 0.000 0.081 0.029 0.018 -
Average0.061 0.006 0.004 0.007 0.027 0.021 0.021 -
Table 5. Average green CU and the resultant decompositions.
YearAverage D ^ k Average D ^ k Average CU
20100.4480.5080.061
20110.4470.4530.006
20120.4590.4630.004
20130.4150.4220.007
20140.3630.3910.027
20150.3450.3660.021
Average0.4130.4340.021
Table 6. The quantity of actual and optimal variable inputs from 2010 to 2015.
Year X k L X k L X k E X k E
201010,908,560.00010,225,762.07992,615.03452,833.226
201111,455,991.00010,386,412.01594,750.62764,537.784
201212,676,002.00011,306,516.03893,539.81165,652.029
201312,925,096.00012,624,306.251109,945.09971,073.112
201413,234,574.00012,883,696.261112,393.17173,368.365
201513,522,601.00014,204,768.163114,180.04177,408.230
Table 7. The p-value of the Wilcoxon signed-rank test regarding variable inputs.
Year X k L X k E
20100.079 *0.001 ***
20110.003 ***0.013 **
20120.002 ***0.003 ***
20130.3340.016 **
20140.6160.001 ***
20150.3340.002 ***
* Indicates that the coefficient is significant at 0.1 level (2-tailed). ** Indicates that the coefficient is significant at 0.05 level (2-tailed). *** Indicates that the coefficient is significant at 0.01 level (2-tailed).
Table 8. The optimal variable inputs for Anhui.
Anhui201020112012201320142015
X k L 189,879.648252,315.153261,694.649296,279.782398,366.905487,423.505
X k E 958.3701858.6081328.6801427.1591292.1592098.346
ω k L 1.2971.6841.3971.4441.5801.826
ω k E 0.49600.9120.7860.7150.6120.901
X k L 146,412.000149,818.000187,326.000205,182.000252,133.000266,994.000
X k E 1932.6892037.7221689.8831994.8272110.7122329.205

