Abstract
As a massive solid waste, the high value-added utilization of coal gangue has received more and more attention in China. This study focuses on the utilization of coal gangue aggregate in railway engineering for coal transportation passage. Coal gangue aggregate was employed as high-grade railway subgrade filler andprepared concrete for roadbed drainage (named coal gangue roadbed protecting concrete—CGRPC). First, the basic properties of coal gangue such as particle size distribution, ignition loss, strength change under water softening, and compression performance were measured. Then, the technology to use coal gangue as filler in railway subgrade was put forward based on a real engineering application with the Jingang coal-carrying railway special line. Field tests showed that the coal gangue roadbed had excellent performance. The dynamic stiffness expressed as K30 was more 130 MPa/m, which meets the requirement for high-speed railway roadbeds. The distribution of vertical earth pressure according to the backfill depth showed a linear growing tendency. Finally, the technical and economic benefits of using coal gangue railway roadbeds were analyzed. The application of coal gangue near the railway line not only solved the problem of aggregate shortage in engineering construction, but it also consumes the coal gangue waste and leads to huge social benefits.
Highlights
- The basic properties of coal gangue are tested and evaluated.
- In situ construction methods of the coal gangue roadbed are provided.
- Coal gangue roadbed protecting concrete (CGRPC) with coal gangue aggregate can effectively protect the roadbed from attack.
- The technical and economic benefits for coal gangue applied in railway roadbed construction are analyzed.
1. Introduction
Coal gangue is normally seen as an industrial solid waste, and it is widely distributed in coal mining areas, such as northwest China or Newcastle (Australia). Coal gangue is a type of shale rich in minerals and has a similar hardness to gravel. Thus, it can be used as aggregate in concrete and subgrade fillers. Thanks to the development of sustainability technology, coal gangue has been widely recycled in construction [1,2], power plants [3], agriculture [3,4,5], and backfills [6]. This mineral not only has the properties of natural aggregate but also contains organic substances and can spontaneously combust [7,8]. These could improve the nutrient elements in cultivation soil [5] and could provide energy to generate heat [9]. For backfill application, its optimum gradation can help alleviate compressive deformation and particle breakage in mine goaf backfills [10]. Compared with these utilization methods, the backfill application of coal gangue is being quickly undertaken because it does not require further treatment and does not produce secondary pollution with its unhealthy elements (e.g., Hg or S). Although Zhang et al. [11] demonstrated that coal gangue is suitable for use as a lightweight aggregate in construction materials, its practical application is still relatively limited because concrete compressive strength requirements limit its usage as an aggregate. With the help of powder technology [12], coal gangue normally substitutes the cementation materials in brickmaking. Bricks do not have the same strict requirements regarding compressive strength. In this way, coal gangue can be utilized as fillers in roadbed construction.
At present, for roadbed construction, fillers are usually selected from consolidated soil and gravels. In some cases [13], the soil is unstable under the wet foundation. However, the development of transportation and building construction over the last 20 years have endangered gravel resources [14]. Selecting new materials to replace gravel in backfills is increasingly in demand. Before a new material is substituted, its feasibility should be demonstrated by in situ tests in the construction project. Similar to materials for roadbed construction, Chen et al. [13] conducted mechanical tests and micro observations for red mud waste, which could be a potential candidate filler in the loess subgrade. The requirement is that the cement should be added as a solidified agent at 5% of the total weight, but the cement has the negative effect of emitting CO2 from its production stream [15]. Without cement, other natural materials could also be used for cementation. Chang et al. [16] reported that using biomass without cement by combining sewage sludge with recycling aggregate could produce a road foundation with a strength of 1.8 MPa. The foundation backfills normally have a low compressive strength requirement, unlike the track plate materials over the foundation. A strength of over 40 MPa is needed in high-speed railway construction [17]. The foundation supports other components such as road surfaces, bridge piers, or even underground piles. The landfills of the foundation use a lot of gravel or soil, which are used as fillers. The quantity of the fillers should be guaranteed by its economic cost and wide availability, and coal gangue as a solid waste meets these requirements of being low cost and widely available. Therefore, reusing coal gangue in roadbed engineering can be regarded as effective. In recent years, An [18] studied the performance of coal gangue pavement in airport construction, and Yang et al. [19] used a theoretical analysis to promote the application of coal gangue in subgrade engineering. However, little research has reported on the practical application of coal gangue in roadbed construction, unlike waste slag [20]. Considering the difficulties in roadbed construction, the main challenge is to find methods that satisfy the use of coal gangue in practical settings.
During roadbed construction, the compactness of the fillers should be first guaranteed at the standard level, and the long-term stability or durability of the roadbed needs be improved as much as possible. In practice, big rollers are used for paving the roadbed. Whether or not the roadbed fillers can be successively constructed and employed, the compactness parameters such as K, K30, and Evd are needed to evaluate the compactness quality. These parameters characterize the roadbed’s resistance to deformation under the load and measure its strength and stiffness [21]. When the roadbed is paved and well-constructed, its stability should be extended as long as possible. Climate change and hydrogeology can affect roadbed stability. For example, the Qinghai–Tibet railway goes through over 200 km of “ice-rich” permafrost [22]. When the “warm” temperature (between 0 and −1 °C) approaches, thaw settlement can easily happen. For this reason, during the railway’s construction, air-cooled methods with U-shape rock revetments were used, and the embankment slope was covered with shade boards to protect it from solar radiation [22]. Additionally, hydrogeology problems can affect railway tunnels, resulting in the degradation of railway tunnel structures. For example, strength loss and surface cracks can occur in concrete. The corresponding mechanism is related to sulfate attack, which originates from the percolating, dripping, and bedewing of drainage water [23]. Based on the requirement of the long-term stability of the railway, roadbed durability should not be neglected.
The objective of this study was to find efficient methods to apply coal gangue in railway roadbed construction. Considering the practical application, research normally requires experimental results from field tests to support conclusions. The field tests in this study were based on the Jingang coal-carrying railway construction project. The site is in Zezhou county, Shanxi province, China. This is a traffic construction site where a special railway is planned for transporting coal near a coal cleaning plant and steel plant. The railway foundation used coal gangue as roadbed filler in the section DK 0+525 to DK 0+625, and the coal gangue was produced near the coal plant. Before the waste coal gangue was used, it was crushed and cleaned by water at the coal cleaning plant. The plant locations and the railway line are displayed in Figure 1. Moreover, the wastewater that was discharged from the chemical plant should be drained into a ditch along the railway line. Considering the low concrete strength required in the drainage ditch, the coal gangue was also used as the aggregate for preparing the roadbed protecting concrete (CGRPC). The railway was also enhanced with a clay slope and retaining wall at the sides. Finally, a transverse section of the railway is displayed in a schematic diagram (Figure 2).
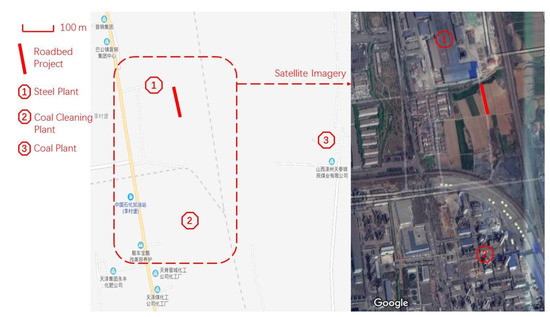
Figure 1.
The geographic information of the roadbed construction project. Provided from Google Maps (the left is the digital map, and the right is satellite imagery of the dashed line area on the left).
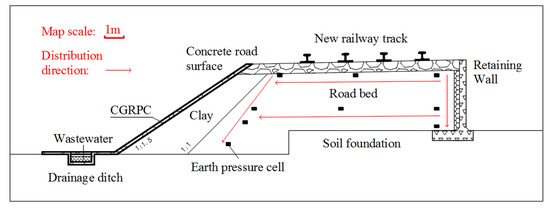
Figure 2.
Cross-section of the road with the map scale.
In this study, the coal gangue subgrade filler and CGRPC preparation were mainly discussed in the field examination. First, the basic properties of the coal gangue and the CGRPC preparation were introduced. Then, details of the roadbed construction and the performance of CGRPC were illustrated by combining the job site tests with indoor experiments. After the roadbed finished construction, the inside vertical earth pressure was measured, and its distribution law was investigated by pre-burying the earth pressure cells beforehand. Suggestions for improving the quality of the coal gangue roadbed were obtained. Considering that chemical wastewater generally has some sulfate salt, the CGRPC could be corroded [24]. Therefore, equivalent mortar specimens were prepared to research the resistance to sulfate attack under drying-wetting cycles. Finally, after the coal gangue was successfully applied in the roadbed construction, its technology and economic benefits were analyzed. From the perspective of the later railway construction, the positive social effects from this practical project could promote this coal gangue utilization technology.
2. The Basic Properties of Coal Gangue
2.1. Technical Properties of Coal Gangue Aggregate
In this study, coal gangue was produced by Shanxi Zezhou Coal Plant, and it was disposed of as stable solid waste. The coal cleaning plant used a machine crusher to crush the coal and cleaned it with water. Its gradation curve is shown in Figure 3a. The coefficient of uniformity (Cu) was 7.01 and the coefficient of curvature (Cc) was 1.92. According to the Chinese Standard TB10001-2016 [25], these coefficients satisfied the well-proportioned requirements of Cu < 10 and 1 ≤ Cc ≤ 3. To predict the coal gangue’s compressive strength, a rock point load test [26] was conducted on particles sized 9.75–16.5 mm. The traditional land filler is limestone, which typically has 32.3 MPa uniaxial compressive strength [27], and coal gangue has only half of this strength in nature (in Figure 3b). Based on the Chinese Standard CECS 239-2008 [28], therefore, coal gangue can be classified as soft rock for subgrade fillers. To avoid roadbed collapse from soft rock backfills, this study used a clay slope and retaining wall to immobilize the railway sides. Considering the water softening effect could lead to loss of aggregate strength, this study saturated the coal gangue with water for 24 h to investigate its resistance. It was found that about 35.4% strength reduction would be produced by the transition from the dry state to the saturated state. After testing the crushed index of the coal gangue and comparing it to the limestone (Figure 3c), Zezhou coal gangue was found to have the larger index, which met the standard TB 10414-2018 [29] that requires the railway backfill crushed index to be at or below 30%. The relation curve between dry density ρd (×103 kg/m3) and moisture content w (%) is shown in Figure 3d. It can be found that the maximum dry density was 2.22 × 10³ kg/m3 and the optimum moisture content was 6.6%.
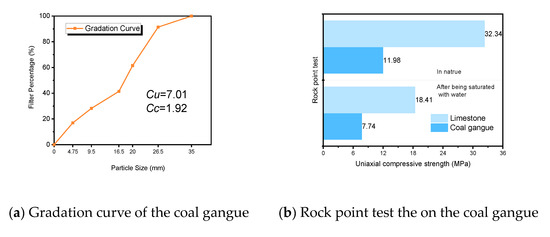
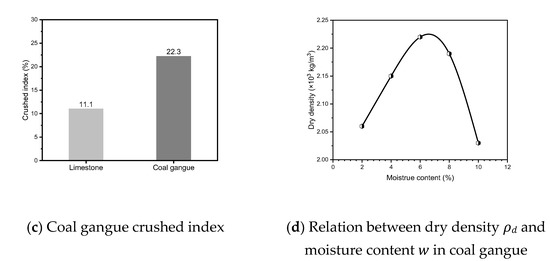
Figure 3.
Technician properties of Zezhou coal gangue being compared with.
Additionally, coal gangue’s other basic properties are listed in Table 1. The direct shear strength parameters (shear strength C and peak friction angle φ) [30] were also provided to evaluate its soil properties. According to code TB 10102-2010 [31] for the consolidation tests, the av of coal gangue was in the range of 0.025–0.1 MPa−1, and its Es was over 24.7 MPa. Hence, Zezhou coal gangue could be regarded as a low compressibility soil. The coal gangue’s ignition loss was no more than 20%, and its internal unstable ingredients did not promote spontaneous combustion [32,33]. Finally, the coal gangue’s chemical composition and mineral contents were also analyzed by XRF (X-ray Fluorescence) and XRD (X-ray Diffraction), and the results are shown in Table 2 and Figure 4, respectively. Overall, Zezhou coal gangue had similar properties to other land fillers, like soil and gravel, so it could potentially be used as roadbed backfill in railway construction.

Table 1.
Physical properties of coal gangue, including property comparisons with wet and soft loess.
Table 2.
The chemical compositions of the raw materials for CGRPC.

Figure 4.
Mineral contents in coal gangue.
2.2. Properties of CGRPC
2.2.1. Preparation
The CGRPC was prepared by utilizing coal gangue, which was designed to resist sulfate attack. Except when the height of the roadbed is over 6 m, the pressure stress of the protecting embankment materials should satisfy the design requirement of over 5.17 MPa [34]. Therefore, the mix proportions were in accordance with the water-tight concrete preparation, whose fine aggregate occupied 35%–45% in total aggregate and whose water-to-binder ratio was 0.45–0.6 [35]. Table 3 shows the CGRPC mix proportions, and their aggregates were different. CGRPC-G uniformly used the cleaned coal gangue in coarse and fine aggregate, CGRPC-S used the 0–4.75 mm river sand as the fine aggregate, and CGRPC-D used the dried coal gangue in both aggregates. The dried coal gangue’s internal natural water had been removed by the sun because, at the job site, the prepared coal gangue was normally exposed to the sun. Except for the aggregate, the cement was purchased from China United Cement Corporation (Located in Beijing, China), which was ASTM Type I cement. The chemical compositions of these materials are displayed in Table 2.
Table 3.
Mix proportions of the CGRPC and the mortar specimens in kg/m3.
The raw materials were firstly mixed without water for 2 min and then with water for an extra 2 min. A twin axles concrete mixer was used. Then, the mixtures were cast in the molds for 3 days. After that, the shaped mixtures (specimens) were demolded and transferred to a standard curing room (20 °C and 95% humidity) until being tested.
Next, for researching the CGRPC’s durability to resist sulfate attack, 40 × 40 × 160 mm3 mortar specimens were made following a previous sulfate corrosion study [36]. Although there were two different specimen types, their preparation was unified to reduce the disturbing factors. The water was provided from the local water plant, and it was different from the chemical wastewater. The two kinds of water were measured for their sulfate concentration by the method of spectrophotometric determination with barium chromate. Their sulfate concentrations were 13 and 164 mg/L, respectively, for the water and chemical wastewater. This difference meant that the resistance to sulfate attack needed be evaluated by the durability tests on CGRPC.
2.2.2. Properties
The 100 × 100 × 100 mm3 CGRPC specimens were prepared for the concrete strength tests. Their 7 day, 28 day, and 60 day compressive strengths and split tensile strengths were tested in accordance with ASTM C39 [37] and ASTM C496 [38]. There were three specimens for each mix in each test, and the results are shown in Figure 5. The CGRPC-S had over 10 MPa in the 28 day compressive strength test and over 1.5 MPa in the 28 day split tensile strength test. It can be illustrated that using coal gangue (coarse aggregate) and river sand (fine aggregate) in CGRPC could satisfy the strength requirement of the slope-protecting concrete [34]. When dried coal gangue was used in CGRPC-D, its 28 day compressive strength reduced to 5 MPa, down by 50% (Figure 5a). Although reducing the water will diminish the w/c (water-to-cement ratio), the flow and the workability of the specimen could be worse. Coal gangue presented with many distributed holes on its surface that could absorb some water [39]. When the water mixed in the raw materials, a part of the water was used in coal gangue, and the original water that was used for cement hydration decreased. Then, the content of the rest of water decreased to the point that fresh concrete could not fill the molds well and had worse workability. This poor filling could lead to the appearance defects on the specimens (Figure 6) and could result in a decline in strength afterward. However, the dried coal gangue did not cause noticeable deterioration to the split tensile strength (Figure 5b). Using river sand as fine aggregate could effectively raise about 0.5 MPa in the split tensile strength for CGRPC.
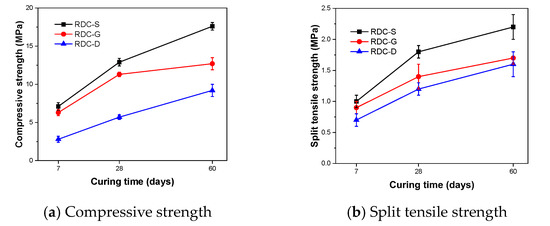
Figure 5.
Compressive strength of CGRPC concrete specimens.
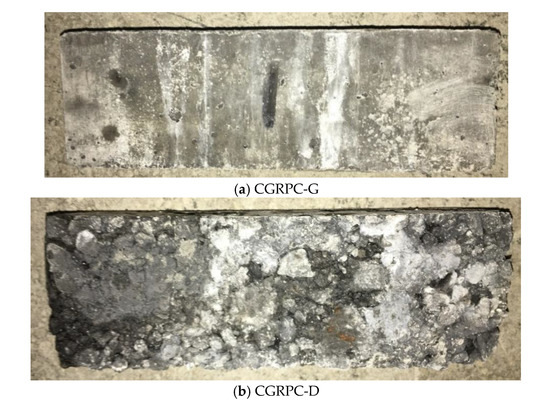
Figure 6.
Appearance comparison of 100 × 100 × 300 mm3 CGRPC specimens.
By using Young’s modulus tester, the CGRPC concrete specimens 100 × 100 × 300 mm3 in size were prepared to test the dynamic elastic modulus and dynamic shear modulus. After that, the relationship between elastic modulus and shear modulus can be expressed by Poisson’s ratio. Poisson’s’ ratio is calculated as Equation (1):
where E is dynamic elastic modulus (GPa), G is dynamic shear modulus (GPa), and v represents Poisson’s ratio.
Two dynamic modulus results of CGRPCs are listed in Table 4, followed by the respective Poisson’s ratio. Poisson’s ratio could reflect the horizontal elastic deformation of the CGRPC that was under pressure. With the curing time increasing from 28 days to 60 days, the Poisson’s ratio of CGRPC declined about 0.01–0.03. Additionally, replacing the river sand or dried coal gangue did not cause a noticeable difference in this ratio, which was frequently at 0.27 ± 0.03.
Table 4.
Elastic modulus of CGRPC specimens.
Next, to investigate the relationship between compressive strength and dynamic elastic modulus in CGRPC, this study referenced the power function models of low-strength coal gangue concrete [1] and 0–20 MPa regular concrete [40]. Meanwhile, considering CGRPC concrete was mixed with coal gangue, it could be regarded as lightweight concrete [11]. The power function model of coral concrete (lightweight concrete) [41] was also used for analyzing this relationship. By using the above power function models, the relationship between CGRPC’s elastic modulus and its compressive strength was built by the related Equations (2)–(4):
where Ec (×103 MPa) represents elastic modulus, and fc (MPa) represents compressive strength. wc of Equation (2) is the unit weight (kg/m3) of CGRPC and was calculated as 2350 kg/m3 from Table 3. Equations (2)–(4) are shown in Figure 7, which displays the relationship between Ec (×103 MPa) and fc (MPa). Because of the three R-squared (R2) values being over 0.7, the power functions could simultaneously fit the relationship well. So, the CGRPC showed similar mechanical characteristics with green low-strength concrete and lightweight aggregate concrete for predicting the compressive strength. Not only that, numerical investigation [42] also helped to simulate elastic deformation and stimulate fracture propagation for coal gangue CGRPC by using these proposed equations.
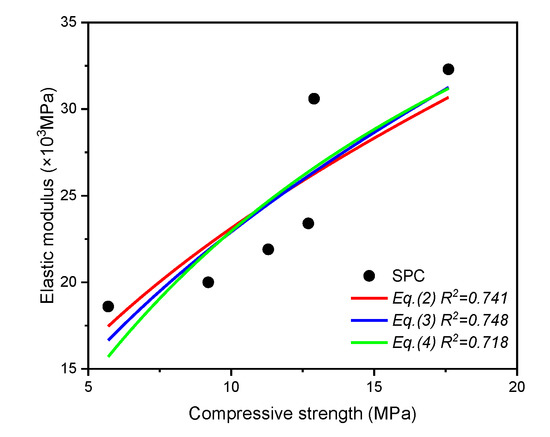
Figure 7.
The relationship between elastic modulus and compressive strength of CGRPC.
This study designed drying–wetting cycles and sulfate attack conditions for the CGRPC equivalent mortar specimens to simulate real sulfate corrosion. Following ASTM C109 [43], the mortar specimens were prepared with 40 × 40 × 100 mm3 size for testing the compressive strength and the flexural strength. There were three samples for each mixture in each flexural strength test. Half of the samples in the flexural strength tests were also measured for the compressive strength test. The specimens were immersed in 5% Na2SO4 solution when they were in the wetting period. Additionally, the groups that experienced the drying–wetting cycles with water were also set as the comparison specimens. During the cycles, to obtain the mortar specimens’ standard strength, each mix had numerous specimens that were cured in a standard curing room to measure 28, 35, 42, 56, and 84 day strength tests. Every drying–wetting cycle lasted 24 h, including 16 h of wetting and 8 h of drying. During 8 h of drying, the specimens were moved to a drying oven at a temperature of 60 °C. After 7, 14, 28, and 56 cycles (days), the mass, compressive strength, and flexural strength of the specimens were tested. To determine which mix had excellent durability, their mass loss rate (%), compressive strength loss (%), and flexural strength loss (%) of each mix after experiencing different cycles were calculated by their average values. When the specimen experienced n drying–wetting cycles, the mass loss rate can be expressed by Equation (5):
where represents its mass loss rate (%); represents the weight of the specimen before the drying-wetting cycles; and represents the weight of the specimen that experienced n drying-wetting cycles. Meanwhile, the compressive strength loss and the flexural strength loss can be expressed by using Equation (6):
where represents the strength loss (%); represents the strength of the specimen that experienced n drying-wetting cycles; and represents the standard strength of the specimen cured in a standard room for n cycles.
The mass loss rates of the specimens under the drying-wetting cycles with sulfate are shown in Figure 8. M-D could lose over 6% mass after 58 cycles, while these rates in M-G and M-D were only below 1.5%. The M-D specimens, being equivalent to CGRPC-D, were not cast in the same way because a lot of the mixing water was absorbed in the coal gangue. The emerging pores and seams were distributed from the surface and extended to the inside of the M-D specimens. Sulfate sodium precipitated and dissolved with the water evaporation and saturation during the drying-wetting cycles. When the sulfate precipitated at the specimens’ pores and seams, the crystallization pressure would crumble the surrounding cement paste [44]. The specimens were gradually damaged and more cracked cement paste fragments peeled off.
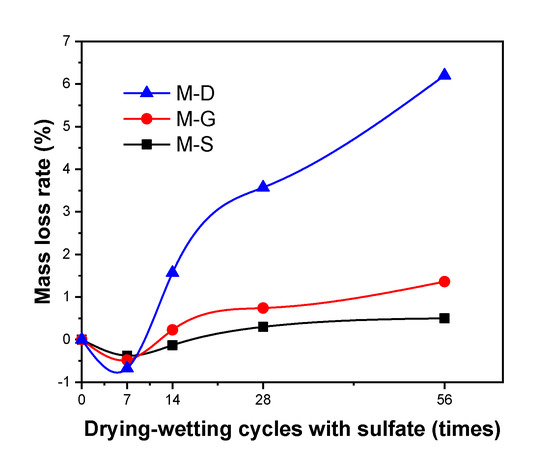
Figure 8.
Mass loss rate of the specimens under the drying-wetting cycles with sulfate.
The compressive strength loss and flexural strength loss of CGRPC mortar specimens under different conditions are shown in Figure 9. Whether drying-wetting cycles included sulfate or not, the specimens’ flexural strength and compressive strength both declined. Sulfate salt could accelerate the deterioration under drying-wetting conditions. For the flexural strength, after 56 drying-wetting cycles without sulfate, the strength loss of M-S increased up to 35% (Figure 9a). With sulfate addition under the same cycles, this percentage could grow to over 40% (Figure 9b). Replacing river sand with coal gangue could enormously decrease the flexural strength. The flexural strength loss rate in M-D reached 78.3% under 56 sulfate cycles. However, the compressive strength shows a different declining tendency. It can be seen that the compressive strength loss rate grew moderately, notably in M-G and M-S (Figure 9c,d). With the sulfate addition, the compressive strength loss rate of M-D increased to only 45%, and the percentages of M-S and M-G could be under 30%. When M-S experienced 56 cycles without sulfate, the compressive strength loss rate could be no more 10%. So, without sulfate mixed in, the drying-wetting cycles also deteriorated the mortar specimens’ properties to some extent. In this process, the specimens experienced a significant temperature change. Firstly, during the 60 °C drying phase, the specimen naturally thermally expanded, which originated from aggregate and cement. With the difference in the materials’ expansion coefficients, their volume changed differently. For the cement paste, its thermal expansion coefficient (α) was normally from 18 to 20 (10−6/°C) [45]; for the aggregate α, the river sand tested at 11.5 (10−6/°C), and the coal gangue was equivalent to granite (α = 8 × 10⁻⁶/°C) because their mineral components were similar to each other. Secondly, after the 60 °C drying progress, the specimens were cooled in water (20 °C). With water immersion, the body temperature of the specimen went down rapidly, and the volume changed corresponding to the respective cooling shrinkage coefficient (equal to α). During this transformation, the interface transition zone (ITZ) between aggregate and cement experienced inhomogeneous squeezing and slacking, which gradually led to failure due to the damaged seams. The ITZ gradually became more damaged with more drying–wetting (or thermal-cooling) cycles, so that the mortar became deteriorated. Not only that, but the ambient water could also penetrate inside the specimen along its damaged ITZ seams and soften the aggregate. Meanwhile, the bonding between cement and aggregate could be weakened by the water [46], and the mechanical properties of the specimens were severely affected. Therefore, replacing coal gangue with river sand in fine aggregate could effectively improve the resistance to sulfate, as it could strengthen the ITZ of the CGRPC.
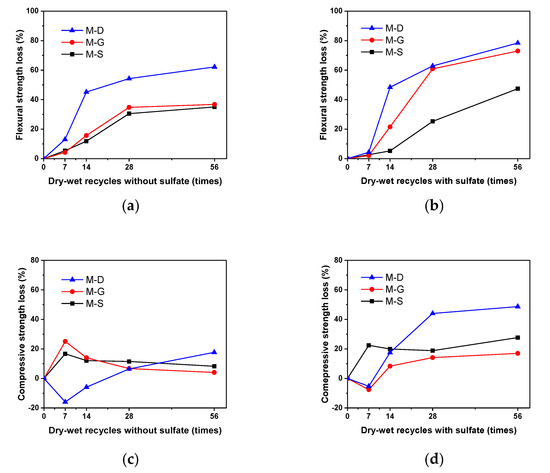
Figure 9.
Compressive strength and flexural strength loss of CGRPC mortar specimens under drying–wetting cycles with and without sulfate.
3. Application of Coal Gangue in Roadbed Construction
3.1. Coal Gangue as Subgrade Filler
3.1.1. Preparation Stage
Initially, the soil foundation was leveled and compacted by the roller machines, and the temporary drainage ditch was excavated. Figure 10a shows the in situ state of the soil foundation. Next, the coal gangue gravel was sieved to remove particles greater than 6 cm. The removed particles were amassed, crushed into smaller ones, and sieved again until they were able to be used. This sieved coal gangue gravel was mixed homogeneously before being transported by loader trucks. Apart from the materials, the required machinery equipment was also prepared in the operation area. The equipment included a shovel, dozer, grader, loader trucks, and the vibratory roller, and all of that was inspected in advance. The loader trucks needed to transport the prepared coal gangue frequently, and each truck could carry 15 m3 of coal gangue at once.
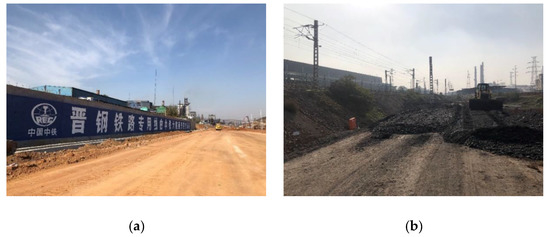
Figure 10.
The construction process of the coal gangue roadbed. (a) In situ state of the unconstructed roadbed after the soil foundation was paved. (b) Coal gangue gravel was homogeneously spread on the soil foundation.
3.1.2. Construction Technology
After finishing the preparation, there were four steps in the roadbed construction. The first was to homogeneously spread the coal gangue fillers on the soil foundation with formed gravel layers, and each layer’s thickness was 30 cm (Figure 10b). After every 60 cm of gravel layers formed by the shovel, the vibratory roller was driven to compact these gravel layers. The roller compacted a total of seven times, three times of static compacting and four times of vibratory compacting. The roller weighed more than 20 tons, and its speed was below 4km/h. The required driving methods and driving regulations of the roller complied with Q/CR 9651-2017 [47]. During compacting, the dimensions were continuously measured by the electronic total stations and the level rules. Finally, the roadbed was constructed comprising subsequent steps of paving the gravel layer. After the roadbed was paved to the designed height (4 m), one of the sides was excavated on the slope and was covered with the clay.
To analyze the serviceability of the coal gangue roadbed, the internal earth (coal gangue) pressure distribution should be investigated. There were two directions: horizontal and vertical distributions (shown in Figure 2). Nine earth pressure cells were pre-buried at specific positions along the DK 0+600 transverse when the roadbed was being constructed, and sensors were employed to detect the soil pressure. The buried cells’ positions were selected along the four distribution lines, which were the roadbed slope, the 0.5 m gravel layer, the 2 m gravel layer, and the vertical area behind the retaining wall (the specific positions are shown in Figure 2). The earth pressure cells were designed and produced by Changsha City B&K Electronics Technology Co., Ltd., Changsha, China. They were fixed in their positions and were initialized by a technician (seen in Figure 11a). They were linked to the outside tester by conductive lines that were protected with polyvinyl chloride tubes (abbreviated as PVC tubes in Figure 11b). The total earth pressure distribution inside the coal gangue roadbed could be obtained by combining these earth pressure results.
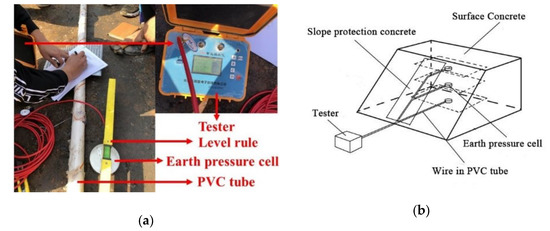
Figure 11.
The earth pressure cells were installed inside the roadbed. (a) Initializing operation; (b) how the sensors were linked.
3.1.3. Quality Control
The assigned professional directors were responsible for ensuring the quality of construction and technology throughout the entire process. After the roadbed neared completion (Figure 12a), its compaction quality was tested. Actually, the roadbed could be regarded as the compacted coal gangue fillers. This study used the K30 parameter to evaluate compactness, which is under the Standard TB 10414-2018 [29]. K30 is a conventional and more reliable value for controlling the compaction quality in bridges [21] and in the railway subgrade [48]. At the job site operation, the K30 measurement conformed to Chinese Standard [25], and the parameters were obtained by Static Plate Load (SPL) tests [21]. On the compacted gravel layer, a mm loading plate was used with a preload of 0.01 MPa for 30 s, then unloading and reloading was done with increasing the plate weight (this process is shown in Figure 12b). In this progress, the settlement degree that matched the load increment was recorded. K30 is defined as applied pressure divided by the settlement when the settlement degree reaches 1.25 mm. The related equation is as follows:
where is the recorded settlement (m) and is defined as 1.25 × 10⁻³ m in the K30 calculation; is the corresponding load pressure (MPa) when the settlement degree reaches 1.25 × 10⁻³ m.
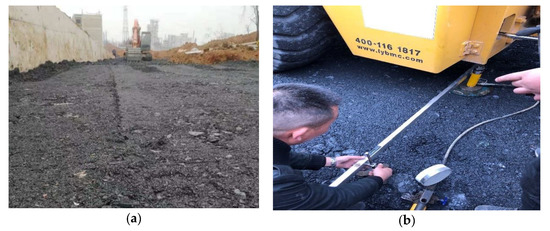
Figure 12.
Quality control of the constructed roadbed. (a) Paved coal gangue roadbed. (b) K30 test on the constructed roadbed.
Figure 13 shows the recorded settlement degree in the SPL test results. After being calculated by Equation (7), K30 of this roadbed was 162.9 MPa/m. Chen et al. [48] reported that K30 data should be more than 130 MPa/m for gravel backfills in high-speed railway subgrades. Typically, a high-speed railway has more stringent specifications than the railway subgrade. Therefore, the compactness quality of the coal gangue roadbed satisfied its application requirement.
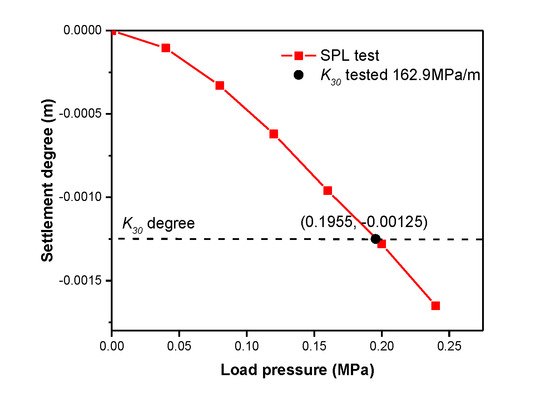
Figure 13.
Recorded settlement degree in the Static Plate Load (SPL) test.
3.1.4. Soil Pressure Distribution
The earth pressure distribution inside the roadbed is shown in Figure 14. Whether near the retaining wall or near the side slope, the soil pressure naturally went up as depth increased in the vertical directions (Figure 14a). It could be demonstrated that the deeper the cells were, the higher the gravity recorded. The earth pressure mainly originated from the over coal gangue gravity. According to the regression analysis on the earth pressure points, the soil pressure distribution could be regarded as a linear change (R-squared was more than 0.9). However, along with the slope depth, the pressure distribution did not show apparent linear change. Especially at the depth of 3.8 m, the increment of the pressure was largely high. As shown in Figure 2, the cells near the slope bottom undertook four material loads: surface concrete, coal gangue, clay, and CGRPC. Their different densities with different contents could support the inhomogeneous gravity of the bottom cell. Therefore, the pressure distribution showed irregular increments. Compared with these two earth pressure distributions at the same depth of 2 m, the earth pressure behind the wall was higher than the pressure near the slope. This was because at the depth 2 m near the slope, as Figure 2 shows, there was a large amount of coal gangue gravel. Large particles in the coal gangue could be crushed by compaction and be transformed into small particles, releasing the mutual stress that was originally from the contacted coal gangue. When the crushed particles were scattered, the stress disappeared, and the mutual pressure decreased.

Figure 14.
Vertical gravel pressure distributions. (a) Vertical distributions; (b) horizontal distributions.
The earth pressure distribution in the horizontal direction showed different characteristics. There was no obvious change in the earth pressure distribution at the depth of 0.5 m (Figure 14b). After the regression analysis, the slope of the fitting soil pressure distribution line was 0.67, showing almost no pressure change. At this level, the material directly above was surface concrete, which was uniformly pressed and had a low gravity load on the below layer. However, at 2 m depth, the pressure reached a peak value of 357 kPa and could be gradually decreased by extending away from the central roadbed. The retaining wall could limit the lateral displacement of the near-coal gangue. The near-coal gangue could distribute part of the gravity load to the wall and allocate a part of the pressure to the lateral wall. Thus, the soil pressure at 2 m depth near the retaining wall declined. In this way, the soil pressure at 2 m depth and at 6 m distance from the wall increased some, as the mutual pressure from the lateral coal gangue was loaded on. Similar to other cases [49], for the coal gangue roadbed more than 4 m in height, the methods of restricting the lateral displacement and preventing different gravel settlements were needed. A set-back gabion box to reinforce the retaining wall was proposed to restrict lateral displacement, effectively preventing the wall from deforming during construction. Thus, a reinforced retaining wall could be necessary in the construction methods when the coal gangue roadbed or coal gangue foundation is constructed at more than 4 m height.
3.2. Coal Gangue as Aggregate for Preparing CGRPC at the Job Site
At the construction site, the CGRPC-S mix was prepared with its excellent workability and great performance, as determined from the experimental tests. The in situ preparation is shown in Figure 15. The in situ preparation of fresh CGRPC-S concrete showed good flowability (Figure 15a). After being cast with the plastic molds for 3 days, the CGRPC surface was cast smoothly, and the various big holes were absent on the specimens’ surface (Figure 15b). Finally, the CGRPC was successfully applied in the roadbed drainage and the railway side slope (seen in Figure 15c,d).
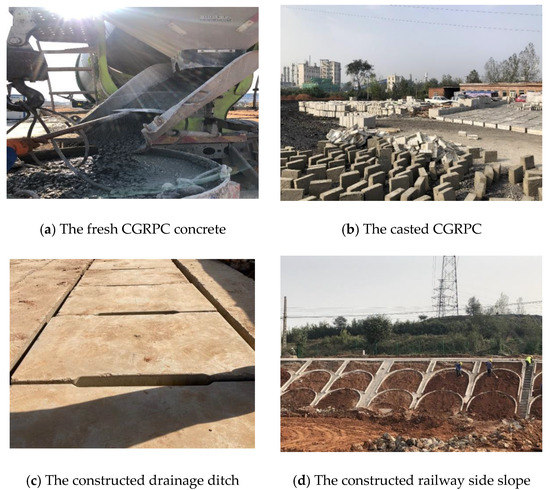
Figure 15.
Drainage ditch construction utilizing coal gangue as coarse aggregate.
4. Technical and Economic Benefits Analysis
4.1. Technical Benefits of Using Coal Gangue as Railway Backfill
In the past, many houses were constructed on a soil foundation. In some regions, the soil foundation was compacted and reinforced with wet and soft loess. Wet and soft loess are widely distributed around high-grade areas of the world. Notably, in the northwest area of China, it accounts for 640,000 total square kilometers [50]. However, in recent years, there have been technical challenges in constructing the high-speed railway in the loess area. Thus, substitute technology to improve soft soil foundations should be considered. This study compares the technical properties between wet and soft loess and Zezhou coal gangue to demonstrate the technical benefits of using coal gangue as railway backfill.
Based on the developed technology [51], the Xi’an Railway Survey and Design Institute adopted the dynamic compaction method to dispose of the collapsible loess. Then, by conducting tests on the wet and soft loess, the technical properties proved to be comparable to the Zezhou coal gangue in Table 1. It can be easily seen that the coal gangue subgrade in this study had higher cohesive strength and better compression resistance. Additionally, the compressive strength of the wet and soft loess was only at 500 kPa, much lower than coal gangue’s strength. Therefore, the loess will likely collapse when saturated with water.
Except for the above advantages, when the coal gangue backfill was compacted by the roller, coarse coal gangue particles were crushed and scattered as smaller-sized particles, then filled up voids in the backfill [52]. In this case, its particle size distribution was rearranged with an increasing fine particle ratio; thus, the backfill structure was improved and more tightly connected. Moreover, without any further treatment, it could also be used as the aggregate for preparing the protecting concrete, successfully solving gravel shortages during roadbed construction.
4.2. Economic Benefits of Using Coal Gangue as Railway Backfill
4.2.1. Construction Cost Savings
This study compared the construction costs between the coal gangue and soil backfills. These two materials can generally provide equivalent load abilities for the railway backfill, which was verified by the Chinese railway design code in the study [10].
In the Zezhou materials market, every 1 ton of coal gangue costs 10 CNY, including the transportation fee, while soil costs 25 yuan for the same mass. For constructing roadbed, there are other expenses still to be considered such as site storage fee, labor cost, machinery rent, and so forth. The soil and coal gangue have their own costs, and Table 5 shows these expenses. After summing them, it is clear that coal gangue can save 40 CNY per cubic meter of railway backfill construction.
Table 5.
Expenses of raw materials in roadbed construction.
4.2.2. Disposing Charge Savings
To reduce pollution from coal gangue and alleviate its land occupation, non-populated areas have been selected for storing the solid waste in recent years. In this way, expenses would incur related to field rent and waste transportation. Table 6 shows the expenses for the coal plant per ton of coal gangue disposal. From the perspective of environmental protection, utilizing coal gangue in roadbed construction can save 59 CNY per cubic meter disposal of solid waste.
Table 6.
The cost for a coal plant to dispose of coal gangue.
Overall, the cost savings and reduced charges could lead to economic benefits. Moreover, when the original coal gangue hills are consumed, air pollution and the land occupation will be alleviated for the society.
5. Conclusions
This study mainly combined indoor experiments and field tests to research solid waste utilization. Coal gangue was used as an aggregate for constructing the Jingang coal-carrying railway line. It was applied successfully in preparing the roadbed-protecting concrete and the roadbed backfills. The technology in this study could provide guidance and a reference for later coal gangue roadbed construction. From the test results, the below conclusions were drawn.
- Zezhou coal gangue, which was produced from the local coal plant, has a uniaxial compressive strength of over 11.98 MPa. Its uniaxial compressive strength was reduced by 35% under the transition from saturated state to dry state. Its compression resistance and cohesive preformation were better than that of wet and soft loess. In addition, it has qualified properties for use in railway construction. Before being applied in the roadbed, the excavated coal gangue needs to be cleaned and crushed so its uniformity and curvature coefficients are Cu < 10 and 1 ≤ Cc ≤ 3 and so its combustion ingredients can be removed. Its mechanical performance is not as good as limestone, and its shear performance (shear friction angle) is somewhat worse than loess, but immobilizing and protecting the subgrade side with clay or the retaining wall can alleviate roadbed collapse.
- The proposed construction methods in this study successfully utilized coal gangue to construct the railway roadbed. In the compacting process, the 4 km/h speed roller needs to repeat compacting seven times (three times static compacting and four times vibratory compacting). K30 can be used as the index for controlling the roadbed compactness quality, and this index reached 162.9 MPa/m in the field test. Near the slope and by the retaining wall, the soil pressure grew with the linear increments along with the roadbed depth. At 0.5 m roadbed depth, the soil pressure distribution had little variation in the horizontal direction. However, at 2 m depth of the roadbed, the soil pressure was at its peak in the central section. For constructing a 4 m or higher coal gangue roadbed, a reinforced retaining wall should be necessarily considered.
- The CGRPC prepared with coal gangue and sand can protect the roadbed from the sulfate in wastewater. Its equivalent mortar specimens (M-S) could retain 99% mass, 50% flexural strength, and 70% compressive strength after 56 drying-wetting cycles with 5% Na2SO4 solution. In the preparation, by mixing with cleaned coal gangue, the CGRPC workability and flow could be maintained. Hence, the cleaned coal gangue can avoid being dried by the high temperature or the sun. This can improve the workability of fresh concrete and alleviate sulfate salt corrosion on the concrete surface.
- Applying coal gangue in railway roadbed construction can alleviate traditional aggregate shortages when preparing protective concrete with the help of its technical properties. Compared to soil for the same construction, coal gangue simultaneously economized 40 CNY in raw materials and saved 59 CNY in solid waste disposal. At the same time, a green environment could be promoted for society.
Author Contributions
Conceptualization, K.M. and G.L.; methodology, L.L.; software, L.L.; validation, L.L., M.W. and C.B.; formal analysis, L.L.; investigation, L.L.; resources, C.B.; data curation, L.L.; writing—original draft preparation, L.L.; writing—review and editing, G.L.; visualization, S.Z.; supervision, S.Z.; project administration, C.B.; funding acquisition, C.B. All authors have read and agreed to the published version of the manuscript.
Funding
This research received no external funding.
Acknowledgments
The authors of this article highly appreciate the financial support from the Xi’an Railway Survey and Design Institute Co, Ltd., Grant No. 738010875.
Conflicts of Interest
The authors declare no conflict of interest.
References
- Li, L.; Long, G.; Ma, K.; Ma, H.; Wang, W.; Zhang, C.; Xie, Y. Preparation of Green Low Strength Mixture for Foundation Reinforcement Treatment by Using Fly Ash and Waste Coal Gangue. Materials 2020, 13, 664. [Google Scholar] [CrossRef]
- Long, G.; Li, L.; Li, W.; Ma, K.; Dong, W.; Bai, C.; Zhou, J.L. Enhanced mechanical properties and durability of coal gangue reinforced cement-soil mixture for foundation treatments. J. Clean. Prod. 2019, 231, 468–482. [Google Scholar] [CrossRef]
- Li, J.; Wang, J. Comprehensive utilization and environmental risks of coal gangue: A review. J. Clean. Prod. 2019, 239, 117946. [Google Scholar] [CrossRef]
- Wang, J.; Qin, Q.; Hu, S.; Wu, K. A concrete material with waste coal gangue and fly ash used for farmland drainage in high groundwater level areas. J. Clean. Prod. 2016, 112, 631–638. [Google Scholar] [CrossRef]
- Ma, S.; Lu, P.; Li, C.; Guo, Z.; Nie, X. Effect of Soil Amendments on Growth of Soybean in Coal Gangue Contaminated Soil. J. Ecol. Rural Environ. 2011, 27, 101–103. [Google Scholar]
- Zhang, X.; Lin, J.; Liu, J.; Li, F.; Pang, Z. Investigation of Hydraulic-Mechanical Properties of Paste Backfill Containing Coal Gangue-Fly Ash and Its Application in an Underground Coal Mine. Energies 2017, 10, 1309. [Google Scholar] [CrossRef]
- Zhang, Y.; Wang, Q.; Zhou, M.; Fang, Y.; Zhang, Z. Mechanical properties of concrete with coarse spontaneous combustion gangue aggregate (SCGA): Experimental investigation and prediction methodology. Constr. Build. Mater. 2020, 255, 119337. [Google Scholar] [CrossRef]
- Tang, Y.; Wang, H. Laboratorial Investigation and Simulation Test for Spontaneous Combustion Characteristics of the Coal Waste under Lean-Oxygen Atmosphere. Combust. Sci. Technol. 2018, 192, 46–61. [Google Scholar] [CrossRef]
- Wang, S.; Luo, K. Atmospheric emission of mercury due to combustion of steam coal and domestic coal in China. Atmos. Environ. 2017, 162, 45–54. [Google Scholar] [CrossRef]
- Li, M.; Li, A.; Zhang, J.; Huang, Y.; Li, J. Effects of particle sizes on compressive deformation and particle breakage of gangue used for coal mine goaf backfill. Powder Technol. 2020, 360, 493–502. [Google Scholar] [CrossRef]
- Zhang, Y.; Ling, T.-C. Reactivity activation of waste coal gangue and its impact on the properties of cement-based materials—A review. Constr. Build. Mater. 2020, 234, 117424. [Google Scholar] [CrossRef]
- Wu, D.; Yang, B.; Liu, Y. Transportability and pressure drop of fresh cemented coal gangue-fly ash backfill (CGFB) slurry in pipe loop. Powder Technol. 2015, 284, 218–224. [Google Scholar] [CrossRef]
- Chen, R.; Cai, G.; Dong, X.; Mi, D.; Puppala, A.J.; Duan, W. Mechanical properties and micro-mechanism of loess roadbed filling using by-product red mud as a partial alternative. Constr. Build. Mater. 2019, 216, 188–201. [Google Scholar] [CrossRef]
- Huang, W.-L.; Lin, D.-H.; Chang, N.-B.; Lin, K.-S. Recycling of construction and demolition waste via a mechanical sorting process. Resour. Conserv. Recycl. 2002, 37, 23–37. [Google Scholar] [CrossRef]
- Hussain, S.; Kumar, M.; Pareek, R. An Experimental Study of Marble Powder as Partial Replacement of Cement in Concrete. J. Gujarat Res. Soc. 2019, 21, 1828–1833. [Google Scholar]
- Chang, Z.; Long, G.; Zhou, J.L.; Ma, C. Valorization of sewage sludge in the fabrication of construction and building materials: A review. Resour. Conserv. Recycl. 2020, 154, 104606. [Google Scholar] [CrossRef]
- Long, G.; Liu, H.; Ma, K.; Xie, Y.; Li, W. Development of High-Performance Self-Compacting Concrete Applied as the Filling Layer of High-Speed Railway. J. Mater. Civ. Eng. 2018, 30, 04017268. [Google Scholar] [CrossRef]
- An, Y. Study on Stability and Durability of Coal Gangue Used in Runway Base; IOP Conference Series: Materials Science and Engineering; IOP Publishing: Bristol, UK, 2019. [Google Scholar]
- Yang, X.; Zhang, Y.; Li, Z. Embankment Displacement PLAXIS Simulation and Microstructural Behavior of Treated-Coal Gangue. Minerals 2020, 10, 218. [Google Scholar] [CrossRef]
- Chen, M.; Wen, P.; Wang, C.; Chai, Z.; Gao, Z. Evaluation of particle size distribution and mechanical properties of mineral waste slag as filling material. Constr. Build. Mater. 2020, 253, 119183. [Google Scholar] [CrossRef]
- Fei, J.; Xiao, J.; Jie, Y.; Han, K.; Yang, C. In-situ test study on compaction control parameters for particular subdivisional railway earthworks. Int. J. Pavement Eng. 2019, 1–10. [Google Scholar] [CrossRef]
- Cheng, G.; Sun, Z.; Niu, F. Application of the roadbed cooling approach in Qinghai–Tibet railway engineering. Cold Reg. Sci. Technol. 2008, 53, 241–258. [Google Scholar] [CrossRef]
- Long, G.-C.; Xie, Y.-J.; Deng, D.-H.; Li, X.-K. Deterioration of concrete in railway tunnel suffering from sulfate attack. J. Central South Univ. 2011, 18, 881–888. [Google Scholar] [CrossRef]
- Du, J.; Li, G.; Wu, J. Concrete sulfate corrosion coupled with hydraulic pressure. Mar. Georesources Geotechnol. 2019, 38, 40–47. [Google Scholar] [CrossRef]
- National Railway Administration of the People’s Republic of China. TB10001-2016, Code for Design of Railway Earth Structure; National Railway Administration of the People’s Republic of China: Beijing, China, 2016.
- Liu, Q.-S.; Zhao, Y.-F.; Zhang, X.-P. Case study: Using the point load test to estimate rock strength of tunnels constructed by a tunnel boring machine. Bull. Int. Assoc. Eng. Geol. 2017, 78, 1727–1734. [Google Scholar] [CrossRef]
- Linhao, L.; Guchangcheng, L.; Chaoneng, B.; Yuan, S.; Kunlin, M.; Shen, Z. Durability of Coal Gangue and Its Interfacial zone with Cement Stone Under Dry—Wet Cycles. Coal Eng. 2019, 51, 153–159. (In Chinese) [Google Scholar]
- CECS 239-2008, Standard for Identification and Description of Rock & Rock Mass; China Association for Engineering Construction Standardization: Beijing, China, 2008.
- Ministry of Railways of the People’s Republic of China. TB 10414-2018, Standard for Acceptance of Earthworks in Railway; Ministry of Railways of the People’s Republic of China: Beijing, China, 2018.
- Hazirbaba, K. Large-scale direct shear and CBR performance of geofibre-reinforced sand. Road Mater. Pavement Des. 2017, 19, 1350–1371. [Google Scholar] [CrossRef]
- Ministry of Railways of the People’s Republic of China. TB 10102-2010, Code for Soil Test of Railway Engineering; Ministry of Railways of the People’s Republic of China: Beijing, China, 2010.
- JTG F10-2006, Technical Specification for Construction of Highway Subgrades; China Communications Press: Beijing, China, 2006.
- JTG D30-2015, Specifications for Design of Highway Subgrades; China Communications Press: Beijing, China, 2015.
- Li, H.; Chen, H.; Li, X.; Zhang, F. Design and construction application of concrete canvas for slope protection. Powder Technol. 2019, 344, 937–946. [Google Scholar] [CrossRef]
- JGJ 55-2011, Specification for Mix Proportion Design of Ordinary Concrete; Ministry of Housing and Urban-rural Development of the People’s Republic of China: Beijing, China, 2011.
- Atahan, H.N.; Arslan, K.M. Improved durability of cement mortars exposed to external sulfate attack: The role of nano & micro additives. Sustain. Cities Soc. 2016, 22, 40–48. [Google Scholar] [CrossRef]
- ASTM Standard C39/C39M-1, Standard Test Method for Compressive Strength of Cylindrical Concrete Specimens; ASTM International: West Conshohocken, PA, USA, 2010.
- ASTM Standard C496/C496M-11, Standard Test Method for Splitting Tensile Strength of Cylindrical Concrete Specimens; ASTM International: West Conshohocken, PA, USA, 2004.
- Liu, B.; Tang, Z.; Dong, S.; Wang, L.; Liu, D. Vegetation recovery and groundwater pollution control of coal gangue field in a semi-arid area for a field application. Int. Biodeterior. Biodegradation 2018, 128, 134–140. [Google Scholar] [CrossRef]
- Chen, P.; Zheng, W.; Wang, Y.; Chang, W. Creep model of high-strength concrete containing supplementary cementitious materials. Constr. Build. Mater. 2019, 202, 494–506. [Google Scholar] [CrossRef]
- Da, B.; Yu, H.; Ma, H.; Tan, Y.; Mi, R.; Dou, X. Experimental investigation of whole stress-strain curves of coral concrete. Constr. Build. Mater. 2016, 122, 81–89. [Google Scholar] [CrossRef]
- Zheng, H.; Pu, C.; Sun, C. Numerical investigation on the hydraulic fracture propagation based on combined finite-discrete element method. J. Struct. Geol. 2020, 130, 103926. [Google Scholar] [CrossRef]
- ASTM C109, Standard Test Method for Compressive Strength of Hydraulic Cement Mortars; American Society for Testing and Material: West Conshohocken, PA, USA, 2002.
- Choudhary, A.; Malik, M.; Tiwari, S.; Dubey, A.; Sharma, U.; Kumar, A. Concrete deterioration due to sulphate-A case study. Mater. Today Proc. 2018, 5, 17952–17957. [Google Scholar] [CrossRef]
- Zhu, X.; Dai, Z.; Ling, J.; Chen, L. Thermal expansion prediction of cement concrete based on a 3D micromechanical model considering interfacial transition zone. Constr. Build. Mater. 2018, 171, 891–900. [Google Scholar] [CrossRef]
- Byun, Y.-H.; Hong, W.-T.; Yoon, H.-K. Characterization of Cementation Factor of Unconsolidated Granular Materials Through Time Domain Reflectometry with Variable Saturated Conditions. Materials 2019, 12, 1340. [Google Scholar] [CrossRef] [PubMed]
- Q/CR 9651-2017, Technical Regulation of Passenger-Freight Railway Subgrade Engineering; China State Railway Group Co., Ltd.: Beijing, China, 2017.
- Chen, A.; Su, C.; Tang, X.; Chen, J. Construction Technology of Large Thickness Vibratory Compaction of Hard Rock Embankment. E3S Web Conf. 2019, 136, 04025. [Google Scholar] [CrossRef]
- Yang, G.; Zhang, Z.; Yongli, D.U.; Lin, Y. Study of coal gangue composite reinforced retaining wall embankment slope by using site tests. J. Railw. Sci. Eng. 2017, 14, 1382–1390. (In Chinese) [Google Scholar]
- Li, W.; Zhuang, Q.; Wu, W.; Wen, X.; Han, J.; Liao, Y. Effects of ridge–furrow mulching on soil CO2 efflux in a maize field in the Chinese Loess Plateau. Agric. For. Meteorol. 2019, 264, 200–212. [Google Scholar] [CrossRef]
- Liu, Q. Study on Treatment Method of Wet and Soft Loess Foundation; IOP Conference Series: Earth and Environmental Science; IOP Publishing: Bristol, UK, 2019; p. 062078. [Google Scholar]
- Wang, F. Study on Grading Evolution and Deformation of Rockfill Materials Considering Particle Breackage; Dalian University of Technology: Dalian, China, 2018. (In Chinese) [Google Scholar]


© 2020 by the authors. Licensee MDPI, Basel, Switzerland. This article is an open access article distributed under the terms and conditions of the Creative Commons Attribution (CC BY) license (http://creativecommons.org/licenses/by/4.0/).