Abstract
The European Union (EU) Framework Programmes represent the ideal platform for exchanging knowledge potentially leading to innovation outcomes, in addition to providing vital research funds for various types of organisations (firms, universities, agencies, etc.) The present paper aims to assess whether innovativeness (‘innovation-driven’ participation) or energy demand/vulnerability (‘challenge-driven’ participation) determine a different degree of participation in the context of the energy programme funded under Horizon 2020 (2014–2020 period). By combining social network analysis and econometrics, our empirical analysis clearly shows that the more innovative EU regions hold a central or key position, while the regions characterised by higher energy demand or vulnerability play a marginal role in the EU energy network. These findings are not dissimilar to what other scholars have observed in relation to different EU programmes and funding schemes. Based on this, we argue that EU policymakers and evaluators should aim at encouraging challenge-driven participation and, more generally, a more balanced participation through appropriate and specific policy actions.
1. Introduction
The transition to a climate-neutral society by 2050 is among the top priorities of European Union (EU) policy and represents one of the core pillars of the European Green Deal. A systemic approach to energy policy has been implemented in the EU. Its aims include eliminating pollution, ensuring sustainable and environmentally friendly production cycles and fostering opportunities for alternative and cleaner sources of energy [1].
Recent conceptual work on green innovation distinguishes between the generation (production or supply side) and application (demand side) of green technologies that contribute to mitigating climate change and other environmental issues [2]. Regions are said to vary markedly in their capacity to develop and produce new green products and solutions due to different endowments of assets such as knowledge, skilled workers, finance, favourable institutional set ups, etc. [3]. Regions also face different kinds of environmental challenges that call for the adoption and use of green innovation (developed in the region or elsewhere) [2]. Arguably, regions are diverse and a number of different challenges and opportunities for energy transition may be found in different types of regions. We contend that both strong innovation capacities (supply side) and the need to solve environmental challenges (demand side) may explain why regional organisations take part in international energy innovation networks. In this article, the former is referred to as ‘innovation-driven’ participation, while the latter is called ‘challenge-driven’ participation.
Based on these premises, the present article aims at determining whether regional innovativeness (proxied by the position of a region in the Regional Innovation Scoreboard—hereafter RIS) or energy demand or vulnerability (proxied by heating and cooling degree days (HCDD) and energy vulnerability index (EVI), respectively) are associated with node centrality and key positioning in the ‘Energy’ network created within Horizon 2020 (H2020–ENERGY), i.e., the current EU Framework Programme (FP). We presume that performing better in the RIS can be related to capacity to develop and produce energy innovations, while higher energy demand (HCDD) or vulnerability (EVI) are primarily related to the application of energy innovations. Therefore, we address the following research question: Do the research projects funded under H2020–ENERGY mainly foster the generation or application of energy innovations in the EU regions involved?
Although the transition to cleaner and renewable energy systems seems to be at the core of the political debate worldwide, the potential of renewable energy sources, the adoption of new technologies and, more generally, the development of an efficient energy framework are still far from being achieved in many countries [4]. According to the European Commission, H2020–ENERGY is designed to support the transition to a reliable, sustainable and competitive energy system. The EU has allocated €5139 million throughout the 2014–2020 period to fund research projects related to crucial energy issues and has identified three main priorities in the context of the H2020–ENERGY programme: energy efficiency, low-carbon technologies, and smart cities and communities [5].
Recently, Geels et al. applied a multi-level perspective to energy transition, entailing “major changes in the ‘socio-technical systems’ that provide societal functions such as mobility, heat, housing, and sustenance” [6] (p. 464). According to the authors, an interdependent and co-evolving mix of technologies, supply chains, infrastructures, markets, regulations, user practices, and cultural meanings are needed for the successful transition to a new socio-technical framework [6]. Among others, Schmidt et al. stressed the importance of effective policy measures in fostering environmental technological change [7]. In this regard, the participation of different types of regional organisations in collaborative research and development projects can be seen as a critical tool for developing niche technologies within a broader systemic approach to energy and, more generally, sustainability transitions [8,9].
As noted above, some regions show a strong endowment of skills, competences and expertise that allow them to succeed in the extremely competitive funding schemes periodically launched by the European Commission. Based on this, we argue that innovativeness may determine a high level of participation of more competitive and dynamic regions in the H2020–ENERGY. On the other hand, a high energy demand and a stronger need for transition towards more sustainable production and consumption patterns may motivate regional organisations to participate. Both innovativeness and energy demand (or vulnerability) might thus represent drivers for regional participation in H2020–ENERGY.
Innovation-driven participation: We argue that the capacity of regions to take part in international energy innovation networks is primarily related to innovativeness (i.e., proxied by the RIS ranking, in our study) by virtue of critical factors such as well-functioning research systems, high degree of entrepreneurship, competences, technologies [10] and strong institutions [11,12]. These elements can be generally found in well-organised and successful regional innovation systems [13].
Challenge-driven participation: We deem that energy demand or vulnerability are mainly related to the application of new technologies and solutions in the energy field. Intuitively, more vulnerable regions are generally characterised by energy-intensive and polluting industries (proxied by EVI), while regions showing a higher energy demand are situated in geographical areas that require a considerable employment of energy because of climate conditions (proxied by HCDD) [14]. The possibility of benefiting from new applications may trigger participation in H2020–ENERGY of those regions that, more than others, are called to face energy poverty or vulnerability.
The geographical structure and coordination of innovation activities play a key role in the knowledge exchange dynamics that potentially lead to transition processes and new development paths [15]. Innovation is primarily an interactive process [16,17] and cooperation with firms, research establishments, agencies, venture capitalists, etc., enables regional organisations to benefit from access to capital, resources, new skills and fresh ideas [18,19]. The innovation networks fostered by the EU FPs, including the H2020–ENERGY, represent the most important research and innovation policy implemented by the EU and the ideal platform for knowledge circulation potentially leading to relevant and effective innovation outcomes [20]. In fact, the EU FPs precisely aim at promoting multi-scalar innovation networks in which organisations from three or more different countries cooperate in cutting-edge joint research projects [21].
Scholarly work has dealt with the structural features of the collaborations established in the context of the various EU programming cycles, providing several interesting findings. Among other things, the networks created within the EU FPs are characterised by clearly identifiable hubs and a core of connected actors, which tend to remain largely unaltered throughout the various EU programming cycles [22]. In general, such network cores comprise more innovative and competitive regions [23] and largely overlap with the level of development of the areas involved [24]. Particularly interesting for our empirical analysis, a recent study showed that both the quality of regional research establishments and the need for greening the economy play a relevant role in mobilising regional participation. In particular, these two elements have enhanced different regional development paths in Norway; i.e., branching in oil dependent regions and path creation in regions with stronger research capacity, although the number of the former dominates the participation of the Norwegian organisations [9].
The studies reviewed above provide us with the background for our network and statistical analyses and let us hypothesise that more innovative regions play a central role in the H2020–ENERGY network under analysis (see also [25,26,27] in this regard).
2. Materials and Methods
We adopted social network analysis (SNA) and econometrics for assessing the existence of an association between node centrality or key positioning and innovativeness, energy demand or vulnerability. Network data was collected through the CORDIS database. Overall, 230 projects funded under the H2020–ENERGY programme, involving organisations located in 221 EU regions (NUTS 1 or 2 level based on how they are classified on the RIS), were surveyed. A case-by-case matrix in which the EU regions represent the cases was reconstructed. Two regions were considered as connected to each other when the respective regional organisations participated in at least one joint research project funded under the H2020–ENERGY programme. SNA methods and techniques, such as overall density, density by groups, degree centralisation and core-periphery model, were applied for carrying out our network analysis.
Moreover, we used centrality measures (i.e., degree, eigenvector and betweenness) and ego-networks (structural holes) as dependent variables, representing node centrality and key positioning, respectively. Degree centrality refers to the overall number of ties established by each region under analysis. Eigenvector allowed us to determine the influence that each region has within the H2020–ENERGY network (i.e., connections to high-scoring nodes contribute more to the score of a given region than connections to low-scoring nodes). Betweenness captures the importance of a node based on the probability that it lies along all the possible paths connecting the nodes of the network. Specifically, betweenness centrality allowed us to identify the regions that mainly ‘control’ the knowledge transfer between the regional areas under analysis. Finally, a structural hole can be defined as a ‘broker’, i.e., a node representing the only connection between other nodes. In our case study, a structural hole is a region that lies in a strategic position since, among other things, it can benefit from novel and non-redundant knowledge and potentially exclude a varying number of other regions from competition for resources [28].
The Tweedie model was applied in our main econometric models and robustness test by virtue of the dependent variables that we employed (i.e., non-integer normalised variables characterised by exponential type distribution; see Figure 1). Moreover, a second test was carried out with the aim of determining whether our results remain robust even when a different econometric method is adopted. In particular, we used the Tobit model for assessing the impact of ‘zeros’ (non-participating regions) and low scoring regions in terms of degree centrality on the actual regional participation in the H2020–ENERGY programme.
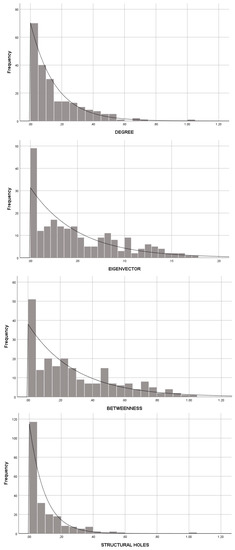
Figure 1.
Degree, eigenvector, betweenness and structural holes—exponential distribution.
We used three main independent variables in the applied econometric models. As specified above, RIS was used as a proxy for regional innovativeness (four categorical variables—modest, moderate, strong and leader innovators), while regional weighted annual HCDD (four categorical variables ranging from 0–0.125 to >0.375) and EVI (binary variables) were used for measuring energy demand and vulnerability, respectively.
More specifically, the RIS is an index periodically issued by the European Commission, which comprises 18 indicators related to categories such as ‘innovation enablers’, ‘firm activities’ and ‘innovation outputs’ at the regional level (see [29] for details). The RIS is considered the regional extension of the European Innovation Scoreboard (which captures innovation performances at the country level) and is frequently used in the geography of innovation studies for providing a measure of regional innovativeness (e.g., [30,31,32]). The RIS represents a reliable and up-to-date source for comparing regional innovation performances of the EU and associated countries (i.e., Norway, Serbia and Switzerland), even though the index is not exempt from criticism (see, e.g., [29,33]). Among other shortcomings, Trippl et al. [29] emphasized the lack of available data regarding some specific categories (e.g., ‘innovation enablers’) and regional areas in given countries, while Edquist et al. [33] argue that alternative measures seem to be necessary since “sampling variation and measurement errors […] may polarize results and bias the […] associated rankings”. Although [33] specifically refer to the European Innovation Scoreboard (i.e., country level), similar considerations can be extended to the RIS and its application. Keeping in mind these relevant remarks and considering the specific characteristics of the energy sector, we decided to adopt an alternative version of the RIS in the second robustness test we carried out. Among other things, the energy sector is defined as “a large scale, project-oriented industry” [34] (p. 6) whose market is driven by larger and more powerful firms (e.g., [35]). These peculiarities led us to ignore the RIS indicators specifically addressing innovation in small and medium enterprises (SMEs) (i.e., ‘SMEs innovating in-house’ and ‘Innovative SMEs collaborating with others’). Moreover, we omitted RIS indicators such as ‘Trademark applications’ and ‘Design applications’ (referring to branding or aesthetic features) since they might be of relative importance when considering the energy sector. In this way, we scrutinized each RIS indicator and, at the end of the process, we were able to build the aforementioned adapted index based on the average scores of the indicators we selected (i.e., ‘Product or process innovators’, ‘Patent applications’, ‘Employment in high-technology industries and knowledge-intensive services’, and ‘Sales of new-to-market and new-to-firm innovations’; see Appendix A for details). This narrower version of the RIS primarily refers to ‘innovation outputs’ and was integrated with complementary control variables capturing different and similarly interesting innovation-related aspects and dynamics (e.g., ‘tertiary education’). As briefly mentioned above, we used such an alternative version of the RIS when we tested the robustness of our main econometric model specifically related to regional participation; namely, method: Tobit model; dependent variable: degree centrality; see below in this section for further details. HCDD represent our second independent variable and are calculated as the difference between the daily temperature mean and 65 °F. HCDD are largely used for measuring energy use, although such an indicator is strongly influenced by the geographical location of a given place and does not specifically consider the employment of energy by regional industries. In other words, HCDD do not fully capture the energy need of a region. For this reason, EVI was also included in the econometric models we adopted. More vulnerable regions were identified based on a report published by Pye, et al., who mapped out different subnational regions across Europe that may be more vulnerable [36]. More vulnerable regions were identified through a set of indicators capturing the presence of energy vulnerable households and energy-intensive industries (the full list of indicators adopted by [36] is provided in Appendix A). In their report, Pye et al. indicated only the regions that can be considered vulnerable, without sharing the figures related to the various indicators adopted [36]. Consequently, based on the information available, a dichotomous variable was applied in our econometric models for classifying the EU regions based on their level of vulnerability (0 = less vulnerable; 1 = more vulnerable) (see Section 3 and Appendix A for further details on all variables included in our econometric models).
Control variables such as regional PM10 emissions per inhabitant, population, GDP per capita, quality of institutions and country fixed effects were used for determining the relationship between our dependent and independent variables and testing the validity of our models. Specifically, we used PM10 emissions to control for whether pollution may determine a higher participation of more polluted regional areas due to energy need and necessity to transition to greener forms of consumption and production (e.g., [1]). Population was included in our econometric models since we hypothesised that the regional size may represent a relevant factor in determining the centrality or key positioning of a given region. Finally, we hypothesised that the quality of regional government [11] may have a positive impact on regional participation in the H2020–ENERGY programme.
Two further checks were carried out for assessing the robustness of our econometric analysis against alternative models. In particular, we adopted the Tweedie model and different metrics for RIS (ten categories instead of four categories) and HCDD (continuous variables as a substitute for categorical variables) in the first robustness test. Moreover, we used new variables such as gross value added (GVA) per capita and level of education (college or university level and lifelong learning). These variables replaced GDP per capita and quality of regional institutions, respectively (see Appendix A for details). Finally, we carried out a second robustness test based on a different method such as the Tobit model. Specifically, Tobit is a censored regression model which is used for estimating the existence of a linear relationship between variables when there is either a left or right censoring in the dependent variable. In our empirical analysis, we decided to use degree (participation in the H2020–ENERGY) as dependent variable and censor all the values that fell at or below 0.01 (on the use of lower limits different from zero in the Tobit model, see, e.g., [37,38]). Through the adoption of this method, we were able to specifically determine the impact of non-participating or very low scoring regions on the validity of our main econometric model related to the actual number of ties established by regional organisations (i.e., degree centrality).
3. Results
3.1. Social Network Analysis: The Structural Features of the H2020–ENERGY Network
In a first step, we calculated the density of the network created by the EU regions in the context of the H2020–ENERGY programme (see Table 1). The density is the total number of ties divided by the total number of possible ties and is a measure that provides insights into the speed at which knowledge diffuses among the nodes [28]. The overall network density was relatively high, with 14.1% of connected nodes, corresponding to 6834 ties. However, the network is characterised by a high degree of centralisation (67%), meaning that the number of participation is largely unequal, with only a few regions that actually benefit from a considerable number of connections and related positional advantage [28].

Table 1.
SNA measures: overall density, number of ties, standard deviation, average degree and degree centralisation.
As displayed in Table 2, Germany is the most represented country with 274 participations, followed by Spain (231), United Kingdom (184), Italy (150) and France (144). In general, larger countries, but also some competitive smaller ones (e.g., Netherlands, Belgium, Austria, Sweden and Denmark) show the highest level of participation. Besides, we can observe that primarily innovation leaders (Netherlands, Sweden and Denmark) and strong innovators (Germany, France, United Kingdom, Belgium and Austria) are listed in the top 10 participating countries, while moderate innovators (Spain and Italy) are underrepresented. Finally, no modest innovators are included in the top 10 participating countries and, more generally, they play a very marginal role in the H2020–ENERGY network.
Table 2.
Top 10 countries in the H2020–ENERGY (Total number of participations and participations per 10,000 inhabitants).
Regarding the more central or well-positioned regions in the H2020–ENERGY network, the top 15 ranking related to the various SNA measures adopted (degree, eigenvector, betweenness, structural holes) shows a high degree of stability. In fact, the same regions can be generally found in the ranking regardless of the SNA measure applied. In particular, 17 regions from 11 countries make up the top 15 ranking and we observed only some negligible changes in the rank order (see Table 3). These regions generally overlap with the geographical areas where the capitals or the most advanced areas of the surveyed countries are located (e.g., Oberbayern in Germany, Île de France in France, Madrid and Cataluña in Spain, Lazio and Lombardia in Italy, Zuid-Holland in the Netherlands, Bruxelles and Vlaams Gewest in Belgium, Stockholm in Sweden, Hovedstaden in Denmark, Ostösterreich in Austria, Attiki in Greece).
Table 3.
Top 15 EU regions in the H2020–ENERGY (degree, eigenvector, betweenness and structural holes).
In addition, we conducted a Spearman’s rank correlation analysis for testing the association between the SNA measures adopted and RIS (four categories, from Modest to Leader), HCDD (four categories, from 0–0.125 to >0.375) and EVI (dichotomous variable). Moreover, a different RIS classification was taken into consideration (ten categories, ranging from Modest − to Leader +). Finally, Pearson’s correlation was used for testing the association between HCDD and the adapted version of the RIS we constructed (continuous variables in both cases) and degree, eigenvector, betweenness and structural holes. In particular, these different classifications (RIS) and metrics (HCDD and new version of the RIS) were used subsequently for testing the robustness of our econometric analysis against alternative models (see Section 3.3).
The correlation analysis displayed in Table 4 shows a relatively high positive and statistically significant association between RIS and network centrality (with values ranging between 0.464 and 0.603 depending on the RIS classification and SNA measure adopted), while we found only a weak positive correlation between HCDD (both categorical and continuous variables) and node centrality or strategic positioning (correlation coefficient <0.300). Conversely, EVI is negatively associated with all the SNA measures applied. In other words, this means that less vulnerable regions show a positive association with node centrality and key positioning in the H2020–ENERGY network (i.e., weak correlation with degree centrality and barely moderate correlation with eigenvector, betweenness and structural holes). All these figures are particularly interesting, pointing to the existence of a stronger positive association between node centrality or strategic positioning and regional innovation capacity rather than challenges; that is, energy demand or vulnerability (proxied by HCDD and EVI).
Table 4.
Correlation between dependent and main independent variables.
Having revealed some basic structures and statistics of the network under analysis, we calculated the density within and between groups related to RIS, HCDD and EVI (see [39] for further methodological considerations on density by groups). It must be specified that density can be affected by the number of nodes making up a network (larger networks tend to be less dense; e.g., [40]). This potential bias should be definitely kept in mind, although the considerable differences that we observed in the various targeted groups provide us with clear indications and make the adoption of this specific SNA method quite accurate and informative. Notably, our analysis revealed a considerably higher density when only innovation leaders are considered (61.8% of connected regions) if compared with the other surveyed groups (i.e., density within strong, moderate and modest innovators). Moreover, the group merging innovation leaders and strong innovators is relatively dense (34.8% of connected regions), while the density within and between all of the other groups tends to decrease significantly. In particular, the density within groups related to moderate and modest innovators is particularly low, i.e., 25% and 13% of connected regions, respectively. Interestingly, the analysis related to HCDD shows similar patterns, even though the density within the group characterised by the highest energy demand (i.e., >0.375) is considerably lower than the one observed within the most innovative regions (i.e., innovation leaders); i.e., 31.3% versus 61.8% of connected regions. Finally, a very low degree of connections can be observed within the regions characterised by a higher level of energy vulnerability (4.4% of connected nodes), while the density within the less vulnerable regions is definitely higher, although not particularly high in absolute terms (22.1% of connected regions) (see Table 5).
Table 5.
Density by groups (Ucinet elaboration [41]). Variables: RIS, HCDD and EVI.
3.2. Core and Peripheral Regions in H2020–ENERGY
The core-periphery model [42] is commonly used in network studies for identifying the existence of a group of nodes which shows a high level of connectedness (the core) and another group which is characterised by a very low number of connections (the periphery) [28]. The next three graphs show that the network created by the regional organisations involved in the H2020–ENERGY is characterised by a clear core-periphery structure (See Figure 2). In the first two graphs, the red and yellow circles represent the core regions in the reconstructed networks related to RIS and HCDD, respectively, while the size of the circles refer to their corresponding category (the bigger the circles, the higher the rank in the RIS and HCDD classifications). The third graph refers to the network related to EVI. In this case, the green circles highlight the network core and the size of the circles distinguishes between less vulnerable regions (bigger circles) and more vulnerable regions (smaller circles). In the case of RIS and HCDD, the core primarily includes regions that are characterised by higher levels of innovativeness and energy demand. With regard to EVI, the core comprises, almost exclusively, less vulnerable regions, while more vulnerable regions make up the periphery of the network.
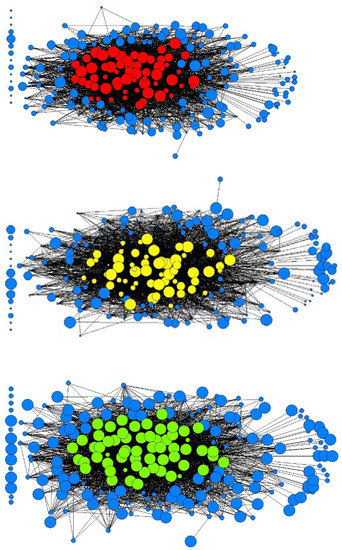
Figure 2.
Core-periphery model (Ucinet elaboration [41]). Up to down: Network 1—RIS (core: red circles), Network 2—HCDD (core: yellow circles), Network 3—EVI (core: green circles). Core/periphery fit (correlation) = 0.7371.
The results displayed in Table 6 strengthen our considerations on the core/periphery dynamics that characterise the H2020–ENERGY network. We compared the overall number of regions that fall in each category applied to RIS, HCDD and EVI with the number of regions observed in the respective network cores. This particular type of analysis aims at clarifying which regions actually make up the network cores. It appears evident that innovation leaders and strong innovators show the highest number of organisations in the network core related to RIS (i.e., 36.1% of innovation leaders and 34.4% of strong innovators vs. 13.1% and 31.7% of the overall surveyed regions, respectively). Conversely, moderate innovators show fewer regions in the network core, both in absolute terms and in comparison with the overall number of surveyed regions (29.5% vs. 35.7%). No modest innovators can be found in the network core, although this category represents 12.6% of the overall regions surveyed in the present case study. The network core related to HCDD shows some differences when compared with the one related to RIS, the main of which is that the highest number of regions making up the network core shows a moderate level of energy demand (i.e., 0.126–0.250; 34.4% of core regions). Moreover, the highest difference between the core and overall regions can be observed in the group that shows a very high degree of energy demand (i.e., 32.9% of regions in the network core vs 18.1% of the overall surveyed regions). Finally, more vulnerable regions represent 33.9% of the total surveyed regions, but only 8.2% of them are included in the network core (i.e., five regions, namely Attiki and Kentriki Makedonia in Greece, Lisboa and Norte in Portugal, and Budapest in Hungary).
Table 6.
Number of regions and core members by groups.
3.3. Econometric Analysis: Is Node Centrality Associated with Innovativeness or Energy Demand/Vulnerability?
The results of our econometric analysis show that being ranked high in the RIS is positively correlated with all the SNA measures adopted (i.e., degree, eigenvector, betweenness and structural holes) and statistically significant. Conversely, the coefficient related to HCDD is slightly negative and not statistically significant, while EVI is negatively associated with node centrality or positioning and statistically significant (with the only exception of degree, which is not statistically significant). In line with the hypothesis advanced in the introductory section of this paper, our econometric analysis reveals that the research projects funded under the H2020–ENERGY programme tend to privilege the generation (supply side) of energy innovation in consideration of the correlation that we found between regional innovativeness and node centrality or strategic positioning. Conversely, the application (demand side) seems to be very marginal due to the absence of correlation between HCDD and the SNA measures applied, and the inverse correlation that we noticed in the case of EVI (i.e., less vulnerable regions have a more central role or benefit from a positional advantage). Although not directly addressed in our study, the analysis of our control variables brings to light a number of additional interesting patterns. More densely populated and richer regions are positively associated with node centrality or strategic positioning, while the quality of institutions is positively associated, but not statistically significant. Interestingly, PM10 emissions (more polluted regions) are negatively correlated with network centrality or key positioning and statistically significant (see Table 7).
Table 7.
Tweedie model with country fixed effects (reference country: Belgium).
The results of the robustness check, in which we adopted different variables or metrics, confirm the validity of our econometric analysis (see Table 8). In the alternative models, we used ten categories for classifying the EU regions based on their level of innovativeness (i.e., from Modest – to Leader +, according to the RIS classification) and used a continuous variable for calculating HCDD instead of a categorical variable. Moreover, GVA per capita replaced GDP per capita, while a proxy of knowledge and human capital (i.e., level of education at the regional level) was used for replacing a specific institutional variable such as quality of regional government (see Appendix A for further details on the new variables adopted in the robustness check). As mentioned before, the results of our test largely confirm the robustness of our main econometric models. Regional innovativeness remains positively correlated with node centrality and key positioning in the H2020–ENERGY network, while the interactions between our new variables made HCDD slightly positively correlated, but similarly not statistically significant. EVI is negatively correlated with key positioning and statistically significant in the case of Model 4 (dependent variable: structural holes). It is worth mentioning that EVI is negatively associated with all of the other SNA measures adopted and statistically significant at 10% level, although these correlations are not highlighted in Table 8 since only statistical significance at 1% and 5% is reported. Regarding our control variables, regional population and level of education are associated with node centrality and a strategic position in the H2020–ENERGY network, while PM10 emissions is negatively correlated (less polluted regions are more central or benefit from a positional advantage). Finally, GVA per capita shows no correlation with our dependent variables in the robustness check.
Table 8.
Tweedie model with country fixed effects (reference country: Belgium).
Having demonstrated and tested the robustness of the association between innovativeness (innovation-driven participation) and node centrality and key positioning, a final robustness test was carried out for illuminating whether the considerable number of non-participating and low-scoring EU regions affects regional participation in the H2020–ENERGY programme (i.e., dependent variable: degree; see Table 9). For this purpose, we used the Tobit model and set the lower limit at ≤0.01. The control variables we employed in this final robustness test were selected based on their widespread association and statistical significance in the previous models applied (i.e., PM10 emissions, population, GDP per capita, and level of education). Finally, we used an alternative version of the RIS (continuous variable based on selected indicators; see Section 2), HCDD (continuous variable) and EVI as independent variables. The results of this further statistical test unequivocally confirm that innovativeness remains a critical factor for determining regional participation in the H2020–ENERGY, while HCDD and EVI are not associated with degree centrality when censoring the lowest-scoring EU regions making up our dataset. Finally, all of the control variables previously associated with node centrality or strategic positioning are similarly associated with regional participation when the Tobit model is applied.
Table 9.
Tobit model. Dependent variable: degree (maximum likelihood estimates).
4. Discussion
Based on the distinction between the generation (production or supply side) and application (demand side) of green technologies [2], this paper aimed to assess whether innovativeness (innovation-driven participation) or energy demand and vulnerability (challenge-driven participation) are associated with node centrality and key positioning in the H2020–ENERGY. Our empirical analysis, based on a combination of SNA and econometrics, was embedded in a broader theoretical background and achieved several interesting results.
First, we were able to reveal that the network under analysis is characterised by a high degree of centralisation and an evident core-periphery structure, in which a very few regions play a dominant role and benefit from knowledge circulation. These findings definitely corroborate the results of previously published papers, according to which the network cores observed in the context of the EU FPs generally comprise innovative and competitive regions [23], as well as clusters of clearly identifiable nodes (see [22,24]). In addition to this, network statistics allowed us to determine a positive correlation between innovativeness and regional participation in H2020–ENERGY.
This latter finding was further strengthened by our econometric analysis, which showed how the level of innovation (i.e., regions scoring high in the RIS) is positively associated with regional participation, being central (i.e., degree, eigenvector and betweenness) or holding a key positioning (structural holes) in H2020–ENERGY. Conversely, energy demand and vulnerability (proxied by HCDD and EVI, respectively) showed more controversial results. In fact, EVI is characterized by an inverse and statistically significant correlation in our main econometric model and, although partially, in our first robustness test. On the other hand, EVI seems to be positively associated with regional participation, but not statistically significant, when low-scoring regions are censored (i.e., in the second robustness test). Finally, HCDD is not correlated with network centrality or positioning irrespective of the econometric methods and models applied.
Based on these empirical results, we can confidently assert that our hypothesis is confirmed: innovation drives the participation of the EU regions in the H2020–ENERGY, while the regional areas that face challenges in terms of energy demand and vulnerability play a very marginal role. Similar knowledge exchange dynamics and related outputs have been previously observed in different EU programming cycles and funding schemes (e.g., [25,26,27]). This observation leads us to reflect on the policy implications of our study, which we briefly outline in the concluding section.
5. Conclusions
More general policy implications can be drawn from the results of our empirical analysis. Literature on regional development and the geography of innovation stresses the importance of effective institutions and good government in enhancing trust-based networks and facilitating knowledge diffusion among various types of economic actors (e.g., [11,12]). Contrary to what these studies suggest, regional institutions seem to have a marginal impact on determining node centrality and key positioning in the EU energy network (there is a positive, but not statistically significant association). However, our finding is not as surprising as it would appear at a first glance. In fact, the lacking association between quality of regional government and the various SNA measures applied is primarily determined by the high degree of participation of regional organizations located in Southern European countries that perform traditionally well in the context of the EU FPs (e.g., Italy, Spain and Greece; see the previous studies conducted by [20,26] in this regard). These Southern European regions are relatively—or even quite—prosperous and characterized by good research infrastructures (e.g., Lombardia, Lazio, Liguria and Toscana in Italy; Comunidad de Madrid, País Vasco and Comunidad Valenciana in Spain), although they tend to show—to various degrees—weaker institutions than their Northern European counterparts.
Richer and more densely populated regions participate more often or hold a key position in the H2020–ENERGY programme, thus confirming the results of studies previously revealing analogous collaborative patterns [25,26]. Similarly, less polluted regions play a key role in the EU energy network, thus revealing that the need of transitioning to greener forms of consumption and production does not drive regional participation. The inverse relationship between PM10 emissions and network centrality can be attributed to the fact that the more polluted EU regions in relative terms are generally located in lesser developed Southern or Eastern European countries or—to a lesser extent—in weaker Northern European regions compared to the respective national contexts.
One of the most important policy implications of our study is that H2020–ENERGY is characterised by largely unbalanced participation. In this respect, innovation literature suggests that more innovative regions are clearly associated with stronger regional innovation systems [13]. Our paper confirms, once again (see [22,23,24,25,26], among others), that better equipped regions in terms of innovative organisations and level of education benefited the most from the EU funds and knowledge circulation triggered by the H2020–ENERGY programme. This is undoubtedly an issue that the EU should address in the next programming cycles since it seems to be in clear contrast with the “overall harmonious development of its member States” (Cohesion Policy; [43]) and, more specifically, with the principles of the European Research Area (i.e., integration of the scientific resources of the EU and effective circulation of researchers, scientific knowledge and technology; [44]).
A policy recommendation in this regard might consist of taking studies like the present one into more careful consideration and, as a consequence, aiming at enhancing a more balanced participation by means of specific policy actions. For example, an option is encouraging challenge-driven participation through the creation of research consortia in which at least one organisation located in marginally innovative or vulnerable regions is involved. This might lead to more widespread and potentially impactful knowledge circulation.
Author Contributions
Research idea, G.C.; Conceptualisation, G.C. and M.T.; Data curation, methodology and formal analysis, G.C.; Writing, review and editing, G.C. and M.T. All authors have read and agreed to the published version of the manuscript.
Funding
This research received no external funding.
Acknowledgments
Open Access Funding by the University of Vienna.
Conflicts of Interest
The authors declare no conflict of interest.
Appendix A
Detailed information about dependent, independent and control variables.
Table A1.
Dependent, independent and control variables: Indicators and description.
Table A1.
Dependent, independent and control variables: Indicators and description.
| Econometric Models | ||
|---|---|---|
| Dependent Variables | Indicator | Description |
| Participation H2020–ENERGY | Degree H2020–ENERGY | Degree Centrality (EU Regions): Number of connections established by each organisation in the FP7-NMP. Source: CORDIS. |
| Eigenvector centrality H2020–ENERGY | Eigenvector FP7–ENERGY | Eigenvector Centrality (EU Regions): Measuring the “influence” of nodes in the network. Eigenvector shows how well-connected actors are to the parts of the network with the greatest connectivity. Source: CORDIS. |
| Betweenness centrality H2020–ENERGY | Betweenness H2020–ENERGY | Betweenness Centrality (EU Regions): Number of shortest paths between i and k that actor j resides on. Betweenness measures the probability that an actor would be along all the possible paths connecting the nodes of the network. Source: CORDIS. |
| Structural Holes H2020–ENERGY | Structural Holes (Effective Size) H2020–ENERGY | Structural Hole (EU Regions): “Empty space" between contacts in a university’s network. Effective size: Number of non-redundant contacts in a focal actor’s network [45]. Source: CORDIS. |
| Independent Variables | Indicator | Description |
| RIS | Regional Innovation Scoreboard 2019 | Four ordinal variables based on the ranking in the Regional Innovation Scoreboard 2019: Modest; Moderate; Strong; Leader. Source: Regional Innovation Scoreboard 2019. |
| HCDD | Heating Degree Days + Cooling Degree Days | Difference between the daily temperature mean and 65 °F. Four ordinal variables: 0–0.125; 0.126–0.250; 0.251–0.375; >0.375. Source: Eurostat. |
| EVI | Energy Vulnerability Index | Binary variables: 0 = Not vulnerable; 1 = Vulnerable. Indicators: Industry—Level of employment from coal mining + indirect jobs; Level of employment from coal plant generation; share of manufacturing in sectors with high unity expenditure on energy; Long-term unemployment (12 months and more) by NUTS 2 regions, as a percentage of active population. Households—Average energy expenditure level as a share of total expenditure; Half the median expenditure on energy; Twice the median expenditure on energy; Share of households in arrears on utility bills at least once in the past 12 months; Share of households in arrears on utility bills more than once in the past 12 months; Share of households unable to keep adequately warm; Disposable income per inhabitant on a purchasing power standard basis. Source: [36] |
| Control Variables | Indicator | Description |
| PM10 Emissions | Particulate matter | Particulate matter (less than 10 micrometers in diameter). Main sources of human origin: commercial, residential and households (39%), industrial processes and product use (20%), agriculture (15%), road transport (11%), energy use in industry (6%), energy production and distribution (4%), waste (3%) and non-road transport (2%). Source: European Commission. |
| Population | Resident population | Population on 1 January 2019. Source: Eurostat. |
| GDP per capita | Real GDP per capita | Ratio of real GDP to the average population. Source: Eurostat. |
| Institutions | Quality of government | Quality of Government Index by the Quality of Government Institute (University of Gothenburg) [11]. Source: Regional Competitiveness Index. |
| Country | Country fixed effects | Fixed effects/dummy variables. Reference country: Belgium (first country listed in the RIS). |
| Other variables (Robustness Check) | ||
| Control Variables | Indicator | Description |
| RIS | Regional Innovation Scoreboard 2019 | Continuous variable—average scores of some selected RIS indicators (i.e., product or process innovators, patent applications, employment in high-technology industries and knowledge-intensive services, and sales of new-to-market and new-to-firm innovations. |
| GVA per capita | Gross Value Added per capita | Output value at basic prices less intermediate consumption valued at purchasers’ prices. Source: Eurostat. |
| Education | Level of education and lifelong learning | Percentage of people educated at a college or university level/ Development after formal education. Source: Regional Competitiveness Index 2019. |
References
- Strategy for Long-Term EU Greenhouse Gas Emissions Reduction (Communication). Available online: https://www.eesc.europa.eu/en/our-work/opinions-information-reports/opinions/strategy-long-term-eu-greenhouse-gas-emissions-reduction-communication (accessed on 11 May 2020).
- Tödtling, F.; Trippl, M.; Frangenheim, A. Policy options for green regional development: Applying a production and application perspective. PEGIS Work. Pap./Univ. Vienna 2019, 16, 1–27. [Google Scholar]
- Capasso, M.; Hansen, T.; Heiberg, J.; Klitkou, A.; Steen, M. Green growth–A synthesis of scientific findings. Technol. Soc. Chang. 2019, 146, 390–402. [Google Scholar] [CrossRef]
- Berkhout, F.; Marcotullio, P.; Hanaoka, T. Understanding energy transitions. Sustain. Sci. 2012, 7, 109–111. [Google Scholar] [CrossRef]
- Secure, Clean and Efficient Energy. Available online: https://ec.europa.eu/programmes/horizon2020/en/h2020-section/secure-clean-and-efficient-energy (accessed on 11 May 2020).
- Geels, F.W.; Sovacool, B.K.; Schwanen, T.; Sorrell, S. The socio-technical dynamics of low-carbon transitions. Joule 2017, 1, 463–479. [Google Scholar] [CrossRef]
- Schmidt, T.S.; Schneider, M.; Rogge, K.S.; Schuetz, M.J.A.; Hoffmann, V.H. The effects of climate policy on the rate and direction of innovation: A survey of the EU ETS and the electricity sector. Environ. Innov. Soc. Tr. 2012, 2, 23–48. [Google Scholar] [CrossRef]
- Rogge, K.S.; Reichardt, K. Policy mixes for sustainability transitions: An extended concept and framework for analysis. Res. Policy 2016, 45, 1620–1635. [Google Scholar] [CrossRef]
- Calignano, G.; Fitjar, R.D.; Hjertvikrem, N. Innovation networks and green restructuring: Which path development can EU Framework Programmes stimulate in Norway? Nor. Geogr. Tidsskr. Nor. J. Geogr. 2019, 73, 65–78. [Google Scholar] [CrossRef]
- Trippl, M.; Grillitsch, M.; Isaksen, A. Exogenous sources of regional industrial change: Attraction and absorption of non-local knowledge for new path development. Prog. Hum. Geogr. 2018, 42, 687–705. [Google Scholar] [CrossRef]
- Charron, N.; Dijkstra, L.; Lapuente, V. Regional governance matters: Quality of government within European Union member states. Reg. Stud. 2014, 48, 68–90. [Google Scholar] [CrossRef]
- Rodríguez-Pose, A.; Di Cataldo, M. Quality of government and innovative performance in the regions of Europe. J. Econ. Geogr. 2015, 15, 673–706. [Google Scholar] [CrossRef]
- Asheim, B.; Isaksen, A.; Trippl, M. Regional Innovation Systems–An Advanced Introduction; Edward Elgar: Cheltenham, UK, 2019. [Google Scholar]
- Heating and Cooling Degree Days. Available online: https://www.eea.europa.eu/data-and-maps/indicators/heating-degree-days-2/assessment (accessed on 11 May 2020).
- Trippl, M.; Baumgartinger-Seiringer, S.; Frangenheim, A.; Isaksen, A.; Rypestol, J.O. Unravelling green regional industrial path development: Regional preconditions, asset modification and agency. Geoforum 2020, 111, 189–197. [Google Scholar] [CrossRef]
- Kline, S.J.; Rosenberg, N. An Overview of Innovation. In The Positive Sum Strategy: Harnessing Technology for Economic Growth; Landau, R., Rosenberg, N., Eds.; National Academy Press: Washington, DC, USA, 1986; pp. 275–305. [Google Scholar]
- Weber, K.M.; Truffer, B. Moving innovation systems research to the next level: Towards an integrative agenda. Oxf. Rev. Econ. Policy 2017, 33, 101–121. [Google Scholar] [CrossRef]
- Powell, W.W.; Grodal, S. Networks of innovators. In The Oxford Handbook of Innovation; Fagerberg, I., Mowery, D.C., Nelson, R.R., Eds.; Oxford University Press: Oxford, UK, 2005; pp. 56–85. [Google Scholar]
- Binz, C.; Truffer, B. Global Innovation Systems—A conceptual framework for innovation dynamics in transnational contexts. Res. Policy 2017, 46, 1284–1298. [Google Scholar] [CrossRef]
- Calignano, G. Nanotechnology as a proxy to capture regional economic development? New findings from the European Union Framework Programmes. Nanotechnol. Rev. 2017, 6, 159–170. [Google Scholar] [CrossRef]
- Breschi, S.; Malerba, F. ERA and the role of networks. In European Science and Technology Policy: Towards Integration or Fragmentation? Langhe, H., Muldur, U., Soete, L., Eds.; Edward Elgar: Cheltenham, UK, 2009; pp. 160–174. [Google Scholar]
- Roediger-Schluga, T.; Barber, M.J. R&D collaboration networks in the European Framework Programmes: Data processing, network construction and selected results. Int. J. Foresight Innov. Policy 2008, 4, 321–347. [Google Scholar]
- Balland, P.A.; Suire, R.; Vicente, J. Structural and geographical patterns of knowledge networks in emerging technological standards: Evidence from the European GNSS industry. Econ. Innov. New Technol. 2013, 22, 47–72. [Google Scholar] [CrossRef]
- Hoekman, J.; Scherngell, T.; Frenken, K.; Tijssen, R. Acquisition of European research funds and its effect on international scientific collaboration. J. Econ. Geogr. 2013, 13, 23–52. [Google Scholar] [CrossRef]
- Calignano, G.; Quarta, C.A. The persistence of regional disparities in Italy through the lens of the European Union nanotechnology network. Reg. Stud. Reg. Sci. 2015, 2, 470–479. [Google Scholar] [CrossRef]
- Calignano, G.; Hassink, R. Increasing innovativeness of SMEs in peripheral areas through international networks? The case of Southern Italy. REGION 2016, 3, 25–42. [Google Scholar] [CrossRef]
- Dotti, N.F.; Spithoven, A. Economic drivers and specialization patterns in the spatial distribution of Framework Programme’s participation. Pap. Reg. Sci. 2018, 97, 863–882. [Google Scholar] [CrossRef]
- Hanneman, R.A.; Riddle, M. Introduction to Social Network Methods; University of California: Riverside, CA, USA, 2005. [Google Scholar]
- Trippl, M.; Asheim, B.; Miörner, J. Identification of regions with less-developed research and innovation systems. In Innovation Drivers and Regional Innovation Strategies; Parrilli, M.D., Fitjar, R.D., Rodríguez-Pose, A., Eds.; Routledge: Abingdon, UK, 2016; pp. 23–44. [Google Scholar]
- Asheim, B. Learning regions—A strategy for economic development in less developed regions? In Handbook on the Geographies of Regions and Territories; Paasi, A., Harrison, J., Jones, M., Eds.; Edward Elgar: Cheltenham, UK; Northampton, UK, 2018; pp. 130–140. [Google Scholar]
- Lopes, J.; Farinha, J.; Ferreira, J.; Silveira, P. Smart specialization policies: Innovative performance models from European regions. Eur. Plan. Stud. 2018, 26, 2114–2124. [Google Scholar] [CrossRef]
- Trippl, M.; Zukauskaite, E.; Healy, A. Shaping smart specialization: The role of place-specific factors in advanced, intermediate and less-developed European regions. Reg. Stud. 2019, 1–13. [Google Scholar] [CrossRef]
- Edquist, C.; Zabala-Iturriagagoitia, J.M.; Barbero, J.; Zofío, J.L. On the meaning of innovation performance: Is the synthetic indicator of the Innovation Union Scoreboard flawed? Res. Eval. 2018, 27, 96–211. [Google Scholar] [CrossRef]
- Bernstein, M. Working for the energy sector–Be excited about the future! In Developing Managerial Capabilities in the Energy Sector: What Talent is Needed? Gamble, T., Ed.; Council on Business and Society: Cergy, France, 2015; pp. 3–7. [Google Scholar]
- Tantau, A.D.; Fratila, L.C. Entrepreneurship and Business Development in Renewable Energy Field; IGI Global: Hershey, PA, USA, 2018. [Google Scholar]
- Pye, S.; Dobbins, A.; Matosović, M.; Lekavičius, V. Energy vulnerability and low carbon transitions in Europe. REEEM Proj. 2019, 4, 1b. [Google Scholar]
- Easterly, W. Economic stagnation, fixed factors, and policy thresholds. J. Monet. Econ. 1994, 33, 525–577. [Google Scholar] [CrossRef]
- Loikkanen, H.; Susiluoto, I. An Evaluation of Economic Efficiency of Finnish Regions by DEA and Tobit Models, 42nd ed.; Congress of the European Regional Science Association: Dortmund, Germany, 2002. [Google Scholar]
- Borgatti, S.P.; Everett, M.G.; Johnson, J.C. Analyzing Social Networks; Sage Publications: Los Angeles, CA, USA, 2013. [Google Scholar]
- Hansen, D.; Shneiderman, B.; Smith, M.; Himelboim, I. Analyzing Social Media Networks with NodeXL, 2nd ed.; Morgan Kaufmann: Burlington, MA, USA, 2020. [Google Scholar]
- Borgatti, S.P.; Everett, M.G.; Freeman, L.C. Ucinet 6 for Windows: Software for Social Network Analysis; Analytic Technologies: Harvard, MA, USA, 2002. [Google Scholar]
- Borgatti, S.P.; Everett, M.G. Models of core/periphery structures. Soc. Netw. 1999, 21, 375–395. [Google Scholar] [CrossRef]
- Cohesion Policy. Available online: https://ec.europa.eu/regional_policy/en/policy/what/glossary/c/cohesion-policy (accessed on 11 May 2020).
- European Research Area (ERA). Policy Initiatives and Practices of a Unified Common European Research Area, Partnership Details and Progress Reports. Available online: https://ec.europa.eu/info/research-and-innovation/strategy/era_en (accessed on 11 May 2020).
- Burt, R.S. Structural Holes; Harvard University Press: Cambridge, MA, USA, 1992. [Google Scholar]


© 2020 by the authors. Licensee MDPI, Basel, Switzerland. This article is an open access article distributed under the terms and conditions of the Creative Commons Attribution (CC BY) license (http://creativecommons.org/licenses/by/4.0/).