Article

Design of Appropriate Technology-Assisted Urine Tester Enabling Remote and Long-Term Monitoring of Health Conditions

1
Division of Culture & Design Management, Underwood International College, Yonsei University, Seoul 03722, Korea
2
School of Urban and Environmental Engineering, Ulsan National Institute of Science and Technology (UNIST), Ulsan 44919, Korea
*
Author to whom correspondence should be addressed.
Sustainability 2020, 12(12), 5165; https://doi.org/10.3390/su12125165
Submission received: 10 May 2020 / Revised: 14 June 2020 / Accepted: 22 June 2020 / Published: 24 June 2020
(This article belongs to the Section Health, Well-Being and Sustainability)

Abstract

:
A novel design idea supported by affordable design processes can address unresolved social problems such as the imbalance of opportunity in healthcare services, owing to high costs and a lack of access. We designed an appropriate technology-assisted urine tester to provide healthcare services for the elderly and underprivileged in order to monitor their health conditions daily and remotely help them determine whether to visit hospitals/clinics for in-depth diagnoses. To minimize production costs, we used a charge-coupled device camera for colorimetric-type urine analysis in conjunction with commercially available urine test strips; all other electronic components were mass-produced. We calibrated this urine tester and compared it with a commercially available high-end tester; the results showed high accuracy for most urine compounds. We verified its major device functions by recruiting four participants who tested their urine over four weeks and provided self-surveys of their health conditions. The proposed tester demonstrates a low price-to-performance ratio with high reliability, while its production and maintenance costs are as low as 20 USD per set. We focused on a human-centered technological approach from a simple and innovative design point of view in order to serve people and healthcare providers in an affordable way. We believe that the tester can be widely distributed, exemplifying appropriate technological application for those who require, but cannot enjoy, proper medical services, thereby improving social healthcare sustainability.

1. Introduction

Social sustainability problems such as the imbalances of opportunity in healthcare services for the elderly, treatment for chronic diseases, or the struggle of the underprivileged due to economic conditions or geographical factors must be solved. Although access to proper medical care may be a minor problem for the vast majority, it is a major problem for the minority [1,2]. Such imbalances have long existed, and various studies have attempted to address them [3,4,5]. Some studies have reported that such imbalances are potentially avoidable [6,7]. However, from 1993 to 2017, such imbalances in healthcare provision have surprisingly become more severe in the United States [8,9], implies that income disparities among people have been found to contribute most to less opportunity and less access to healthcare services as reported in the literature [10]. Consequently, there has been an increasing demand to address social problems directly related to opportunity imbalances regarding individual healthcare services and health expectancy. In particular, the elderly and underprivileged, as the target population of this work, may require certain social or technological support to frequently or continuously monitor their health conditions [11]. Otherwise, the healthcare budget of an individual as well as that of a country cannot be adequate if health conditions significantly deteriorate or the disease evolves seriously. More importantly, such situations occur in both developed and underdeveloped countries as aforementioned because they are mostly influenced by personal income levels in the former and the gross national product in the latter, worsening social sustainability problems. Therefore, increased attention needs to be paid to the imbalances of opportunity in healthcare services to strengthen social sustainability by employing a technical approach [12,13]. In this context, a urine tester can be an alternative because, although its role is essential for basic monitoring of various health conditions, it remains too expensive to be purchased or distributed widely [14]. In fact, urine testers are widely used in many healthcare facilities and clinics because of their remarkable potential for early monitoring and point-of-care detection of various disease [15,16]. However, they are not yet widely available for home use although research efforts have been made to produce a low-cost urine analysis device [17]. This can be attributed to the purchase cost largely comprising the production and distribution, as well as unavailable and insufficient consultation services from medical doctors. However, it appears that these critical limitations can be resolved by employing appropriate technologies, as well as the Internet and Internet of Things (IoT) technologies; further details have been discussed in [13].
Appropriate technologies can be employed to address opportunity imbalances regarding individual healthcare services and health expectancy by taking into consideration the cultural, political, and environmental aspects of underdeveloped countries and underprivileged people, to eventually improve their quality of life. Appropriate technologies, also called intermediate, alternative, or borderless technologies [18], have already been applied in underdeveloped countries in Africa and Asia. People have used appropriate technologies in an attempt to solve many social problems such as disease, poverty, access to water, and illiteracy in underdeveloped countries; such technologies have also been used in developed countries too, to provide solutions for relatively underprivileged people [19]. Appropriate technologies have remarkable potential for solving inequality-related problems regarding healthcare services particularly when designers contribute their creative ideation through design thinking methodologies to craft simple, low-tech prototypes derived from complicated and expensive instruments/systems [20]. Developing better solutions from existing products and triggering exploration of user-driven approaches delivers new solutions to specific groups of people. When appropriate technologies meet with this user-driven and human-centered design approach, some potentially end up solving these unresolved problems [21]. Furthermore, human-centered design represents a perspective on human needs and concerns which is a primary driver for the development of products. Thinking deeply about the potential users of such products and services offers one a framework that can contribute to the discovery of specific solutions [22,23]. For example, appropriate technologies such as the LifeStraw, one laptop per child (OLPC), and the hand-powered ultralow-cost paper centrifuge have been developed and distributed by their designers; however, these were not all successful because of the high cost, insufficient infrastructure and resources, and unfavorable environmental conditions [24,25,26]. These previous experiences demonstrate that appropriate technology-assisted approaches should consider the net cost of production, operation, and maintenance to increase their distribution, penetration, and sustainability. Particularly, in the case of appropriate technology-assisted medical devices, noninvasive methods—which have become increasingly popular in the global medical device market [27,28]—seem more suitable because invasive methods typically require careful pretreatment before they can be performed, limiting their broad application in health monitoring, healthcare, and medical equipment [29,30,31,32,33].
Moreover, Internet functions have been incorporated into many appropriate technology-assisted devices to overcome the spatial and environmental constraints of remote patients. This increases accessibility to and the sustainability of professional healthcare services [34,35]. Specifically, recent mobile healthcare systems have begun delivering medical services using portable and wireless medical systems that enable biometric measurements, automatic diagnoses, and emergency alerts without imposing spatial constraints on patients and doctors. IoT technologies have proven to be very useful in this regard [36,37]. Simultaneously, advances in various smartphone-based mobile services have advanced and contributed to the development of novel healthcare products and platforms [38,39]. Mobile healthcare services are rapidly becoming commonplace owing to their ability to gather diverse personalized information and provide a way to continuously share periodic user status data [40,41,42,43]. Specifically, smart healthcare systems have been combined with noninvasive medical methods [44,45], to spearhead the global smart healthcare market [46,47,48,49].
In this study, we employed a simple and innovative design with a human-centered technological approach to develop a urinary compound analysis device using appropriate technologies. This tester comprises inexpensive sensors and mass-produced electronic components to reduce its net cost and expand its distribution. We integrated these sensors and electronic components into a microprocessor to enable potential and financially disadvantaged users to conveniently and inexpensively monitor their health. The proposed tester enables users to continuously check their health in real-time, in a simple and convenient manner. Subsequently, we demonstrated how the proposed tester facilitated remote and long-term monitoring as well as transmitted monitored data to hospitals with medical experts, allowing users to decide whether to visit hospitals/clinics for in-depth diagnoses. Furthermore, this tester enabled regular collection and accurate analysis of users’ urine daily, transmitting data in parallel with the users’ self-surveys of their health conditions, for use and comparison with their urine test results. Finally, we developed and applied a smartphone app that helps users easily access all their health data, thereby demonstrating the potential to connect remote patients with medical experts through mobile devices.

2. Materials and Methods

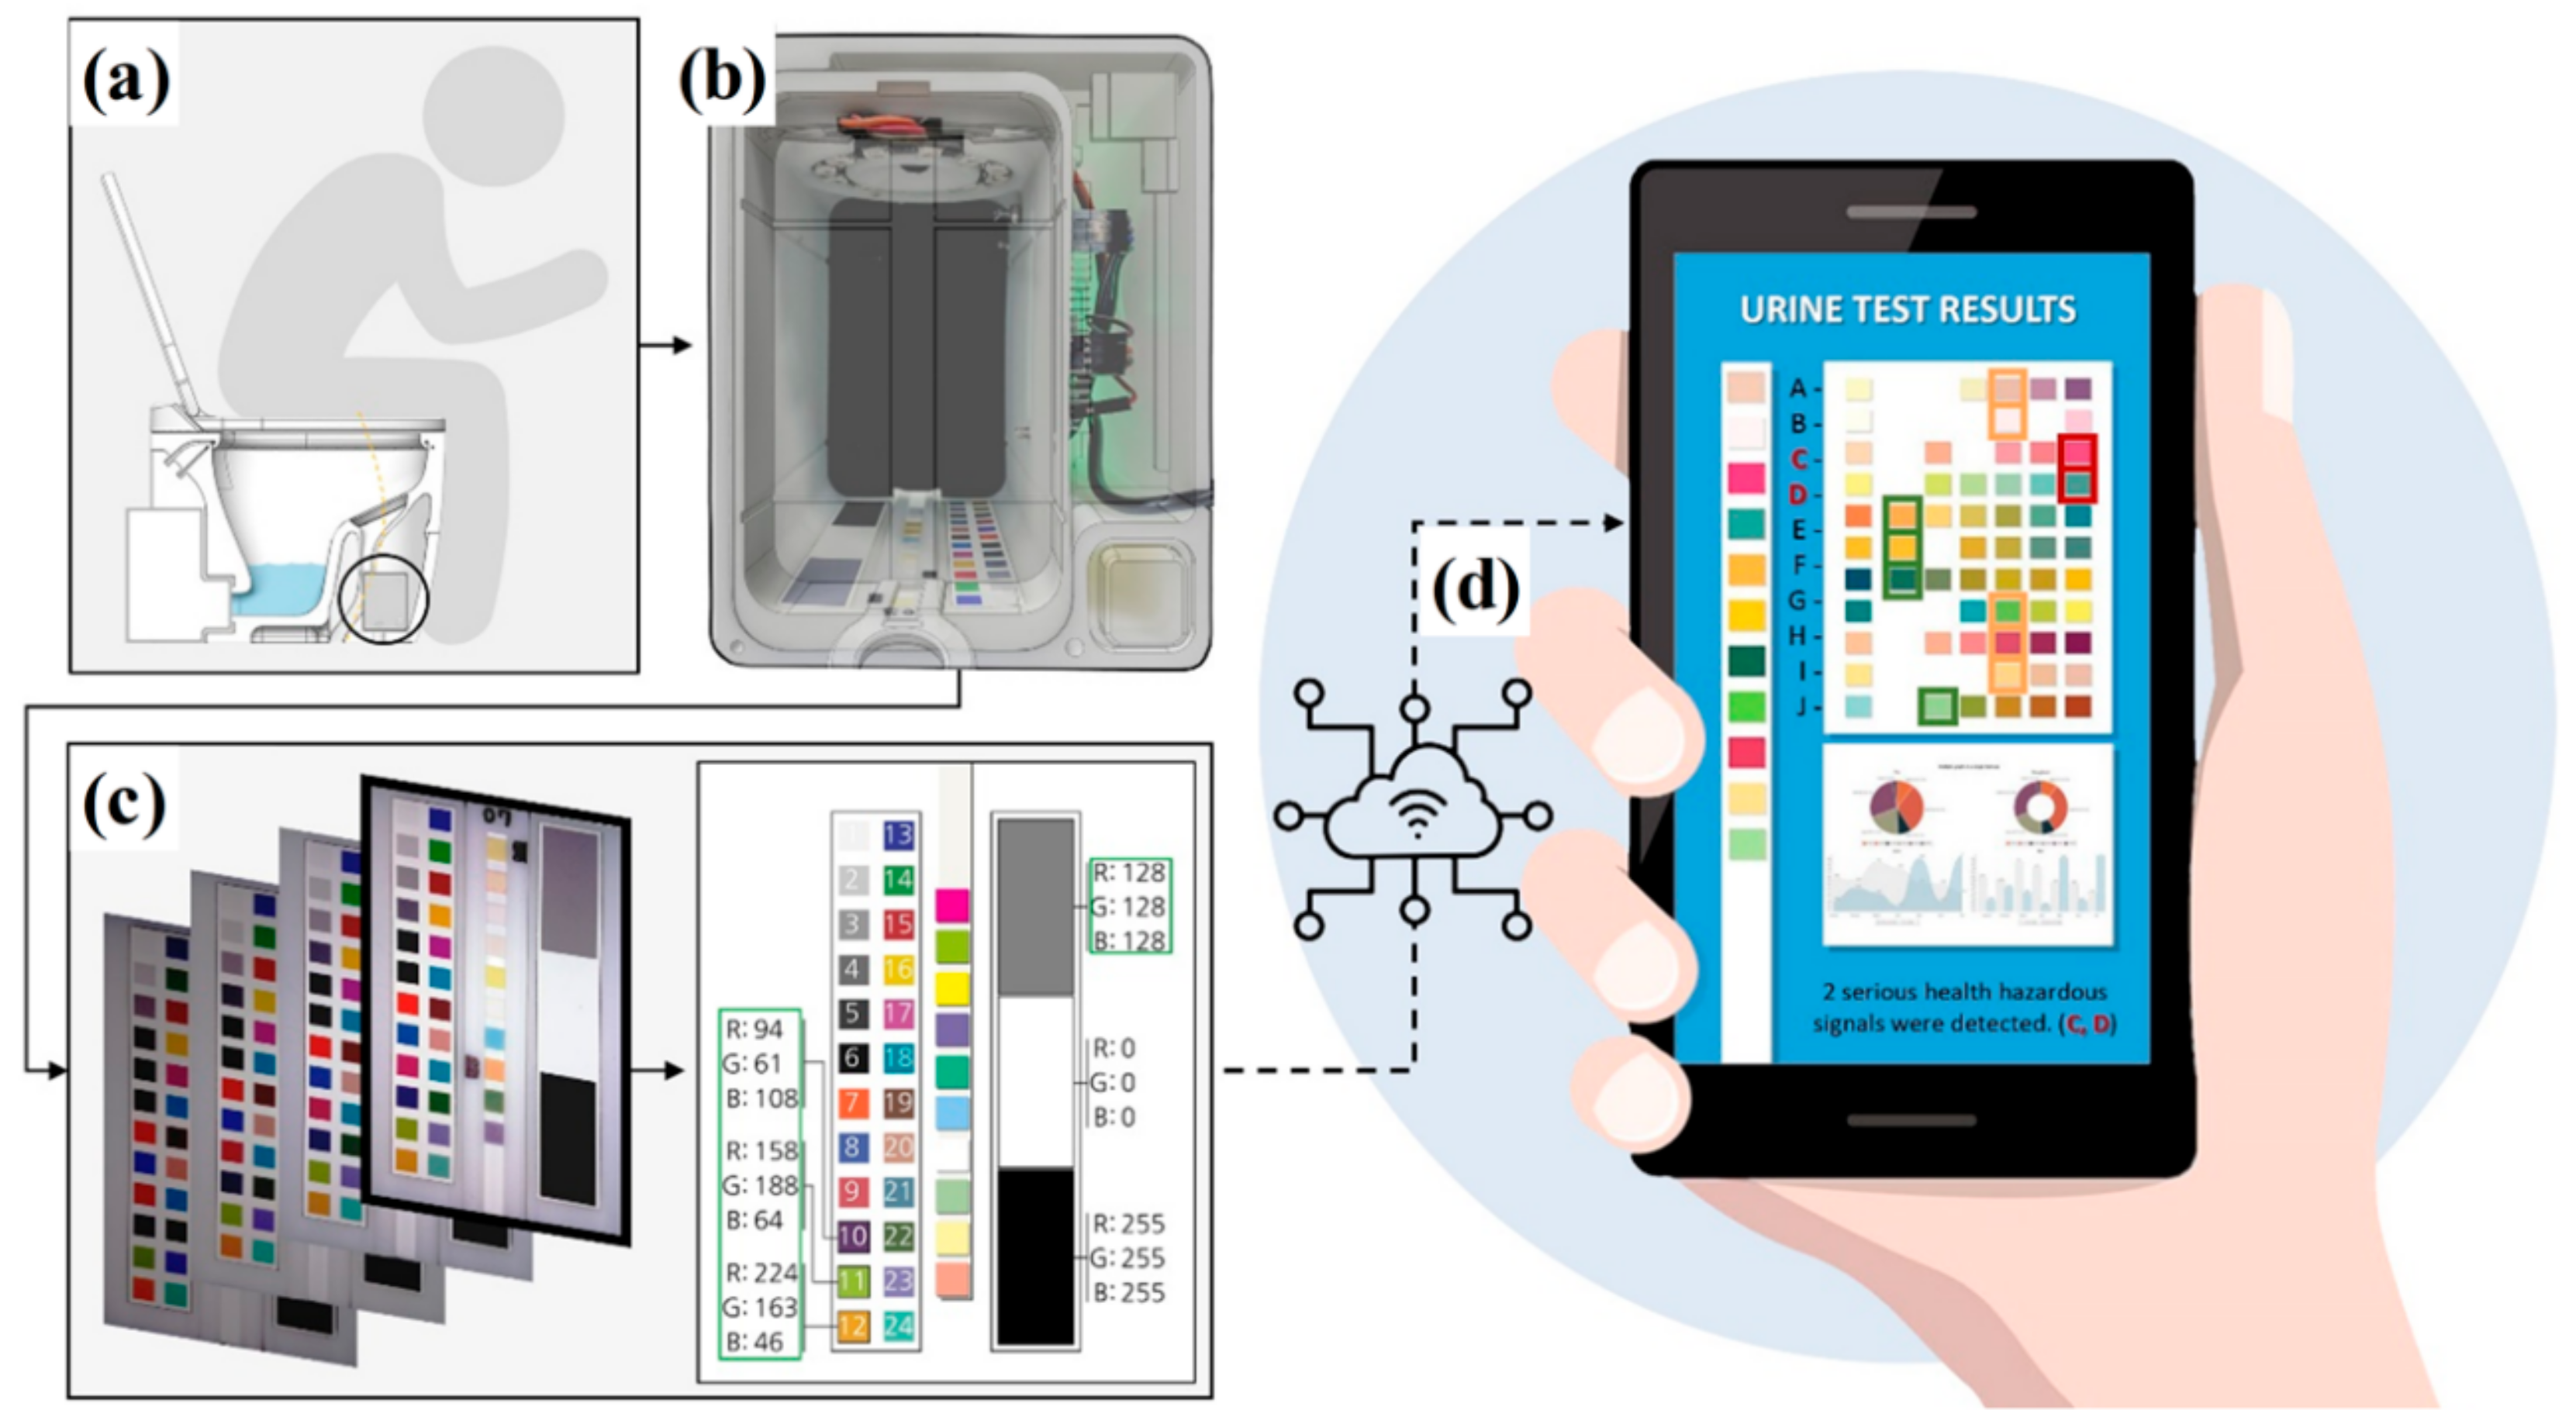
2.1. Conceptual Design of Urine Tester

Figure 1 shows the conceptual design of our urine tester for analyzing users’ urine during or after urination. In our previous study [50], we demonstrated a smart toilet that could automatically separate urine from feces during use, as shown in Figure 1a. We also suggested that a miniaturized urine tester could be installed in such a smart toilet to automatically analyze users’ urine. Currently, many urine testers are commercially available, but they are still inappropriate for integration into smart/regular toilets because of their size, disposability, and cost (>~ 150 USD) issues. In addition, no attempt has been made to integrate a urine tester into smart/regular toilets. As a result, users need to collect their urine sample, dip a urine reagent strip into the urine sample, and then place the strip into the tester. This process is inconvenient and uncomfortable. In the present study, we first focused on an appropriate technology-assisted urine tester that could be integrated into regular toilets in the near future. Figure 1b shows a urine tester that employs a charge-coupled device (CCD) camera to analyze the reaction of urine with reagents, instead of the popular red, green and blue (RGB) color sensors, to make the test device more compact and to lower the cost. The CCD camera captures several images to cancel out light noise and calibrates the light contrast to accurately measure the RGB values of the urine sample. Subsequently, the microprocessor calculates the RGB values of the reagent test strip. Figure 1c shows details of the calibration procedure, which are described in the “Color calibration” subsection below. Next, the concentrations of ten individual compounds of the urine sample are analyzed to determine the user’s health condition. The analyzed result is displayed in a qualitative manner rather than a quantitative one. We displayed distinct categories such as “negative”, “trace”, “small”, “moderate”, “large”, and “erroneous” for users according to the manufacturers’ guidelines. The quantitative results can be transmitted to hospitals online to obtain even more accurate clinical diagnoses from medical experts, such that proper medical advice, including a prescription, can be sent back to the users’ mobile devices, as shown in Figure 1d. This outlines the full concept of the proposed urine tester developed using appropriate technologies.

2.2. Product Development of Urine Tester

Figure 2 shows a prototype of the proposed urine tester. An outdated mobile phone or a recent smartphone can be used, but the tester was simply developed with several essential parts to demonstrate a low-cost and low-tech device. The cost breakdown of our urine tester is presented in Table S3 in the Supplementary Information. It comprises eight major components: (i) an RGB LED (light emitting diode) ring for uniform illumination (WS2812 NeoPixel Ring–12 × 5050 RGBW, NEX, Worldsemi, Guangdong, China); (ii) an RGB LED as a system status indicator (WS2818 9 mm LED Pixel Light, Worldsemi, Guangdong, China); (iii) a Raspberry Pi Zero W as a microprocessor (Raspberry Pi Zero W, Raspberry Pi Foundation, Cambridge, UK); (iv) a Raspberry Pi Zero 5 MP Camera for capturing images of urine test strips (Raspberry Pi Camera Module v1, Raspberry Pi Foundation, Cambridge, UK); (v) a 64 GB micro SD card for storing images and processing data (64 GB microSDXC, SanDisk, CA, US); (vi) a regular push switch for system operation and control; (vii) a regular DC power supply/adaptor (5 V, 1.5 A); and (viii) a 3D-printed opaque plastic box for minimizing light interference.
The camera module, which plays the most important role in the urine tester, is located at the top of the structure where the lighting device is installed to ensure that bright images are captured. In addition, a microprocessor is installed to process the captured images and transmit them to an external wireless communication device via a low-energy Bluetooth connection built into the microprocessor module. The housing of the urine tester system was designed using 3D modelling techniques and subsequently produced using 3D printers. The system size was engineered via calibration of the optical distance between the top and the bottom of the device to correctly capture vivid, focused images to enhance the quality of the CCD camera images. Both the raw image and the quantitatively analyzed data can be immediately transmitted to users’ mobile devices and other relevant professionals owing to the use of short-range, low-energy Bluetooth technology, enabling reuse of the original images should additional useful algorithms or custom-made analysis functions be available. It should be noted that urine test strips are placed at the bottom side of the structure to protect the CCD camera and other essential parts from urine samples as well as minimize and/or eliminate any hygiene and cross-contamination issues related to the test strips. This can be easily achieved by repeatedly using the top side but replacing the disposable bottom side with a new one.

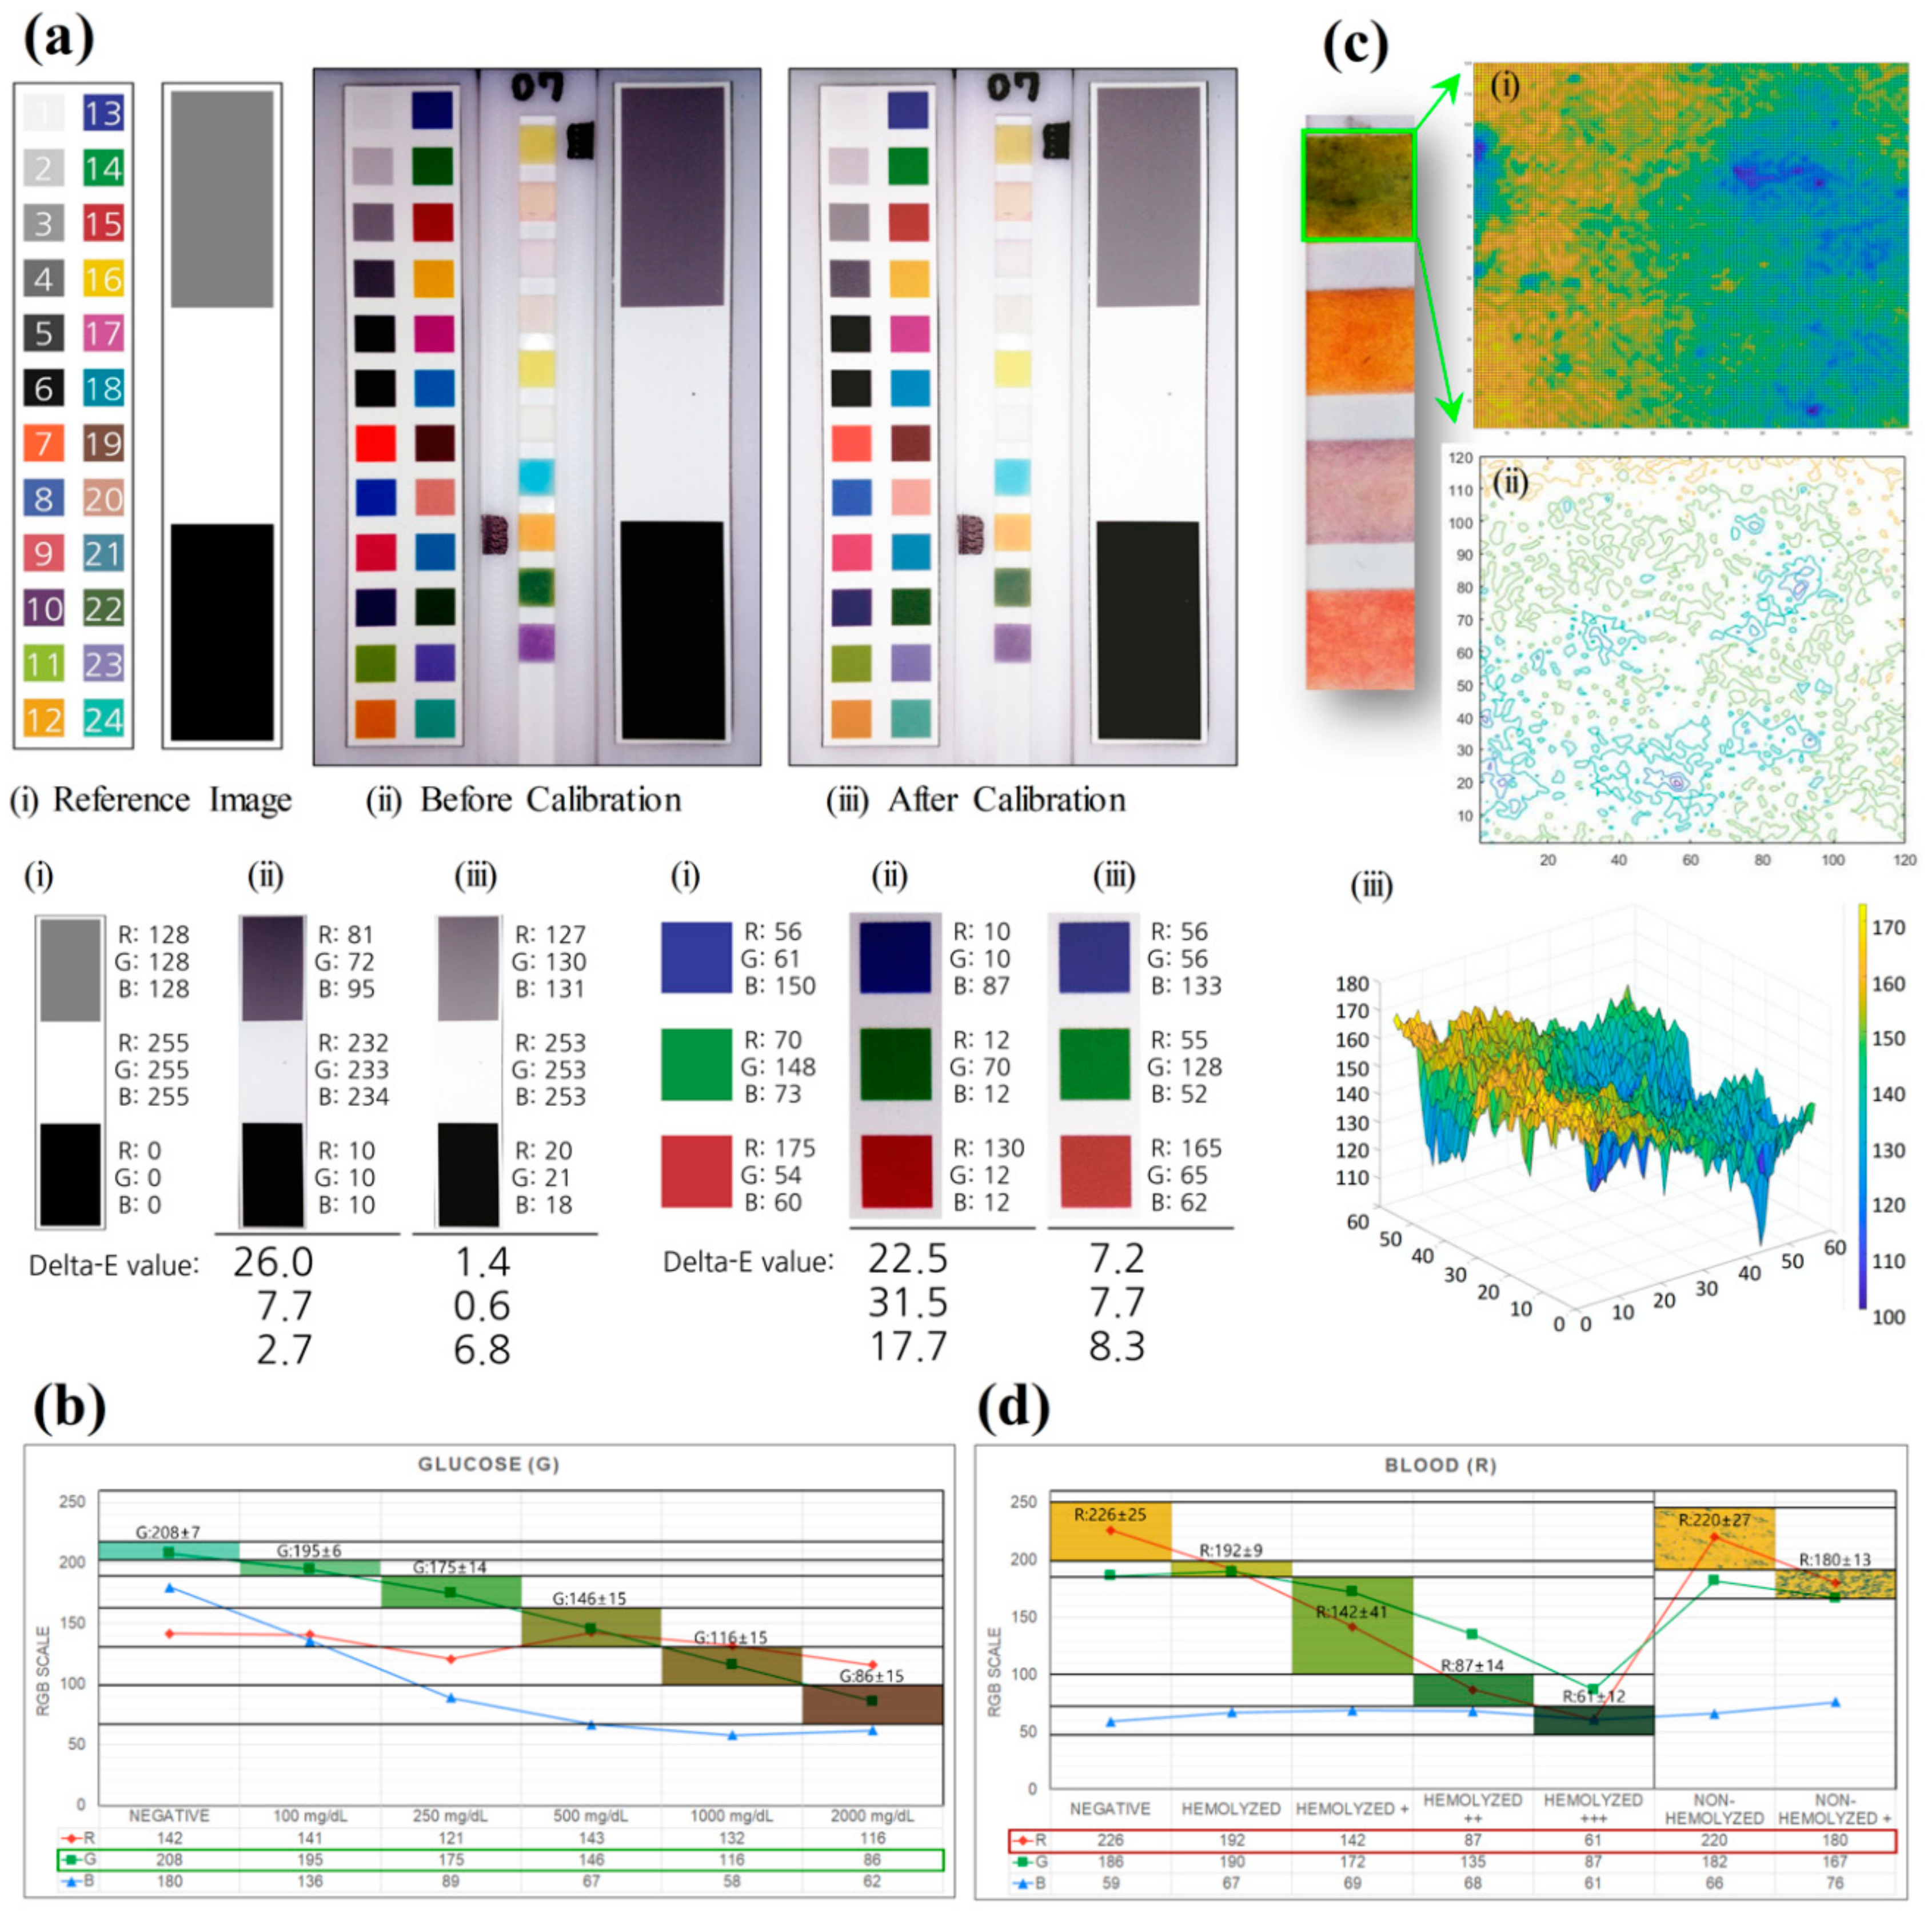
2.3. Color Calibration

Figure 3 shows the calibration process of the urine tester. The calibration depends on the RGB values of the images captured using the CCD camera to determine the concentrations of the ten different compounds in urine. As shown in Figure 3a, all the images obtained using the urine tester are calibrated, and color mapping is subsequently performed by comparing the images with the reference color scales provided by the manufacturer, as reported previously [51,52]. The RGB information of a color image displayed in a pixelated electronic device is generally corrected before printing is carried out on a substrate. In other words, the RGB information is converted to cyan, magenta, yellow, and black (CMYK) to enable an accurate representation of the color on a substrate when using an inkjet-type printer [53,54,55]. The color-correction process is essential in this study because the color information of the reference color scale and the urine test strips are based on CMYK. The CMYK information of a color image is converted into the corresponding RGB values when an image is captured using the CCD camera. Accordingly, all pieces of information in the images of the urine test strips and the reference color scales based on CMYK colorimetric information were converted to RGB-based colorimetric values in the proposed urine test device [56]. In this case, the color and white balances should be calibrated carefully to eliminate systematic errors [57,58,59]. An image processing algorithm was employed to perform RGB-based color mapping between the reference color scales provided by the manufacturers, and all the experimental images obtained (for details, refer to Table S1 and Figure S1 in the Supplementary Information).
The urine tester operates automatically as soon as a urine test strip is placed in a dark room and the device is switched on. Subsequently, the camera module starts capturing images of the urine test strip, comprising ten different reagent pads that change color in response to the urine sample. The urine test strip is ready approximately 1 min after being dipped in the urine. As shown in Figure 3a, the white and color balances need to be well established to increase the accuracy of the urine test device. Firstly, for the white balance, we used a black-and-white paper strip as a reference (i) and then manipulated the lighting conditions when capturing images, resulting in a very low DE value (<6.9); here, DE2 = (R1 − R1)2 + (G1 − G1)2 + (B1 − B1)2 is widely used to compare two images with a single representative figure [60]. In general, DE approaches zero when two colors are identical and becomes increasingly large as two colors become increasingly different; see the images and DE values before (ii) and after calibration (iii) in Figure 3a. Secondly, we controlled the color balance in the same manner. The RGB values of the three images (i.e., the reference image (i), the image before calibration (ii), and the image after calibration (iii)) were compared using the DE equation, resulting in color images that could be well calibrated by matching the color balance between them; the DE values were less than 8.3 after calibration.
After the camera module captures an image, the urine analysis algorithm is executed. During operation, the RGB LED ring is lit around the camera, and images are captured and stored. Only a portion of the urine test strip is cropped from the stored images to classify the RGB data of each test pad. The analyzed RGB data are used for mapping the reference color scale, which enables the indirect measurement of the amount of each compound. For example, Figure 3b shows the RGB values of the glucose pad out of the ten urine test pads. When the glucose concentration in the urine sample was lower than 100 mg/dL, the test pad displayed an emerald color and its RGB values were listed and plotted. However, when the glucose concentration was approximately 2000 mg/dL or higher, the test pad displayed a dark brown color. Although the RGB values showed different behaviors as the glucose concentration increased, the green value exhibited a highly linear behavior with the glucose concentration, indicating that this colorimetric mapping method was accurate enough to analyze the glucose concentration in the urine sample. The same RGB analysis method was applied to other urine compounds, and only one dominant factor out of three RGB values was required to accurately measure the concentration of the compounds. In conclusion, blood (only for nonhemolysis), protein, pH, and specific gravity showed a linear relationship with red values, and bilirubin, urobilinogen, ketones, nitrite, glucose, and leukocytes showed a linear relationship with green values. For further details, Figure S2 shows the correlation coefficients of the linear regressions of the ten compounds with the standard errors (i.e., R2 > 0.89). It is important to note that it is the number of sampling points determined by the manufacturer’s reference color images/scales that mostly affect the standard errors.
The calibration method used for blood should consider hemolysis because the RGB color mapping method is only valid when hemolysis occurs. In other words, when blood in the urine sample is hemolytic, the RGB values of the test pad for blood vary in a similar fashion to those for other urine compounds. However, when no hemolysis occurs, a different calibration method is needed to quantify red blood cells, as shown in Figure 3c.
The image of the test pad for blood was cropped from an original image (i) and subsequently converted into a two dimensional (2D) contour plot using the interpolation of RGB values (ii), thereby enabling us to count the number of clusters with the same color range in response to blood. The number of clusters is an important indicator of whether hemolysis has occurred. The pixel image (i) was subsequently combined with the contour plot (ii) to produce a three-dimensional (3D) contour image (iii). This process enabled an estimate of the amount of blood and the determination of the severity of the detected blood via an analysis of the number density and amplitude of singularity points/clusters. In the case of nonhemolysis, a new calibration was employed to quantify the amount of blood. However, in the case of hemolysis, the amount of blood was measured based on the red values of the images, ranging from 255 (negative) to 61 (severe), as shown in Figure 3d. The figure shows that the red values exhibit a good linear relationship with the amount of blood, as mentioned above. For nonhemolysis cases, another calibration method was used to detect blood via the analysis of red blood cell-stained patterns. In other words, the test pad partially discolors because the blood reaction forms an idiosyncratic spot on the test pad in a pattern similar to a dot, and the reaction does not, on average, significantly affect the overall color change.

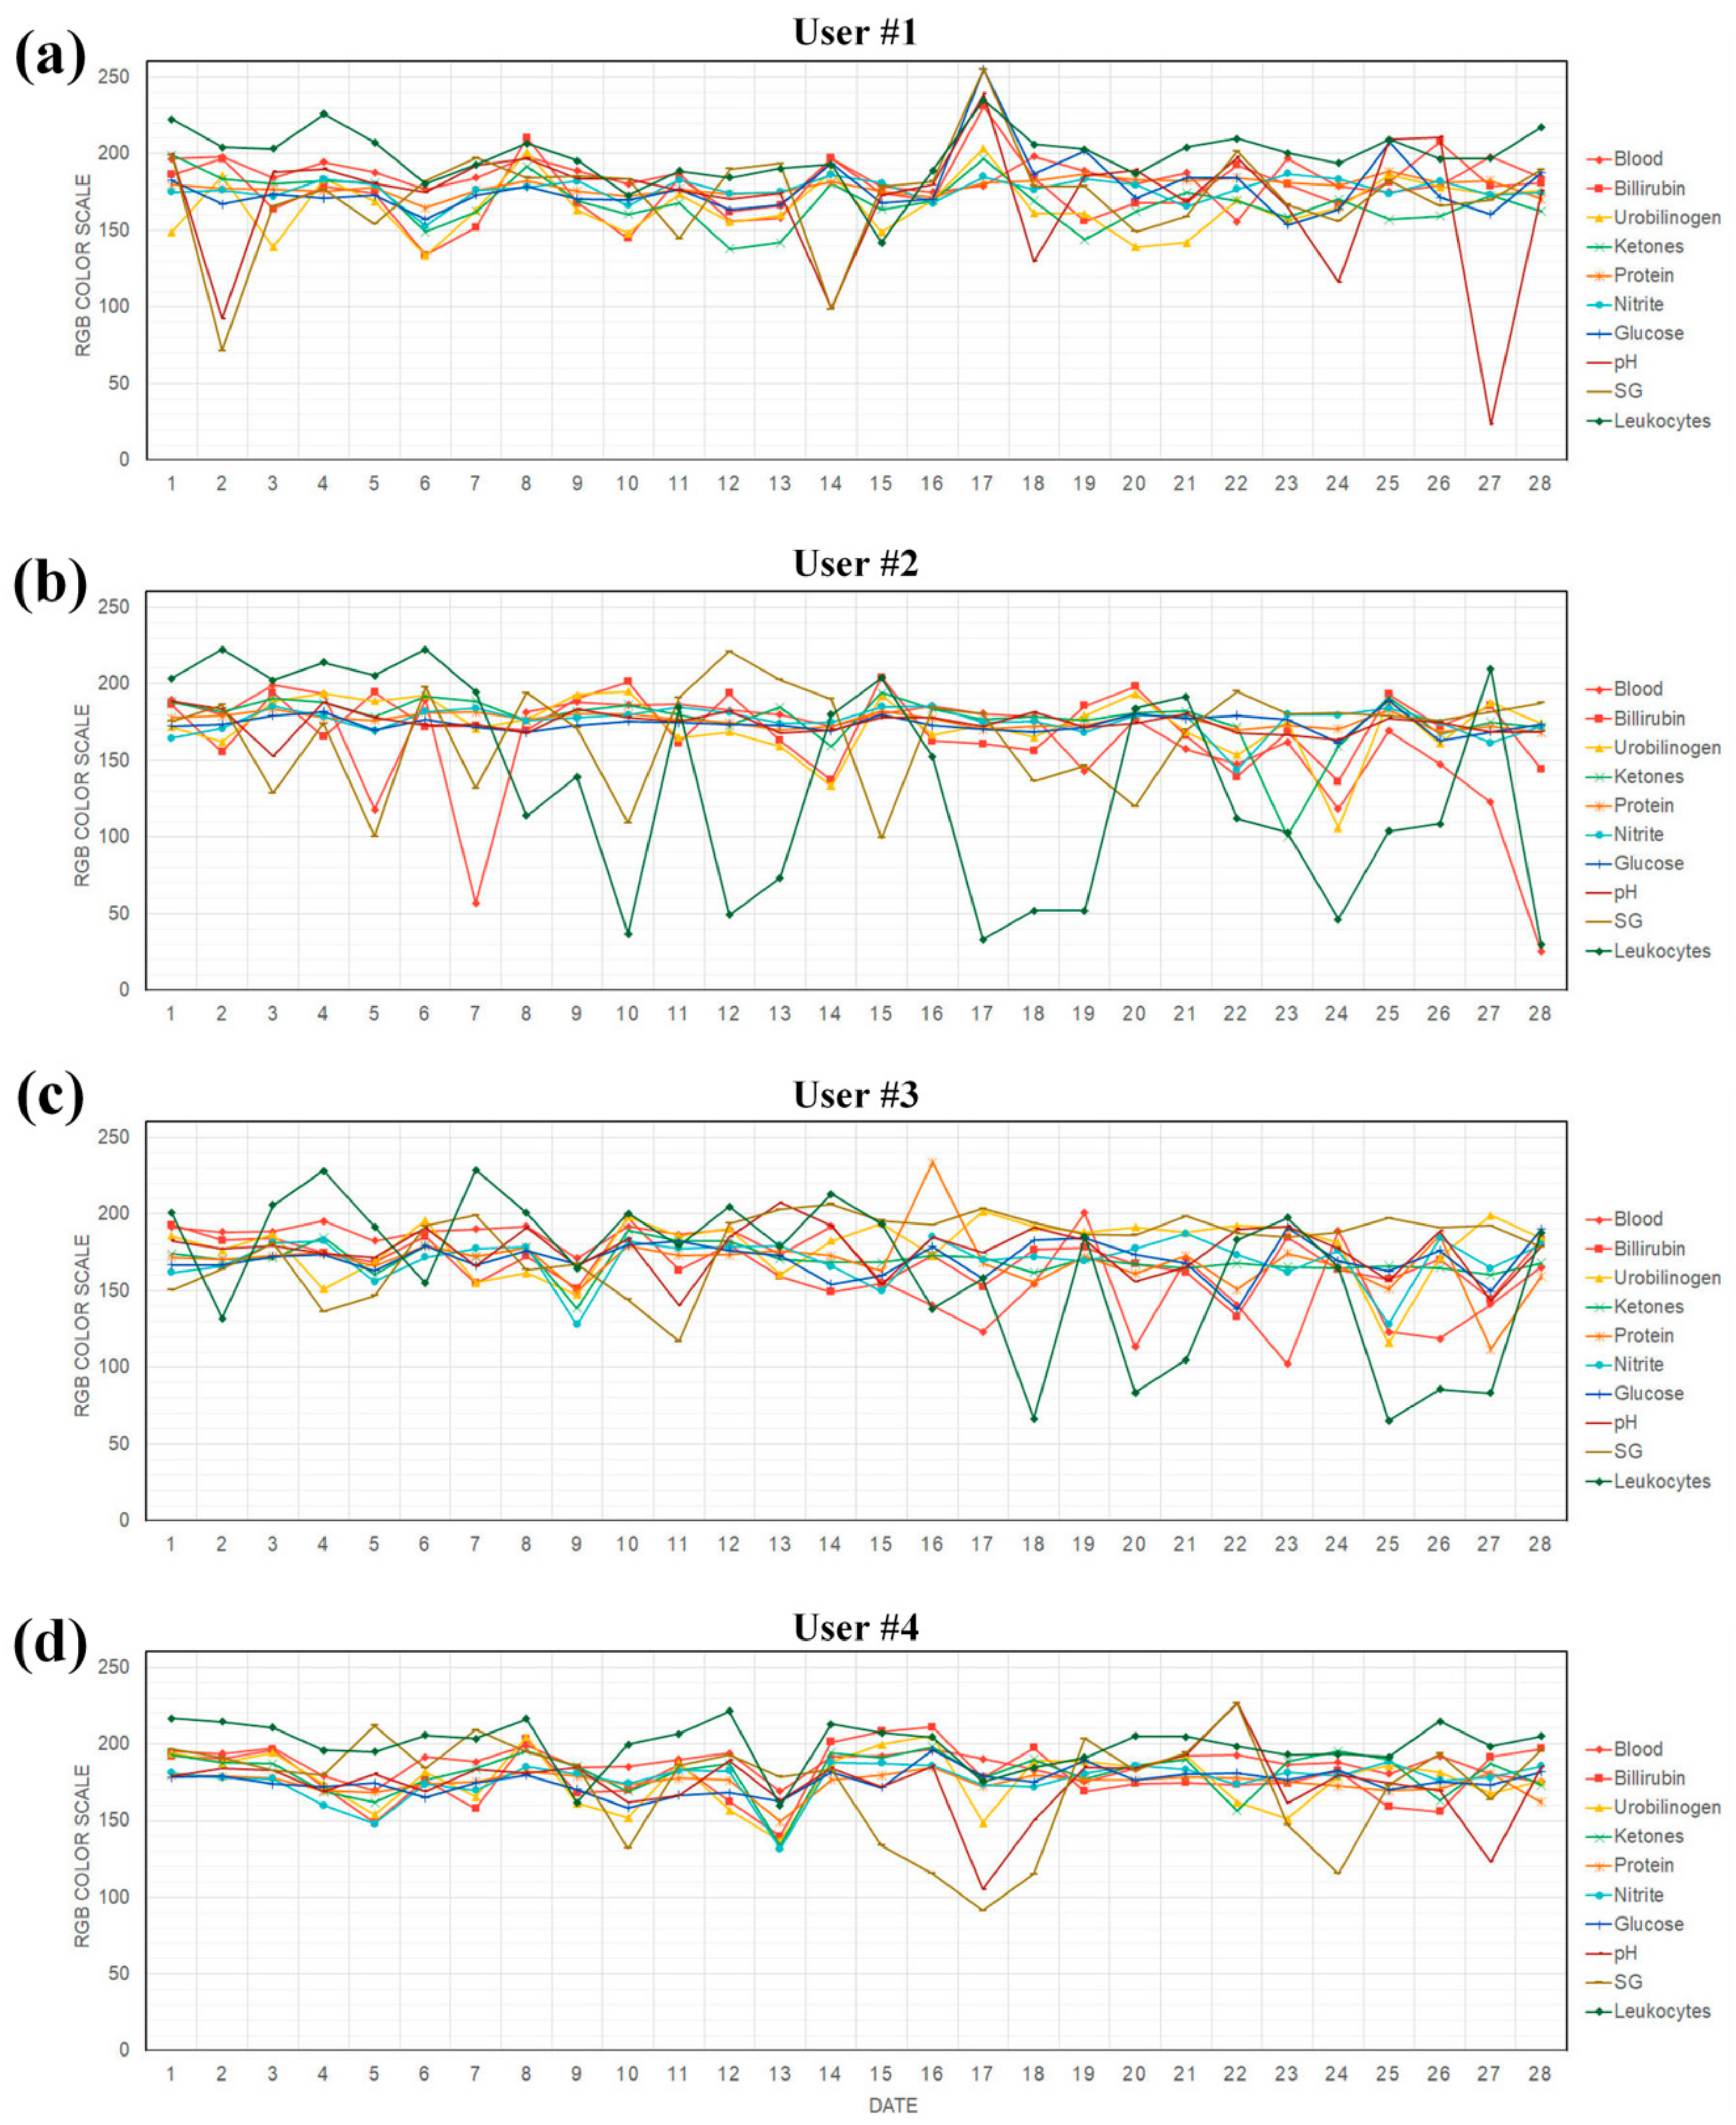
2.4. Test Procedure of Users

This study included four participants of different ages and genders (will be revealed later) who volunteered to have their urine tested and to record their health conditions in an online survey form over a four-week period (see Figure S3 in the Supplementary Information for the survey form). The participants were all in their late twenties, healthy, and had no chronic disease. Given that they volunteered to participate in this experiment, no approval was needed from the ethics committee of our university. The four participants might be insufficient to confirm the medical performance of the urine tester, but the aim was to provide an appropriate technology-assisted medical testing method to help potential users visit hospitals/clinics for in-depth diagnoses. In addition, it is unfortunate that no private medical records of the participant can be revealed and no medical advice can be provided to them in this work. Qualitative and quantitative health condition data was collected from the participants randomly named “User #1” to “User #4”, as shown in Figure 4. This experiment had three objectives: (1) to verify the accuracy and reliability of the urine tester; (2) to confirm if it was worthwhile to perform daily monitoring of the ten compounds in urine and whether the urine tester could provide useful information for diagnosing their health conditions; and (3) to evaluate whether the daily test results of urine compounds were medically helpful for diagnosing chronic diseases via the accumulation of big data through long-term monitoring. To demonstrate that the urine tester could fulfil these three objectives, we produced four units and distributed them to the four participants along with commercially available urine test strips. One participant installed the urine tester in his/her own restroom and then measured his/her urine daily for four weeks, as shown in Figure S4 in the Supplementary Information. The participant was also asked to record his/her health condition daily immediately after the urine test to compare the quantitative test results with qualitative evaluation. The other participants followed the same guidelines.

3. Results and Discussion

Figure 4 shows the urine test results of the four participants named “User #1” to “User #4.” The ten compounds in the urine samples were monitored for four weeks using the urine tester, and the resulting RGB values were plotted. Here, the y-axis represents the RGB values and the x-axis represents the test date. It can be observed that only one representative color value showed a crucial impact and a linear relationship with each compound in the urine. For example, given that glucose is most strongly influenced by the green component of the RGB values, the graphs display only green values ranging from zero to 255. The same approach was applied to the other compounds, except for blood in nonhemolytic conditions. In general, most RGB values lay between 100 and 220. In particular, “User #1” and “User #4” showed fairly uniform test results over the test period, and “User #2” and “User #3” showed relatively scattered test results. Specifically, “User #1” showed several singular points in specific gravity (SG) on the 2nd day and pH on the 27th day, as shown in Figure 4a. “User #2” showed two distinct singular points in the blood and many continual fluctuations in the leukocyte levels, as shown in Figure 4b. For “User #3”, most compound levels seemed to be normal, although the leukocyte levels fluctuated significantly over the entire experimental period, and the protein and blood levels showed mild variations, as shown in Figure 4c. Lastly, “User #4” showed the most repetitive behavior, except for the pH and SG parameters, which seemed to deteriorate on the 17th day. These quantitative analysis results were very informative and showed remarkable potential for diagnosing the participants’ health conditions and relevant diseases. However, participants could not easily diagnose or determine their health conditions by themselves; therefore, professional guidelines must be provided for their convenience.
It is important to verify the accuracy and reliability of our urine tester. To this end, we used a commercially available urine tester with accurate results and high performance, as shown in Figure S5 in the Supplementary Information, and then compared the test results of the same reference color images/maps provided by the manufacturer. Most compounds in the urine samples were measured in the same manner and showed good agreement, as listed in Table S2 in the Supplementary Information. However, proteins and leukocytes showed the most significant errors. Firstly, the protein detection errors can be attributed to the narrow color scale that is determined by the reaction between reagents and the target proteins [61]. The accuracy can be further improved using a higher-resolution CCD camera; however, this may affect the total cost of the appropriate technology-assisted urine test device. In fact, the camera showed sufficient resolution for other urine compounds too. Secondly, the leukocyte detection errors are affected by the reaction time. Typically, a complete reaction requires at least 2 min for leukocyte detection; however, this is longer than the approximately 1 min required for other compounds. Therefore, most multiplex sensors present an intrinsic trade-off problem. Assuming that the commercial urine tester achieves 100% accuracy for all compounds, we calculated the maximum errors of our device to be approximately 12.5%. In other words, we conducted urine tests using a commercial urine tester along with test strips purchased from a manufacturer and obtained the test results (Rref). Then, we repeated the urine tests with the same urine sample and the purchased test strips using our device and obtained the test results (Rexp). Then, we confirmed that our test results were as close as those from the commercial tester with maximum errors of 12.5% (i.e., errors = |RrefRexp|/Rref < 12.5%), implying that our test results showed an accuracy of 87.5% compared with the control results. This value was largely influenced by the protein and leukocyte detection errors and not those of other compounds for which the two devices showed a high degree of consistency. If accurate leukocyte detection is needed, the test strip can be dried longer than 2 min as specified by the manufacturer, thereby enhancing the accuracy. Of course, such an enhancement can be simply achieved by manipulating the software of the urine tester.
After verifying the accuracy, we standardized the experimental results of the ten compounds of the urine samples to provide qualitative advice to the four participants; such advice may be helpful for users to decide whether to visit hospitals or clinics. In addition, this approach is more reasonable and more practical for inexpensive medical devices, such as our urine test device, because these devices are not as reliable as professional and sophisticated diagnosis equipment. As shown in Figure 5, we used a 0-to-100 scale by rescaling the previous 0-to-255 y-axis in Figure 4. Subsequently, we divided the 0-to-100 scale into six separate and qualitative categories—“negative (light purple)”, “trace (light green)”, “small (yellow)”, “moderate (light orange)”, “large (light red)”, and “erroneous (pink)”—that indicate the users’ relative health conditions. This standardization was based exactly on the reference color scales provided by the manufacturer, as presented in Table S1 and Figure S1 in the Supplementary Information. We converted the reference color scales to RGB values and then rescaled them according to the guidelines. Therefore, users did not need to visually compare their test strips with the reference color scales. For example, when a participant is in good health, no glucose is detected in the urine, and an emerald color is displayed (i.e., “negative”). This indicates that the standardized health score was 100. In contrast, when the urine test strip is dark brown in color, which was located on the far right side of the table (i.e., “large”), it indicates that the participant’s health condition may have been compromised. In this case, the standardized health score was set to 25. When the standardized health score is less than 25, it indicates that systematic errors have occurred because, in reality, such an absolute value cannot be obtained using colorimetric detection methods. It should be noted that during the four-week-long experiments, the urine tester was forced not to display any error messages. This is because we intended for the users to operate the urine tester as carelessly as possible for a long period to obtain practical feedback. For example, users may have used the tester incorrectly, or the tester may have been affected by various unknown environmental conditions. The reliability of the device can be improved by upgrading the software and testing the robustness of the electronic devices used.
Figure 5a shows that “User #1” experienced slight variations in pH and SG on the 2nd and 14th days; however, the other compound levels were normal. The pH value on the 27th day was far beyond the normal range; this was attributed to artefacts in the urine or urine test strip. “User #2” and “User #3”, shown in Figure 5b,c, respectively, exhibited similar singularity points for the blood and leucocytes, shown in Figure 4b,c, respectively, although several data points were most likely errors. However, both showed moderate or large variations in bilirubin; this was a new finding obtained after rescaling the graphs. These two participants were female; therefore, their urine tests were subject to direct contamination by menstruation during the experiment. This was consistent with the participants’ self-survey results. “User #2” also suffered from allergic reactions throughout the trial period and was on constant medication; this may explain why her leukocyte levels were greater than those of other participants and deviated from the measurable range. Finally, “User #4” in Figure 5d showed a similar health condition as observed in Figure 4d; however, more singularity points than before were observed for SG and urobilinogen. Overall, all rescaled graphs showed amplified variations for the participants. Some compounds such as pH and protein turned out be to milder; however, others such as bilirubin, leukocyte, and urobilinogen were more serious compared with those in the unscaled graphs. Leukocyte, blood, urobilinogen, and bilirubin generally showed slight variations as the health conditions changed over time, whereas glucose, protein, nitrite, and ketone showed almost no variations. These results imply that all participants may have had temporarily poor health conditions; however, they may not have had serious health problems during the entire experimental period. This is in good agreement with their survey results.
In short, we demonstrated that an appropriate technology-assisted urine tester can help many people monitor their health conditions daily and automatically, making such a device a good example of a practical application of appropriate technologies. We showed that a tester of this nature could be developed to provide a low cost-to-performance ratio and high accuracy. It can therefore enhance the quality of life of many underprivileged people residing in remote regions by overcoming opportunity imbalances in healthcare services. It can also offer solutions for the sustainability of healthcare services in developed and underdeveloped countries. We found that this urine tester had a limited detection range for pH, leukocyte, and bilirubin; this can be attributed to the intrinsic colorimetric chemical reactions between the reagents and the urine samples. However, given that the tester showed many unique advantages in terms of cost, performance, accuracy, and simplicity, it could be mass-produced and distributed to many people who need regular health check-ups. It is noted that the production and maintenance costs of the tester are as low as 20 USD per set; for further information on the cost comparison of the tester with commercially available devices, refer to Tables S3 and S4 in the Supplementary Information. The costs of the microprocessor with a wireless module and the CCD camera are approximately 8 USD and 5 USD, respectively. However, additional studies should be conducted to reduce its production cost and improve the tester’s accuracy and performance. For instance, the 3D-printed device housing could be replaced with a paper package, as shown in Figure S6 in the Supplementary Information, to substantially reduce the production cost to approximately 2 USD. In addition, the housing can be redesigned for ease of assembly/disassembly to improve hygiene and avoid cross-contamination problems by disposing or replacing only the bottom part. Therefore, it seems that additional cost reduction in manufacturing and maintenance is possible for contact-based mass production.
As mentioned above, the proposed urine tester has wireless communication capability, so raw and analyzed data could be transmitted to users’ mobile devices and/or a hospital’s cloud server [62,63], although no such result was reported in this study. It should be noted that this tester was developed with minimal sensors and electronic parts and hence, it is simple to assemble and the software and hardware could easily be maintained without the need for professional expertise. Moreover, this tester captured four images of a urine test strip every day to compensate for the color and white balances, and all images were stored in the device for future use. The original raw data could be retrieved from the tester for post-processing or later use if an error occurred during the experiment or analysis process. In fact, the device software could be updated when unexpected errors are encountered, learning from any accidents that may have occurred. The proposed urine tester has some disadvantages such as the relatively low accuracy in protein detection, the use of a commercial test strip, its dependence on manufacturers’ reference color scales, and incompatibility with general urinals and culturally different toilets. However, we emphasize again its advantages such as its low production cost, simple and standalone operation, ease of integration with the Internet and IoT, simple maintenance and low cost, and extended durability through ease of assembly/disassembly. The question then arises whether the urine tester can be easily used by the elderly who do not use smartphones or mobile devices, who are not good at adopting and operating such devices, or who need attentive assistance and/or training [64,65]. If people can use such mobile devices, they can obtain additional benefits from the urine tester because they can obtain and check all the urine test results on their own mobile devices, as shown in Figure S1 in the Supplementary Information. In addition, remote medical services such as online prescription, medical advice, and professional consultation from medical doctors can be provided. On the other hand, although elderly people often do not own mobile devices and are not good at operating them, they can still check their health conditions easily using our urine tester, without connecting to the Internet or IoTs. This is the reason why we developed a urine tester with a standalone microprocessor and a CCD camera rather than using a mobile device with a CCD camera, such as a smartphone.
Lastly, it is worth discussing the future applications and development directions of this low-cost urine tester. Assuming that it can be successfully installed in regular toilets, users can urinate as they normally do without any additional effort. This is because the tester analyzes a user’s urine and then automatically transmits the analyzed data to remote medical experts working in hospitals/clinics. If the transmitted test results indicate a serious or critical health condition, the user needs to be relocated to a hospital/clinic as a potential patient, where state-of-the-art medical diagnostic equipment with high accuracy and high performance is available to reevaluate the pre-diagnostic results obtained from the urine tester. In this manner, the quality of life and opportunity balance regarding healthcare services for the poor and underprivileged may be significantly enhanced.

4. Conclusions

In summary, this study aimed to demonstrate that a creative design idea supported by affordable design processes could address complicated social sustainability problems, which remain a challenge. We not only demonstrated the application of appropriate technology design to healthcare systems but also provided an alternative solution for many people who have limited access to high-quality healthcare services. We explored the reasons for frequent health disparities, which have remained unresolved for decades for underprivileged people, and concluded that best practices for appropriate technology designs could result in cost-effective, high performance, and widely available solutions to address these opportunity imbalances regarding healthcare services and individual healthcare expectancy.
We developed a urine tester as part of a noninvasive health diagnosis and monitoring method. This product design comprised an inexpensive CCD camera as a colorimetric sensor, mass-produced electronic components to realize low production and maintenance costs, and commercially available urine tester strips to enable users measure urine compounds easily. In addition, testing steps were designed and verified through user-based research methods such as user testing, user surveys, and user interviews to demonstrate its high reliability in practical applications. The tester showed high accuracy and high reliability in the analysis of most urine compounds, thereby demonstrating its potential for improving the quality of life of its users and enhancing social sustainability in healthcare systems.
Moreover, the experiments demonstrated that this tester could be widely used and that its production costs could be reduced, both of which are fairly consistent with the study objectives. This tester was not only inexpensive to produce but also easy to maintain, implying that its expected costs in terms of service (20 USD per set) could be reduced, as its maintenance does not require specialized or highly skilled personnel. Therefore, the findings of this study demonstrate that an appropriate technology-assisted urine tester could be used to monitor individuals’ health conditions in an inexpensive and long-term manner, enabling as many people as possible to receive relatively enhanced healthcare benefits. This should be particularly helpful for the underprivileged and people in underdeveloped and developing countries. Lastly, we anticipate that creative designs, in successful combination with human-centered production processes and affordable appropriate technologies, will be applied to tackle many social sustainability problems in the near future in a similar manner to this work.

Supplementary Materials

The following are available online at https://www.mdpi.com/2071-1050/12/12/5165/s1.

Author Contributions

H.-K.L. and J.-H.B. conceived the idea and work. Under the supervision of H.-K.L., J.-H.B. developed the urine tester and conducted all the experiments. H.-K.L. and J.-H.B. analyzed and discussed all the experimental results. And then, H.-K.L. mostly wrote the manuscript with the aid of J.-H.B. All authors have read and agreed to the published version of the manuscript.

Funding

This research was funded by the National Research Foundation of Korea (NRF) grant funded by the Korean government (NRF-2015R1A5A7037825 and NRF-2019S1A5A2A01034882).

Acknowledgments

We thank all the participants for volunteering to have their urine tested and record their health conditions. All of them approved the use of their experimental data for publication.

Conflicts of Interest

The authors declare no conflict of interest.

References

  1. Powell, A. The Costs of Inequality: Money = Quality Health Care = Longer Life; Harvard Gazette: Cambridge, MA, USA, 2016. [Google Scholar]
  2. Woolf, S.H. How Are Income and Wealth Linked to Health and Longevity? Urban Institute: Washington, DC, USA, 2015. [Google Scholar]
  3. Wasserman, J.; Palmer, R.C.; Gomez, M.M.; Berzon, R.; Ibrahim, S.A.; Ayanian, J.Z. Advancing Health Services Research to Eliminate Health Care Disparities. Am. J. Public Heal. 2019, 109, S64–S69. [Google Scholar] [CrossRef]
  4. Marmot, M.; Allen, J.J. Social determinants of health equity. Soc. Determ. Health Equity 2014, S517–S519. [Google Scholar] [CrossRef]
  5. Ayanian, J.Z.; Landon, B.E.; Newhouse, J.P.; Zaslavsky, A.M. Racial and ethnic disparities among enrollees in Medicare Advantage plans. New Engl. J. Med. 2014, 371, 2288–2297. [Google Scholar] [CrossRef] [PubMed] [Green Version]
  6. Glied, S.; Lleras-Muney, A. Health Inequality, Education and Medical Innovation. Health Inequal. Educ. Med. Innov. 2003, 9738, 741–761. [Google Scholar] [CrossRef]
  7. Zimmerman, F.J.; Anderson, N.W. Trends in Health Equity in the United States by Race/Ethnicity, Sex, and Income, 1993-2017. JAMA Netw. Open 2019, 2, e196386. [Google Scholar] [CrossRef] [PubMed]
  8. Fiscella, K.A.; Franks, P.; Gold, M.R.; Clancy, C.M. Inequality in quality: Addressing socioeconomic, racial, and ethnic disparities in health care. JAMA 2000, 283, 2579–2584. [Google Scholar] [CrossRef] [PubMed]
  9. Ilinca, S.; Di Giorgio, L.; Salari, P.; Chuma, J. Socio-economic inequality and inequity in use of health care services in Kenya: Evidence from the fourth Kenya household health expenditure and utilization survey. Int. J. Equity Heal. 2019, 18, 1–13. [Google Scholar] [CrossRef] [Green Version]
  10. O’Donnell, O. Access to health care in developing countries: Breaking down demand side barriers. Cad. Saúde Pública 2007, 23, 2820–2834. [Google Scholar] [CrossRef] [PubMed] [Green Version]
  11. Gwatkin, D.R.; Bhuiya, A.; Victora, C.G. Making health systems more equitable. Lancet 2004, 364, 1273–1280. [Google Scholar] [CrossRef]
  12. Ensor, T.; Cooper, S. Overcoming barriers to health service access: Influencing the demand side. Heal. Policy Plan. 2004, 19, 69–79. [Google Scholar] [CrossRef] [Green Version]
  13. Majumder, S.; Aghayi, E.; Noferesti, M.; Memarzadeh-Tehran, H.; Mondal, T.K.; Pang, Z.; Deen, J. Smart Homes for Elderly Healthcare—Recent Advances and Research Challenges. Sensors 2017, 17, 2496. [Google Scholar] [CrossRef] [PubMed] [Green Version]
  14. Mahoney, E.; Kun, J.; Smieja, M.; Fang, Q. Review—Point-of-Care Urinalysis with Emerging Sensing and Imaging Technologies. J. Electrochem. Soc. 2020, 167, 037518. [Google Scholar] [CrossRef]
  15. Park, S.-M.; Won, D.D.; Lee, B.J.; Escobedo, D.; Esteva, A.; Aalipour, A.; Ge, T.J.; Kim, J.H.; Suh, S.; Choi, E.H.; et al. A mountable toilet system for personalized health monitoring via the analysis of excreta. Nat. Biomed. Eng. 2020, 4, 624–635. [Google Scholar] [CrossRef] [PubMed]
  16. Akraa, S.; Tam, A.P.T.; Shen, H.; Tang, Y.; Tang, B.Z.; Li, J.S.J.; Walker, S.; Pham, T.T.A. A smartphone-based point-of-care quantitative urinalysis device for chronic kidney disease patients. J. Netw. Comput. Appl. 2018, 115, 59–69. [Google Scholar] [CrossRef]
  17. Lepowsky, E.; Ghaderinezhad, F.; Knowlton, S.; Tasoglu, S. Paper-based assays for urine analysis. Biomicrofluidics 2017, 11, 051501. [Google Scholar] [CrossRef] [PubMed]
  18. Dunn, P.D. Intermediate Technology and Appropriate Technology. In Appropriate Technology; Springer Science and Business Media LLC: Berlin/Heidelberg, Germany, 1978; pp. 40–54. [Google Scholar]
  19. Roberts, J. Supporting medical technology in developing countries—What is appropriate? IEE Semin. Appropr. Med Technol. Dev. Ctries. 2000, 2000, 2. [Google Scholar] [CrossRef]
  20. Crilly, N. The roles that artefacts play: Technical, social and aesthetic functions. Des. Stud. 2010, 31, 311–344. [Google Scholar] [CrossRef] [Green Version]
  21. Newton, R.; Mytton, O.T.; Aggarwal, R.; Runciman, W.B.; Free, M.; Fahlgren, B.; Akiyama, M.; Farlow, B.; Yaron, S.; Locke, G.; et al. Making existing technology safer in healthcare. Qual. Saf. Heal. Care 2010, 19, i15–i24. [Google Scholar] [CrossRef] [Green Version]
  22. Roth, S. The State of Design Research. Des. Issues 1999, 15, 18. [Google Scholar] [CrossRef]
  23. Desmet, P.M.A.; Hekkert, P. Framework of product experience. Int. J. Des. 2007, 1, 57–66. [Google Scholar]
  24. Elsanousi, S.; Abdelrahman, S.; Elshiekh, I.; Elhadi, M.; Mohamadani, A.; Habour, A.; Elamin, S.E.; Elnoury, A.; Ahmed, E.A.; Hunter, P.R. A study of the use and impacts of LifeStraw™ in a settlement camp in southern Gezira, Sudan. J. Water Heal. 2009, 7, 478–483. [Google Scholar] [CrossRef] [PubMed] [Green Version]
  25. Bhamla, M.S.; Benson, B.; Chai, C.; Katsikis, G.; Johri, A.; Prakash, M. Hand-powered ultralow-cost paper centrifuge. Nat. Biomed. Eng. 2017, 1, 9. [Google Scholar] [CrossRef]
  26. Wooster, M.M. The Spectacular Failure of One Laptop Per Child; Philanthropy Daily: Washington, DC, USA, 2018. [Google Scholar]
  27. Taha, A.S.; Grant, V.; Kelly, R.W. Urinalysis for interleukin-8 in the non-invasive diagnosis of acute and chronic inflammatory diseases. Postgrad. Med. J. 2003, 79, 159–163. [Google Scholar] [CrossRef] [PubMed]
  28. Fortes, M.B.; Owen, J.; Raymond-Barker, P.; Bishop, C.; Elghenzai, S.; Oliver, S.J.; Walsh, N.P. Is This Elderly Patient Dehydrated? Diagnostic Accuracy of Hydration Assessment Using Physical Signs, Urine, and Saliva Markers. J. Am. Med Dir. Assoc. 2015, 16, 221–228. [Google Scholar] [CrossRef] [Green Version]
  29. Lundberg, G.D. Basic Urinalysis. JAMA 1979, 242, 2802. [Google Scholar] [CrossRef]
  30. Tetrault, G.A. Automated Reagent Strip Urinalysis: Utility in Reducing Work Load of Urine Microscopy and Culture. Lab. Med. 1994, 25, 162–167. [Google Scholar] [CrossRef]
  31. Sreemathy, V.; Dandekar, S.P. Nutrition and Biochemistry for Nurses, 2nd ed.; Elsevier Health Sciences: Amsterdam, The Netherlands, 2015. [Google Scholar]
  32. Chao, M.-R.; Shih, Y.-M.; Hsu, Y.-W.; Liu, H.-H.; Chang, Y.-J.; Lin, B.-H.; Hu, C.-W. Urinary nitrite/nitrate ratio measured by isotope-dilution LC–MS/MS as a tool to screen for urinary tract infections. Free. Radic. Boil. Med. 2016, 93, 77–83. [Google Scholar] [CrossRef]
  33. He, X.; Pei, Q.; Xu, T.; Zhang, X. Smartphone-based tape sensors for multiplexed rapid urinalysis. Sens. Actuators B Chem. 2020, 304, 127415. [Google Scholar] [CrossRef]
  34. Kumar, Y.; Sood, K.; Kaul, S.; Vasuja, R. Big Data Analytics and Its Benefits in Healthcare. In Studies in Big Data; Springer Science and Business Media LLC: Berlin/Heidelberg, Germany, 2019; pp. 3–21. [Google Scholar]
  35. Mohapatra, S.; Mohanty, S.; Mohanty, S. Smart Healthcare: An Approach for Ubiquitous Healthcare Management Using IoT. In Big Data Analytics for Intelligent Healthcare Management; Elsevier BV: Amsterdam, The Netherlands, 2019; pp. 175–196. [Google Scholar]
  36. Bhatt, Y.; Bhatt, C. Internet of things in healthcare. Springer Cham. 2017, 23, 13–33. [Google Scholar]
  37. Chettri, L.; Bera, R. A Comprehensive Survey on Internet of Things (IoT) Toward 5G Wireless Systems. IEEE Internet Things J. 2020, 7, 16–32. [Google Scholar] [CrossRef]
  38. Yang, N.; Zhao, X.; Zhang, H. A non-contact health monitoring model based on the Internet of things. Inbiosensors. In Proceedings of the 2012 8th International Conference on Natural Computation, Chongqing, China, 29–31 May 2012; pp. 506–510. [Google Scholar]
  39. Lee, B.M. Design Requirements for IoT Healthcare Model using an Open IoT Platform. Computer 2014, 4, 5. [Google Scholar] [CrossRef] [Green Version]
  40. Park, J.; Kim, K.-Y.; Kwon, O. Comparison of machine learning algorithms to predict psychological wellness indices for ubiquitous healthcare system design. In Proceedings of the 2014 International Conference on Innovative Design and Manufacturing (ICIDM), Montreal, QC, Canada, 13–15 August 2014; pp. 263–269. [Google Scholar]
  41. Sahoo, P.K.; Mohapatra, S.K.; Wu, S.-L. Analyzing Healthcare Big Data with Prediction for Future Health Condition. IEEE Access 2016, 4, 9786–9799. [Google Scholar] [CrossRef]
  42. Ta, V.-D.; Liu, C.-M.; Nkabinde, G.W. Big data stream computing in healthcare real-time analytics. In Proceedings of the 2016 IEEE International Conference on Cloud Computing and Big Data Analysis (ICCCBDA), Chengdu, China, 5–7 July 2016; pp. 37–42. [Google Scholar]
  43. Bora, D.J. Big Data Analytics in Healthcare: A Critical Analysis. In Big Data Analytics for Intelligent Healthcare Management; Elsevier BV: Amsterdam, The Netherlands, 2019; pp. 43–57. [Google Scholar]
  44. Xu, K.; Zhou, R.; Takei, K.; Hong, M. Toward Flexible Surface-Enhanced Raman Scattering (SERS) Sensors for Point-of-Care Diagnostics. Adv. Sci. 2019, 6, 1900925. [Google Scholar] [CrossRef] [PubMed]
  45. Hong, Y.S.; Jeong, H.; Cho, K.W.; Lu, N.; Kim, D.-H. Wearable and Implantable Devices for Cardiovascular Healthcare: From Monitoring to Therapy Based on Flexible and Stretchable Electronics. Adv. Funct. Mater. 2019, 29, 1808247. [Google Scholar] [CrossRef]
  46. Park, S.; Seo, H.; Cha, S.; Noh, J. Auto-calibration of multi-projector displays with a single handheld camera. In Proceedings of the 2015 IEEE Scientific Visualization Conference (SciVis), Chicago, IL, USA, 25–30 October 2015; pp. 65–72. [Google Scholar]
  47. Kumar, M.; Powduri, P.; Reddy, A. An RGB image encryption using diffusion process associated with chaotic map. J. Inf. Secur. Appl. 2015, 21, 20–30. [Google Scholar] [CrossRef]
  48. Bui, T.; Vu, T.T.; Hong, K.-S. Extraction of sparse features of color images in recognizing objects. Int. J. Control. Autom. Syst. 2016, 14, 616–627. [Google Scholar] [CrossRef]
  49. Tyagi, V. Content-Based Image Retrieval Using Integrated Color, Texture, and Shape Features. In Content-Based Image Retrieval; Springer Science and Business Media LLC: Berlin/Heidelberg, Germany, 2017; pp. 257–271. [Google Scholar]
  50. Bae, J.-H.; Lee, H.-K. User Health Information Analysis with a Urine and Feces Separable Smart Toilet System. IEEE Access 2018, 6, 78751–78765. [Google Scholar] [CrossRef]
  51. Murillo-Escobar, M.; Cruz-Hernández, C.; Abundiz-Pérez, F.; Gutierrez, R.M.L.; Del Campo, O.A. A RGB image encryption algorithm based on total plain image characteristics and chaos. Signal Process. 2015, 109, 119–131. [Google Scholar] [CrossRef]
  52. Komatsu, T.; Mohammadi, S.; Busa, L.S.A.; Maeki, M.; Ishida, A.; Tani, H.; Tokeshi, M. Image analysis for a microfluidic paper-based analytical device using the CIE L*a*b* color system. Anal. 2016, 141, 6507–6509. [Google Scholar] [CrossRef] [Green Version]
  53. Zeisl, B.; Pollefeys, M. Structure-based auto-calibration of RGB-D sensors. In Proceedings of the 2016 IEEE International Conference on Robotics and Automation (ICRA), Stockholm, Sweden, 16–20 May 2016; pp. 5076–5083. [Google Scholar]
  54. Tan, W.; Zhang, L.; Shen, W. Low-Cost Chemical-Responsive Adhesive Sensing Chips. ACS Appl. Mater. Interfaces 2017, 9, 42366–42371. [Google Scholar] [CrossRef]
  55. Ma, H.; Xu, Z.; Feng, H.; Li, Q.; Chen, Y.; Huang, J. Texture aware learning-based image fusion method for fixed focal-length cameras. Opt. Sens. Imaging Technol. Appl. 2017, 10462, 104624V. [Google Scholar] [CrossRef]
  56. Shen, L.; Hagen, J.A.; Papautsky, I. Point-of-care colorimetric detection with a smartphone. Lab Chip 2012, 12, 4240. [Google Scholar] [CrossRef]
  57. Wang, X.-Y.; Yang, L.; Liu, R.; Kadir, A. A chaotic image encryption algorithm based on perceptron model. Nonlinear Dyn. 2010, 62, 615–621. [Google Scholar] [CrossRef]
  58. Dong, C. Color image encryption using one-time keys and coupled chaotic systems. Signal Process. Image Commun. 2014, 29, 628–640. [Google Scholar] [CrossRef]
  59. Kumar, M.; Mishra, D.; Sharma, R.K. A first approach on an RGB image encryption. Opt. Lasers Eng. 2014, 52, 27–34. [Google Scholar] [CrossRef]
  60. Zhou, J.; Dong, T. Design of a wearable device for real-time screening of urinary tract infection and kidney disease based on smartphone. Analyst 2018, 143, 2812–2818. [Google Scholar] [CrossRef]
  61. Suresh, V.; Qunya, O.; Kanta, B.L.; Yuh, L.Y.; Chong, K.S.L. Non-invasive paper-based microfluidic device for ultra-low detection of urea through enzyme catalysis. R. Soc. Open Sci. 2018, 5, 171980. [Google Scholar] [CrossRef] [PubMed] [Green Version]
  62. Kafeza, E.; Chiu, D.K.W.; Cheung, S.C.; Kafeza, M. Alerts in mobile healthcare applications: Requirements and pilot study. IEEE Trans. Inf. Technol. Biomed. 2004, 8, 173–181. [Google Scholar] [CrossRef]
  63. Aragues, A.; Escayola, J.; Martinez, I.; Valle, P.; Muñoz, P.; Trigo, J.D.; Garcia, J. Trends and challenges of the emerging technologies toward interoperability and standardization in e-health communications. IEEE Commun. Mag. 2011, 49, 182–188. [Google Scholar] [CrossRef]
  64. Demiris, G.; Rantz, M.; Aud, M.A.; Marek, K.D.; Tyrer, H.W.; Skubic, M.; Hussam, A.A. Older adults’ attitudes towards and perceptions of ‘smart home’ technologies: A pilot study. Med Inform. Internet Med. 2004, 29, 87–94. [Google Scholar] [CrossRef] [PubMed]
  65. Hensel, B.K.; Demiris, G. Technologies for an Aging Society: A Systematic Review of “Smart Home” Applications. Yearb. Med. Inform. 2008, 17, 33–40. [Google Scholar] [CrossRef] [Green Version]
Figure 1. (a) Schematic diagram showing urine can be automatically tested while users sit on a smart toilet that separates urine from feces. (b) Proposed urine tester comprises inexpensive sensors and mass-produced electronic parts. (c) Images of the urine reagent strip absorbing the collected urine are captured using the charge-coupled device (CCD) camera module of the urine tester, and their white balances are subsequently calibrated using a sequence of images taken at four different light levels. After autocalibration, the RGB color information of the strip is converted into digital values and then compared with the reference provided by the manufacturer. (d) All test results can be wirelessly transmitted to hospitals/clinics as well as users’ mobile devices.
Sustainability 12 05165 g001
Figure 2. (a) The urine tester comprises sensors, electronic parts, and a microprocessor module. All components are enclosed in an opaque plastic case, manufactured using 3D printers to minimize light interference. (b) Approximate circuit diagrams of the urine tester; the power supply can be replaced with AA batteries for portable use (bottom). The legend describes the numbered components.
Sustainability 12 05165 g002
Figure 3. The calibration process of the urine tester matches white and color balances in the images. (a) (i) Reference image showing various color pads as well as a black-and-white pad used for matching color and white balances. (ii) Experimental image before calibration; the resulting DE values are relatively larger. (iii) After calibration of the same experimental image; DE values are significantly reduced for the white and color balances. (b) The RGB values are decomposed from the glucose pad of the urine test strip, and the red values are almost linearly proportional to the glucose concentration. (c) The amount of blood in urine is calibrated in two steps. (i) A color image of the blood pad of the urine test strip is captured. (ii) The RGB values are plotted in a 2D contour manner using an interpolation method. (iii) The original image and contour plot images are combined to reconfigure a 3D contour plot in which the number density and amplitude are used to count the red blood cells (i.e., amount of nonhemolytic blood) within a given threshold. (d) The amount of blood is measured based on the red values in the same manner as that for glucose for hemolysis and via additional image processing involving quantification of the number density and amplitude of red blood cell-stained patterns for nonhemolysis.
Sustainability 12 05165 g003
Figure 4. Experimental results collected from four participants using the urine tester for four weeks. (a) “User #1”. (b) “User #2”. (c) “User #3”. (d) “User #4”. These are randomly named for convenience.
Sustainability 12 05165 g004
Figure 5. Quantitatively analyzed results of ten compounds of the urine samples of the four participants rescaled and divided into six separate categories—“negative (light purple)”, “trace (light green)”, “small (yellow)”, “moderate (light orange)”, “large (light red)”, and “erroneous (pink)”—that indicate users’ relative health conditions. (a) “User #1”. (b) “User #2”. (c) “User #3”. (d) “User #4”.
Sustainability 12 05165 g005

