Article

Deep Learning Model for Form Recognition and Structural Member Classification of East Asian Traditional Buildings

School of Architecture, Hanyang University, Seoul 04763, Korea
*
Author to whom correspondence should be addressed.
Sustainability 2020, 12(13), 5292; https://doi.org/10.3390/su12135292
Submission received: 17 May 2020 / Revised: 17 June 2020 / Accepted: 22 June 2020 / Published: 30 June 2020
(This article belongs to the Special Issue The Exploration of Sustainability in Traditional Rural Buildings)

Abstract

:
The unique characteristics of traditional buildings can provide fresh insights for sustainable building development. In this study, a deep learning model and methodology were developed for classifying traditional buildings by using artificial intelligence (AI)-based image analysis technology. The model was constructed based on expert knowledge of East Asian buildings. Videos and images from Korea, Japan, and China were used to determine building types and classify and locate structural members. Two deep learning algorithms were applied to object recognition: a region-based convolutional neural network (R-CNN) to distinguish traditional buildings by country and you only look once (YOLO) to recognise structural members. A cloud environment was used to develop a practical model that can handle various environments in real time.

1. Introduction

Artificial intelligence (AI) is considered one of the greatest revolutions in human history [1]. To some degree, AI has transcended human judgement at classifying and making decisions [2]. In this study, AI deep learning technology was applied to traditional buildings, which has lagged behind other field [3] in terms of applications of computer technology.
Although East Asian countries can trace their cultures to Chinese civilisation, they have evolved with their own unique characteristics. For example, the traditional architectural style of each country varies according to purpose. In China, the country’s vast landmass means that the style changes regionally according to the climatic conditions. In northern China, which has little rainfall and people tend to be frugal, roofs have a slightly emphasised curvature. South of the Yangtze River, which receives heavy rainfall and has a mild climate, the curves are more elaborate and rise up around the eaves. In Japan, wooden architecture techniques were altered to help buildings withstand earthquakes. Korea placed importance on heating and insulation because of its four distinct seasons and emphasised simplicity owing to Confucian philosophy [4].
Thus, the relationship between architectural design and culture can be defined as an integrated product of the natural environment, climate, and customs of the region. Understanding architectural culture holds the key to discovering significant cultural characteristics of the past and developing alternative designs for sustainable buildings [5].
However, these factors alone cannot determine architectural culture. Modern technology such as AI and cloud computing is an essential tool for uncovering the subtle and complex features of past designs and their cultural and natural influences. Researchers have been using AI to develop databases of architectural knowledge from experts. This makes it possible to quantify and analyse visual data of buildings to compare and analyse their forms and spaces. This can also be used to obtain optimal solutions for architectural planning. To analyse architectural characteristics and make design inferences, a method is needed for recognising forms similar to those obtained from visual perception [6].
In this study, a model was developed for classifying forms and types of East Asian buildings as belonging to China, Korea, or Japan. Deep learning algorithms were used to analyse images of buildings with traditional buildings. In addition, a model was developed for specifically detecting and classifying columns and gongpo (i.e., Korean capital order system) among the structural members of traditional buildings based on videos or images. traditional buildings knowledge of a group of experts was fashioned into a data format that can be understood by AI. The data were learned to create a deep learning model. Figure 1 shows the research process:
  • The features and image data of traditional buildings in three East Asian countries (Korea, China, and Japan) were organised through consultation with experts on architectural history. Then, an AI-based deep learning algorithm was used to create a form-recognition model that classifies images of traditional buildings by country.
  • Images of structural members in Korean traditional buildings were used to create a deep learning model that identifies their locations in the image or video and thus classifies them.
  • A plan for creating a cloud-based deep learning model for understanding and managing traditional buildings was proposed, implemented, and verified.
Two types of form recognition algorithms were used for building analysis. A region-based convolutional neural network (R-CNN) was built in TensorFlow for object recognition and was used to classify images of traditional buildings in East Asia by country. Redmon’s you only look once (YOLO) algorithm [7] was used to detect the structural members of columns and gongpo in Korean architecture. The form recognition process acts as a trigger for importing related data and is a basic technology for differentiating assembly-style traditional buildings. A training model was developed to learn the traditional buildings of each region and the features of structural members. A vast number of test images were used to verify the training model. In this study, photographic data were used to classify the features of building styles by country. The scope was limited to recognising the forms of columns and gongpo and developing a classification model.

2. Materials and Methods

Knowledge and information from experts in traditional buildings were organised into datasets to train the AI model [8]. Depending on the purpose, an appropriate algorithm was selected for classification and object recognition [9]. After a comparative analysis of the characteristics and limitations, an algorithm was selected considering the work environment of traditional buildings.

2.1. Features of Traditional Buildings in Korea, China, and Japan

The traditional buildings of the three countries include wooden structures with a superstructure made of columns, beams, and roof trusses. The wooden structures are built by stacking structural members in the direction of gravity. The structural members are fitted and joined assembly-style [10]. To use AI for classifying images of East Asian traditional buildings and recognising structural members, features need to be organised so that a group of experts can recognise the style of each country. To train the AI, the theory must be developed first. Then, each image in the dataset can be classified and labelled. After the classification, an image recognition algorithm is used to find feature points and patterns.
The traditional buildings of the three countries reflect their respective cultures and have individual features that can be used to train the AI. The AI only needs basic guidelines to learn these features. Korea, China, and Japan have several shared cultural aspects, and they have closely interacted with each other throughout history. The knowledge required for AI training has already been organised in previous studies comparing Korea, China, and Japan, such as Yongun Kim’s ‘cycle of history’ [11] and Donguk Kim’s [4] comparative studies of Korean, Chinese, and Japanese traditional buildings. Based on previous studies, features including the roof and colour scheme were used to train the AI to recognise traditional buildings of the three countries.
As an example of the different roof shapes of the three countries, the Yu Garden Pavilion in China has rich ornamentation and a highly curved roof [12]. In Japan, the roof of Izumotaisya has a steep slope and even curvature. In Korea, the pillars of Munmyo Daeseongjeon are not standing in a straight line, the centre is bent slightly inward, and the entire building forms a curve.
Thus, the roofs of wooden buildings in East Asia have larger features than the buildings, and they form curves.
In China, bright colours such as red, orange, gold, and blue are commonly used. Furthermore, buildings tend to be planned with a left–right symmetry, and they have many courtyards. The buildings are decorated and large in scale. To make single-storey buildings look like two- or multi-storey buildings, awnings are sometimes placed beneath the roof. In Chinese architecture, the imposing scale of construction, which reflects the country’s vast overall landmass, stands out.
In Japan, dark-coloured schemes are often used, and they mainly include white, grey, red, and green. Buildings are often designed to be asymmetrical, and they have many gardens. Chinese buildings display grandeur and size, while Japanese buildings are characterised by minimalism. Japanese buildings reflect a mechanical precision that is not seen in Korea or China, and the roofs are straight and steeply sloped to deal with rain and snow. Additionally, because of the humid climate, Japanese architecture tends to be open and well ventilated. Overall, Japanese buildings are simple and subtle. Their restrained splendour and minimalism are apparent.
Korea mainly uses colours such as black, green, red, white, and dark blue. Chinese architecture tends to restrain nature artificially, while Japanese architecture uses gardens to present a nature-friendly appearance. Meanwhile, Korean architecture blends structures with nature to achieve harmony.
For example, rocks and wood that are taken from nature are not processed separately but used as construction materials without modification. Natural and unmodified materials and topography are used to display Korea’s unique natural beauty.
Moreover, the roofs of Korean buildings are the smoothest among the three countries because of the natural and comfortable curves of their tiled eaves. The aesthetics of the architecture stands out owing to its stable and comfortable appearance.
Figure 2 shows the organisation of the major features used for classification by the AI platform [4].

2.2. Deep Learning with R-CNN and YOLO

In this study, two deep learning algorithms were used for object recognition: R-CNN and YOLO. Hui [13] argued that deep learning algorithms are based on various concepts, so no model is best suited to all environments, and fair comparisons are difficult to make. This means that each algorithm should be tested for specific situations, and its suitability should be understood before application. Figure 3 compares performance indicators of major deep learning algorithms for object recognition. The performance indicators were derived with the PASCAL VOC (Visual Object Classes) 2007 test set. Figure 3a compares the accuracy of the object recognition and detection: YOLO had an accuracy of 78.6% with a unit module of 554 pixels, and Faster R-CNN had an accuracy of 70.4%. Figure 3b compares the processing speed: Faster R-CNN and YOLO were at five and 40 frames per second (fps), respectively, at a low detection speed and 17 and 91 fps, respectively, at a high detection speed. R-CNN demonstrated a higher speed and accuracy than YOLO for object recognition.
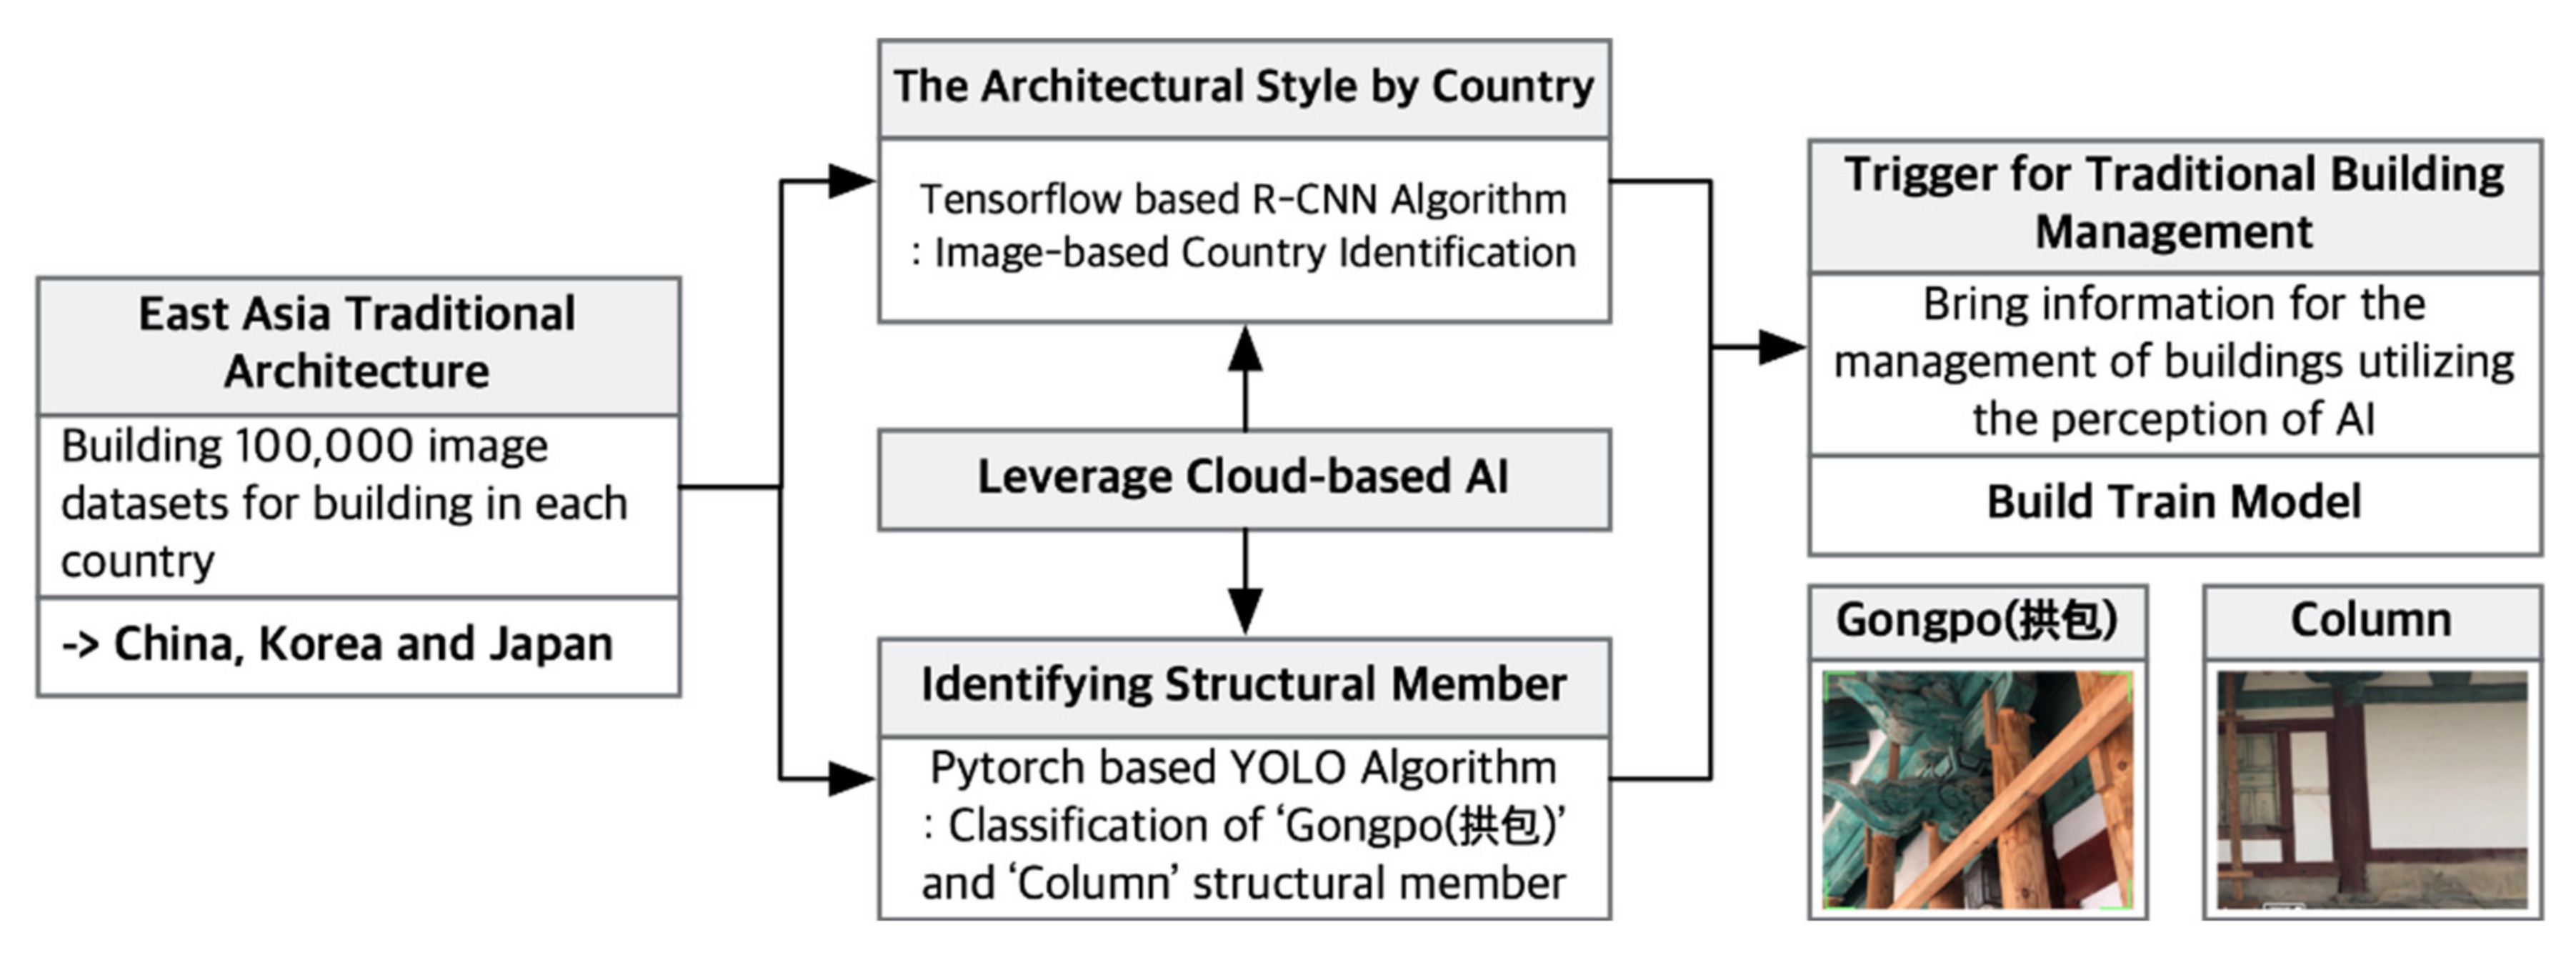
The biggest difference between R-CNN and YOLO is that the former can recognise and detect objects inside a building through detailed masking. This is advantageous for analysing detailed architectural elements when classifying architecture. Other advantages include utilising pre-trained datasets in a cloud environment and not having to build servers for separate training. However, the drawback of using R-CNN to classify images is that it incurs continuous costs to maintain the cloud environment. Furthermore, the detailed masking task slows down the speed and places a constant load on the computer, which restricts processing of videos in real time. Therefore, the design elements considered for the masking task should be repetitive for easy classification; if the design elements are not repetitive and are few in number, there is a risk of frequent failures of classification and identification. The advantages of YOLO include a fast processing speed that is close to real time and a high accuracy relative to the speed. This algorithm is optimised for recognising components through block-type object detection but has the disadvantage of being unable to detect overlapping objects in an image. In particular, object recognition is limited when front-face data are mainly used to train a deep learning model and test images are viewed from different angles or objects in a given image have a low degree of exposure. However, YOLO can achieve a high recognition rate relative to the amount of learning and is optimised for object recognition, despite its limitations at classifying detailed designs. Therefore, an appropriate deep learning algorithm should be identified for different purposes. Accurately determining which algorithm to use should be based on a logical organisation of the work process, which should be in conjunction with relevant expert knowledge and field information input by the user. R-CNN was used to classify traditional buildings by country, and YOLO was used to recognise structural members. To examine the rationality of using two different algorithms, the same photograph was analysed with the same weight values for each algorithm.
R-CNN combines region proposal with a CNN structure and is executed as follows.
  • Region proposal is performed to ascertain the locations of objects.
  • CNN is used to extract feature maps from areas that have undergone region proposal.
  • Bounding boxes are drawn around objects extracted by a linear support vector machine (SVM) for classification via the extracted feature map.
Figure 4 shows the imaging procedure. R-CNN was not executed in a cloud environment but as a local task. The processes were performed on a photograph taken at a Japanese convenience store, and a pre-trained Common Objects in Context (COCO) image dataset was used. The COCO dataset, which was released in 2015, was trained beforehand with a variety of objects. The format of the dataset was used to include data on traditional buildings from each country and structural members. The results showed that R-CNN could partially recognise the refrigerator and cans in the refrigerator. A major feature of R-CNN is its sophistication at analysing overlapping results. By changing the threshold value, it could detect a large number of cans in the refrigerator. However, the threshold value was fixed at 0.5 for comparison with YOLO.
The main features of R-CNN are its recognition rate for overlapping objects and its ability to classify small objects. Thus, it can be used to analyse the detailed aesthetic design of buildings from each country. However, it was not designed for real-time processing [11] and has a low processing speed. In addition, R-CNN lacks certain areas related to imitating human vision owing to its complex processing procedures. Thus, YOLO was used to classify and detect the locations of structural members in traditional buildings. YOLO uses a brief computation process for object recognition; this is similar to a person discerning the details of objects in an image at a glance. However, the brief computation process means that YOLO has low accuracy compared to algorithms with complex computation methods like R-CNN. Moreover, it can only detect one object when several objects overlap. The main concept of YOLO is as follows.
  • Grid lines are drawn on the input image at fixed intervals (S) as in graph paper.
  • N bounding boxes are created based on the grid, and the reliability is predicted to verify whether objects are within the bounding boxes.
  • A CNN is used to determine the accuracy of the bounding boxes and confirm whether objects are in the bounding boxes.
  • The probability of objects within the confirmed boxes being similar to objects in the dataset is calculated. Bounding boxes with high probabilities are labelled as recognised objects.
Thus, YOLO leverages a computer’s ability to perform repetitive tasks and recognises objects by drawing boxes randomly and then comparing them to a dataset all at once. This method is much faster than other object recognition algorithms. According to Hui [13], the difference in speed of YOLO and Faster R-CNN, which is a real-time version of R-CNN, is 91 fps to 5 fps. However, YOLO has limited ability to recognise overlapping objects because of the structure of its algorithmic process. For example, it was unable to detect the cans in the refrigerator, as shown in Figure 5. Thus, this algorithm should be used when it suits the objective and situation. YOLO is suitable for recognising and analysing East Asian traditional buildings because the structural members are assembled by a stacking method. In this study, YOLO was used to recognise structural members. The above analysis indicates that R-CNN should be used in environments that allow a slow work speed but require high accuracy, and YOLO should be used in environments that require a high work speed with relatively low accuracy and do not require overlapping objects to be recognised.

2.3. Machine Learning in a Cloud Environment

Machine learning can be used in a cloud environment as well as local environment [14]. In the case of image recognition, cloud environments allow for higher accuracy at a faster pace than local environments. This is mainly because cloud environments have pre-trained models. For example, Google has an image-based storage system called Google Photos that provides a large comparison group for reference. However, when this process is run on a local computer, increasing the accuracy requires a long time because of the limited data in the comparison group. When an image recognition algorithm is implemented in a local environment, the task of pre-emptively procuring a dataset to increase the accuracy during the learning process incurs a load. This is because few pre-trained datasets are available, and referring to data of other objects has limited value during the learning process. Machine learning in a cloud environment allows pre-trained datasets provided by large-scale platform services to be used, along with additional datasets from specialised fields. Recently, Forbes predicted a 42.8% increase in the combined annual growth rate of platforms incorporating cloud-based machine learning from 2018 to 2024 [15].
Additionally, cloud computing is often used for machine learning tasks on existing platform services. This allows hardware systems with a fast replacement period to be rented and operated remotely over the Internet. In addition, the machine learning can be updated in real time. Platforms for object recognition in a cloud environment include Cloud Vision and Auto Machine Learning (AutoML).

2.3.1. Cloud Vision

Cloud Vision is an application programming interface (API) for deep learning [16]-based image analysis. Users can automatically find features in images that have been classified by individuals [17]. Images can be quickly analysed according to thousands of categories, and defined labels can be detected. Defined objects and faces can be recognised in images, and words that are printed in images can be read to extract text. Datasets can be used to define various functions, such as reviewing harmful content, analysing emotions, and recognising logos. Then, mass processing can be performed. Table 1 presents the functions that can be performed. Cloud Vision can also be used for customised tasks using image recognition algorithms such as R-CNN and YOLO.

2.3.2. Cloud AutoML

Cloud AutoML is a deep learning optimisation method that allows even users with minimal machine learning [18] knowledge to customise high-quality models to fit their business needs through the Cloud Vision API. Cloud AutoML provides a graphical user interface (GUI) environment that can be used to train, evaluate, improve, and distribute a model based on the user’s own data. Therefore, custom machine learning models can be created on a web console [19]. Because it is completely integrated with other Google cloud services, users can use a consistent access method for all of Google’s product lines. In Cloud AutoML, if a grouped and labelled dataset is placed in AutoML, the train, deploy, and serve processes are performed internally. The serve process can be used to publish a platform created by deep learning on all platforms including webpages, mobile devices, and computers, as shown in Figure 6. Thus, it provides a work environment with excellent and immediate scalability. Because Cloud AutoML supports Python and REST (Representational State Transfer) API for model generation, it can be used to create application programs. Once a deep learning model has been built, realising practical utilisation is simple. Therefore, it can be used intuitively in needed areas, and feedback is possible. The biggest advantage is that a model can be made smarter continuously and gradually after development by using data results with the user’s approval. The traditional buildings classification model requires specialised knowledge as reference data for deep learning. AI is used to obtain desired feature points within the image by itself, and the points are reviewed with non-training data to increase the accuracy further. Thus, a deep learning model can train itself in real time and improve its own performance [20].
This is the difference between cloud-based and local deep learning. Cloud-based deep learning has a pipeline structure in which the algorithm gradually becomes smarter as it is used. However, the specific algorithms and learning method must be set according to the type of data and situation. When a pre-trained model is used in a cloud environment, basic functionalities such as cloud vision, natural language, and translation can be operated. However, when a model incorporating specialised theory is developed, customisation is necessary. Therefore, AutoML was used to incorporate certain requirements.

2.4. AI-Based Model for Traditional Buildings and Structural Member Classification

R-CNN was used to classify traditional buildings by country (Korea, Japan, and China) [7], and YOLO was used to detect structural members [7]. This section summarises the purpose-specific datasets and construction process of the deep learning model [21].

2.4.1. Datasets for Classifying Traditional Buildings by Country and Structural Members

Non-experts may have difficulty distinguishing traditional buildings styles by country. To train a deep learning model with relevant expert knowledge and allow non-experts to distinguish architecture styles, data need to be collected to train and test object recognition.
Figure 7 shows the ways that the object recognition data were used in this study.
The first approach was type classification, which is an object recognition technique. Images were used to train the AI in classifying traditional buildings styles by country. Experts classify the architecture styles of the three East Asian countries by the exterior colour scheme and curvature of the roof. Rather than teaching these rules to the computer in detail, a playground was created so that the computer could learn on its own. A dataset for deep learning was completed by grouping together images that depict building styles and saving their labels in a cloud AutoML dataset. Because the dataset was constructed in a cloud environment, this task can easily be completed by a computer running a web browser.
Figure 8 diagrams a dataset in which images have been grouped for classification and labels have been applied. This was done with Google Teachable Machine, which is a cloud-based object-recognition platform that can easily construct datasets to popularise AI. However, the platform can only be used for specific image classification tasks without specifying the deep learning algorithm. This limits its ability to perform intermediate deep learning tasks such as image calibration and weight adjustment. For a simple classification test, 1500 images were used. The epoch value was set to 50 (i.e., the training process was repeated 50 times), and the batch size was set to 16. The batch size is the number of hidden layers and refers to the degree of resolution. In other words, the features of an image are decomposed into 16 stages and analysed. A real-time test was performed on Gyeongbokgung Palace in Korea. The analysis results showed a 75% probability that it was a traditional Korean building and 25% probability that it was Japanese.
The second approach was to combine object recognition with location. As shown in Figure 7b, this method requires not only classifying structural members but also locating them in the image. In this study, this task was performed with a pre-trained model on Google Cloud Platform (GCP). Therefore, the model did not yield specific names of structural members in traditional Korean buildings or specialised information but rather analysed buildings, people, and clothing types. This task requires not only grouping data but also labelling members accurately. Square bounding boxes were drawn around the structural members in images (i.e., masking). To create the dataset for structural member classification, images containing gongpo and columns [22] were labelled with Supervisely, which is a cloud-based labelling tool.
As shown in Figure 9, the basic learning task was performed by masking the major structural members of traditional buildings. The bounding box and masking tasks were performed on the gongpo and columns in parallel. These structural members were labelled so that the computer could recognise them.
First, 16,478 traditional buildings-related data were masked (A in Figure 9). The deep learning algorithm (B-2) was combined with the masking data (B-1). The model was then built (C), and the type classification and location recognition tasks were performed. The number of images was increased by a factor of four by stretching, resizing, and distorting each image. This transformation task is a special training that allows the model to recognise objects when viewing images with various perspectives. The image data were masked and labelled on Supervisely, but a personal Linux server had to be prepared to compute the deep learning algorithm. Because Supervisely is a free service, it is structured so that personal hardware is needed to create an actual model. The basic requirements of the deep learning algorithm were a Linux operating system and Nvidia 1080 Ti professional-grade graphics hardware.
Thus, a Linux server was built to implement the deep learning algorithm. The dataset created by this process was uploaded to the GCP’s dataset server by a backend system so that it could be used by the deep learning model. Datasets were created for object recognition of traditional Korean architecture with the two approaches. The methods for creating the deep learning model using these datasets are presented in the next section.

2.4.2. Deep Learning Model for Classifying Traditional Buildings Styles and Structural Members

Separate datasets were created for classifying the architecture types and structural members. Next, a deep learning [23] model was created with TensorFlow and trained with the datasets and different algorithms: R-CNN for type classification and YOLO for structural member recognition. As discussed in Section 2.2, R-CNN and YOLO use different methods for object recognition but the same structure for deep learning. They only differ in methodology for learning datasets. Figure 10 shows the deep learning structure.
Image data were used for training. The deep learning process is similar to solving problems in a workbook; labels in a large dataset were matched to the correct country without being taught to the computer. For this experiment, the dataset was divided at a 7:3 ratio for training and testing, respectively. For the training, the epoch and batch size of the model were calibrated to ensure the appropriate percentage for accuracy.
An accuracy that is too high or too low can cause overfitting or underfitting, respectively. With overfitting, the AI can only solve problems used during training and performs poorly at solving new problems. With underfitting, the AI needs more training because it cannot solve either the training problems or new problems. The epoch was set to 50, and problems corresponding to 70% of the given dataset were solved 50 or more times. The batch size refers to how many problems are solved at once before an answer is produced during each epoch.
For example, if 70 problems must be solved and the batch size is set to 7, all 70 problems are solved in one epoch, but an answer is produced after 10 problems are solved simultaneously. Thus, the AI creates patterns for studying to increase accuracy.
Finally, the calibrated variables were used to set the number of hidden layers. As shown on the right side of Figure 10, an image of Gyeongbokgung in Seoul [24] was inserted in the input layer. Then, the outlined part was extracted in hidden layer 1. As the layers increased, image elements were split gradually to create samples for analysis.
The number of samples that segmented the image also increased. R-CNN analysed the image in detail; this algorithm is structured so that the weights of the hidden layers have a greater effect than in YOLO. In the experiments, R-CNN classified buildings according to country by a detailed analysis of patterns in the data that were depicted externally, such as the aesthetic elements of the building, curvature of the roof, and colour scheme. The values of the hidden layers were used as a variable that correlates with accuracy. Meanwhile, YOLO can quickly scan images and videos to classify and locate objects in real time. It can recognise structural members that are stacked to create a prefabricated structure. Thus, the accuracy was more affected by the sophistication of the labelling performed in Supervisely than the settings for the batch size and epoch.

3. Results

3.1. Performance Analysis of the Deep Learning Model

The performance of the deep learning model was analysed. Firstly, the model performance with R-CNN was analysed. For classification, 968 data were selected and transformed to increase the size of the dataset fourfold to 3872. The deep learning model was trained 50 times with 70% of the dataset. The training precision was 93.8%. The remaining 30% of the dataset was used for testing.
The results showed that the model had an 85.4% probability of classifying images to the correct country. There were no cases where a single image was classified to two countries. The recall value is the probability that the answer is correct 70% of the time or more; it was determined to be 89.8% for this model.
Detailed analysis showed that the images were correctly classified at rates of 93% for Japan, 77% for China, and 95% for Korea. In keeping with the principle of garbage in garbage out (GIGO), the accuracy should increase further with the number and quality of images in the dataset. As shown in Figure 11, the performance was limited by the images used in this study. The accuracy can be increased by providing clearer data or increasing the volume of data. As discussed in the next section, experiments were performed on 30 images simultaneously, and the results showed that the model correctly classified Chinese buildings even when images were dark and unclear. Ninety images were individually tested, and no error probability was observed.
This result was because of the use of AutoML; the pre-trained library allowed compensatory revisions with related cases and relevant data. This is akin to a piece of self-driving compensation equipment. Normally, when a dataset is created locally, 60,000 images must be used to produce accurate data. However, in the case of GCP, the difference in server support between local and cloud environments was made evident even with only 100 feature data.
Next, the model performance with YOLO was analysed. The model was created with 16,478 images of structural members; 70% were used for training, and the remaining 30% were used for testing. The epoch was set to 50. The training accuracy was 99.6%, and the test accuracy was 73.04%. In addition to the accuracy, the loss function indicator was also calculated; a model is considered reliable with a small error rate as the loss function value approaches zero. As shown in Figure 12, epoch 49 had the smallest loss function value during training.
However, epoch 50 had the smallest value when the loss function value during testing was also considered and thus was selected as the model. However, the test accuracy of epoch 50 was 73.04%, which is insufficient given that deep learning models normally have an accuracy of 80% or more. The volume of data was found to be insufficient for accurately recognising the locations of gongpo and structural members. The deep learning model was created to analyse only gongpo and columns but needs to be trained for other structural members so that feature points can be defined through correlations.

3.2. Application and Verification of the Deep Learning Model

Two experiments were performed with the deep learning model. Firstly, the model trained with R-CNN was tested with 30 randomly selected photographs of traditional buildings from each country. In addition, a controversial case concerning a Korean national museum was considered. Secondly, an object recognition experiment was conducted on photographs showing traditional features of Korean architecture.

3.2.1. Application and Verification of Deep Learning Model with R-CNN

Pictures of Bulguksa and Gamsansa Temples in the Keyongju region of Korea and pictures taken when the authors visited Japan and China but were not included in the training process were used to validate the deep learning model. Data used to analyse the AI performance were not included in the dataset randomly. Additionally, images used for model testing and training were not from the same city or region. A few photographs were captured with poor quality or taken at night to observe the limits of the deep learning model.
The authors visited each country and captured pictures with mobile phones. Figure 13 shows the results of the model based on 30 photographs from each country. Surprisingly, images were classified with an accuracy of 100%. Even the Chinese buildings, for which the performance analysis showed that the model had the lowest accuracy, were recognised accurately.
An additional experiment was performed on images that had previously returned errors. This case has become a social issue in Korea: Buyeo National Museum, which was designed by Korean architect Sugeun Kim and completed in 1967, is claimed to resemble the architectural style of Shinto temples in Japan. In particular, the roof shape resembles a chigi (i.e., the part where the wood intersects with the roof to form an X-shape). The aim of the experiment was to examine this claim with the deep learning model. Three images of the museum from different angles were considered. Figure 14 shows the classification results. Two of the three images were classified as Korean, but one image was classified as Japanese with a 100% probability and Korean with a 98% probability. Follow-up studies will be necessary to examine exactly which elements are used by the deep learning model to predict each type. Nonetheless, because this image shows the actual design elements of the museum, the building has a high probability of being in the Japanese style.

3.2.2. Application and Verification of Deep Learning Model with YOLO

Images clearly showing gongpo and columns that were not included in the training process were used to test the model trained with YOLO. Before the model was tested, the structural members within the overall layout of the building shape needed to be classified, and their location needed to be displayed in the images. Having the model find features was more difficult than classifying structures by country. Moreover, the COCO dataset normally used for YOLO consists of more than 60,000 data; however, only 16,478 images were used in this study, so the model had quantitative limitations. Consequently, the model showed an accuracy of 73.04%. As shown in Figure 15, the model trained with YOLO was applied to traditional buildings that were photographed with mobile phones [25]. Four images showing typical major features are presented. The model performance showed a high correlation between the main features and composition in the masking step. Objects could not be detected because of the angle at which the photograph was taken or when they had a low degree of exposure. In A and C, the structural members of the facade were generally well detected. In A, four of six columns were detected and had their locations displayed despite being covered in script. In B, however, even though all gongpo were recognised, the columns could not be recognised at all when only a small portion was visible. Gongpo at the corners of A and D were not detected successfully because they were not close enough to the camera as in B. In the future, masking must be performed for object recognition to overcome these detection blind spots.

4. Discussion

Deep learning algorithms were characterised and selected for their applicability to classifying architecture. Because deep learning algorithms are developed according to different concepts [26], a fair performance comparison is difficult. As demonstrated in this study, a selection process is necessary for determining the suitability of deep learning algorithms to the type classification of structures and detection of structural members. During the training of a deep learning model, refined data are used as input and output. The model learns the correlation between input and output data with the backpropagation algorithm, which it uses for prediction and classification. A model with a high degree of accuracy is constructed through repetition. However, a major risk of deep learning is the absence of explanation why a certain model produces the best result. A deep learning model only calculates the output of an input but does not explain why it produces such a result. Thus, a deep learning model can only be trained to a high degree of accuracy through experience rather than through theory. To address this issue, this study used architectural expertise to summarise the features that should be detected by the deep learning model for classification and prediction. The colours, roof curvature, and outer wall shape were used to classify traditional Korean, Japanese, and Chinese architecture, and the model demonstrated a high classification accuracy [27]. However, AI cannot be used to derive suitable algorithms for classifying architectural features. Therefore, simple experiments were used to characterise the performances of R-CNN and YOLO and determine their suitability to different purposes according to how they recognise patterns [28]. The results of this study can be summarised as follows:
  • A new method was developed for classifying East Asian traditional buildings by country based on aesthetic design elements. R-CNN can closely analyse images and classify complex overlapping areas like design patterns; the deep learning model with R-CNN was able to classify traditional architectural features of each country with an accuracy of 90% using slightly over 1000 images. In preliminary research, the error probability was reduced with 10,000 or more images. However, no errors were observed during direct verification, where the model analysed the similarity between a library pre-trained by AutoML in a cloud environment and the uploaded images.
  • The deep learning model with YOLO was used to classify and locate structural members of traditional buildings in videos and images. YOLO has a faster processing speed than R-CNN and can detect major objects in videos and images in real time. However, it cannot detect objects in images taken from various angles or less exposed images with blind spots. Because of this disadvantage, YOLO was applied to traditional buildings with layered structures. The deep learning model with YOLO was able to detect structural members like gongpo and columns [25], which have large differences in shape, rather than examine differences in similar images.
  • The composition of the dataset and resulting methodology for AI-based training were analysed theoretically. The deep learning model was given two roles: classification of type and classification and location of structural members. For the classification of type, data were labelled, and deep learning variables such as the epoch, batch size, and number of hidden layers were adjusted to ensure proper learning with R-CNN. For the classification and location of structural members, a large number of images needed to be masked when creating the dataset to allow locations to be displayed clearly. The Web-based Supervisely platform was used for masking; this platform has the advantage that a threshold amount of manual masking can be used as the basis for automatically masking the remaining dataset. However, the disadvantage is errors that occur during processing and the initial repetition of data feedback. Nonetheless, this approach can be used for real-time processing.
The model was confirmed to be able to classify traditional buildings by country and recognise/locate structural members such as gongpo and columns [29]. In the additional experiment on the style of Buyeo National Museum, the deep learning model showed conflicting results. Follow-up research is needed on visualising the AI decision-making through methods such as heat maps, which can be used to delineate Korean parts from Japanese parts. Additional research is needed on whether classification was performed based on certain design elements or whether forms were recognised based on certain parts. Furthermore, research is also needed on increasing the efficiency of building management and drawing connections between publicly available data such as wooden structural member deterioration and earthquakes rather than simply classifying buildings by country.

Author Contributions

Conceptualization, S.-Y.J. and H.-J.J.; Introduction, S.-Y.J.; Theoretical Background, H.-J.J.; Research Methodology S.-Y.J.; Results, H.J.J.; writing—original draft preparation, S.-Y.J. and H.-J.J.; writing—review and editing, S.-Y.J. and H.-J.J. All authors have read and agreed to the published version of the manuscript.

Funding

“This work was supported by the National Research Foundation of Korea (NRF) grant funded by the Korea government. (2019R1A2C1088896)”.

Conflicts of Interest

The authors declare no conflicts of interest.

References

  1. Deshpande, A.; Kumar, M. Artificial Intelligence for Big Data; Packt Publishing Ltd.: Birmingham, UK, 2018. [Google Scholar]
  2. Kattan, M.W.; Adams, D.A.; Parks, M.S. A comparison of machine learning with human judgment. J. Manag. Inf. Syst. 2015, 12, 37–57. [Google Scholar] [CrossRef]
  3. Ji, X. A Study on the System of Chinese Traditional Wooden Architecture using the VR Technology. Master’s Thesis, Hanseo University, Seosan, Korea, 2018. [Google Scholar]
  4. Dongwook, K. Korean architecture Chinese architecture Japanese architecture, Kimyoungsa. 2015. [Google Scholar]
  5. Kyeongju/Pohang Earthquake Damage Investigation Committee. Kyeongju/Pohang Earthquake Damage Investigation; Architectural Institute of Korea: Seoul, Korea, 2018. [Google Scholar]
  6. Akbarinia, A. Computational model of visual perception: From colour to form. Ph.D. Thesis, Computer Science Department, Universtat Autonoma de Barcelona, Barcelona, Spain, 2017. [Google Scholar]
  7. Redmon, J.; Farhadi, A. Yolov3: An incremental improvement, CoRR. 2018. [Google Scholar]
  8. Weiss, G.M.; Provost, F. Learning when training data are costly: The effect of class distribution on tree induction. J. Artif. Intell. Res. 2003, 19, 315–354. [Google Scholar] [CrossRef] [Green Version]
  9. Felzenszwalb, P.F.; Girshick, R.B.; Allester, D.M.; Ramanan, D. Object detection with discriminatively trained part-based models. IEEE Trans. Pattern Anal. Mach. Intell. 2010, 32, 1627–1645. [Google Scholar] [CrossRef] [PubMed] [Green Version]
  10. Ahn, E.-Y.; Kim, J.-W. Efficient description method for Hanok components reflecting coupling scheme of wooden structure. J. Korea Multimed. Soc. 2011, 14, 318–328. [Google Scholar] [CrossRef]
  11. Park, H.-S.; Bae, C.-S. Real-time recognition and tracking system of multiple moving objects. J. Korean Inst. Commun. Inf. Sci. 2011, 36, 421–427. [Google Scholar]
  12. Yongwoon, K. A counterattack in history, Max Media. 2018. [Google Scholar]
  13. Hui, J. Object detection: Speed and accuracy comparison (faster r-cnn, r-fcn, ssd, fpn, retinanet and yolov3). Available online: https://medium.com/@jonathanhui/object-detection-speed-and-accuracy-comparison-faster-r-cnn-r-fcn-ssd-/and-yolo-5425656ae359 (accessed on 20 May 2020).
  14. Furquim, G.; Pessin, G.; Faical, B.S.; Mendiondo, E.M.; Ueyama, J. Improving the accuracy of a flood forecasting model by means of machine learning and chaos theory. Neural Comput. Appl. 2016, 27, 1129–1141. [Google Scholar] [CrossRef]
  15. Columbus, L. Roundup of Machine Learning Forecasts and Market Estimates. 2020. Available online: https://www.forbes.com/sites/louiscolumbus/2020/01/19/roundupofmachinelearningforecastsandmarketestimates2020/#74c6a1515c02,2020 (accessed on 20 May 2020).
  16. Krizhevsky, A.; Sutskever, I.; Hinton, G.E. ImageNet classification with deep convolutional neural networks. Advances in Neural Information Processing Systems 25. In Proceedings of the 26th Annual Conference on Neural Information Processing Systems, Lake Tahoe, NV, USA, 3–6 December 2012; NIPS: La Jolla, CA, USA, 2012; pp. 1097–1105. [Google Scholar]
  17. Szegedy, C.; Liu, W.; Jia, Y.; Sermanet, P.; Reed, R.; Anguelov, D.; Erhan, D.; Vanhoucke, V.; Ra-binovich, A. Going deeper with convolutions. In Proceedings of the IEEE Conference on Computer Vision and Pattern Recognition (CVPR), Boston, MA, USA, 7–12 June 2015; IEEE: Piscataway, NJ, USA, 2015; pp. 1–9. [Google Scholar]
  18. Oh, I.-S. Machine Learning; Hanbit Academy: Seoul, Korea, 2017. [Google Scholar]
  19. Choi, C.; Park, K.; Park, H.; Lee, M.; Kim, J.; Kim, H.S. Development of heavy rain damage prediction function for public facility using machine learning. J. Korean Soc. Hazard Mitig. 2017, 17, 443–450. [Google Scholar] [CrossRef]
  20. Sermanet, P.; Eigen, D.; Zhang, X.; Mathieu, M.; Fergus, R.; LeCun, Y. Overfeat: Integrated recognition, localization and detection using convolutional networks. In Proceedings of the 2nd International Conference on Learning Representations, ICLR 2014, Baniff, AB, Canada, 14–16 April 2014. [Google Scholar]
  21. Russell, S.; Norvig, P. Artificial Intelligence: A Modern Approach, 3rd ed.; Pearson: New York, NY, USA, 2009. [Google Scholar]
  22. Kim, W.-J. Korean Architectural Terms in Pictures; Ballon Media: Antwerp, The Netherlands, 2001. [Google Scholar]
  23. Kang, I.S.; Moon, J.W.; Park, J.C. Recent research trends of artificial intelligent machine learning in architectural field—Review of domestic and international journal papers. J. Archit. Inst. Korea 2017, 33, 63–68. [Google Scholar]
  24. Kwan, K.-H. The safety technology of Hanok. J. Archit. Inst. Korea 2009, 53, 45–48. [Google Scholar]
  25. Kim, B.W. Trend analysis and national policy for artificial intelligence. Informatiz. Policy 2013, 23, 74–93. [Google Scholar]
  26. Kim, Y.-M. What is the characteristics of structural analysis of Hanok? J. Archit. Inst. Korea 2013, 57, 17–20. [Google Scholar]
  27. Lee, H.-S. Study on Methods of Improving Mitigation Systems for Earthquake Risk in Wooden Structure Cultural Assets. Ph.D. Thesis, Myeongji University, Seoul, Korea, 2018. [Google Scholar]
  28. Kim, C.; Han, T.; Yoon, I.; Lee, Y.; Lee, J.; Choi, G.; Won, C.-I.; Kim, Y.-M. Fall detection in CCTV using YOLO. In Proceedings of the Korea Computer Congress; Jeju, Korea, 20–22 June 2018; KIISE: Seoul, Korea, 2018. [Google Scholar]
  29. Kim, Y.-M. A study on the structural check of Hanok. In Proceedings of the Architectural Institute of Korea Autumn Conference, Busan, Korea, 23–25 October 2014; Architectural Institute of Korea: Seoul, Korea, 2014. [Google Scholar]
Figure 1. Research process flow.
Sustainability 12 05292 g001
Figure 2. Features of traditional buildings in Korea, China, and Japan.
Sustainability 12 05292 g002
Figure 3. Object recognition performances of major deep learning algorithms: (a) accuracy and (b) processing speed.
Sustainability 12 05292 g003
Figure 4. Region-based convolutional neural network (R-CNN) process flow and test results.
Sustainability 12 05292 g004
Figure 5. You only look once (YOLO) process flow and test results.
Sustainability 12 05292 g005
Figure 6. Cloud AutoML operating diagram and concept map.
Sustainability 12 05292 g006
Figure 7. Object recognition techniques by purpose: (a) classification of type and (b) shape detection.
Sustainability 12 05292 g007
Figure 8. Dataset task process for classification of type using Google Teachable Machine.
Sustainability 12 05292 g008
Figure 9. Data labelling task for type classification and location recognition using Supervisely.
Sustainability 12 05292 g009
Figure 10. Deep learning structure for traditional buildings classification.
Sustainability 12 05292 g010
Figure 11. Performance of the deep learning model with R-CNN.
Sustainability 12 05292 g011
Figure 12. Performance of the deep learning model with YOLO.
Sustainability 12 05292 g012
Figure 13. Classification results of the R-CNN deep learning model by country.
Sustainability 12 05292 g013
Figure 14. Classification results of the deep learning model with R-CNN for a disputed building.
Sustainability 12 05292 g014
Figure 15. Linking task using object recognition information.
Sustainability 12 05292 g015
Table 1. Cloud Vision functions.
FunctionDescription
Label recognitionRecognise various objects and categories in images
Web recognitionSearch for similar images on the web
Optical character recognition (OCR)Recognise text in images
Logo recognitionRecognise famous logos in images
Landmark recognitionRecognise labels for famous regions in images and find the latitude and longitude
Face recognitionRecognise faces in images and analyse their emotions
Content reviewRecognise harmful content in images

