Review

People and the City: Urban Fragility and the Real Estate-Scape in a Neighborhood of Catania, Italy

by
Maria Rosa Trovato
1,*,
Claudia Clienti
2 and
Salvatore Giuffrida
1,*
1
Department of Civil Engineering and Architecture, University of Catania, 95124 Catania, Italy
2
Freelancer, 95124 Catania, Italy
*
Authors to whom correspondence should be addressed.
Sustainability 2020, 12(13), 5409; https://doi.org/10.3390/su12135409
Submission received: 1 May 2020 / Revised: 30 June 2020 / Accepted: 1 July 2020 / Published: 4 July 2020
(This article belongs to the Special Issue Real Estate Landscapes: Appraisal, Accounting and Assessment)

Abstract

:
Urban/social fragility is the main focus of most studies on civil economy involving the commitment of politics in the prospect of integrating and somehow guiding an ordered development of and ordered communities. The contemporary city is strongly influenced by the incommunicability between the social system and environment, the latter more and more, including urban and societal components. This study tries to outline a comparative social-urban profile of Picanello, a popular central neighborhood of Catania, in Sicily, Italy, characterized by the combination of different urban and social life-quality levels, thus expressing a heterogeneous vulnerability/resilience profile. The analysis is placed in the urban planning context and aims to: (1) Denotative a pattern that considers the different fragility/resilience descriptive indices; and (2) connotative a pattern of the human and urban dimensions of the social capital asset. This analysis was performed by implementing a multidimensional pattern allowing us to place the neighborhood in a ranking of the neighborhoods of Catania, thus highlighting strength and weakness under different respects. Furthermore, the monetary measurements of this vulnerability/resilience profile, was carried by means of the structured observation of the real estate market. Fuzzy k-medoids cluster analyses have been comparatively performed—showing and mapping the relationships between urban value density and real estate market prices tensions.

1. Introduction

1.1. Fragility and the City. General Premises for a Definition of “Real Estate-Scape”

Urban fragility is one of the big issues that faces late-modern cities who are committed to cope with the growing external pressures (from the environment) and internal tensions (within the social system)—referable to the socio-cultural and political-economic climate, in the current “Age of Changes”.
This issue is placed in a very wide institutional context [1], where studies and reports have shown how this criticality is linked above all to the growing complexity of the cities [2,3]. The increase in population, extension, and density, the growing cultural mixite, the fast “filtering up and down” processes, are some symptoms of the combination of two fundamental drivers. Firstly, the exponential technological progress—mostly concerning the geographical and digital accessibility—has been encouraging far more people to claim a better socio-economic status, which urban location is a symbol of. Secondly, the progressive human/environmental unfairness of economy over the planet and the related increase in insecurity, push the transfer of large masses of the population towards the richer countries of the developed geo-economic areas, and in particular towards the larger and more heterogeneous cities.
This new climate involves the accountability of the neoliberal model allowing a limited number of subjects to concentrate the largest part of the liquidity created as a result of the progressive “financial abstraction” of the real wealth over the era of post-globalization, that is the age of the contemporary archipelago-economies.
The development of the city has been supported by the emerging of financial institutions that have given a monetary shape to the flows of wealth, thus allowing the surplus of social product to become social overhead capital; the latter is at the same time cause and effect of the concentration of wealth and people, activities and tensions, conflicts and hopes [4] (in one word, of value) in urban shapes.
On the urban-scale, in turn, such processes have been occurring creating and populating denser and denser built areas at the expenses of other ones (decaying historic centers or peripheral neighborhoods) progressively neglected and jeopardized. The coexistence of such different value density degrees increases the fragility of the city as a whole; the most visible and permanent signs of these inequalities can be displayed through the analysis of the values of urban capital which are partly reflected in the real estate market prices.
This measurement of the urban-architectural value can be assumed as the final stage of the progressive abstraction of the concrete values—material, including immaterial; quantitative, including; qualitative, etc. Such an abstraction level can be considered the ultimate one, due to the convergence of social and monetary aspects. The former concern the real estate market prices as basically bid prices, and as such, having a socio-psychological origin and an administrative destination; in fact, they are part of the taxable income, and as such, they contribute to the creation, reproduction and enhancement of the social urban capital. The latter concerns the specific economic, financial, and monetary profile of the real estate capital asset—this is due to its ability to perform the whole range of its typical economic functions (utilitarian, productive, and speculative).
The social system results from the abstraction of the multiple individual axiological profiles in a superordinate ethical behavioral model. As a consequence, the abstraction of the concrete urban values in real estate private (price) and public (taxes) values has an ethical characterization that supports: In concrete terms, the representation of urban vulnerability by means of urban and demographical statistic indices [5,6]; in abstract terms, the maps of the real estate market prices. The former represents the instances of the human capital, as for the hope of dignified working/housing conditions; the latter represents the needs of the urban capital, as for the expectation of creating durable and profitable (real estate capital) assets.
Furthermore, real estate capital asset constitutes one of the basic resources, as well as one of the main targets, of the urban estate increase in value, thus playing a crucial role in triggering or reducing the urban vulnerability. Specifically, the dynamics concerning the convergence or conflict of private interests and public values outline the mutual influence between the individual creative push to development (sparking differences), and the conservative organization of this energy aimed at turning it in a stock of social value able to release the typical services of the urban capital asset.
The fair trade-off between development and conservation, influencing the urban vulnerability degree, results from the coherence between the property income tax system and the renovation subsidies measures in force. The latter are generally aimed at powering the harmonic relationship between center and peripheries to prevent some neighborhoods from embarking on the spiral of impoverishment, as well as others to accumulate too much surplus.

1.2. Metaphores and Synecdoches of Fragility

Some remarks about the concept of fragility in the field of territorial studies can help to better understand how the urban eco-social system deals with the concept of fragility. The perspective of the real estate-scape, in fact, assumes the social and urban vulnerability issue [7,8], since one of the main focuses of the urban renovation planning process in its broad lines.
The colloquial meaning of “fragility” closely relates to its physical definition concerning the tendency of a solid material to break abruptly, without any yielding deformation, which has previously occurred. In the urban studies some insights need to be done to understand a conceptual significance of fragility considering its original causes and those effects typically concerning the current drift of the urban phenomenon. Since the above early definition does not take into account the driving forces of the urban fragility and their most perceptible effects, a further and more extensive meaning of fragility can be derived from material sciences: Fragility is “the property that characterizes how rapidly the dynamics of a material slow down as it is cooled toward the glass transition: materials with a higher fragility have a relatively narrow glass transition temperature range, while those with low fragility have a relatively broad glass transition temperature range” [9].
By metaphorizing such definition, and with reference to the relationship between the socio-economic situation of a city and the real estate capital asset value, an urban system can be considered more fragile when the “socio-economic cooling” (i.e., a decrease in rights and incomes) gives rise to sudden, pathological and irreversible fall of the real estate market prices; on the contrary, an urban system is more resilient when such effects are slower and easily metabolized, and can also be reversed when an opposite cause occurs.
Furthermore, “physically, fragility may be related to the presence of dynamical heterogeneity in glasses, as well as to the breakdown of the usual Stokes–Einstein relationship between viscosity and diffusion” [10]. The metaphor of the different dynamics within a material can also be referred to the sociologic macrosystemic approach by Luhmann [11]—specifically regarding the concept of social communication, assumed as the sharing of the advantages of the urban sociability.
According to Luhmann, the city can be considered a unity-difference between the social system and environment; the former results from the recursive internal communication performed by using means of communication whose contents are unamendable values making the social system self-referential. The rise of the social system establishes a boundary with the environment. The latter, in turn, is neither a physical space nor the natural habitat. The environment is rather a condition affecting the natural, as well as artificial and human components that are outside the social communication, i.e., “on which” the system communicates and “with which” the system does not communicate. The environment is not the subject but rather the object of the social communication, and as such, it is everything and everyone excluded from the sharing of rights, care and opportunities, thus from the sharing of common means, ends and destinies.
By increasing in complexity, the social system differentiates and specializes the social communication, thus creating multiple social sub-systems; accordingly, each of them establishes its own specific communication codes working as filters to select anything that allows the sub-system to self-replicate. The increase of such sub-systemic self-referentiality gives rise to a growing intra-systemic (within the whole social system) incommunicability, so that some sub-systems prevail, assuming the other sub-system as environment, in turn [12].
It is appropriate to remind that each sub-system comprises everyone and everything supporting that specific code, then people and things can belong to multiple sub-systems, even only in part, that is to the extent that they share those codes (those values), and undertake to implement the related program. Nowadays, the dominant social sub-systems are, for example, the economic, political, and judicial ones; the weaker are the cultural, educational and landscape sub-systems [13,14].
This heterogeneity and the resulting conflicts make each sub-system differently able to deal with any “environmental irritation”, with the consequence of widening the distances between strong and weak sub-systems [15]; as a consequence—according to the metaphor of heterogeneity in the effects of cooling a material—the overall resilience of the urban system reduces, due to the defect of diffusion, that is the progressive reduction of sharing depending on the self-powering of the dominant sub-systems at the expenses of the weaker ones. Therefore, an “environmental irritation” is the response from the environment to any communication defect by the social system or by the dominant sub-systems.
The most evident phenomenon of such a communication gap arising the prevailing of the economic sub-system over the landscape one, is the “urban-scape” [16] of the most unfair cities [17]. This is characterized by the marked contradictions between astonishing downtowns and miserable peripheral neighborhoods.
In the field, and for the purposes of the evaluation science (typically dealing with the economic category of capital), we assume the former sub-systems as an expression of the “urban capital”, and the latter ones as an expression of the “human capital”. Accordingly, the “real estate-scape” can be assumed as the synthesis of “urban-scape” and “human-scape” thus embodying the complementarity and the conflicts between urban and human capital.
The consideration of the urban/human capital allows us to widen the metaphoric meaning of viscosity and diffusion; they can be framed within the synecdoche of the thermodynamic interpretation of the behavior of an urban-social system dealing with environmental pressures. Synecdoche is a rhetoric figure by which a part of something refers to the whole, or vice versa, thus giving rise to different kinds of ambiguity about the contextual meaning of vulnerability and resilience, as well as of viscosity and diffusion in physics.
In physics, diffusion is the net movement of anything (atom, ions, molecules) from a region of higher concentration to a region of lower concentration; viscosity is a measure of the resistance to deformation at a given rate by a material. Due to the wide and complex context delimited by the relationship between the social system and environment, the reference of the metaphors can change. The city is an open and communicative system characterized:
  • On the one hand, by internal production of entropy, whose higher rate is due to the greater urban vitality and vibrancy [18];
  • On the other hand, by incoming/outgoing fluxes of entropy [19] whose higher rate is due to the greater capacity by the administrative system to manage the system-environment exchanges, thus replacing the production of entropy (the natural disorder from inside), with fluxes of neg-entropy (the artificial order form outside) [20].
The thermodynamic synecdoche can reverse the semantic relationship in the metaphors of diffusion and viscosity. In general: The lower entropy, the lower the social-economic-cultural exchanges and wealth production, as well as pollution, urban sprawl, and land consumption, and vice versa. The synthesis of this contradiction is the sustainable development based on immaterial production/consumption patterns and high-information content circular economy [21,22].
In the field of urban fragility, the ambiguity of this thermodynamic synecdoche depends on the possible points of view. In the case of an environmental pressure (physical catastrophe or economic crisis) viscosity (in the aforesaid social-communicative meaning) could affect the diffusion of the material and public economic support (from Civil Protection and Welfare) whose thermodynamic synecdoche is the energy; by definition, energy is not a value in itself but only if it is possible to regulate its accumulation, releasing, allocation and recycling.
Both in the ordinary and emergency conditions, such a normative pattern is generally implemented through the bureaucracy that, in turn, might increase viscosity, as in the cases of the recent reconstruction programming in the center-Italy areas affected by the earthquake, as well as in the current economic planetary crisis from the Covid-19 pandemic.
Specifically, in the field of urban redevelopment programs, viscosity could concern the characteristics of the load-bearing masonry buildings. In a negative sense, these characteristics reduce the flexibility of the requested uses and the adaptation of the buildings to contemporary needs typically due to the evolution of the size and composition of the households; considered positively, this viscosity contains the spread of renovations potentially harmful to the identity of historic neighborhoods.
In sum, the socio-economic context makes ambiguous the interpretation of the indices usually assumed for outlining the profile of vulnerability in a social and urban sense; the real estate market analysis can contribute to enrich the vulnerability concept and disambiguate such misinterpretations.

1.3. Urban Fragility. Some Literature Coordinates

Fragility is a wide concept [23] connecting several epistemic areas and enabling different cognitive functions, respectively ranging from natural to cultural topics, as well as from individual to social spheres, and above all, supporting the public decision-making [24,25], in the prospect of the best connection between the certainty of present and the uncertainty of future. Fragility, as specified in the multiple operating contexts of vulnerability, is the most committing area for the exercise of the social, political, and economic accountability [26,27,28].
The common denominator of the multiple definitions of vulnerability is risk; risk, in turn, is the expectation of a sudden environmental fluctuation, that affects a defined social system [29,30] in the extent it stops, or significantly reduces, its ability to fulfil the core functions in the long run, and to recover the previous status in the short-medium run.
According to the afore outlined communicative-cognitive approach to the relationship between the (social) system and (natural, artificial, and human) environment, risk should be considered as external by definition, in so far as it comes from the environment. As a result, vulnerability and resilience are internal characteristics of the system.
Accordingly, if resilience is the ability of the social system to cope with external risk, social capital is the strategic variable for analysis, valuation and decision making [31] that identify—basing on relevant and accessible data—fragility and resilience factors at the city level: Rapid and unregulated urbanization; income and social inequality; concentrated poverty; unemployment; policing and justice deficits; real and perceived insecurity; exposure to natural hazards, such as droughts, cyclones and floods [13,32,33,34,35,36,37,38,39,40]. Symmetrically, resilience factors are assumed: Higher income and social equality; effective policing and judicial mechanisms; micro-economic security and social protection; the provision of basic services; social cohesion; social networks and social support; strong community to government and inter-governmental cooperation [41,42].
Miklos and Paoliello [43] highlighted inequality as the main driver of urban fragility thus confirming that a sociological approach cannot do without an ethical concern calling in question the cognitive and operative category of capital assets, as the topical watershed between social inclusion and exclusion [44].
This study aims at finding some of these topics with reference to Picanello, a popular neighborhood of Catania, Italy, trying:
  • To outline a comparative social-urban profile of the neighborhood, characterized by the combination of different urban and social life-quality levels, and expressing a heterogeneous vulnerability/resilience profile, compared to the whole urban context of the city of Catania.
  • To refer this vulnerability/resilience profile to the abstract monetary measurement of the housing market price, thus assuming the real estate-scape as the more general and explicit form of the urban and human scape. Such monetary measurement, in fact, can be considered explicit and significant because real estate capital asset is one of the main items of the household budget for both owners and tenants. Accordingly, a real estate survey and a structured cluster analysis have been carried out to highlight the quantitative and spatial relationships between social-material vulnerability/resilience indices and real estate capital asset market prices. A further hypothesis is that real estate capital asset is a sort of stock-value accumulator that prevents urban-human-scape from being affected by sudden economic fluctuations, such as the recent economic-financial crisis.
The analysis, placed in the urban planning context, intends to provide, as first, a denotative pattern taking into account different fragility/resilience descriptive indices coming from different data-sources, specifically selected in order to connotate the human and urban dimensions of the social capital asset. This analysis was performed by implementing a multidimensional pattern [45] allowing us to place Picanello neighborhood in a ranking of the neighborhoods of Catania, thus, highlighting strengths and weaknesses under different respects. As second, a typical connotative analysis, concerning the monetary measurements [46] of this vulnerability/resilience profile [47] was carried out by means of a real estate market survey. This analysis tries to detect and map over the neighborhood area, the economic layout of this profile, enriching the overall qualitative measurements involving the whole neighborhood, with point analyses mapping the heterogeneity of this multifaceted urban area. Fuzzy k-medoids cluster analyses have been comparatively performed, showing the relationships between urban value density and real estate market prices tensions.

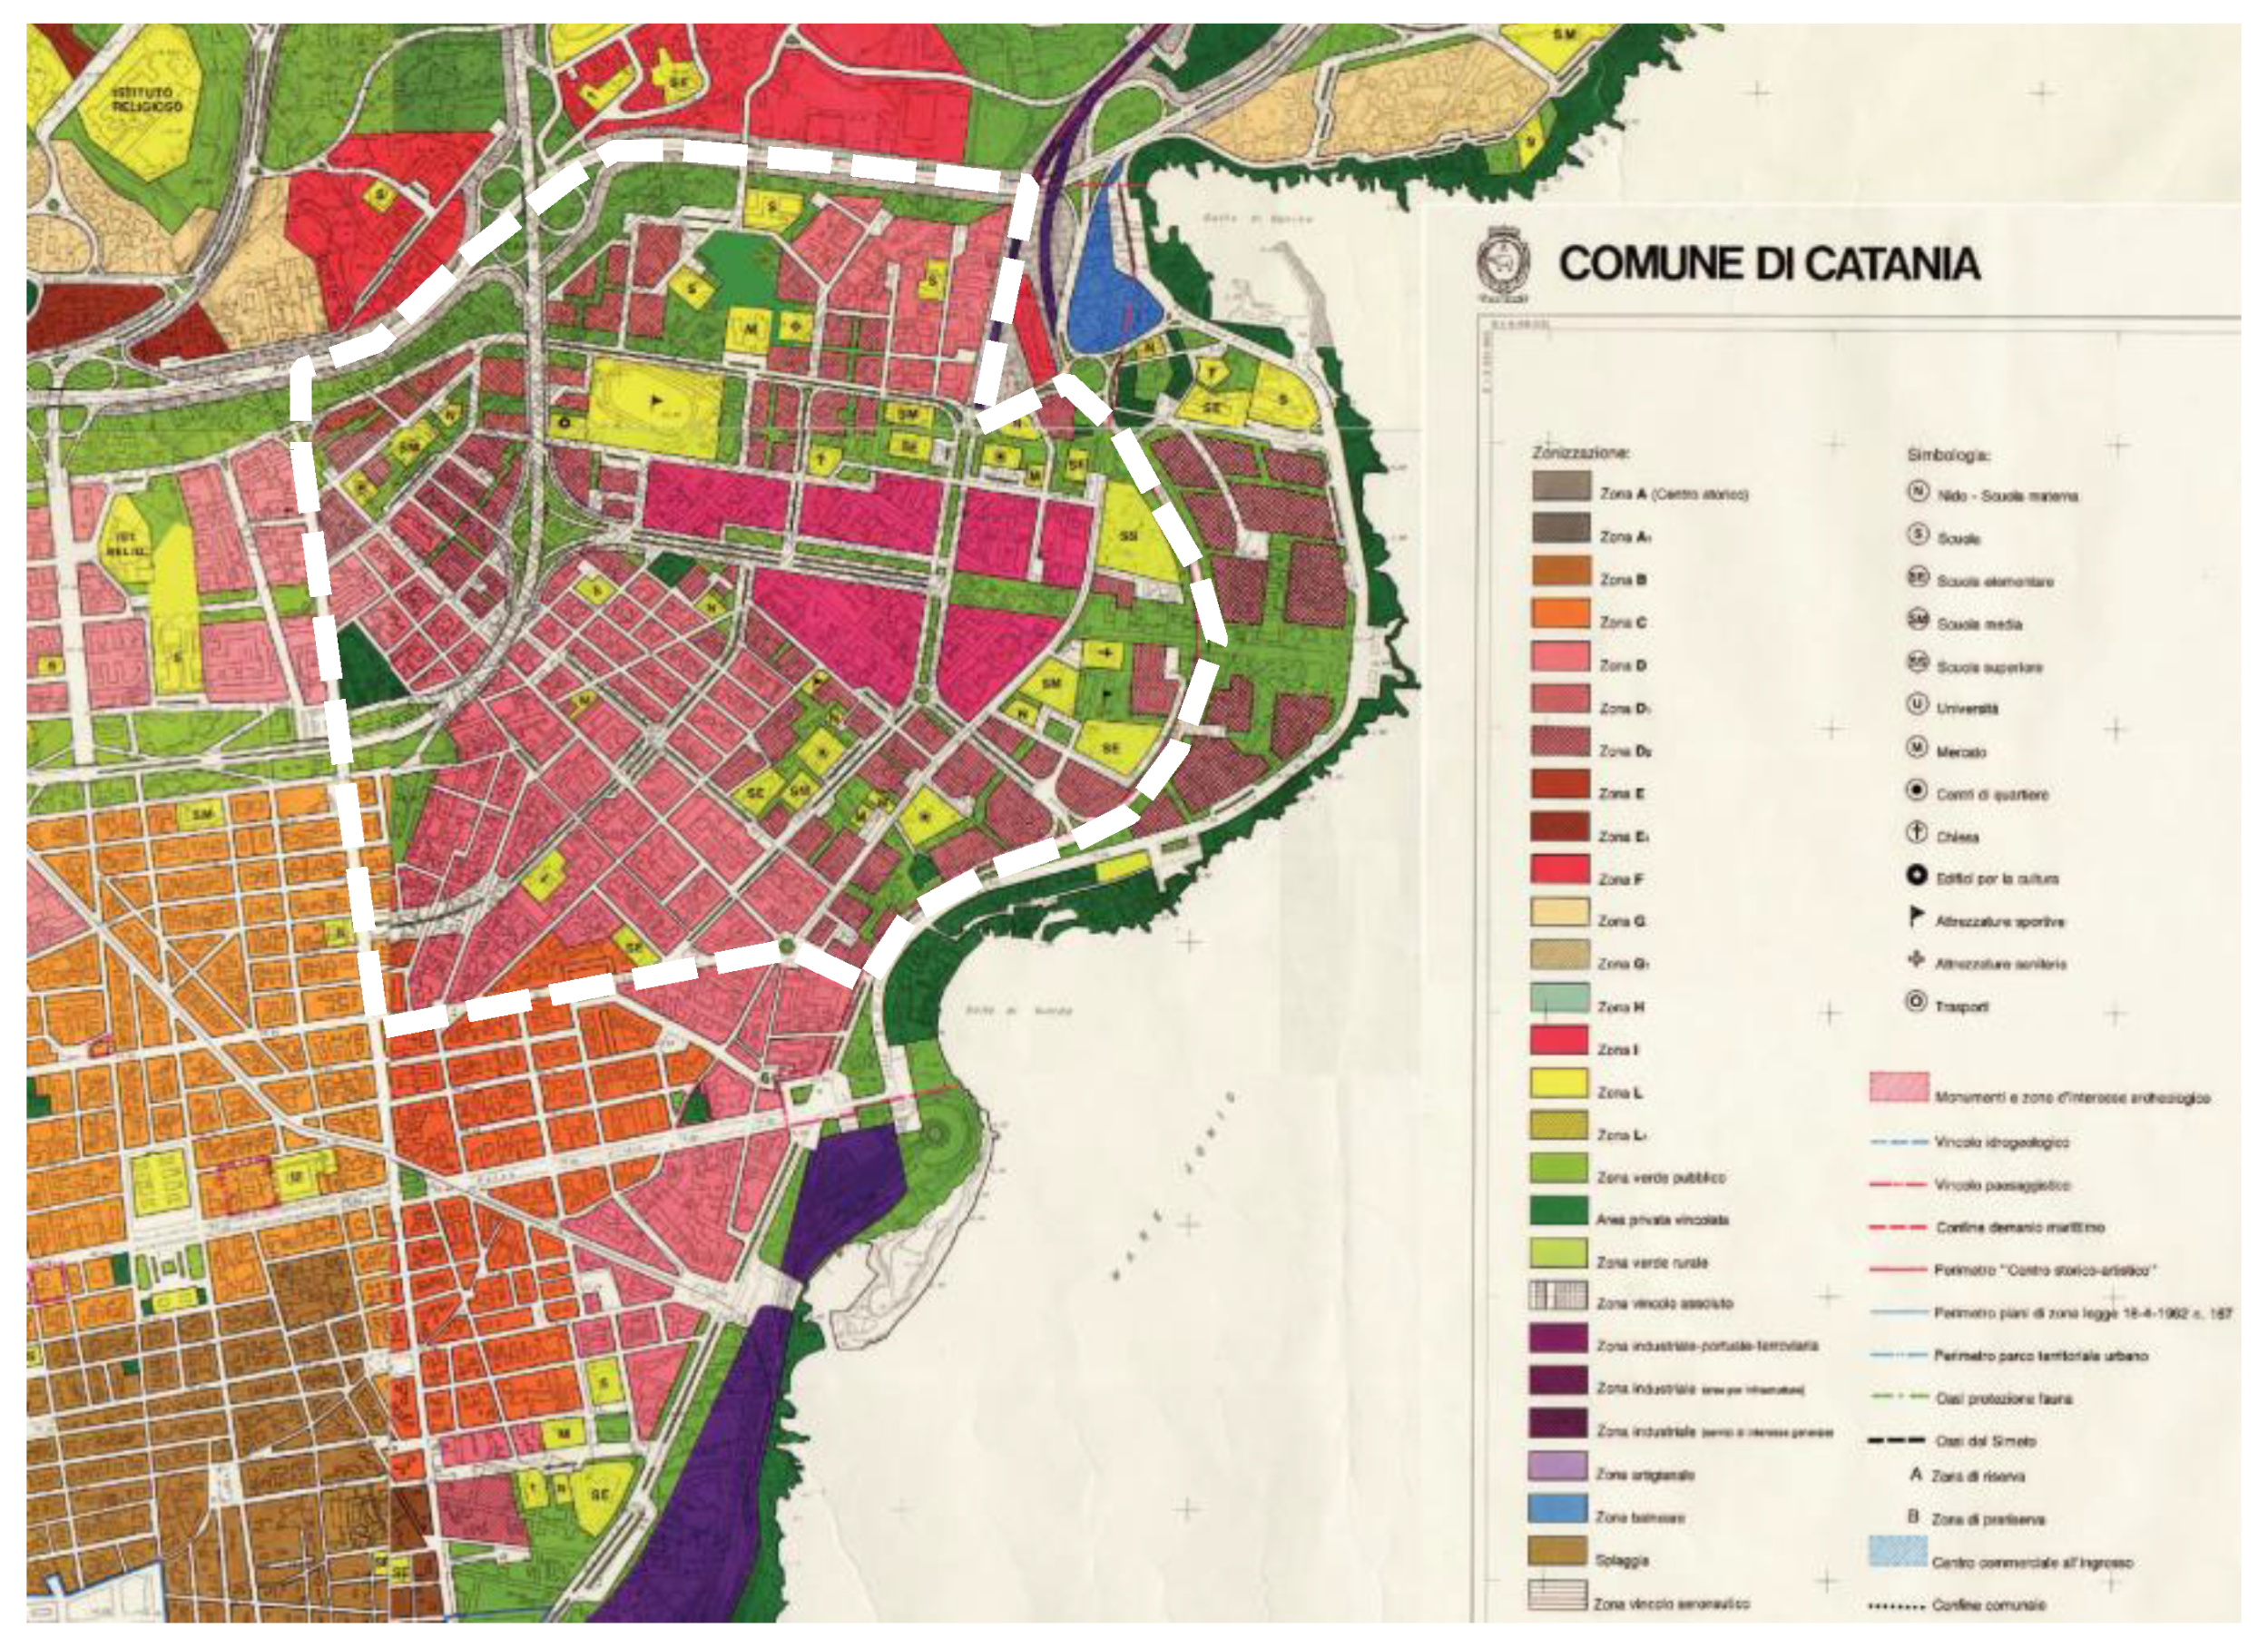
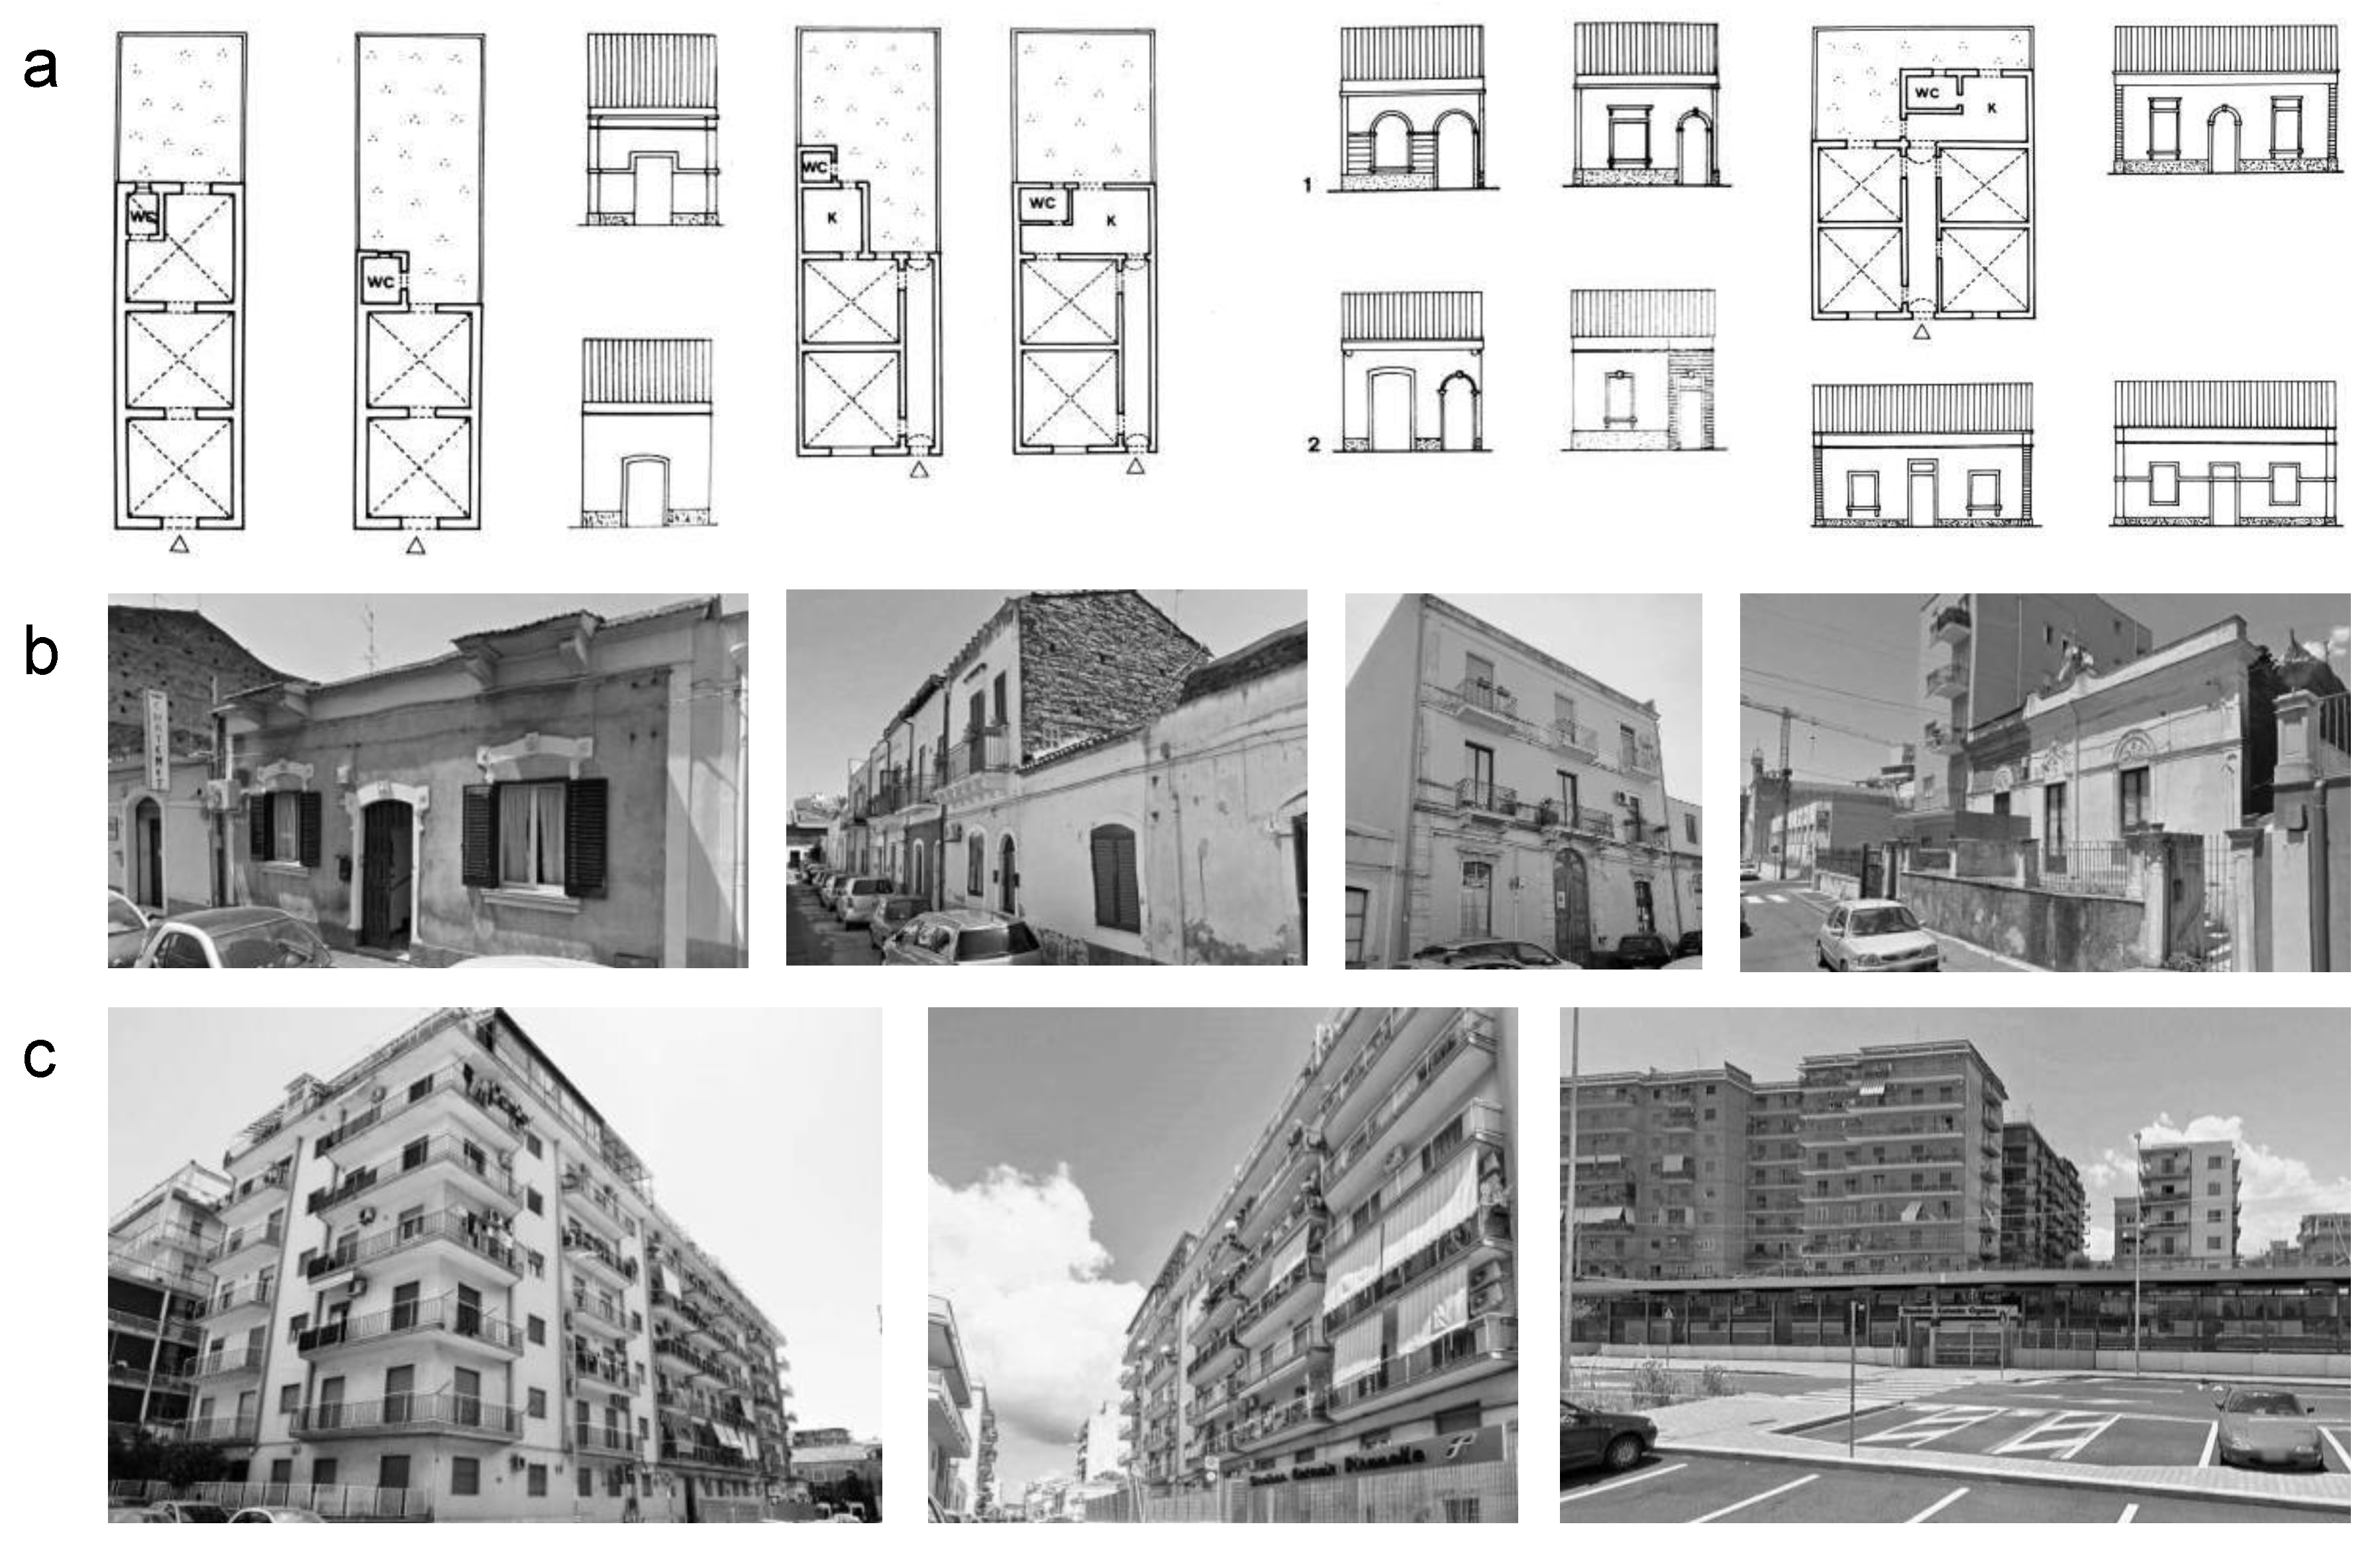
2. Materials: Picanello Neighborhood and the City of Catania
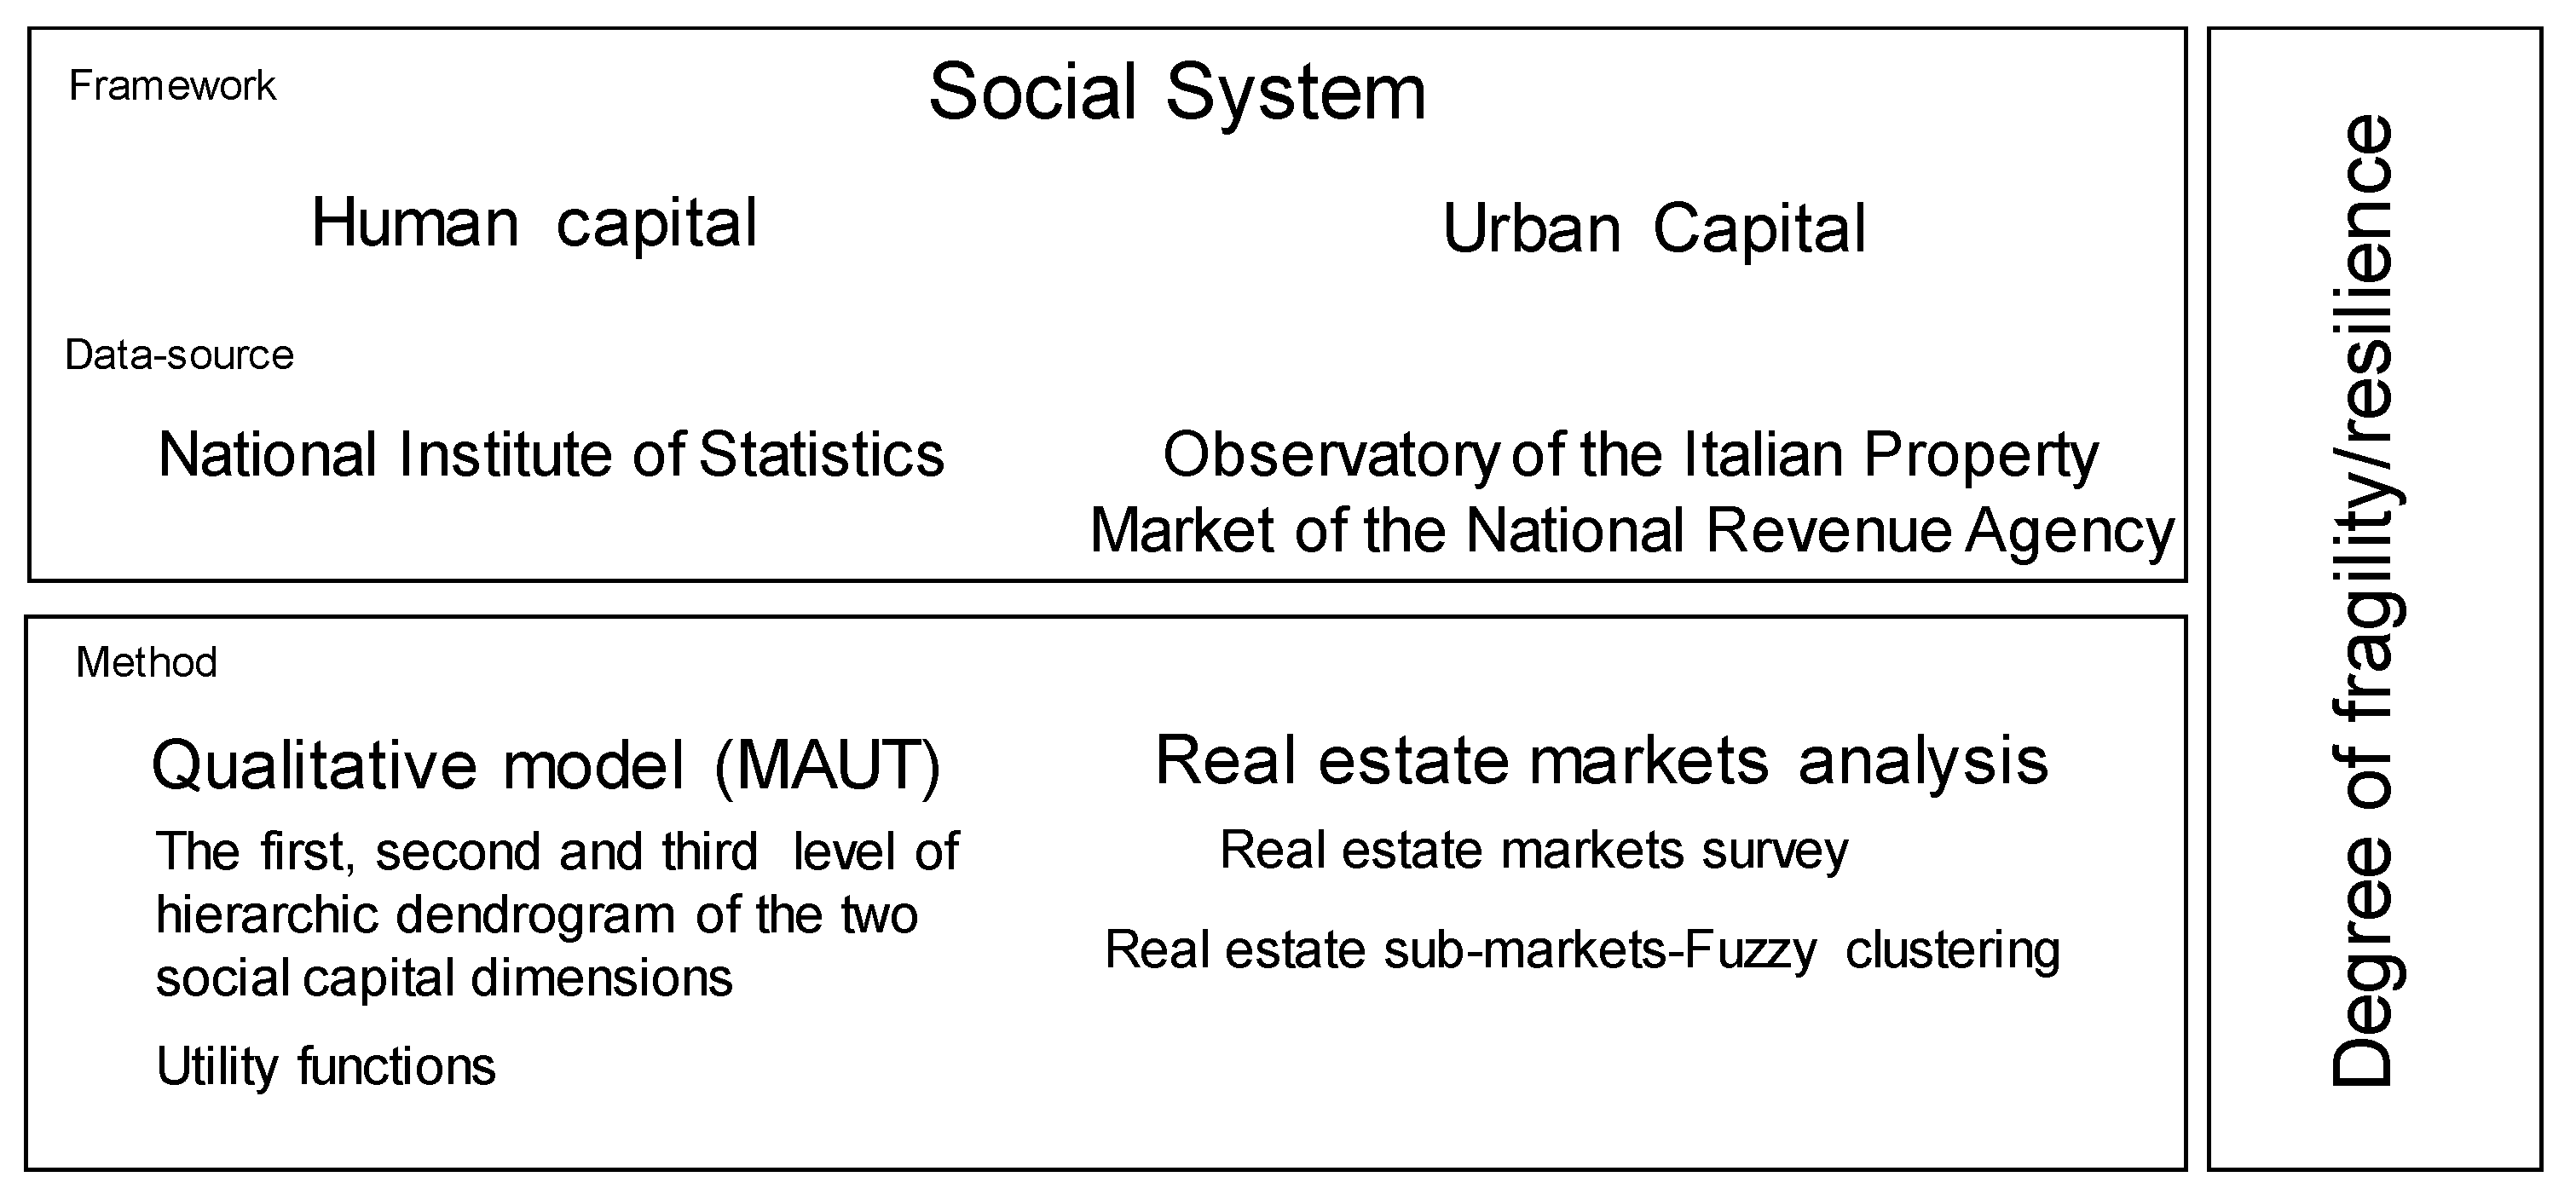
The area nowadays occupied by the neighborhood of Picanello (Figure 1a) is one of the two expansion zones, namely, the north-eastern one, of the historic urban core of Catania. The district is part of the “historic periphery” extending beyond the “Cinda daziaria” (duty walls) in 1895 (Figure 1b). The area was intended to this purpose starting from the end of XIX century within the Masterplan drafted between 1879 and 1882 by F. Fichera and B. Gentile Cusa. In that period the municipality started to deal, although unsuccessfully, both the poor housing condition compared to the new standards, and the disordered and episodic new buildings in the countryside.
Even the Masterplan of 1934 could not start the construction of the neighborhood, due to the incompleteness of the administrative process covering just the zoning plan, then further updated, in 1952, when, finally, the municipal administration established the municipal delegations for decentralizing the utilities in the new suburbs. According to the Masterplan by Piccinato, in 1964, a Directional and Commercial Centre was supposed to be constructed in Picanello (Figure 2, zone “I” in fuchsia), after the preparation of a Detailed Plan, thus supporting the creation of a new urban pole.
The municipal territory of Catania is divided into 10 Municipal Areas (I Centro; II Ognina-Picanello-Stazione, III Borgo-Sanzio, IV Barriera-Canalicchio, V San Giovanni Galermo, VI Trappeto-Cibali, VII Monte Po-Nesima, VIII San Leone-Rapisardi, IX San Giorgio-Librino, X S. Giuseppe La Rena-Zia Lisa) established in 1995, then (2012) grouped in six Districts (Figure 3). A further subdivision concerns the 19 census areas (ACEs). Picanello is part of the II Municipal Area together with the neighborhood of Ognina and belongs to the Second District together with the IV Municipal Area (Barriere Canalicchio) and includes the whole ACE 12 and a small area of ACE 11.
As for ACE 12, Picanello is the most populous municipal area of Catania (14,438 inhabitants; 17,980 inhabitants/sq.km) and one of the most densely built (Figure 4).
The urban-scape characterized by an urban fabric, including a wide range of building types, also due to the recent replacement of the original buildings by the contemporary ones and public facilities, sometimes strongly modifying the original settlement arrangement (Figure 5).
Many social and urban criticalities affect the neighborhood whose complexity and contradictions compensate to each other, thus revealing a significant degree of vitality, as well as outlining positive prospects and opportunities.

3. Methods

The paper aims at providing some measurements of fragility and resilience of the neighborhood of Picanello, in the more general context of the city of Catania, with reference to the concepts of “human capital” and “urban capital” (Figure 6). With the purpose of providing a comparison of the different urban districts, a multidimensional qualitative assessment pattern was implemented using indices coming from different sources, mainly from the National Institute of Statistics. Specifically, as for the urban capital, due to the specific focus on social issues, we carried out a further study concerning the real estate-scape by means of a housing market survey involving a significant sample of properties over the neighborhoods, as well as samples of similar properties over the whole municipal territory, one for each neighborhood. Further information comes from the Observatory of the Italian Property Market of the National Revenue Agency providing the reference (minimum, average and maximum) unit prices and rent by micro-area of each municipality over the whole national territory.
To compare and combine quantities available over different scales and expressed in various units of measurement, the indices have been normalized on a standard scale. To do so, according to the specific indices, we assumed benchmarks from the same city, from other Sicilian cities or, in some cases from other Italian cities, if recognized as more appropriate.

3.1. The Overall Multidimensional Qualitative Pattern

The general qualitative model performs the approach based on the Multiple Attribute Utility Theory (MAUT) method [49,50] since no decision-making process needs to be carried out in the present experiment.
The basic idea is that a single action (in this case a neighborhood) is differently worth under multiple respects (criteria), which can be furthermore differently relevant or significant to the scope of the assessment. This relevance can be represented by a weight measuring the relative importance of each criterion in respect to the others.
Table 1 displays the general pattern for the outranking of n actions according to m criteria:
Where a i is the generic action (neighborhood); x j is the generic main criterion representing a significant issue of fragility/resilience of the neighborhood in terms of social capital); k i j is the assessment of the i t h action from the perspective of the j t h criterion; λ j is the weight of the j t h criterion.
An early approach to the global comparative assessment V i is the weighted average of the k i j :
V i = j = 1 m k i j λ j
under the hypothesis:
j = 1 m λ j = 1
The complexity of the actions to be assessed and compared suggest creating a pattern connecting the different values that have been recognized as relevant to measure and compare the different neighborhoods to each other.
The elementary scores k i j , in turn, come from a structured set of sub-scores arranged according to a hierarchic dendrogram rooting to the human and urban dimensions of the social capital (Table 2, Appendix A). The synthetic pattern is the following:
The sub-scores are attributed to the entries placed in the final level of the dendrogram and calculated because of the normalization, described above, over a 0–2 range (Figure 6 and Figure 7).

3.2. Real Estate Market Survey

3.2.1. Housing Market of Picanello and Overall Urban Real Estate-Scape References

As aforementioned, due to the specific focus on the social issue, the housing market survey concerned two different dimensions, the urban one, with a sample of 72 properties, and the neighborhood one, with a sample of 81 properties of which asking prices are reported as the number of rooms and sq.m. (Figure 8).
The properties are characterized by six primary qualitative characteristics, articulated in 17 sub-characteristics. The main are: k e 1 general location characteristics, k e 2 : micro-environmental functional and symbolic features, k i intrinsic characteristics (such as panoramic quality; view; brightness; lift; security; etc.), k t , technology, and k a 1 building architectural quality, and k a 2 : architectural property quality.
The elements of the sample have been scored from the point of view of each elementary sub-characteristic and, by aggregating them by the main characteristics they belong to, each element is characterized by six aggregated scores ranging from 1 (poor quality) to 5 (excellent quality). Finally, at the ultimate level of abstraction of the concrete qualitative values, a further aggregation of the six scores into one, k , provided synthetic information about the general relationship between urban-human value and unit prices (Figure 9).
This early analysis provides some references for the next comparisons of housing market prices of Picanello to the other neighborhoods, as well as the following representation of the marginal unit prices, i.e., the ratios between the unit prices and the aggregate score k , represented in similar graphs (Figure 10):
The varied combination of vulnerability and resilience factors affecting the several components of the human and urban capital reflected in these particular “real estate-scape” results in a variety of situations in which these values interact: Sometimes they compensate and somehow neutralize to each other; otherwise, they accumulate, affecting the expected price both upward and downward.
The approximation of this early analysis, as well as the wide dispersion of the scatter over the trend line and the low coefficient of determination, suggest carrying out a further study. The latter measure and maps the real estate-scape of the neighborhood in order to outline its structure by detecting the relationships of similarity and dissimilarity allowing us to select consistent groups of properties revealing implicit value/prices semantic chains [51,52].

3.2.2. Sub-Markets Analysis

Starting in the 1940s and 1950s, a group of US researchers who explored the functioning of local housing systems, began to develop “filtering models” as a conceptual framework to support applied studies [53,54]. A central assumption in the filtering models was the existence of real estate sub-markets aimed at outlining the dynamics of house prices, quality changes and household choices.
However, the experimentation of filtering models did not produce a notion of univocal filtering in the housing literature [55].
In fact, in the literature, the concept of filtering is used within the urban economy to refer to many aspects, such as the life cycle processes of housing units (changes in their price, quality, income level of the occupant), and the life cycle processes of households (changes in the quality of their houses, due to variations in the real prices of the houses or in their real income levels).
Empirical analyses based on filtering have generally focused on a specific indicator of change, for example, the drop-in house prices [56], the turnover of houses detectable in the vacancy chains or the mobility of individual households affecting assets [57]. However, whatever the focal point, a rigorous analysis of the filtering necessarily implies a subdivision of the real estate market into several distinct segments among which existing households and houses move in interaction with new buildings. Urban analysts, while agreeing on the existence of market segments and their importance for the analysis of the real estate market [58,59,60], offer different points of view in identifying the empirical dimension underlying their identification. In general, the submarket, for the purposes of the analysis could be defined on the basis of the dwellings’ location in the urban context (spatial submarkets) or on the basis of the real estate characteristics (structural submarkets), which would identify housings with a similar quality compared to their position. In this regard, some researchers have defined the real estate sub-markets on the basis of spatial compartmentalization, i.e., by using a subdivision of the market into areas characterized by types of housing, socio-economic characteristics of households and environmental factors [61,62,63,64,65] or administrative boundaries [66,67,68,69] with references to population data; a priori knowledge of the market to create sub-markets [70]; identification of market areas and dwellings prices on the basis of perceptions of the sector professions [71,72]. Other researchers have suggested that secondary markets include all dwellings, regardless of their location, that have similar physical characteristics and represents relatively close substitutes for potential buyers [73,74].
William Grigsby was the first researcher who defined sub-markets in terms of “close substitutability” of dwellings [75]. According to this perspective, the real estate sub-market is made up of a number n of “neighboring substitutes” belonging to the same group, but “imperfect substitutes” of those belonging to other submarkets [76,77,78,79,80].
Some studies on secondary markets have explicitly recognized the common importance of spatial and structural characteristics in the definition of secondary markets, belong to this approach nested spatial/structural and demander-group-based submarkets.
In summary, there are four main filtering approaches in the literature for identifying submarkets: Spatial submarkets, structural submarkets, demander characteristics or considering the joint influence of structural and spatial factors.
Various models are proposed in the literature to identify and analyze submarkets:
  • Hedonic pricing models [81,82,83]: Predefined, estimated estimates;
  • Factorial Analysis [74];
  • Cluster analysis [67,84,85,86,87,88] not defined;
  • Geostatistical Models [89,90,91,92,93];
  • Fuzzy clustering [94,95,96,97,98].

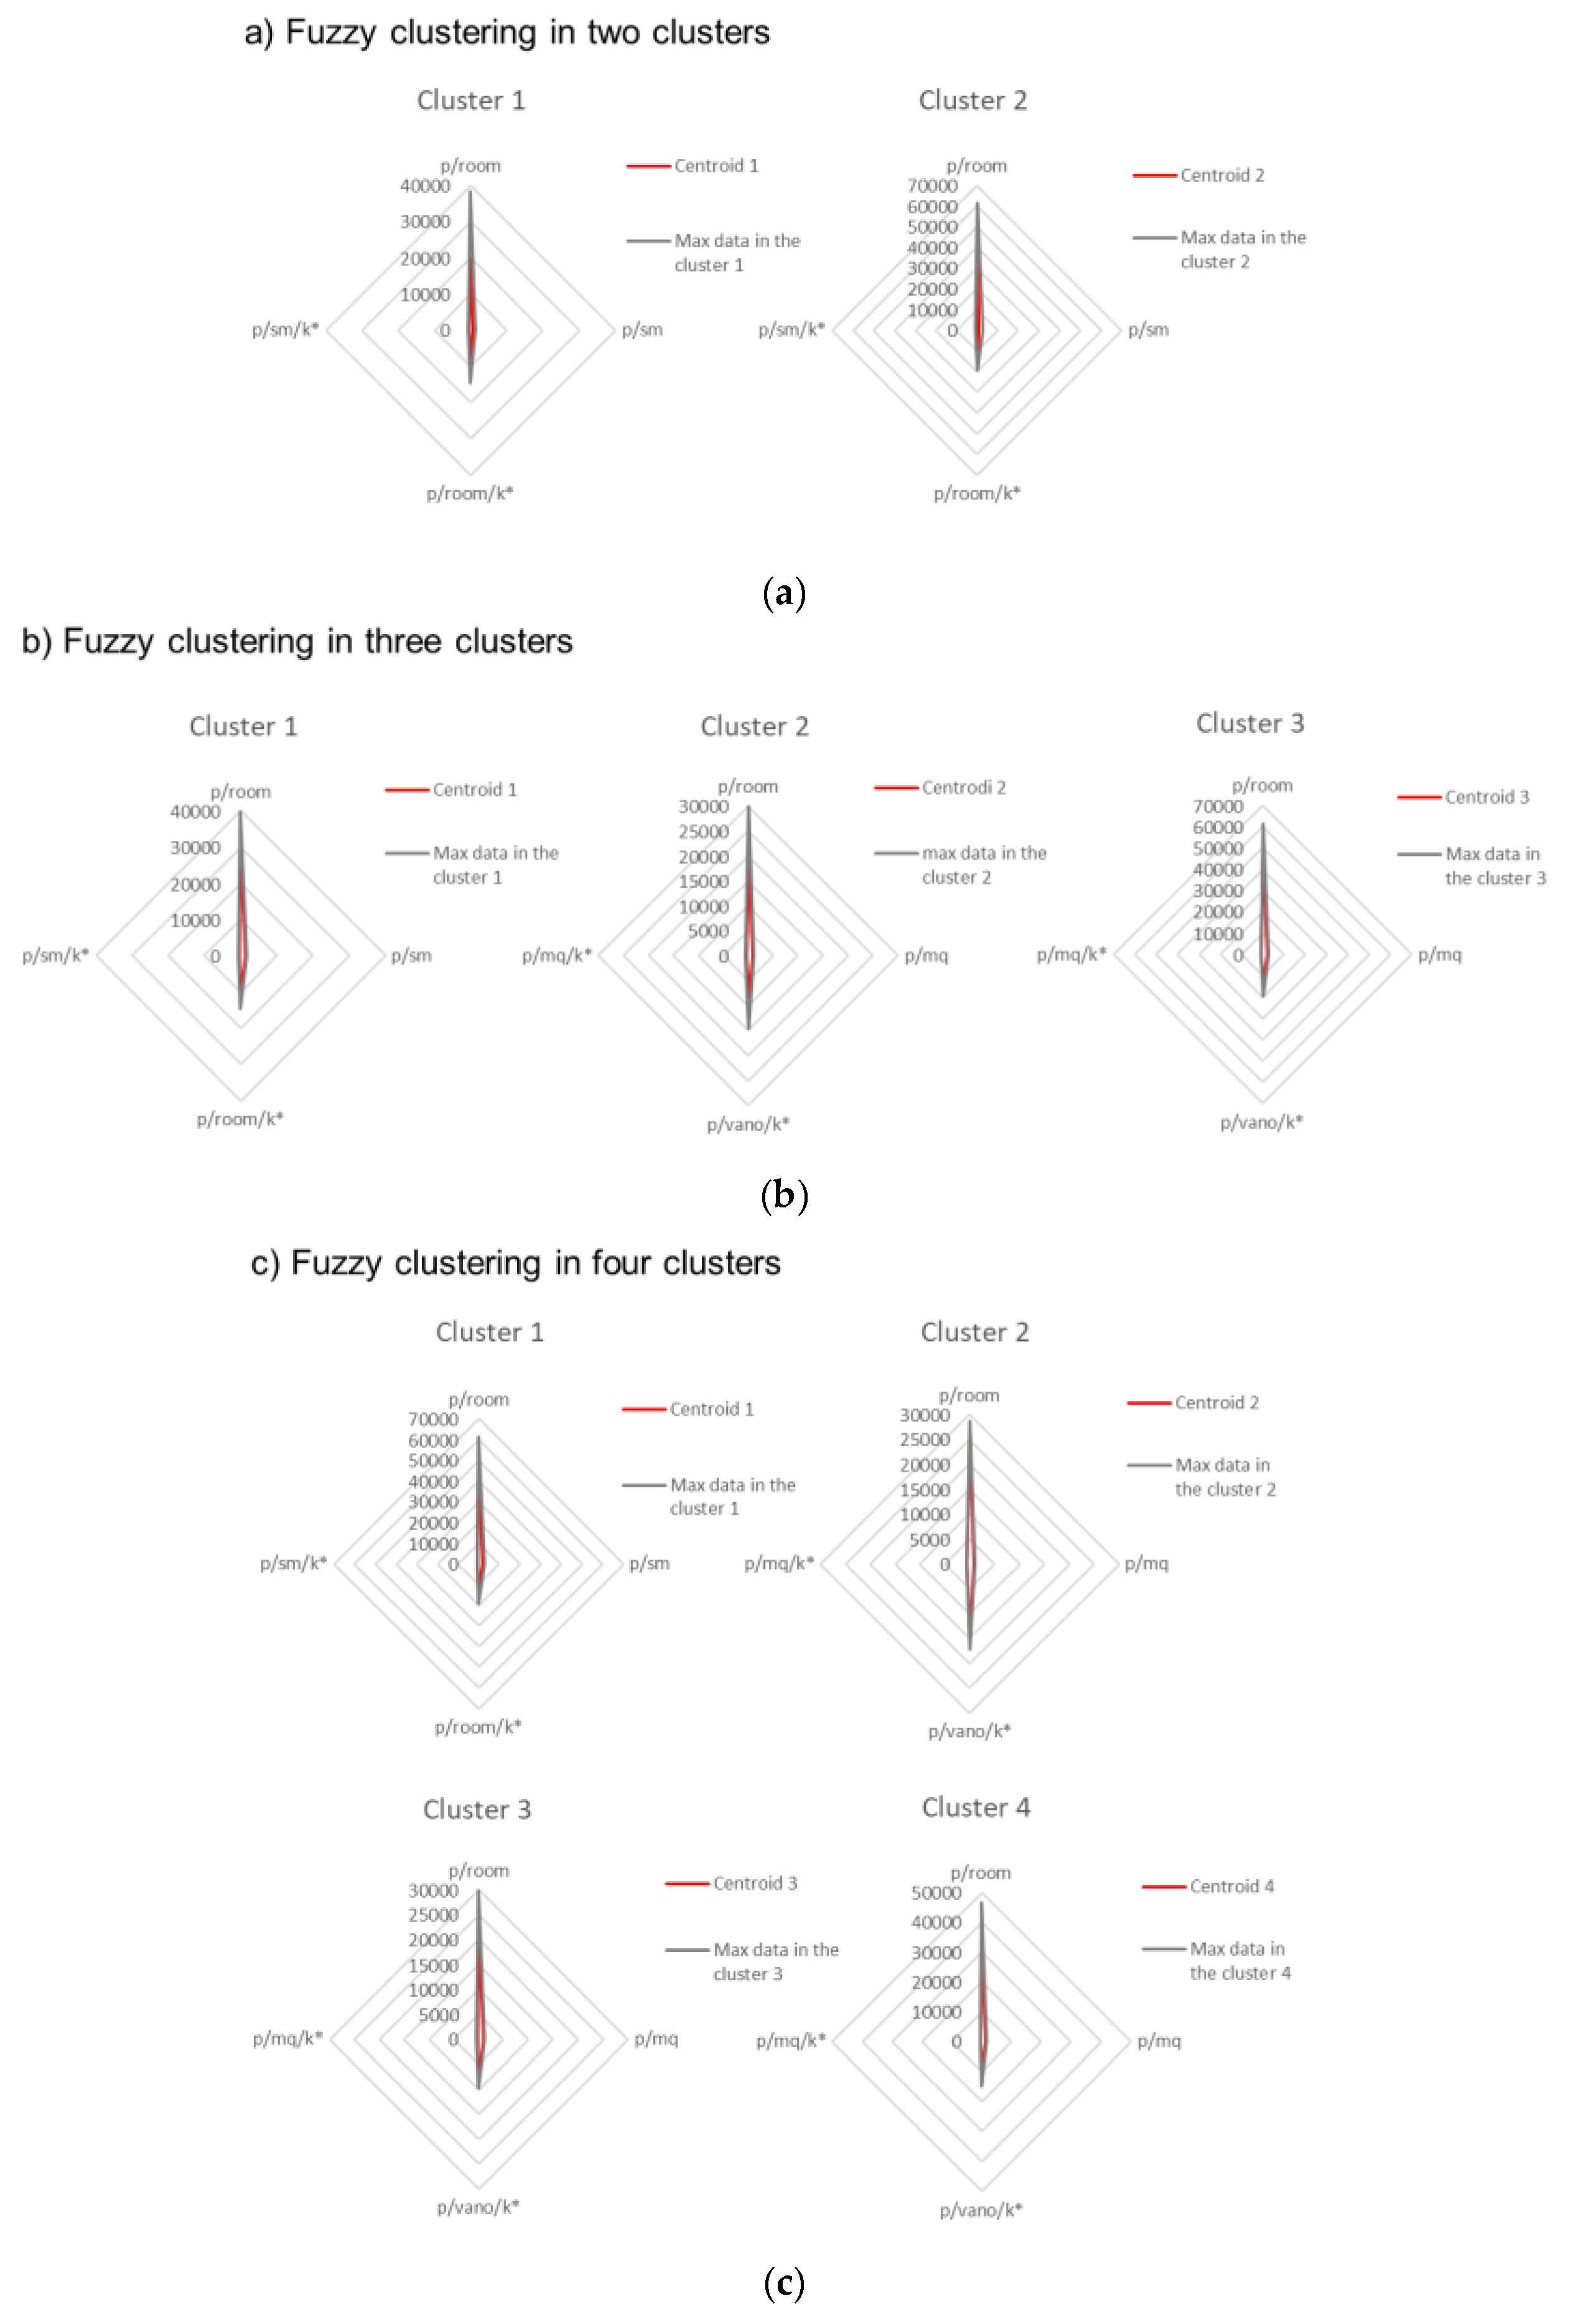
3.2.3. Identifying Real Estate Submarkets Based on Fuzzy K-Means Clustering

By cluster analysis, we mean a multivariate statistical technique, through which it is possible to obtain a groups structure from a certain population of data, that is, by grouping several similar units together in a certain number of groups.
The identified groups are characterized by being relatively homogeneous within them and heterogeneous among them. Homogeneity (heterogeneity) and heterogeneity (diversity) are assessed based on a defined set of variables. Grouping methods include traditional and fuzzy ones. In the first case, the objects belonging to a given group are selected by similarity (hard clustering), i.e., the “similar” objects are found in the same cluster. In the second case, the grouping of objects is carried out based on modulation of the degree of similarity (even partial) (soft clustering).
Fuzzy clustering makes use of fuzzy sets (defined by Zadeh) [99], which are sets whose elements have degrees of membership. More formally, supposed X is a set of data points. A fuzzy set A is formed if there exists a function f A : X [ 0 , 1 ] such that each element a     A is of the form f A ( x ) = a , for some x     X . That is, each data point in X is assigned a value between 0   and 1 which describes its degree of membership or the probability of its placement in the set A . In a fuzzy clustering, the data objects can belong to one or more clusters and their membership in a cluster corresponding to some probability.
The results of a fuzzy clustering can be represented by the k × n   matrix U defined in Equation (3) [100]:
U = u 11 u 1 n u k 1 u k n
where k is the resulting number of clusters and n is the number of data points in the original dataset? Each element in U is denoted by u j i where j { 1 , , k } and i { 1 , , n } .
In fuzzy clustering u j i may take a value between 0 and 1 , i.e., u j i     [ 0 ,   1 ] .
U must satisfy two conditions in clustering
j = 1 k u j i = 1
j = 1 k u j i > 0
Condition (4) requires that for each data object, the sum of its degrees of membership across all clusters be equal to 1 . Condition (5), requires there to be no empty clusters.
One example of a fuzzy clustering algorithm is the fuzzy k m e a n s algorithm (sometimes referred to as the c-means algorithm in the literature). It pursues the goal to minimize some objective function. Suppose we have a dataset D = { x 1 , x n    } and let q     [ 0 ,   1 ] . Here, q is known as the fuzzifier, which determines the fuzziness of the resulting clusters. The larger the q value, the smaller the membership values u j i and, thus, the fuzzier the clustering. The objective function is defined as
E d = i = 1 n j = 1 k u j i q d 2 ( x i ,   V j )
where d   is an inner product metric function, and the V j s are the centroids of the initial clustering of the data. This initial clustering of D is, of course, allowed to overlap if all points are included in at least one cluster. At any iteration, the degree of membership of the data point x i in the cluster   j is defined by Equation (7):
u j i = ( d 2 ( x i   , V j ) l = 1 k d 2 ( x i   , V l ) ) 1 1 q
Each centroid V j is recalculated in the following way (7):
V j = i = 1 n u j i q x i i = 1 n u j i q
After each iteration, the membership matrices of consecutive times steps are compared.
If m a x j i | u j i k + 1 u j i k | < ε , where 0 < ε < 1 is some predefined criterion for stability, then the fuzzy k-means algorithm is complete? Otherwise, the membership matrix, using new centroids, is calculated.
In order for d to be a distance measure and applied to a dataset { x 1 , x n } , the following conditions must defined for indices 1 i , j , k n :
d ( x i , x j ) = d ( x j , x i )
d ( x i , x j ) 0
d ( x i , x k ) d ( x i , x j ) + d ( x j , x k )
d ( x i , x j ) = 0   i f   a n d   o n l y   i f   x i = x j
There many kinds of distance measure. The most well-know and commonly used for numerical data is the Euclidean. The generalized Euclidean distance in p-dimensional between two points x i = ( x i 1 , , x i p ) and x j = ( x j 1 , . . , x j p ) is given by
d ( x i ,   x j ) = ( k = 1 p ( x i k x j k ) 2 ) 1 2
For numerical data other examples of distance function are the Manhattan distance (also known as taxicab distance), maximum distance, and average distance.

4. Results: Fragility and Resilience in Numbers and Comparisons

This section starts presenting the final part of the analyses, the one concerning the real estate survey and the interpretation of the findings. Then, these results will be presented in the context of the general assessment integrating all the analyses addressed to the social-urban-scape.

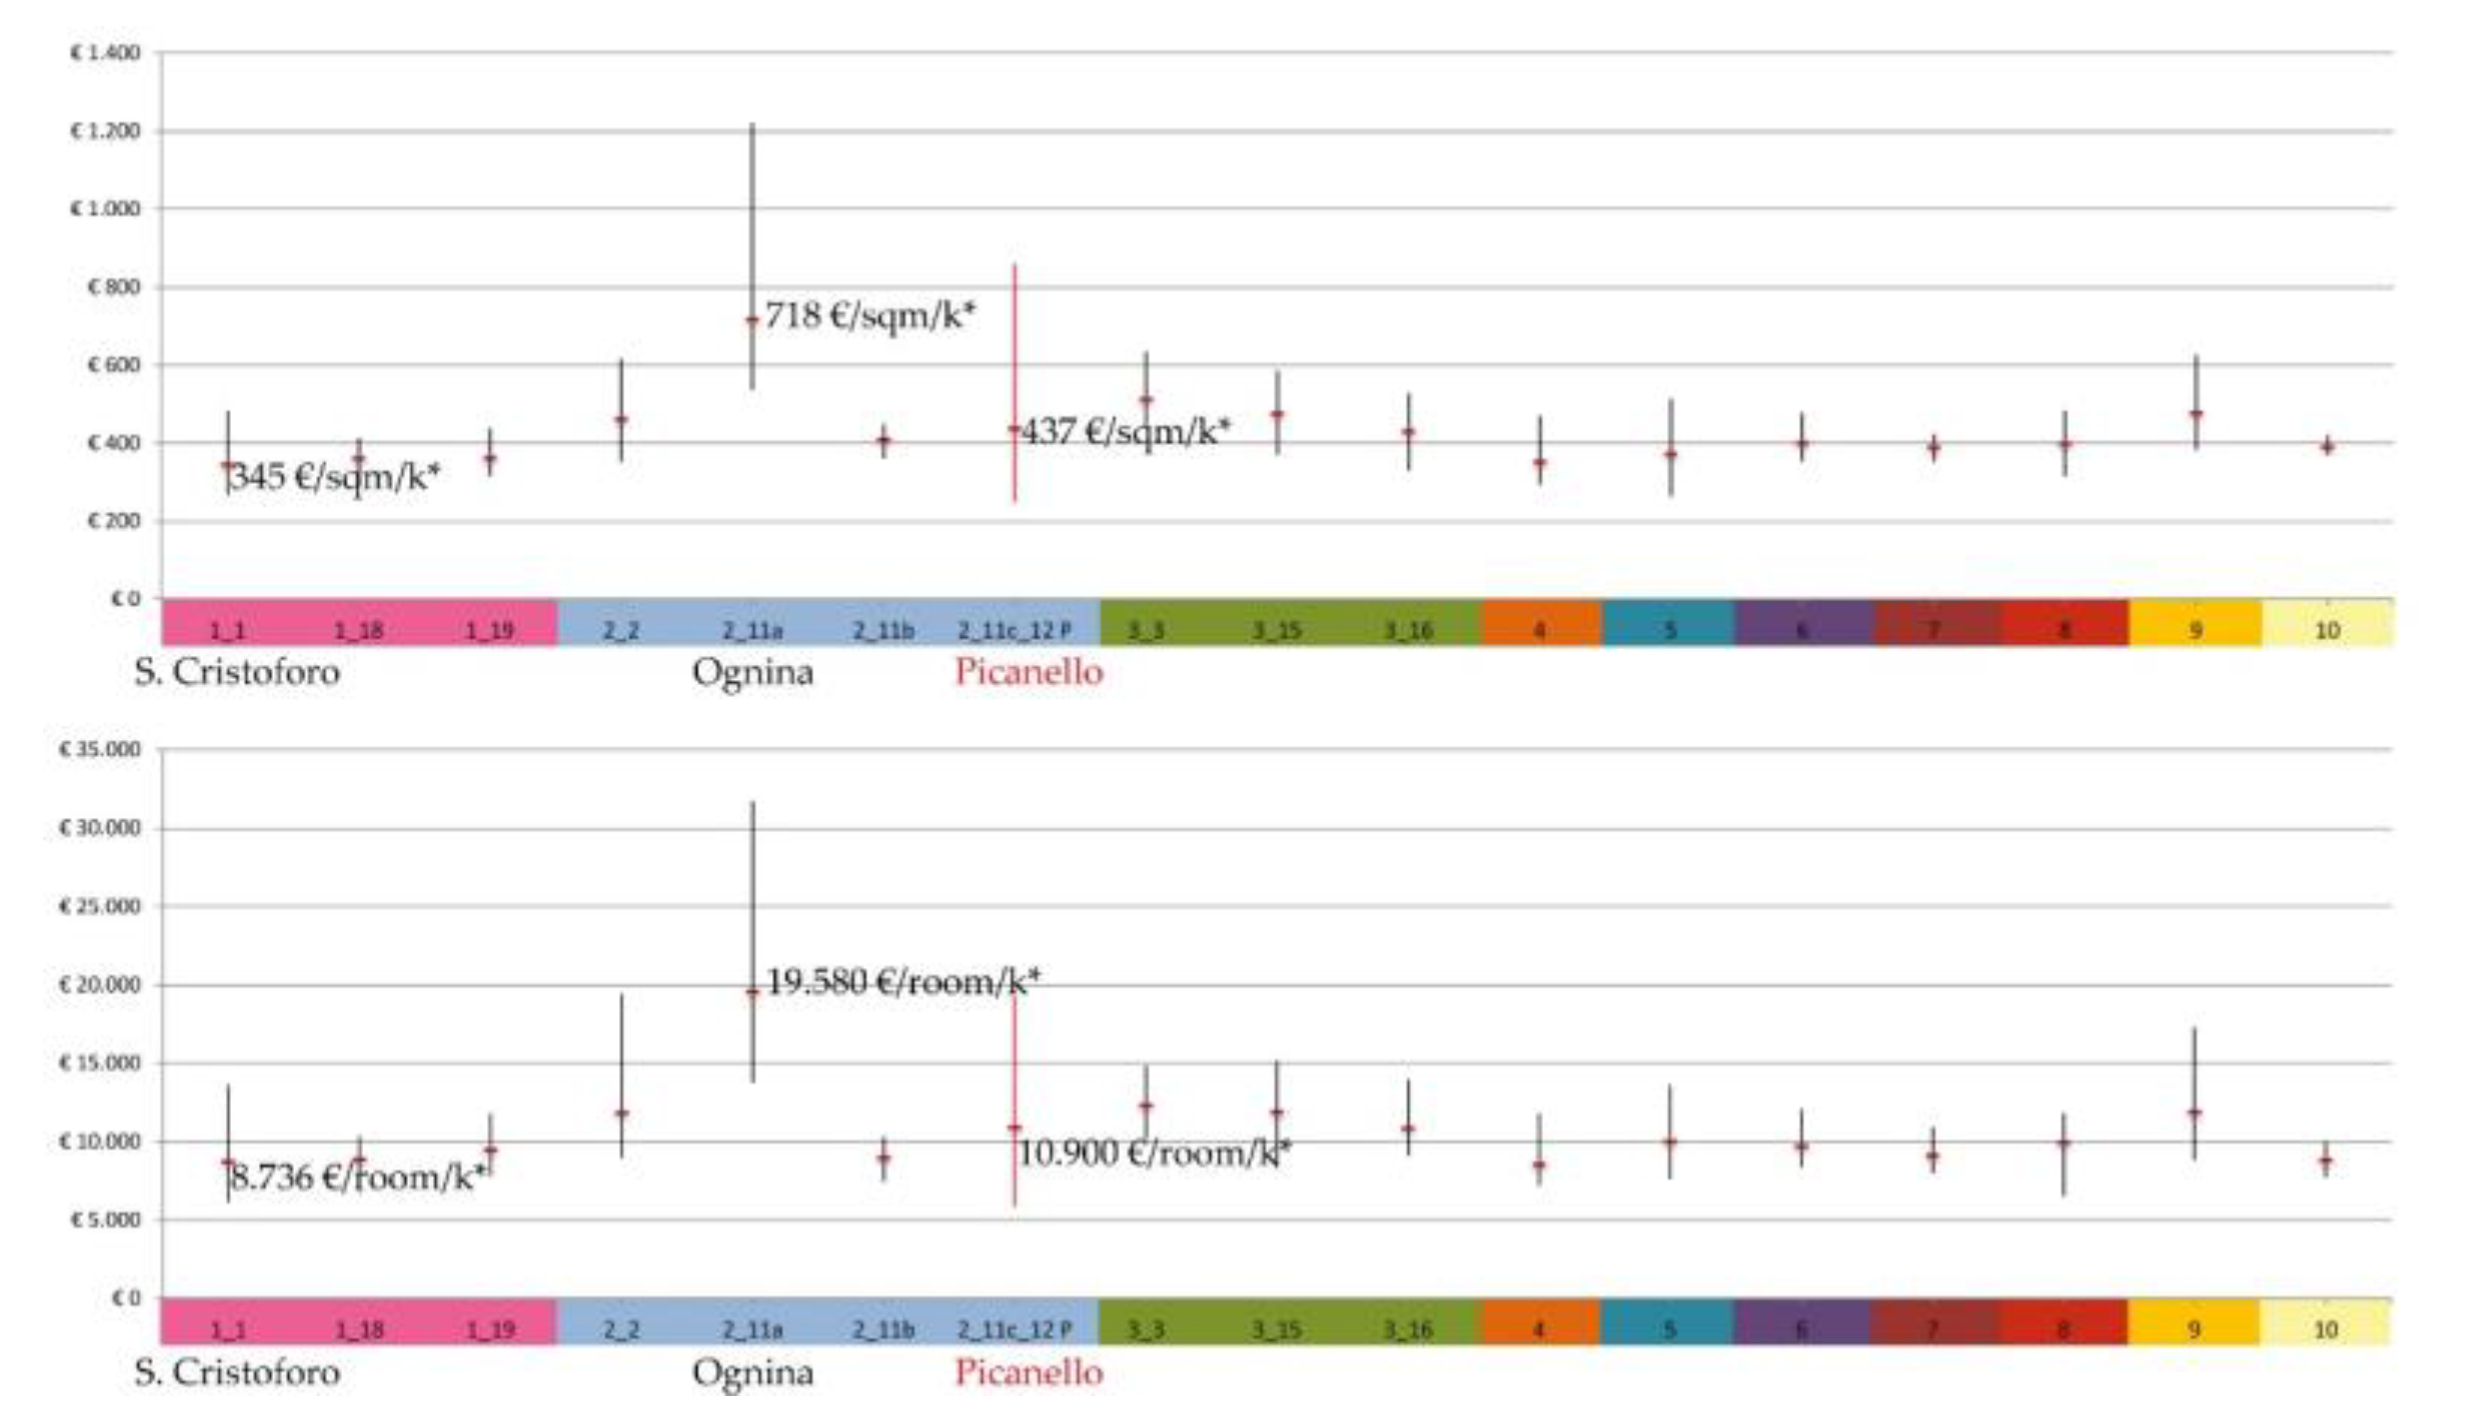
4.1. Real Estate-Scape. An Early Overview

The early surveys and the comparisons between the different urban areas showed the general wider range of the real estate market prices of the sample of Picanello, mostly due to the larger sample surveyed; nonetheless, in absolute terms, this range can be assumed as a measure of heterogeneity and complexity of this heritage (Figure 11 and Figure 12). These characteristics affirm the wide quantitative and qualitative housings supply. The medium-low price level, approximately comparable to the new building cost, is a general index of vulnerability, but, at the same time, it outlines opportunities for future inclusive renovation programs, as indicated by the upper bound of the range.

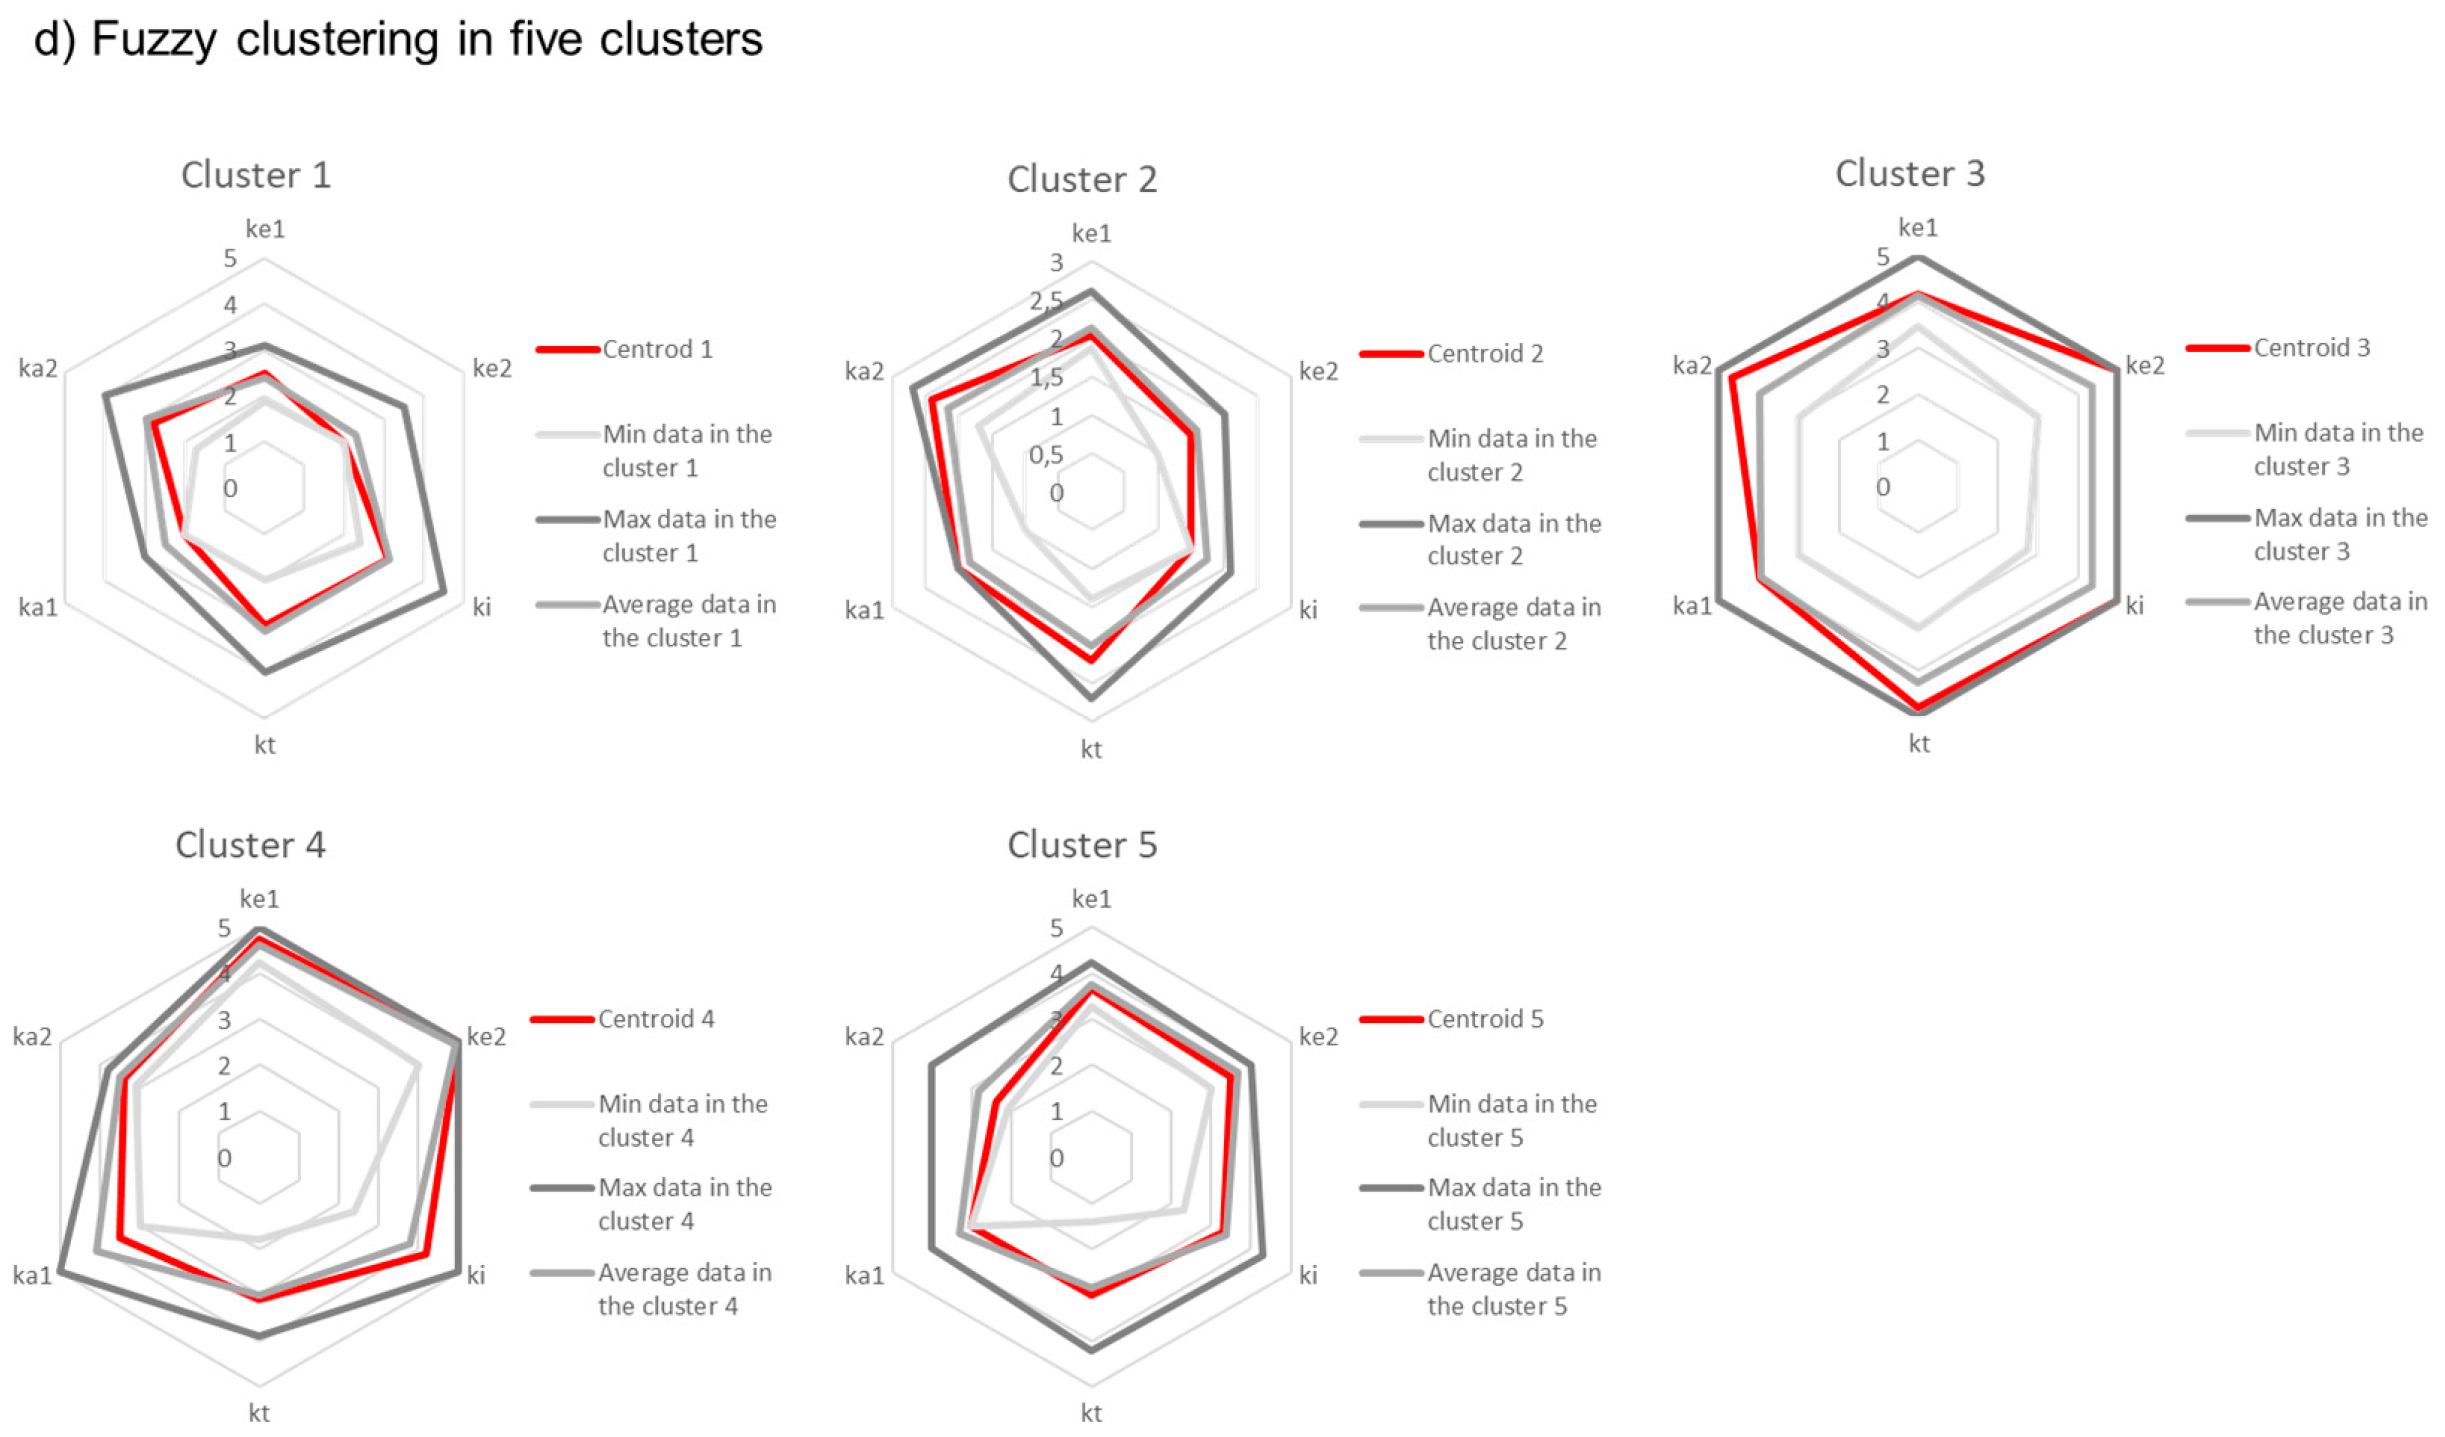
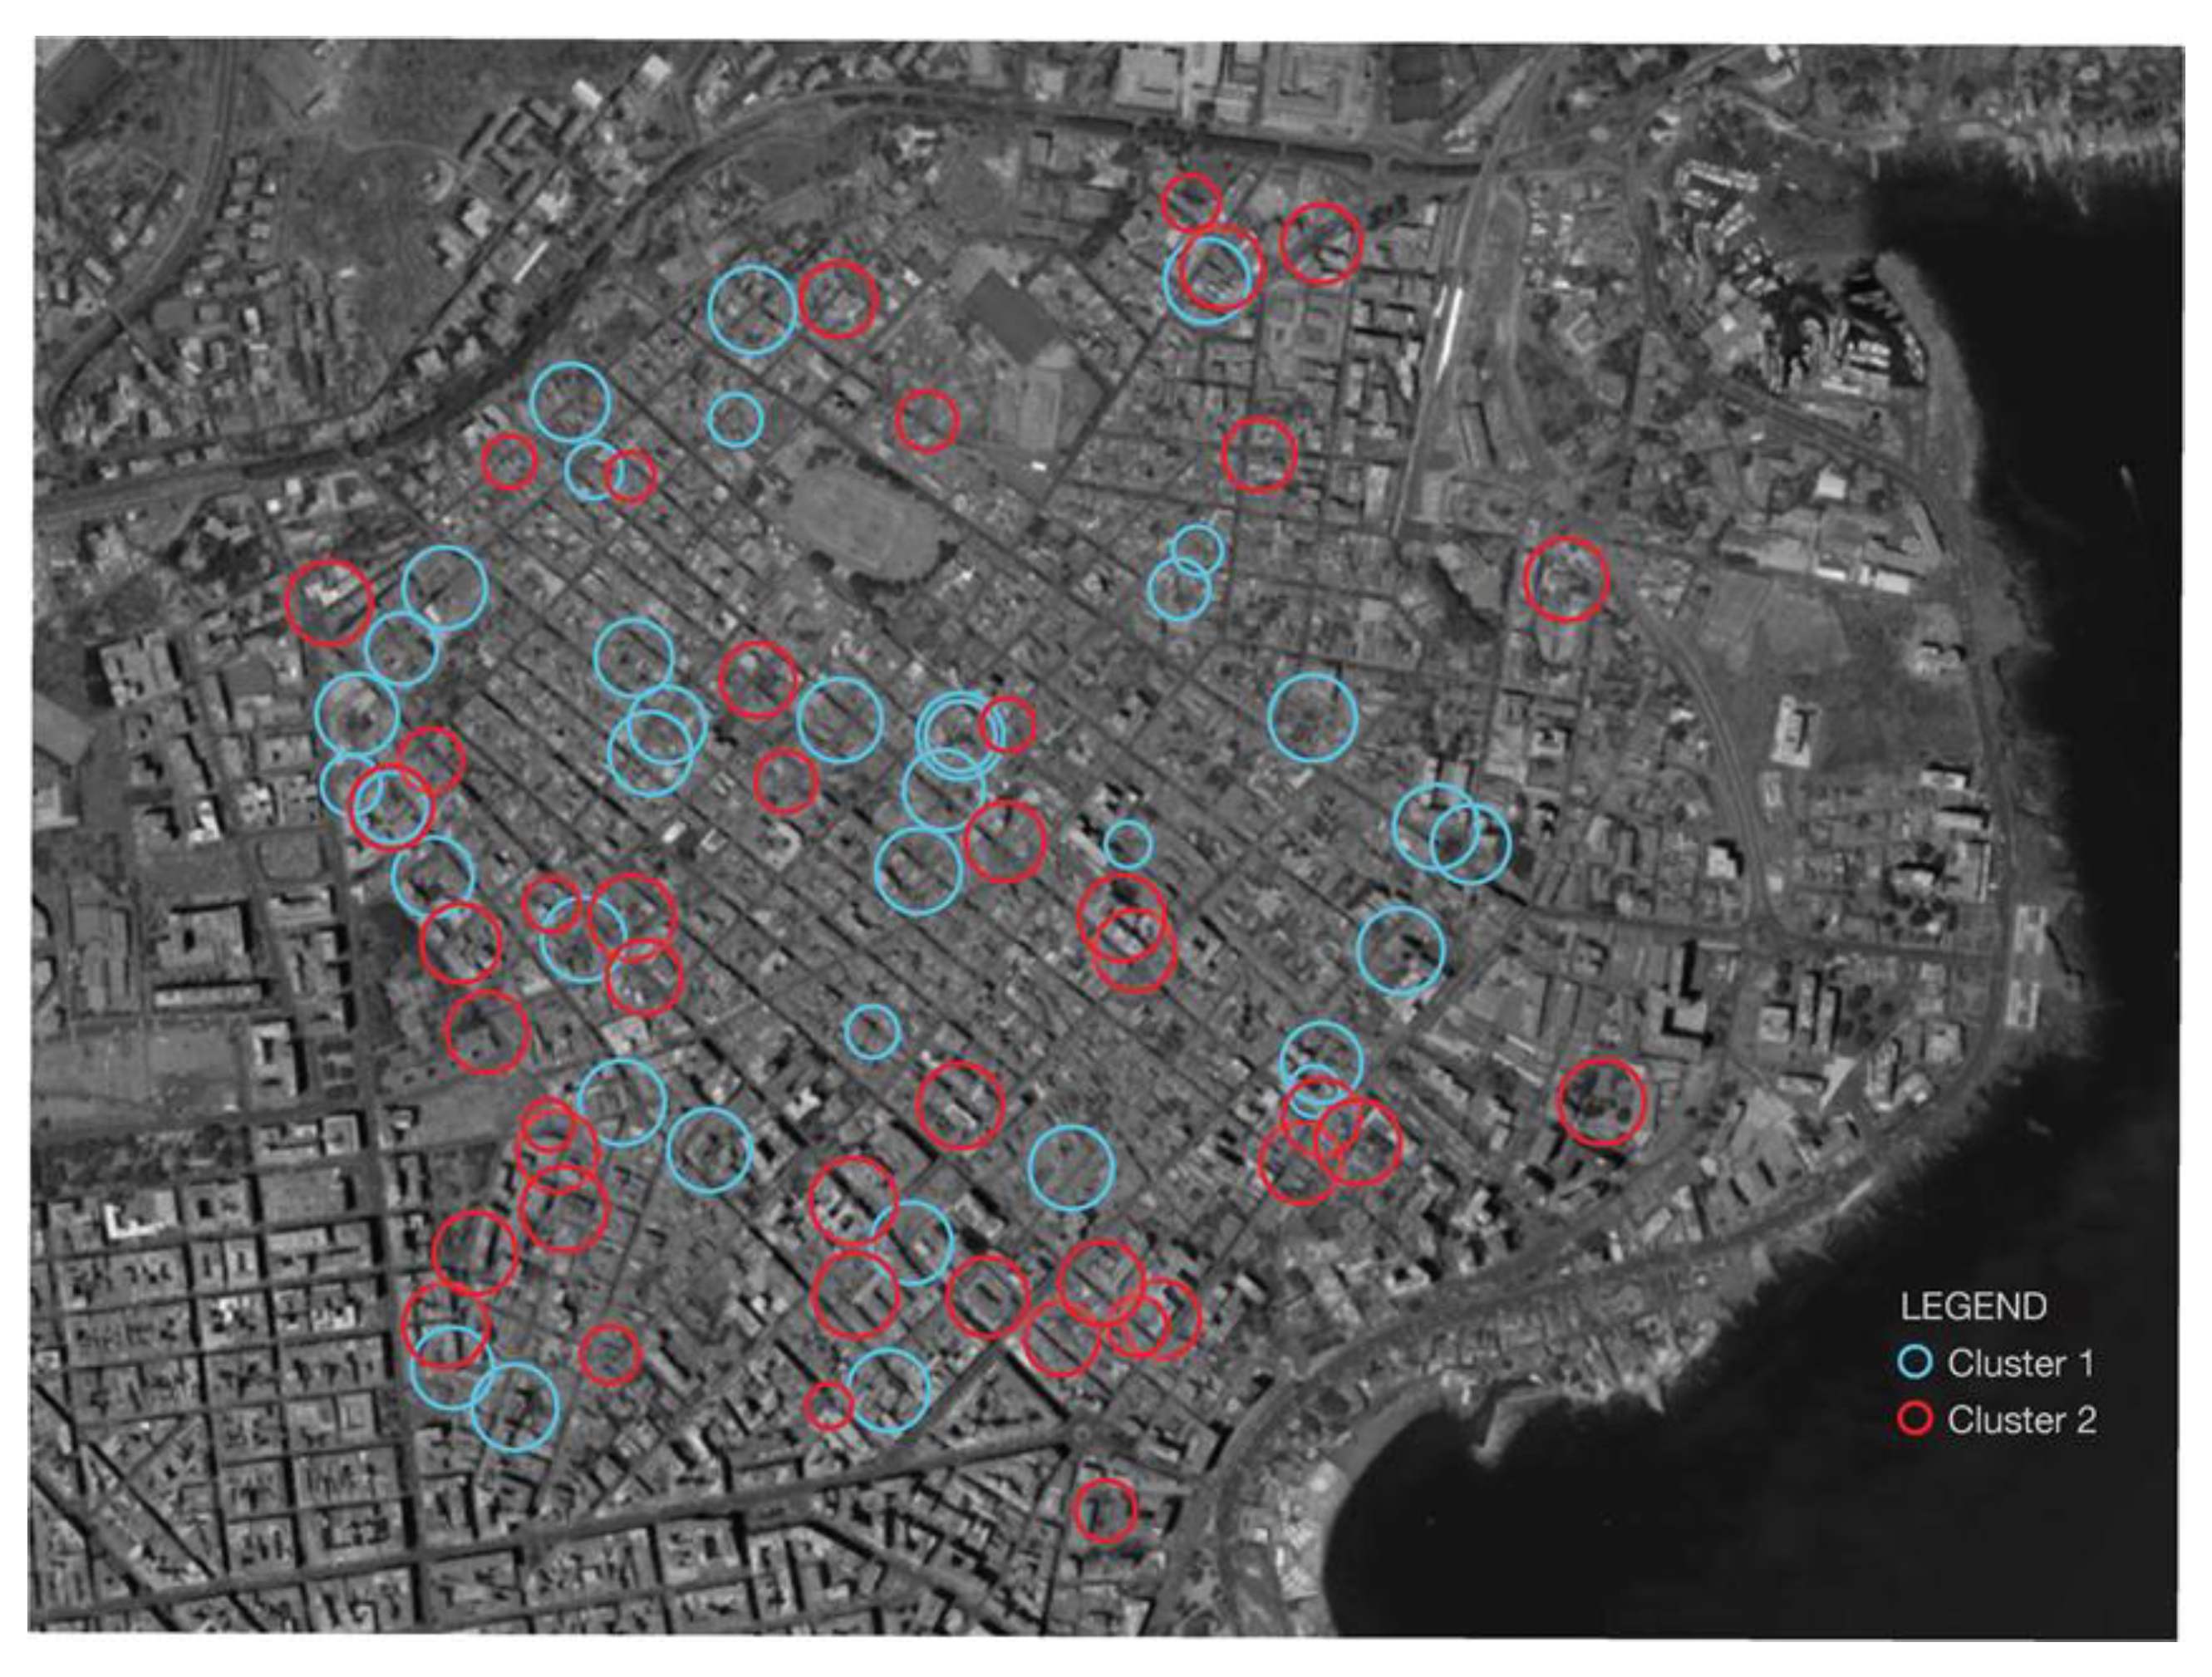
4.2. Identifying Real Estate Submarkets in Picanello Based on a Fuzzy K-Medoids Clustering

As part of the analyses aimed at exploring the functioning of local housing systems, those based on filtering models presuppose the identification of real estate sub-markets.
Identifying a real estate submarket means finding properties that can be considered close substitutes for those belonging to the same group and imperfect for those belonging to different groups. An analysis aimed at identifying groups of properties within a sample as close substitutes for those belonging to the same group, can be carried out on the basis of two filtering models, the one based on the spatial characteristics and the one based on the real estate characteristics. In general, it is possible to achieve segmentation of a sample of properties by means of two approaches, the one supported by spatial submarkets analysis and by the one structural submarkets analysis. Certainly, in the case of the analysis of a sample of properties located in a well-defined area, such as that of a neighborhood, the real estate characteristics are the elements that offer better support for the segmentation of the sample.
However, a spatial segmentation of the sample can be carried out to provide a deepening of the submarkets identified based on the real estate characteristics [101,102,103]. Among the possible approaches proposed in the literature to identify and analyze submarkets, we have chosen fuzzy clustering. This approach allows you to partition a set of objects into two or more clusters, so that the objects within a cluster are similar and the objects in the different clusters are different, therefore, in general, it better meets the needs underlying the identification of submarkets proposed in the Grisby’s approach. Among the centered-based algorithms proposed in the literature, we have chosen the k-medoids, which is a partitioning algorithm related to the k-means algorithm, which uses unlike the latter as centers the medoids instead of the average, i.e., a point in the dataset that is closer to the average. Therefore, the analysis aimed at identifying the submarkets of the neighborhood was conducted by means fuzzy clustering that generalizes partition clustering method k-medoids.
Fuzzy k-medoids clustering was implemented on a sample of 81 properties in the Picanello neighborhood.
We analyzed three different datasets of the Picanello real estate market. The three datasets feature from a different configuration of the real estate characteristics.
  • the first dataset is characterized on the basis of the six real estate characteristics: k e 1 —location, urbanization and accessibility; k e 2 —neighborhood characteristics: functional symbolic characteristics; k i —unit location within the building: panoramic quality and view, brightness, accessibility within the building; k t —technical characteristics: building overall technological quality, unit finishes and windows quality, maintenance levels; k a 1 —building architectural quality; k a 2 —unit architectural quality;
  • the second dataset is characterized on the basis of four types of price:   p r i c e / r o o m ,   p r i c e / s m ,   p r i c e / r o o m / k*, p r i c e / s m /   k*;
  • the third dataset is characterized on the basis of six real estate characteristics ( k e 1 ,   k e 2 , k i ,   k t ,   k a 1 ,   k a 2 ) and the four types of price ( p r i c e / r o o m ,   p r i c e / s m ,   p r i c e / r o o m / k*, p r i c e / s m /   k*).
Where k is a single score that aggregates the main real estate characteristics, expressing the overall quality associated with each j t h property of sample X . The overall score k is calculated by the following formula:
k j = h k j h λ h
where λ h is the weight of the h t h characteristics, so that h λ h = 1 ; the scores of all features related to each k h are calculated similarly. The weights λ h are empirically defined to maximise the R 2 of the exponential simple regression function expressing the relationship between unit price ( p r i c e / r o o m or p r i c e / s m ) and k .
For the processing of the datasets on the real estate market of Picanello, we used the NCSS software, which supports a fuzzy k-medoids clustering.
In the NCSS software, the goodness of the fuzzy classification aimed at identifying the number of clusters that can be considered significant, is verified through three indices, namely, the value of the Average Silhouette, which provides information on the quality of the structure found (strong, reasonable, weak and none) cluster by cluster, and the normalized values of the partition coefficients of Dunn—Fc (U) and Kaufman—D (U).
The fuzzy k-medoids clustering on the first dataset of properties characterized on the basis of the six real estate characteristics ( k e 1 ,   k e 2 , k i ,   k t ,   k a 1 ,   k a 2 ) produced four groupings, two, three, four and five clusters, which identifying fourteen potential real estate submarkets (Figure 13 and Figure 14).
The verification of the goodness of the classifications according to the three indices mentioned above, identified only in the first case a reasonable structure, while in all the other cases, weak structures were identified.
Based on that, only the sub-markets which have been identified by C l u s t e r 1 and C l u s t e r 2 in two-cluster fuzzy clustering can be considered significant for the segmentation of the real estate market of Picanello.
In particular, in the two-cluster classification, the properties of the dataset are distributed between C l u s t e r 1 and C l u s t e r 2   in the following way:
( 2 , 3 , 4 , 5 , 6 , 7 , 8 , 9 , 10 , 11 , 12 , 13 , 16 ,   17 , 18 , 19 , 20 , 21 , 22 , 24 , 25 , 26 , 29 , 30 , 31 , 33 , 40 , 42 , 43 , 45 , 46 , 49 , 53 ,   54 , 59 , 60 , 62 , 65 , 70 , 75 , 81 ) C l u s t e r 1
( 1 , 14 , 15 , 23 , 27 , 28 , 32 , 34 , 35 , 36 , 37 , 38 , 39 , 41 , 44 , 47 , 48 , 50 , 51 , 52 , 55 , 56 , 57 , 58 , 61 , 63 , 64 , 66 , 67 , 68 , 69 , 71 , 72 , 73 , 74 , 76 , 77 , 78 , 79 , 80 ) C l u s t e r 2 .
The centroid of the first cluster is property 31 and that of the second cluster is property 32.
The submarket identified by C l u s t e r 1 , i.e., submarket 1, contains the worst properties in terms of real estate characteristics, the second submarket identified by C l u s t e r 2 , i.e., submarket 2, contains the best ones.
In fact, the real estate characteristics of C e n t r o i d 1   all have lower values, and those of C e n t r o i d 2 all have higher values than the average values of the corresponding characteristics in the dataset.
The submarkets 1 is characterized not only by the lower values of the real estate characteristics, but also by a greater influence and of the same intensity as the k e 1 , k e 2 , k i , k a 2 , by a lower influence from the k t and by an even less influence from the k a 1 .
In reality, this result confirms the evidence in the literature on submarkets, which highlight a greater influence of k i [73], or k e 1 , k e 2 [72,74,104], or k i ,   k e 1 , k e 2 [69,105].
The submarkets 2 is characterized not only by the higher values of the real estate characteristics, but also by an influence of equal intensity of all k e 1 ,   k e 2 , k i ,   k t ,   k a 1 ,   k a 2 .
The spatial analysis of C l u s t e r 1 and C l u s t e r 2 highlights, besides the location of the properties in the Picanello neighborhood, also their membership function to the submarkets, which is represented in Figure 15 by the size of the spheres.
This analysis highlights a concentration of the properties belonging to submarket 2 in the margin band of the neighborhood along via Duca degli Abruzzi to the east, via Messina to the south, behind at core of the ancient settlement of Ognina to the west and the presence of few properties in the inner area of the neighborhood.
The properties belonging to submarket 1 are mostly distributed throughout the perimeter and in the inner area of the neighborhood. In general, it is noted that the properties belonging to the two submarkets have homogeneous membership functions.
The fuzzy k-medoids clustring on the second dataset of properties characterized on the basis of the four types of price ( p r i c e / r o o m ,   p r i c e / s m ,   p r i c e / r o o m / k* ,   p r i c e / s m / k*) produced four groupings, two, three, four and five clusters, which identify, also in this case, fourteen potential real estate sub-markets (Appendix B).
The verification of the goodness of the classifications according to the three indices mentioned above, identified only in the first case a reasonable structure, while in all the other cases weak structures were identified.
Based on that, only the sub-markets which have been identified by C l u s t e r 1 and C l u s t e r 2 in two-cluster fuzzy clustering can be considered significant for the segmentation of the real estate market of Picanello.
In particular, in the two-cluster classification, the properties of the dataset are distributed between C l u s t e r 1 and C l u s t e r 2   in the following way:
( 3 , 4 , 5 , 6 , 7 , 8 , 9 , 11 , 13 , 19 , 22 , 24 , 25 , 26 , 29 , 30 , 34 , 36 , 40 , 41 , 42 , 43 , 45 , 46 , 48 , 49 , 51 , 59 , 60 , 63 , 65 , 67 , 70 , 71 , 74 , 75 , 80 ) C l u s t e r   1
  ( 1 , 2 , 10 , 12 , 14 , 15 , 16 , 17 , 18 , 20 , 21 , 23 , 27 , 28 , 31 , 32 , 33 , 35 , 37 , 38 , 39 , 44 , 47 , 50 , 52 , 53 , 54 , 55 , 57 , 58 , 61 , 62 , 64 , 66 , 68 , 69 , 72 , 73 , 76 , 77 , 78 , 79 , 81 ) C l u s t e r   2 The centroid of the first cluster is property 25 and that of the second cluster is property 26.
The submarket identified by C l u s t e r 1 , i.e., sub-market 1, contains the worst properties in terms of the four types of price, the second submarket identified by C l u s t e r 2 , i.e., sub-market 2, contains the best ones.
In fact, the real estate characteristics of C e n t r o i d 1 all have lower values, and those of C e n t r o i d 2 all have higher values than the average values of the corresponding characteristics in the dataset.
The submarkets 1 is characterized not only by the lower values for the four types of prices, but also by a greater and clearer influence of the   p r i c e / r o o m and p r i c e / r o o m / k*.
The spatial analysis also in this case highlights a concentration of the properties belonging to submarket 2 in the margin band of the neighborhood along the axis of via Duca degli Abruzzi to the east, via Messina to the south and west, Viale Ulisse and Viale Marco Polo to the north (Figure 16).
In this case, properties belonging to sub-market 2 are also located along the median axis of the neighborhood in the north-east and south-west direction.
The properties belonging to the submarkets 1 are present throughout the perimeter of the neighborhood except for the north-west section but are also present in its central area.
In this case, the properties belonging to two submarkets have more heterogeneous membership functions.
The fuzzy k-medoids clustering on the third dataset of properties characterized on the basis of the four types of price ( p r i c e / r o o m ,   p r i c e / s m ,   p r i c e / r o o m / k* ,   p r i c e / s m /   k*) and of the six real estate characteristics ( k e 1 ,   k e 2 , k i ,   k t ,   k a 1 ,   k a 2 ) produced four groupings, two, three, four and five clusters, which identifying fourteen potential real estate sub-markets.
In this case, the verification of the goodness of the classifications identified in all cases, weak structures.
The results of the analysis do not allow identification of sub-markets which can be significant for the dataset.
Even if the structures found are weak, we can still compare some results with those found in the two previous analyses:
  • The influence of the six real estate characteristics is not reconfirmed, result that it was highlighted in the analysis of the first data set;
  • A net influence is confirmed in the classification of the two real estate p r i c e / r o o m and p r i c e / r o o m / k , which reconfirms a data highlighted in the analysis of the second dataset.

4.3. Overall Results

The quantitative results of the housing market survey, and namely, the cluster analysis results, have been integrated within the general assessment model thus providing a complete, although not exhaustive, an overview of the issues that are usually assumed as the main drivers of urban fragility and resilience. Figure 17 provides a synopsis of the fragility-resilience indices of Picanello (ACE 12) compared to the other ACEs and Catania. The upper table provides a simplified dendrogram of the WBS within which the different indices have been framed, and the aggregated scores for the different ACEs, the radar graph below allows us to identify and measure weaknesses and strengths in terms of social-urban fragility. (See Table 3).

5. Discussion

The assessments carried out so far reveal different aspects of the fragility of Picanello concerning the different perspectives of human and urban capital. The former results significantly affected by (absolute, not relative) criticalities in the fields of education, lifestyle, labor market prospects. The latter presents specific urban-environmental (air quality, waste recycling) [106] and urban planning (public facilities and utilities) criticalities, aspects that Picanello shares with other urban areas. Nonetheless, if combined with the aspects of social fragility, the lack of the public sector can hinder the prospect of development and improvement of global standards of livability, participation and inclusion.
Aspects of resilience are found: As regards human capital, concerning education (which is expected to be higher in a neighborhood located in a strategic area, and including a valuable building heritage) and employment; as regard for urban capital, resilience is in the building heritage, symmetrically to the fragility of the urban-environmental heritage.
According to the synecdoche of fragility, also the real estate-scape adds further ambiguities to those related to the human-urban-scape. The synthetic indices reveal a sufficient quality level of the housings supply, but lower unit prices indices.
Another important index of the real estate capital asset, especially for the expectations of the development of a central area supported by concrete improvements in urban social capital, is the capitalization rate [107,108]. Its relative level is almost sufficient, which indicates a generalized propensity to deferral in the real estate investment field. This degree of confidence, still potential, can grow if the environmental-urban criticalities are reduced by means of constructive urban policies.
Final remarks concern the map of the housing, monetary and not monetary, values, as outlined by the fuzzy-medoid cluster analysis. A structure index was sought in the surveys carried out, which is slightly lower than the average, due to the strong heterogeneity of the building heritage of the area. Therefore, only a division into two clusters reaches a goodness equal to 1. This result can be interpreted in the light of the previous remarks concerning the reduced perception of a clearer spatial structure in which the preference system recognizes contexts with a higher urban identity, currently reduced in some areas by spread replacements of the original building stock.
Some limitations of the research concern the datasets resulting too aggregate in respect of such a heterogeneous neighborhood so that some specific characteristics have to be highlighted by means of the cluster analysis at the abstract level of the real estate housing market prices.

6. Conclusions

The global cognitive and operational context of project and urban planning integrates and coordinates multiple languages—each of which having its own rules and ambiguities. This assessment experiment is inspired by the idea of a structure of value and of a grammar of valuations, aimed at systematizing in a unitary pattern a set of findings having as “value attributes” the degree of fragility/resilience and as “value bearers” the urban and the human capital.
Social and territorial sciences commit to creating urban vulnerability and fragility maps for which statistics survey make available a complex fabric of indices. The Science of valuation contributes targeting this information support in the light of the concept of capital assumed in its broader and constructive meaning, of value stock accumulated in the enduring buildings and layered in the depth of the personal and social subjectivity [109,110,111,112,113].
Even if represented in numbers, indices and market prices, Picanello appears to have a social system at the same time unitary and internally contradictory, a microcosm of a metropolis, still pervaded by the feeling of inclusion, and animated by the mixture of diverse folks, whose imprinting research is inspired by the real estate-scape can better highlight.
In this specific field of research, real estate manifests the complex relationships between values (what is important and what do we actually mean with this importance) and prices (the economic-monetary abstraction and generalization of this importance).
With reference to the case of Picanello in Catania, the analysis carried out so far, identified some factors influencing the consistency and/or decaying of social capital; then they have been connected to the local housing market in as much as they are metabolized by the “economic communication” developing according to this particular economic, financial and monetary logic.
The findings confirm that a more marked presence of the public action and intentionality could trigger the virtuous circle of the recovery of a central area characterized by the contiguity to the valuable waterfront urban neighborhoods which Picanello cannot still benefit from.
The limitations concerning the difficult overlapping of the value-maps (as for social, economic and real estate issues) must be overcome. Then, the possibilities for further studies of this experiment will involve the extension of such a qualitative, quantitative and monetary description over the whole urban context in order to more strongly outlying the urban, human and real estate-scape of the city of Catania.

Author Contributions

Conceptualization, M.R.T. and S.G.; methodology, M.R.T. and S.G.; software, M.R.T. and S.G.; validation, M.R.T. and S.G.; formal analysis, M.R.T.; investigation, C.C.; resources, C.C.; data curation, M.R.T., C.C. and S.G.; writing—original draft preparation, M.R.T. and S.G.; writing—review and editing, M.R.T. and S.G.; visualization, M.R.T., C.C. and S.G.; supervision, M.R.T. and S.G.; project administration, M.R.T. and S.G. All authors have read and agreed to the published version of the manuscript. Please turn to the CRediT taxonomy for the term explanation. Authorship must be limited to those who have contributed substantially to the work reported.

Funding

This research received no external funding.

Acknowledgments

In this section you can acknowledge any support given which is not covered by the author contribution or funding sections. This may include administrative and technical support, or donations in kind (e.g., materials used for experiments).

Conflicts of Interest

The authors declare no conflict of interest.

Appendix A

Dendrogram of the social capital description according to the conceptual pattern based on human and urban capital.
  • Human capital
    1.1.
    Education
    1.1.1.
    Educational level by age
    1.1.1.1.
    % H.S. or University graduates
    1.1.1.2.
    % young graduates
    1.1.1.3.
    Educational level 15-19 years old
    1.1.1.4.
    % Grade 12 adults
    1.1.2.
    University
    1.1.2.1.
    Attraction index
    1.1.2.2.
    Allocation index
    1.1.2.3.
    Coexistence index
    1.1.3.
    General educational level
    1.1.3.1
    Higher education gender differences
    1.1.3.2.
    Adults in lifelong learning
    1.1.3.3.
    High/middle school graduates
    1.1.3.4.
    Illiterate incidence
    1.1.3.5.
    Education system abandonment
    1.2.
    Health
    1.2.1.
    Health general level
    1.2.1.1.
    Birth rate
    1.2.1.2.
    Life expectancy
    1.2.2.
    Mortality by age
    1.2.2.1.
    Infant mortality index
    1.2.2.2.
    Cancer mortality index
    1.2.2.3.
    Car-crash mortality index
    1.2.3.
    Access to care
    1.2.3.1.
    Hospitalization rate
    1.2.3.2.
    Customer satisfaction
    1.2.4.
    Lifestyle
    1.2.4.1.
    Obesity rate
    1.2.4.2.
    Physical inactivity rate
    1.3.
    Population
    1.3.1.
    Demographic territorial dynamics
    1.3.1.1.
    Resident population
    1.3.1.2.
    Demographic density
    1.3.2.
    Population structure
    1.3.2.1.
    % Residents under 6 years old
    1.3.2.2.
    % Residents over 74 years old
    1.3.2.3.
    Old age index
    1.3.2.4.
    Foreign residents index
    1.3.3.
    Families
    1.3.3.1.
    Average family size
    1.3.3.2.
    % Large families
    1.3.3.3.
    % Families with potential economic disease
    1.3.3.4.
    % Young people living home
    1.3.3.5.
    % Old people living alone
    1.3.3.6.
    % Young couples
    1.3.3.7.
    % Older couples
    1.4.
    Labor market
    1.4.1.
    People activity
    1.4.1.1.
    Labor market inclusion
    1.4.1.2.
    Young people inactive
    1.4.1.3.
    Young people active/inactive ratio
    1.4.2.
    Employment
    1.4.2.1.
    Employment rate
    1.4.2.2.
    Young people employment rate
    1.4.2.3.
    Employment turn over index
    1.4.2.4.
    Foreign employment ratio
    1.4.2.5.
    Specialized employment ratio
    1.4.3.
    Unemployment
    1.4.3.1.
    Unemployment rate
    1.4.3.2.
    Young unemployment rate
  • Urban capital
    2.1.
    Housing conditions and settlements
    2.1.1.
    Housing stock
    2.1.1.1.
    Owner-occupied housings incidence
    2.1.1.2.
    Average surface area of occupied housings
    2.1.1.3.
    Residential potential intended use in the urban centers
    2.1.1.4.
    Buildings in good condition incidence
    2.1.1.5.
    Buildings in bad state of maintenance incidence
    2.1.2.
    Housing conditions
    2.1.2.1.
    Surface area per inhabitant
    2.1.2.2.
    Underutilization index
    2.1.2.3.
    Concentration rate.
    2.1.2.4.
    Occupants/rooms ratio in the occupied housings
    2.2.
    Transportation system
    2.2.1.
    Mobility
    2.2.1.1.
    Daily mobility for studying and working
    2.2.1.2.
    Extra-municipality mobility for studying and working
    2.2.1.3.
    Job mobility
    2.2.1.4.
    Mobility for studying
    2.2.1.5.
    Private mobility
    2.2.1.6.
    Public mobility
    2.3.
    Urban Social system/Environment relationship
    2.3.1.
    Air quality
    2.3.1.1.
    PM 10 air concentration
    2.3.2.
    Urban waste
    2.3.2.1.
    Waste per capita
    2.3.2.2.
    Total municipal waste
    2.3.2.3.
    Waste recycling rate
    2.3.3.
    Town planning standards
    2.3.3.1.
    Public green per capita
    2.3.3.2.
    Public facilities per capita
    2.3.4.
    Urban real estate capital asset
    2.3.4.1.
    Average rate of property characteristics
    2.3.4.2.
    Unit and marginal price, per room and per sq.m
    2.3.4.3.
    Capitalization rate
    2.3.4.4.
    Real estate segment structure

Appendix B

Figure A1. The fourteen potential real estate submarkets of Picanello identifying based on fuzzy clustering of the second data.
Sustainability 12 05409 g0a1aSustainability 12 05409 g0a1b

References

  1. United Nations: Sustainable Development Goals. Available online: https://www.un.org/sustainabledevelopment/sustainable-development-goals/ (accessed on 28 January 2020).
  2. United Nations Department of Economic and Social Affairs (UN-DESA). World Urbanization Prospects; United Nations Department of Economic and Social Affairs: New York, NY, USA, 2014. [Google Scholar]
  3. United Nations Department of Economic and Social Affairs (UN-DESA). World Population Prospects; Key Findings and Advance Tables; United Nations Department of Economic and Social Affairs: New York, NY, USA, 2015. [Google Scholar]
  4. Giuffrida, S. City as Hope. Valuation Science and the Ethics of Capital. Green Energy and Technology; Springer: Berlin/Heidelberg, Germany, 2018; pp. 469–485. ISSN 1865-3529. [Google Scholar] [CrossRef]
  5. EC (European Commission). Social Protection Committee Indicators Sub-group EU Social Indicators—Europe 2020 Poverty and Social Exclusion Target. Available online: http://ec.europa.eu/social/main.jsp?catId=756&langId=en (accessed on 27 July 2017).
  6. National Institute of Statistics, 8milaCensus—ISTAT. Available online: www.ottomilacensus.istat.it (accessed on 13 May 2017).
  7. Giuffrida, S.; Trovato, M.R.; Circo, C.; Ventura, V.; Giuffrè, M.; Macca, V. Seismic Vulnerability and Old Towns. A Cost-Based Programming Model. Geosciences 2019, 9, 427. [Google Scholar] [CrossRef] [Green Version]
  8. Barreca, A.; Curto, R.; Rolando, D. Assessing Social and Territorial Vulnerability on Real Estate Submarkets. Buildings 2017, 7, 94. [Google Scholar] [CrossRef] [Green Version]
  9. Debenedetti, P.G.; Stillinger, F.H. Supercooled liquids and the glass transition”. Nature 2001, 410, 259–267. [Google Scholar] [CrossRef]
  10. Berthier, L.; Biroli, G.; Bouchaud, J.P.; Cipelletti, L.; van Saarloos, W. Dynamical Heterogeneities in Glasses, Colloids and Granular Media; Oxford University Press: New York, NY, USA, 2011; ISBN 978-0-19-969147-0. [Google Scholar]
  11. Luhmann, N. Soziale Systeme, Niklas Luhmann: Soziale Systeme. Grundriß einer allgemeinen Theorie, Frankfurt: Suhrkamp 1984. In Klassiker der Sozialwissenschaften; Springer VS: Wiesbaden, Germany, 2016; pp. 350–353. [Google Scholar]
  12. Rizzo, F. Valore e valutazioni. In La Scienza Dell’economia o L’economia della Scienza; FrancoAngeli: Milano, Italy, 1999. [Google Scholar]
  13. Giuffrida, S.; Gagliano, F.; Giannitrapani, E.; Marisca, C.; Napoli, G.; Trovato, M.R. Promoting Research and Landscape Experience in the Management of the Archaeological Networks. A Project-Valuation Experiment in Italy. Suistanibility 2020, 12, 4022. [Google Scholar] [CrossRef]
  14. Naselli, F.; Trovato, M.R.; Castello, G. An evaluation model for the actions in supporting of the environmental and landscaping rehabilitation of the Pasquasia’s site mining (EN). In Computational Science and Its Applications—ICCSA 2014, LNCS 8581; Murgante, B., Misra, S., Rocha, A.M.A.C., Torre, C.M.., Rocha, J.G., Falcão, M.I., Taniar, D., Apduhan, B.O., Gervasi, O., Eds.; Springer Nature Switzerland AG: Cham, Switzerland, 2014; Part III; pp. 26–41. [Google Scholar] [CrossRef]
  15. Trovato, M.R.; Giuffrida, S. The Monetary Measurement of Flood Damage and the Valuation of the Proactive Policies in Sicily. Geosciences 2018, 8, 141. [Google Scholar] [CrossRef] [Green Version]
  16. Swiny, A.; Georgiou, M.; Hadjichristou, Y. In/Out of Crisis, Emergent and Adaptive Cities. In Proceedings of the International Conference on Changing Cities II, Spatial, Design, Landscape & Socio-economic Dimensions, Thessaloniki, Greece, 22–26 June 2015; Volume 1, pp. 49–57, ISBN 978-960-6865-88-6. [Google Scholar]
  17. Giuffrida, S. A Fair City. Value, Time and the Cap Rate. Green Energy and Technology; Springer: Berlin/Heidelberg, Germany, 2018; pp. 425–439. ISSN 1865-3529. [Google Scholar] [CrossRef]
  18. Barreca, A.; Curto, R.; Rolando, D. Urban Vibrancy: An Emerging Factor that Spatially Influences the Real Estate Market. Sustainability 2020, 12, 346. [Google Scholar] [CrossRef] [Green Version]
  19. Prigogine, I.; Stangers, I. La Nouvelle Alliance; Métamorphose de la Science: Gallimard, Paris, 1979. [Google Scholar]
  20. Schrödinger, E. What Is Life? The Physical Aspect of the Living Cell—Mind and Matter; Cambridge University Press: Cambridge, UK, 1944. [Google Scholar]
  21. Giuffrida, S.; Trovato, M.R.; Falzone, M. The Information Value for Territorial and Economic Sustainability in the Enhancement of the Water Management Process. In ICCSA 2017; LNCS 10406; Borruso, G., Cuzzocrea, A., Apduhan, B.O., Rocha, A.M.A.C., Taniar, D., Misra, S., Gervasi, O., Torre, C.M., Stankova, E., Murgante, B., Eds.; Springer Nature Switzerland AG: Cham, Switzerland, 2017; Volume III, pp. 575–590. [Google Scholar] [CrossRef]
  22. Giuffrida, S.; Ventura, V.; Nocera, F.; Trovato, M.R.; Gagliano, F. Technological, Axiological and Praxeological Coordination in the Energy-Environmental Equalization of the Strategic Old Town Renovation Programs. In Values and Functions for Future Cities; Green Energy and Technology; Mondini, G., Oppio, A., Stanghellini, S., Bottero, M., Abastante, F., Eds.; Springer Nature Switzerland AG: Cham, Switzerland, 2020; pp. 425–446. [Google Scholar] [CrossRef]
  23. Tate, E. Uncertainty analysis for a social vulnerability index. Ann. Assoc. Am. Geogr. 2013, 103, 526–543. [Google Scholar] [CrossRef]
  24. Trovato, M.R.; Giuffrida, S. A DSS to Assess and Manage the Urban Performances in the Regeneration Plan: The Case Study of Pachino. In International Conference on Computational Science and Its Applications–ICCSA 2014- ICCSA 2014, LNCS 8581; Murgante, B., Misra, S., Rocha, A.M.A.C., Torre, C.M., Rocha, J.G., Falcão, M.I., Taniar, D., Apduhan, B.O., Gervasi, O., Eds.; Springer Nature Switzerland AG: Cham, Switzerland, 2014; Part III; pp. 224–239. [Google Scholar] [CrossRef]
  25. Trovato, M.R.; Giuffrida, S. The choice problem of the urban performances to support the Pachino’s redevelopment plan. IJBIDM 2014, 9, 330–355. [Google Scholar] [CrossRef]
  26. Chandler, D.; Coaffee, J. The Routledge Handbook of International Resilience; Routlege Handbook: Singapore, 2016. [Google Scholar]
  27. Brand, F.S.; Jax, K. Focusing the meaning(s) of resilience: Resilience as a descriptive concept and a boundary object. Ecol. Soc. 2007, 12, 23. [Google Scholar] [CrossRef] [Green Version]
  28. Khan, S. Vulnerability assessments and their planning implications: A case study of the Hutt Valley, New Zealand. Nat. Hazards 2012, 64, 1587–1607. [Google Scholar] [CrossRef]
  29. De Boer, J. The Fragile City: The Epicentre of Extreme Vulnerability. United Nation University Centre for Policy Research; United Nations University: Tokyo, Japan, 2017. [Google Scholar]
  30. Lebel, L.; Anderies, J.M.; Campbell, B.; Folke, C.; Hatfield-Dodds, S.; Hughes, T.P.; Wilson, J. Governance and the capacity to manage resilience in regional social-ecological systems. Ecol. Soc. 2006, 11, 19. [Google Scholar] [CrossRef] [Green Version]
  31. Boer, J.; Muggan, R.; Patel, R. Conceptualizing City Fragility and Resilience; Working Paper (5); United Nation University Centre for Policy Research: Tokyo, Japan, 2016. [Google Scholar]
  32. Van den Bosch, M.; Bird, W. (Eds.) Oxford Textbook of Nature and Public Health: The Role of Nature in Improving the Health of A Population; Oxford University Press: Oxford, UK, 2018. [Google Scholar] [CrossRef]
  33. Bahadur, A.V.; Ibrahim, M.; Tanner, T. The Resilience Renaissance? Unpacking of Resilience for Tackling Climate Change and Disasters. In Strengthening Climate Resilience Discussion Paper 1; IDS: Brighton, UK, 2010. [Google Scholar]
  34. Berkes, F. Understanding Uncertainty and Reducing Vulnerability: Lessons from Resilience Thinking. Nat. Hazards 2007, 41, 283–295. [Google Scholar] [CrossRef]
  35. Cutter, S.L.; Barnes, L.; Berry, M.; Burton, C.; Evans, E.; Tate, E.; Webb, J. A Place-based Model for Understanding Community Resilience to Natural Disasters. Glob. Environ. Chang. 2008, 18, 598–606. [Google Scholar] [CrossRef]
  36. Folke, C. Resilience: The Emergence of a Perspective for Social-Ecological Systems Analyses. Global Environ. Chang. 2006, 16, 253–267. [Google Scholar] [CrossRef]
  37. Cutter, S.L.; Barnes, L.; Berry, M.; Burton, C.G.; Evans, E.; Tate, E.C.; Webb., J. Community and Regional Resilience: Perspectives from Hazards, Disasters, and Emergency Management CARRI Research Report 1; Community and Regional Resilience Institute: Oak Ridge, TN, USA, 2008. [Google Scholar]
  38. Community and Regional Resilience: Perspectives from Hazards, Disasters, and Emergency Management. Available online: http://www.resilientus.org/library/FINAL_CUTTER_9-25-08_1223482309.pdf (accessed on 1 March 2020).
  39. Cutter, S.L.M.; Boruff, B.J.; Shirley, W.L. Social Vulnerability to Environmental Hazards. Soc. Sci. Q. 2003, 84, 242–261. [Google Scholar] [CrossRef]
  40. Cutter, S.L.; Burton, C.G.; Emrich, C.T. Disaster Resilience Indicators for Benchmarking Baseline Conditions. J. Homel. Secur. Emerg. Manag. 2010, 7. [Google Scholar] [CrossRef]
  41. Meerow, S.; Newell, J.P.; Stults, M. Defining urban resilience: A review. Landsc. Urban Plan. 2016, 147, 38–49. [Google Scholar] [CrossRef]
  42. Moraci, F.; Errigo, M.F.; Fazia, C.; Burgio, G.; Foresta, S. Making less vulnerable cities: Resilience as a new paradigm of smart planning. Sustainability 2018, 10, 755. [Google Scholar] [CrossRef] [Green Version]
  43. Miklos, M.; Paoliello, T. Fragile Cities: A Critical Perspective on the Repertoire for New Urban Humanitarian Interventions. Contexto Int. 2017, 39. [Google Scholar] [CrossRef] [Green Version]
  44. Corchia, L.; Partore, G. Povertà e Impoverimento: I Meccanismi Selettivi Della Vulnerabilità Sociale”, Università Segli Studi di Pisa; Dipartimento di Scienze Politiche e Sociali; LARISS: Pisa, Italy, 2011. [Google Scholar]
  45. Giuffrida, S.; Trovato, M.R. From the object to land. Architectural Design and Economic Valuation in the Multiple Dimensions of the Industrial Estates. In Computational Science and Its Applications–ICCSA 2017; LNCS 10406; Borruso, G., Cuzzocrea, A., Apduhan, B.O., Rocha, A.M.A.C., Taniar, D., Misra, S., Gervasi, O., Torre, C.M., Stankova, E., Murgante, B., Eds.; Springer Nature Switzerland AG: Cham, Switzerland, 2017; Volume III, pp. 591–606. [Google Scholar] [CrossRef]
  46. Trovato, M.R.; Nocera, F.; Giuffrida, S. Life-Cycle Assessment and Monetary Measurements for the Carbon Footprint Reduction of Public Buildings. Sustainability 2020, 12, 3460. [Google Scholar] [CrossRef] [Green Version]
  47. Trovato, M.R.; Giuffrida, S. The Protection of Territory in the Perspective of the Intergenerational Equity. In Seminar of the Italian Society of Property Evaluation and Investment Decision; Green Energy and Technology; Springer Nature: Cham, Switzerland, 2018; Volume Part F8, pp. 469–485. [Google Scholar] [CrossRef]
  48. Pagello, E. Architettura minore a Catania all’inizio del secolo: Un caso di studio Picanello; University of Catania: Catania, Italy, 1990. [Google Scholar]
  49. Keeney, R.L.; Raiffa, H. Decision with Multiple Objectives: Preferences and Values Tradeoffs; Wiley: New York, NY, USA, 1976. [Google Scholar]
  50. Trovato, M.R. A multi-criteria approach to support the retraining plan of the Biancavilla’s old town”. In Proceedings of the Smart Innovation, Systems and Technologies, 3rd International New Metropolitan Perspectives, Local Knowledge and Innovation Dynamics towards Territory Attractiveness through the Implementation of Horizon/Europe2020/Agenda2030, Reggio Calabria, Italy, 22–25 May 2018; Calabrò, F., Della Spina, L., Bevilacqua, C., Eds.; Springer Science and Business Media Deutschland GmbH: Cham, Switzerland, 2019; Volume 101, pp. 434–441. [Google Scholar] [CrossRef]
  51. Giuffrida, S.; Ferluga, G.; Valenti, A. Capitalisation rates and ‘real estate semantic chains’: An application of clustering analysis. IJBIDM 2015, 10, 174–198. [Google Scholar] [CrossRef]
  52. Giuffrida, S.; Valenti, A.; Linguanti, F. Decision trees analysis in a low tension real estate market: The case of Troina (Italy). In Computational Science and Its Applications—ICCSA 2015, LCNS 9157; Gervasi, O., Murgante, B., Misra, S., Gavrilova, M.L., Rocha, A.M.A.C., Torre, C.M., Taniar, D., Apduhan, B.O., Eds.; Springer Nature Switzerland AG: Cham, Switzerland, 2015; Volume III, pp. 237–252. [Google Scholar] [CrossRef]
  53. Fisher, E.M.; Fisher, R.M. Urban Real Estate; Henry Holt: New York, NY, USA, 1954. [Google Scholar]
  54. Rapkin, C.; Grigsby, W.G. Residential Renewal in the Urban Core; University of Pennsylvania Press: Philadelphia, PA, USA, 1960. [Google Scholar]
  55. Baer, W.C.; Williamson, C.B. The Filtering of Households and Housing Units. J. Plan. Lit. 1988, 3. [Google Scholar] [CrossRef]
  56. Lowry, I.S. Filtering and housing standards. Land Econ. 1960, 36, 362–370. [Google Scholar] [CrossRef]
  57. Myers, D. Housing allowances, housing submarkets and the filtering process. Urban Aff. Q. 1975, 11, 215–240. [Google Scholar] [CrossRef]
  58. Quigley, J.M. Housing market and demand. Urban Housing Market. In Recent Directions in Housing Research; Bourne, L., Hitchcok, J., Eds.; University of Toronto Press: Toronto, ON, Canada, 1978; p. 21. [Google Scholar]
  59. Quigley, J.M. What Have Learned about Urban Housing Market? In Current Issue in Urban Economics; Straszheim, M., Mieszkowski, P., Eds.; Johns Hopkins University Press: Baltimore, DM, USA, 1979; pp. 391–429. [Google Scholar]
  60. Maclennan, D. Housing Economics; An applied approach; Longman: London, UK, 1982. [Google Scholar]
  61. Straszheim, M.R. An Econometric Analysis of the Urban Housing Market; Columbia University Press: New York, NY, USA; London, UK, 1975. [Google Scholar]
  62. Galster, G.C. Homeowerns and Neighborhood Reinvestiment; Duke University Press: Durham, NC, USA, 1987. [Google Scholar]
  63. Schnare, A.; Struyk, R. Segmentation in urban housing markets. J. Urban Econ. 1976, 3, 146–166. [Google Scholar] [CrossRef]
  64. Ball, M.; Kirwan, R. Accessibility and supply constraints in the urban housing markets. Urban Stud. 1977, 14, 11–32. [Google Scholar] [CrossRef]
  65. Maclennan, D.; Tu, Y. The Efficient Market Framework and Real Estate Economics (mimeo); University of Glasgow: Glasgow, UK, 1987. [Google Scholar]
  66. Sonstelie, J.C.; Portney, P.R. Gross rent market values: Testing the implication of Tiebout’s hypothesis. J. Urban Econ. 1980, 7, 102–118. [Google Scholar] [CrossRef]
  67. Bourassa, S.C.; Hamelink, F.; Hoesli, M.; Macgregor, B.D. Defining housing submarkets. J. Hous. Econ. 1999, 8, 160–183. [Google Scholar] [CrossRef]
  68. Goodman, A.; Kawai, M. Estimation and policy implications of rental housing demand. J. Urban Econ. 1984, 16, 76–90. [Google Scholar] [CrossRef]
  69. Adair, A.S.; Berry, J.; Mc Greal, W.S. Hedonic modelling, housing submarkets and residential valuation. J. Prop. Res. 1996, 16, 67–83. [Google Scholar] [CrossRef]
  70. Munro, M. Testing for the Segmentation in the Price Housing Markets Glasgow; Centre of Housing Research, Discussion Paper, N. 8; University of Glasgow: Glasgow, UK, 1986. [Google Scholar]
  71. Palm, R. Spatial segmentation of the urban housing. Rev. Econ. Stat. 1978, 66, 394–404. [Google Scholar]
  72. Michaels, R.; Smith, V.K. Market segmentation and valuing amenities with hedonic model: The case of hazardous waste cities. J. Urban Econ. 1990, 28, 223–242. [Google Scholar] [CrossRef]
  73. Rapkin, C.; Winnick, L.; Blanck, D.M. Housing Market Analysis; US Housing and Home Finance Agency: Washington, DC, USA, 1953. [Google Scholar]
  74. Dale-Johnson, D. An alternative approach to housing market segmentation using hedonic price data. J. Urban Econ. 1982, 11, 311–332. [Google Scholar] [CrossRef]
  75. Grigsby, W. Housing Market and Public Policy; Philadelphia University of Pennsylvania Press: Philadelphia, PA, USA, 1963. [Google Scholar]
  76. Grisby, W.; Baratz, M.; Galster, G.; Maclemann, D. The Dynamics of Neighbourhood Change and Decline; Pergamon: Oxford, UK, 1987. [Google Scholar]
  77. Sweeney, J. A commodity hierarchy of the residential housing market. J. Law Econ. 1974, 28, 555–585. [Google Scholar]
  78. Sweeney, J. Quality Commodity, hierarchy model of the rental housing market. Econometria 1974, 42, 147–168. [Google Scholar] [CrossRef]
  79. Schall, L. Commodity chain system on the housing market. J. Urban Econ. 1981, 10, 141–163. [Google Scholar] [CrossRef]
  80. Braid, R. The short run comparative statics of a rental housing market. J. Urban Econ. 1981, 10, 280–310. [Google Scholar] [CrossRef]
  81. Butler, R.V. The Specification of Hedonic Indexes for Urban Housing. Land Econ. 1982, 58, 96–108. [Google Scholar] [CrossRef]
  82. Goodman, A. Housing market within urban area. J. Reg. Sci. 1981, 21, 175–186. [Google Scholar] [CrossRef]
  83. Allen, M.T.; Springer, T.M.; Waller, N.G. Implicit pricing across residential submarkets. J. Real Estate Financ. Econ. 1995, 11, 137–151. [Google Scholar] [CrossRef]
  84. Abraham, J.; Goetzmann, W.; Wachter, S. Homogeneous Groupings of Metropolitan Housing Markets. J. Hous. Econ. 1994, 3, 186–206. [Google Scholar] [CrossRef]
  85. Hoesli, M.; Lizieri, C.; MacGregor, B. The spatial dimensions of the investment performance of UK commercial property. Urban Stud. 1997, 34, 93–109. [Google Scholar] [CrossRef]
  86. Bourassa, S.C.; Hoesli, M.; Sun, J. What’s in a new? Environ. Plan. A 2004, 36, 1427–1450. [Google Scholar] [CrossRef]
  87. Napoli, G.; Giuffrida, S.; Trovato, M.R. Efficiency versus Fairness in the Management of Public Housing Assets in Palermo (Italy). Sustainability 2019, 11, 1190. [Google Scholar] [CrossRef] [Green Version]
  88. Giuffrida, S.; Ferluga, G.; Valenti., A. Clustering analysis in a complex real estate market: The case of Ortigia (Italy). In Computational Science and Its Applications—ICCSA 2014, LNCS 8581; Murgante, B., Misra, S., Rocha, A.M.A.C., Torre, C.M., Rocha, J.G., Falcão, M.I., Taniar, D., Apduhan, B.O., Gervasi, O., Eds.; Springer Nature Switzerland AG: Cham, Switzerland, 2014; Part III; pp. 106–121. [Google Scholar] [CrossRef]
  89. Basu, S.; Thibodeau, T.G. Analysis of Spatial Autocorrelation in House Prices. J. Real Estate Financ. Econ. 1998, 17, 61–85. [Google Scholar] [CrossRef]
  90. Pace, R.K.; Gilley, O.W. Using the Spatial Configuration of the Data to Improve Estimation. J. Real Estate Financ. Econ. 1997, 14, 333–340. [Google Scholar] [CrossRef]
  91. Goodman, A.; Thibodeau, T. The spatial proximity of metropolitan area housing submarkets. Real Estate Econ. 2007, 35, 209–232. [Google Scholar] [CrossRef]
  92. Bourassa, S.; Cantoni, E.; Hoesli, M. Predicting house prices with spatial dependence: A comparison of alternative methods. J. Real Estate Res. 2010, 32, 139–159. [Google Scholar]
  93. Kuntz, M.; Helbich, M. Geostatistical mapping of real estate prices: An empirical comparison of kriging and cokriging. Int. J. Geogr. Inf. Sci. 2014, 28, 1904–1921. [Google Scholar] [CrossRef]
  94. Hwang, S.; Thill, J.C. Delineating urban housing submarkets with fuzzy clustering. Environ. Plan. B Plan. Des. 2009, 36, 865–882. [Google Scholar] [CrossRef]
  95. Derudder, B.; Witlox, F.; Taylor, P.J.; Catalano, G. Pattern recognition in large geographical databases: Towards a detailed assessment of the world city network”. Int. J. Pattern Recognit. Artif. Intell. 2007, 21, 439–462. [Google Scholar] [CrossRef]
  96. Gabrielli, L.; Giuffrida, S.; Trovato, M.R. Gaps and Overlaps of Urban Housing Sub Market: A Fuzzy Clustering Approach. In Appraisal from Theory to Practice; Green Energy and Technology; Stanghellini, S., Morano, P., Bottero, M., Oppio, A., Eds.; Springer Nature Switzerland AG: Cham, Switzerland, 2017; pp. 203–219. ISBN 9783319496757. [Google Scholar] [CrossRef]
  97. Luo, T.T.; Gao, X.W. New Urban Development of Beijing’s Real Estate Development Level of the Fuzzy Clustering Analysis. In Proceedings of the ICAE 2011, International Conference on New Technology of Agricultural Engineering 5943848; IEEE Press: Hoboken, NJ, USA, 2011; pp. 500–504. [Google Scholar]
  98. Malinowski, A.; Piwowarczyk, M.; Telec, Z.; Trawiński, B.; Kempa, O.; Lasota, T. An approach to property valuation based on market segmentation with crisp and fuzzy clustering. In International Conference on Computational Collective Intelligence; Lecture Notes in Computer Science (including subseries Lecture Notes in Artificial Intelligence and Lecture Notes in Bioinformatics); Springer Nature: Cham, Switzerland, 2018; Volume 11055 LNAI, pp. 534–548. [Google Scholar]
  99. Zadeh, L.A. Fuzzy sets. Inf. Control 1965, 8, 338–353. [Google Scholar] [CrossRef] [Green Version]
  100. Gan, G.; Ma, C.; Wu, J. Data Clustering: Theory, Algorithms and Application; SIAM: Philadelphia, PA, USA, 2007. [Google Scholar]
  101. Gabrielli, L.; Giuffrida, S.; Trovato, M.R. From Surface to Core: A Multi-layer Approach for the Real Estate Market Analysis of a Central Area in Catania. In Computational Science and Its Applications—ICCSA 2015, LCNS 9157; Gervasi, O., Murgante, B., Misra, S., Gavrilova, M.L., Rocha, A.M.A.C., Torre, C.M., Taniar, D., Apduhan, B.O., Eds.; Springer Nature Switzerland AG: Cham, Switzerland, 2015; Volume III, pp. 284–300. [Google Scholar] [CrossRef]
  102. Gabrielli, L.; Giuffrida, S.; Trovato, M.R. Functions and Perspectives of Public Real Estate in the Urban Policies: The Sustainable Development Plan of Syracuse. In Computational Science and Its Applications--ICCSA 2016, LNCS 9789; Gervasi, O., Murgante, B., Misra, S., Rocha, A.M.A.C., Torre, C.M., Taniar, D., Apduhan, B.O., Stankova, E., Wang, S., Eds.; Springer Nature Switzerland AG: Cham, Switzerland, 2016; Volume IV, pp. 13–28. [Google Scholar] [CrossRef]
  103. Napoli, G.; Giuffrida, S.; Valenti, A. Forms and Functions of the Real Estate Market of Palermo (Italy). Science and Knowledge in the Cluster Analysis Approach. Science and Knowledge in the Cluster Analysis Approach. In Appraisal: From Theory to Practice; Stanghellini, S., Morano, P., Bottero, M., Oppio, A., Eds.; Green Energy and Technology; Springer Nature Switzerland AG: Cham, Switzerland, 2017; pp. 191–202. ISBN 9783319496757. [Google Scholar] [CrossRef]
  104. Goodman, A.C. Housing sub-markets within urban areas: Definition and evidence. J. Reg. Sci. 1981, 21, 175–185. [Google Scholar] [CrossRef]
  105. Watkins, C. The definition and identification on submarkets. Environ. Plan. A 2001, 33, 2235–2253. [Google Scholar] [CrossRef]
  106. Giuffrida, S.; Casamassima, G.; Trovato, M.R. Le norme EMAS-ISO nella valutazione della qualità del servizio idrico integrato. Aestimum 2017, 70, 109–134. [Google Scholar] [CrossRef]
  107. Napoli, G.; Giuffrida, S.; Trovato, M.R.; Valenti, A. Cap rate as the Interpretative Variable of the Urban Real Estate Capital Asset: A Comparison of Different Sub-Market Definitions in Palermo, Italy. Buildings 2017, 7, 80. [Google Scholar] [CrossRef] [Green Version]
  108. Giuffrida, S.; Ventura, V.; Trovato, M.R.; Napoli, G. Axiology of the historical city and the cap rate the case of the old town of Ragusa superior. Valori E Valutazioni 2017, 18, 41–55. [Google Scholar]
  109. Giuffrida, S.; Gagliano, F.; Nocera, F.; Trovato, M.R. Landscape assessment and Economic Accounting in wind farm Programming: Two Cases in Sicily. Land 2018, 7, 120. [Google Scholar] [CrossRef] [Green Version]
  110. Giannelli, A.; Giuffrida, S.; Trovato, M.R. Madrid Rio Park. Symbolic Values and Contingent Valuation. Valori E Valutazioni 2018, 21, 75–85. [Google Scholar]
  111. Giuffrida, S.; Trovato, M.R.; Giannelli, A. Semiotic-Sociological Textures of Landscape Values. Assessments in Urban-Coastal Areas. In Information and Communication Technologies in Modern Agricultural Development, Communications in Computer and Information Science; Salampasis, M., Bournaris, T., Eds.; Springer: Cham, Switzerland, 2019; Volume 953, pp. 35–50. [Google Scholar] [CrossRef]
  112. Giuffrida, S.; Trovato, M.R. A Semiotic Approach to the Landscape Accounting and Assessment. An Application to the Urban-Coastal Areas. In Proceedings of the 8th International Conference on Information and Communication Technologies in Agriculture, Food and Environment, HAICTA 2017, Crete Island, Greece, 21–24 September 2017; Volume 2030, pp. 696–708. [Google Scholar]
  113. Napoli, G.; Giuffrida, S.; Trovato, M.R. A Paradigm Interpreting the City and the Analytic Network Process for the Management of Urban Transformations. In Proceedings of the Smart Innovation, Systems and Technologies, 3rd International New Metropolitan Perspectives. Local Knowledge and Innovation dynamics towards territory attractiveness through the implementation of Horizon/Europe2020/Agenda2030, Reggio Calabria, Italy, 22–25 May 2018; Bevilacqua, C., Calabrò, F., Della Spina, L., Eds.; Springer Science and Business Media Deutschland GmbH: Cham, Switzerland, 2019; Volume 100, pp. 672–680. [Google Scholar] [CrossRef] [Green Version]
Figure 1. (a) Picanello neighborhood in the urban context of Catania; (b) The countryside area intended to the north-eastern urban development (our elaboration from [48]).
Sustainability 12 05409 g001
Figure 2. Picanello in the Piccinato Masterplan framework, 1964; the red area displays the prescription for a commercial and directional center (Source: Municipality of Catania, Italy, http://pcn.minambiente.it/viewer/, accessed on 15 January 2019).
Sustainability 12 05409 g002
Figure 3. Articulation of the municipality of Catania in circumscriptions, municipal areas, census divisions (ACEs, census areas).
Sustainability 12 05409 g003
Figure 4. (a) Buildings floors map (source: National Geoportal http://www.pcn.minambiente.it/viewer/; (b) population density over all the urban ACEs; (c) comparison of the demographic density in the different ACEs: y-axis inhabitants/sq.km (Our elaboration on National Institute of Statistics).
Sustainability 12 05409 g004
Figure 5. (a) Original housing typological patterns [48]; (b) original existing housing; (c) contemporary buildings and public facilities in redeveloped urban areas [48].
Sustainability 12 05409 g005
Figure 6. Flow chart of the methodological approach. MAUT, Multiple Attribute Utility Theory.
Sustainability 12 05409 g006
Figure 7. (a) Utility functions for some significant fragility/resilience indices of human capital. The red dot represents the value of the index and the score for Picanello. On the abscissa the indicator (titles of the graphs), on the ordinate the normalized score. (b) Utility functions for some significant fragility/resilience indices of urban capital. The red dot represents the value of the index and the score for Picanello. On the abscissa the indicator (titles of the graphs), on the ordinate the normalized score. Each of the six last graphs reports two indicators, and consequently, two dots.
Sustainability 12 05409 g007aSustainability 12 05409 g007b
Figure 8. Housing market survey sample: (a) Over the city; (b) over the neighborhood.
Sustainability 12 05409 g008
Figure 9. Picanello housing market price/value relationships: (a) Unit prices per room; (b) unit prices per sq.m; the dimensions of the bubbles refer to the size of the properties surveyed.
Sustainability 12 05409 g009
Figure 10. Picanello housing market price/value relationships: (a) Unit marginal prices per room; (b) unit marginal prices per sq.m; the dimensions of the bubbles refer to the size of the properties surveyed.
Sustainability 12 05409 g010
Figure 11. Comparison between the housing market unit prices in Picanello and in the other urban areas.
Sustainability 12 05409 g011
Figure 12. Comparison between the housing market unit marginal prices in Picanello and in the other urban areas.
Sustainability 12 05409 g012
Figure 13. The fourteen potential real estate submarkets of Picanello identifying based on fuzzy clustering of the first dataset.
Sustainability 12 05409 g013aSustainability 12 05409 g013b
Figure 14. Comparison between the potential real estate submarkets of Picanello based on the fuzzy clustering in two clusters, three clusters, four clusters, and five clusters.
Sustainability 12 05409 g014
Figure 15. Spatial analysis of the sub-markets 1 and 2 for the first dataset. The size of the bubbles measures the membership degree of the element.
Sustainability 12 05409 g015
Figure 16. Spatial analysis of the submarkets 1 and 2 for the second dataset. The size of the bubbles measures the membership degree of the element.
Sustainability 12 05409 g016
Figure 17. The overall comparative assessment of the different ACEs at the level of the aggregated fragility/resilience factors. The neighborhood of Picanello is in red, and Catania is in light blue.
Sustainability 12 05409 g017
Table 1. General representation of a multicriteria ranking problem.
Weights
λ 1 λ 2 λ j λ m
CriteriaOverall Assessments
Actions x 1 x 2 x j x m
a 1 k 11 k 12 k 1 j k 1 m V 1
a 2 k 21 k 22 k 2 j k 2 m V 2
a i k i 1 k i 2 k i j k i m V i
a n k n 1 k n 2 k n j k n m V n
Table 2. General framework of dendrogram rooting to the two dimensions of social capital.
Human CapitalEducationEducational Level by Age
University
General Educational Level
HealthHealth General Level
Mortality by Age
Lifestyle
PopulationDemographic Territorial Dynamics
Population Structure
Families
Labor Market
Employment
Unemployment
Urban CapitalHousing Conditions and SettlementsHousing Stock
Housing Conditions
InfrastructuresMobility
Social System/Environment RelationshipAir Quality
Urban Waste
Town Planning Standards
Urban Real Estate Capital AssetCharacteristics
Prices
Capitalization Rates
Sub-Market Structure
Table 3. Comparison of the 12 ACEs and the city of Catania at the level of the aggregated fragility/resilience factors.
Criteria ACEs
01020304050607080910111213141516171819Catania
Human capitalEducationEduc. level by age0.651.591.601.381.071.390.941.140.710.781.161.290.861.171.631.650.720.991.291.12
University0.190.580.630.560.490.500.390.440.280.310.440.450.360.500.590.560.320.320.560.42
General educ. level0.110.300.440.320.140.450.450.360.060.150.160.490.350.280.520.600.000.170.280.18
HealthHealth general level0.241.151.241.050.790.950.600.800.310.460.780.860.570.791.201.160.360.561.050.68
Mortality by age0.360.981.040.920.770.820.580.740.420.530.750.750.590.740.990.940.470.580.940.61
Life style0.330.660.700.670.590.550.410.490.350.400.550.490.430.570.640.600.380.420.680.46
PopulationDemogr. territorial dyn.1.281.121.690.310.670.970.841.600.890.350.631.951.310.621.161.591.071.700.930.39
Population structure1.550.850.921.051.120.730.900.671.111.031.120.761.051.250.670.491.171.221.261.18
Families0.920.880.821.141.251.011.030.961.151.081.010.851.001.160.890.941.150.760.900.99
Labour market0.001.341.811.241.660.681.230.501.170.471.000.400.622.000.960.331.810.501.761.08
Employment0.001.601.691.441.181.290.711.090.260.510.931.150.721.181.551.560.340.541.410.87
Unemployment0.001.772.001.561.001.200.491.000.080.411.150.990.500.801.881.620.230.681.690.35
Urban capital Housing conditions and settlementsHousing stock0.070.821.210.830.610.781.360.921.031.181.240.900.791.550.931.071.380.800.731.08
Housing conditions0.001.922.001.320.911.130.641.000.110.311.111.310.401.001.811.840.330.831.631.09
InfrastructuresMobility1.151.021.271.191.210.701.030.891.191.150.560.941.000.670.830.781.050.981.181.07
Social system/ Environment relationshipAir quality1.001.701.001.801.200.900.601.001.200.800.700.801.101.800.700.701.101.201.201.08
Urban waste0.001.402.000.000.000.000.000.000.000.000.000.000.000.000.002.000.000.000.300.08
Town plann. standards0.070.380.440.300.220.270.310.280.190.220.360.290.220.320.370.360.230.230.270.30
Urban real estate capital assetCharacteristics0.611.431.591.440.981.101.601.140.610.971.521.001.141.101.291.090.611.080.821.12
Prices0.141.061.130.430.400.670.540.660.740.441.090.730.660.671.060.930.740.350.370.73
Capitalization rates0.381.191.370.990.780.830.980.880.700.771.050.930.760.951.121.080.780.770.900.97
Sub-market Structure0.311.011.120.790.600.710.860.730.560.601.000.730.700.740.950.850.590.610.570.74

